investor presentation · company undertakes no obligation to update publicly any forward-looking...
TRANSCRIPT

Investor PresentationFebruary 2020

These slides and the accompanying oral presentation contain forward-looking statements. All statements other than statements of historical facts contained in these slides and the accompanying oral presentation, including statements regarding Yelp Inc.’s (“Yelp” or the “Company”) future operations, future performance, expected financial results and future financial position, future revenue and revenue growth rates, future share repurchase activity, strategic and investment priorities, long-term financial targets and target margins, projected growth, expenses and savings, trends, opportunities, prospects, estimates and plans and objectives of management are forward-looking statements. In some cases, you can identify forward-looking statements by terms such as “believe,” “may,” “will,” “estimate,” “forecast,” “guidance,” “continue,” “anticipate,” “intend,” “could,” “would,” “project,” “plan,” “potential,” “target,” “opportunity,” ”model,” “expect” or the negative or plural of these words or similar expressions. The Company has based these forward-looking statements largely on its estimates of its financial results and its current expectations and projections about future events and financial trends that it believes may affect its financial condition, results of operations, business strategy, short-term and long-term business operations and objectives and financial needs.
These forward looking statements are subject to a number of risks, uncertainties and assumptions, including the fact that we have a limited operating history in an evolving and competitive industry; that our growth rate may not be sustainable; that we rely on traffic to our website from search engines like Google and Bing; our ability to generate sufficient revenue to maintain and increase profitability, particularly in light of our significant ongoing sales and marketing expenses; our ability to reduce or control expenses sufficiently to meet our profitability targets; our ability to introduce successful new products, services and partnerships; our ability to maintain and expand our base of advertisers, including enterprise customers, particularly as an increasing portion of advertisers have the ability to cancel their ad campaigns at any time; our ability to attract, retain and motivate well-qualified employees, particularly in sales and marketing; our ability to increase traffic to our platform and generate and maintain sufficient high quality content from our users; our ability to maintain a strong brand and manage negative publicity that may arise; our ability to manage acquisitions of new businesses, solutions and technologies and to integrate and monetize those businesses, solutions or technologies; the efficacy of our automated recommendation software; our ability to develop our communities effectively; our ability to deal with an increasingly competitive local search environment; our ability to timely upgrade and develop our systems and infrastructure; and changes in political, business and economic conditions. These risks and uncertainties may also include those described in the Company's most recent Form 10-Q or 10-K filed with the Securities and Exchange Commission.
New risks emerge from time to time. It is not possible for Company management to predict all risks, nor can the Company assess the impact of all factors on its business or the extent to which any factor, or combination of factors, may cause actual results to differ materially from those contained in any forward-looking statements the Company may make. In light of these risks, uncertainties and assumptions, the forward-looking events and circumstances discussed in these slides and the accompanying oral presentation may not occur and actual results could differ materially and adversely from those anticipated or implied in the forward-looking statements. You should not rely upon forward-looking statements as predictions of future events. Although the Company believes that the expectations reflected in the forward-looking statements are reasonable, the Company cannot guarantee that the future results, levels of activity, performance or events and circumstances reflected in the forward-looking statements will be achieved or occur. Moreover, neither the Company nor any other person assumes responsibility for the accuracy and completeness of the forward-looking statements. Any forward-looking statement speaks only as of its date. Except as required by law, the Company undertakes no obligation to update publicly any forward-looking statements for any reason after the date of this presentation, to conform these statements to actual results or to changes in the Company’s expectations.
1
Safe Harbor: Forward-Looking Statements

Key investment highlights
Increasing profitability
Targeting 30-35% Adjusted EBITDA
margin target by 2023
Prudent capital allocation
Authorized nearly$1 billion in stock
repurchases since 2017
Strong governance
Refreshed board and strengthened focus on
performance
Accelerating growth
Targeting mid-teens revenue
CAGR for 2019-2023
2

About Yelp

ConsumersTrust
DiscoveryConvenience
Our guiding mission:
Jeff’s Construction
Local bizConsumer trust
VisibilityHigh-intent leads
Local BizConsumer trust
VisibilityHigh-intent
leads
Kitchen remodel
a kitchen remodel?
Strategy Capital Allocation Governance Financial ResultsMarket OpportunityAbout Yelp 4
162

Active claimed local business locations1
4.9 million
Paying advertising locations3
565,000
Local Business
Cumulative reviews1205 million
Unique visitors on desktop and mobile2
96 million
Consumers
The trusted resource in Local
1As of December 31, 2019 2ComScore TTM monthly average, October 2019 3Monthly average for Q4 2019
Strategy Capital Allocation Governance Financial ResultsMarket OpportunityAbout Yelp 5

Restaurants, Cafes, Nightlife
Services(Home, Local, Auto,
Professional & Other)
Yelp is all things local
Hotels, Travel, Other
Shopping Health & Beauty
Strategy Capital Allocation Governance Financial ResultsMarket OpportunityAbout Yelp 6

Restaurants, Cafes, Nightlife
Services(Home, Local, Auto,
Professional & Other)
Our breadth is an advantage
Strategy Capital Allocation Governance Financial ResultsMarket OpportunityAbout Yelp 7
Note: Page views and Advertising revenue by category FY19
Hotels, Travel, Other
Shopping Health & Beauty

Market Opportunity

Market Opportunity Large & growing local advertising market
Large and growing market
40%
Digital Media
$63
$90
$71
$90 $88
$78 $86 $94
$88 $86
2019 2020E 2021E 2022E 2023E
‘19-’23E CAGR: 10%
Digital Media
Traditional Media
Source: BIA Advisory Services, 2020 U.S. Local Advertising Forecast
Restaurants Services
Multi-location Digital
$8
$27$28
SMB Digital
Other
Source: BIA Advisory Services, 2020 U.S. Local Advertising Forecast; Yelp internal data
Strategy Capital Allocation Governance Financial ResultsMarket OpportunityAbout Yelp 9

*Includes Calls, Request A Quote requests and Url clicks
In 2019, we monetized less than 10% of those leads
Maintaining our large volume of consumer leads
Attracting advertisers with compelling ad solutions
Retaining customers by delivering them more leads
Strategy Capital Allocation Governance Financial ResultsMarket OpportunityAbout Yelp 10
Monetized leads
Big monetization opportunity

Accelerating revenue growth
Strategy

Enhance consumer experience
Drive more value to business customers
Expand offerings
Capture Multi-location opportunity
Win in key categoriesRestaurants Services
Target 2019 - 2023 revenue CAGR
Drive growth across SMB and Multi-location customers
Note: SMB = Local Rep Sold + Local Self Serve
Mid-teens %
Strategy Capital Allocation Governance Financial ResultsMarket OpportunityAbout Yelp 12
Mid-teens long-term revenue CAGR target

Enhance consumer experience
Trusted, high-quality reviews
Personalized suggestions and experiences
Only-on-Yelp features
Strategy Capital Allocation Governance Financial ResultsMarket OpportunityAbout Yelp 13

Yelp Reservations
Yelp Waitlist
Personalized recommendations
Strategy Capital Allocation Governance Financial ResultsMarket OpportunityAbout Yelp 14
Win in keycategories

Delivering more high-intent leads
More ways to spotlight advertisers
Improved job matching
Strategy Capital Allocation Governance Financial ResultsMarket OpportunityAbout Yelp 15
Win in keycategories

More ad clicks at lower prices
Improved lead matching
Advancing reporting
Strategy Capital Allocation Governance Financial ResultsMarket OpportunityAbout Yelp 16
Drive more value to business customers

Expand offerings
Right product, right price
Packaging to solve needs
Serving businesses of all sizes
Strategy Capital Allocation Governance Financial ResultsMarket OpportunityAbout Yelp 17

Effective new ad formats
Strong returns for advertisers
Expanding into a broad range of categories
Strategy Capital Allocation Governance Financial ResultsMarket OpportunityAbout Yelp 18
Capture Multi-location opportunity
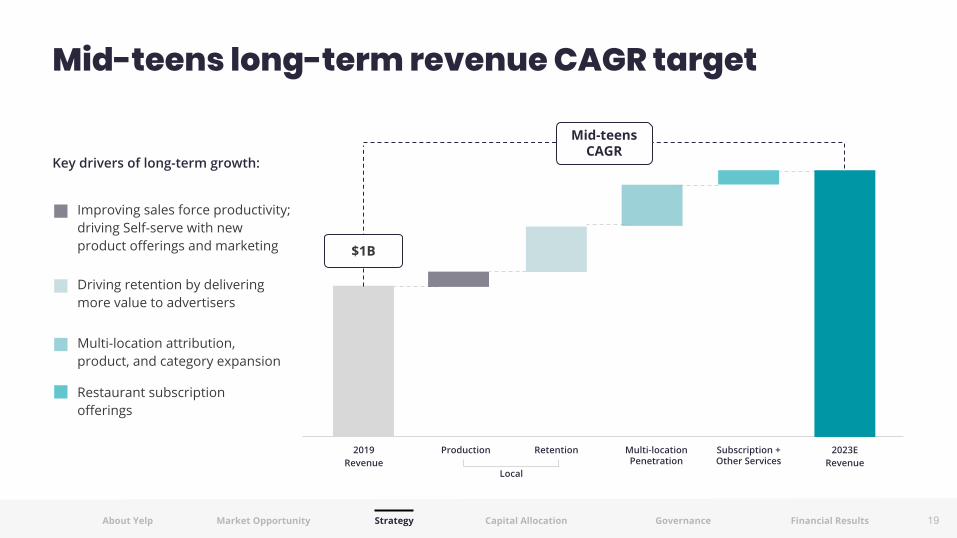
Mid-teens CAGR
$1B
Improving sales force productivity; driving Self-serve with new product offerings and marketing
Driving retention by delivering more value to advertisers
Multi-location attribution, product, and category expansion
Restaurant subscription offerings
Strategy Capital Allocation Governance Financial ResultsMarket OpportunityAbout Yelp 19
Mid-teens long-term revenue CAGR target

Increasing profitability
Strategy

30-35%
21%Growing in accretive channels: Multi-location & Self-serve
Driving retention by delivering more value to advertisers
Optimizing cost structure
Generating Self-serve customer acquisition via marketing
Strategy Capital Allocation Governance Financial ResultsMarket OpportunityAbout Yelp 21
30-35% Adjusted EBITDA margin target
Net Income for FY 2019 was $41 million. Adjusted EBITDA margin calculated as Adjusted EBITDA divided by Net revenue. See Appendix for how we define Adjusted EBITDA and a reconciliation of Adjusted EBITDA to Net income (loss).
1

1Calculated in accordance with GAAP, including stock-based compensation expense2See Appendix for reconciliation to GAAP Net income (loss) for the periods presented and for information about the limitations of adjusted EBITDA as an analytical tool
Revenue CAGR
Expenses as % of revenue1
2013-2018
32%
6-9%
51-57%
16-23%
13-18%
~5%
13-19%Adjusted EBITDA Margin2
Cost of revenue
Sales & marketing
Product development
G&A
D&A
Long-term target
Mid-teens %
~6%
36-40%
20-22%
10-11%
~4%
30-35%
8%
6%
49%
23%
13%
5%
21%
2019
Long-term financial targets
Strategy Capital Allocation Governance Financial ResultsMarket OpportunityAbout Yelp 22

Prudent Capital Allocation

AuthorizedJuly 2017
Total repurchase authorization
Authorized November 2018
AuthorizedFebruary 2019
AuthorizedJanuary 2020
$200M
$250M
$250M
$950M
Completed as of December 31, 2019
Remaining Authorization
$250M
Strategy Capital Allocation Governance Financial ResultsMarket OpportunityAbout Yelp 24
Robust multi-year capital return program

Strong Governance
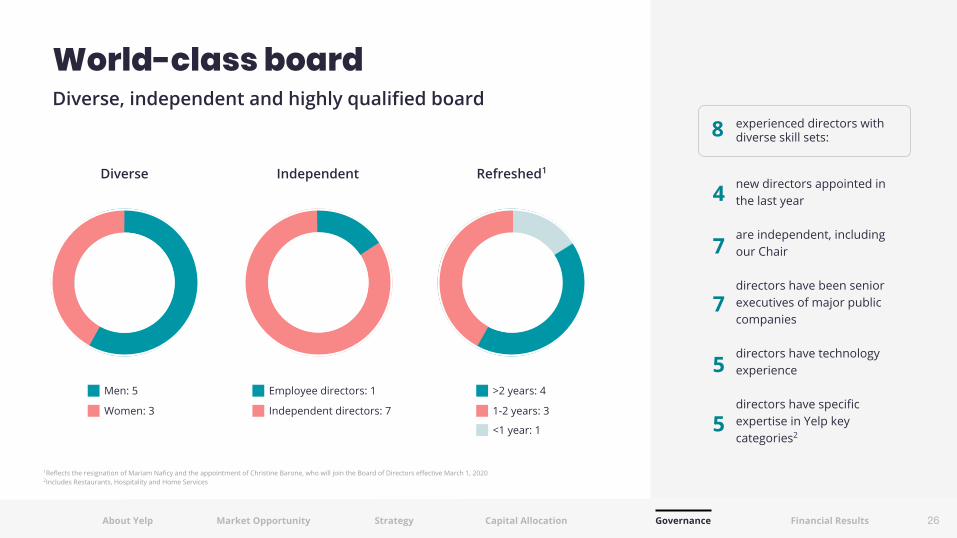
Men: 5
Women: 3
Employee directors: 1
Independent directors: 7
>2 years: 4
1-2 years: 3
<1 year: 1
Strategy Capital Allocation Governance Financial ResultsMarket OpportunityAbout Yelp 26
World-class board
1Reflects the resignation of Mariam Naficy and the appointment of Christine Barone, who will join the Board of Directors effective March 1, 20202Includes Restaurants, Hospitality and Home Services
new directors appointed in the last year
are independent, including our Chair
directors have been senior executives of major public companies
directors have technology experience
directors have specific expertise in Yelp key categories2
experienced directors with diverse skill sets:8
4
7
7
5
5

Strategy Capital Allocation Financial ResultsMarket OpportunityAbout Yelp 27
2016
2017
2018 2020Collapsed dual-class share structure
Initiated stock buyback program
Transitioned to net share withholding to reduce dilution
Added new independent director
2019Added three new independent directors
Introducedperformance-based stock grants for executive compensation
Adopted majority vote standard for director elections
Strong governance
Governance
Adopted stock ownership guidelines
Adopted director resignation policy

Financial Results
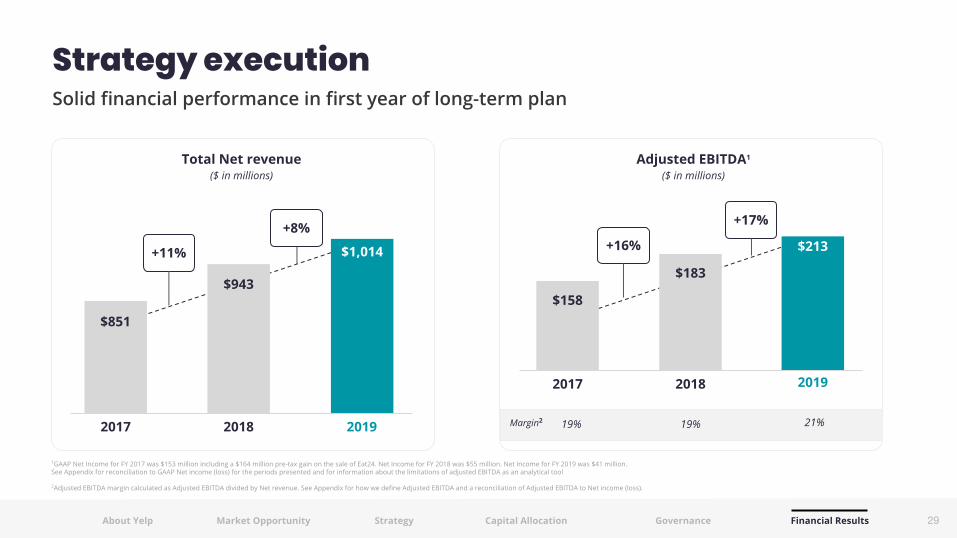
2017 2018 2019
2017 2018 2019
Margin2 19% 19% 21%
+11%
+8%
Total Net revenue ($ in millions)
Adjusted EBITDA1
($ in millions)
$851
$943
$1,014
$158
$183
$213+16%
+17%
1GAAP Net Income for FY 2017 was $153 million including a $164 million pre-tax gain on the sale of Eat24. Net Income for FY 2018 was $55 million. Net Income for FY 2019 was $41 million.See Appendix for reconciliation to GAAP Net income (loss) for the periods presented and for information about the limitations of adjusted EBITDA as an analytical tool
2Adjusted EBITDA margin calculated as Adjusted EBITDA divided by Net revenue. See Appendix for how we define Adjusted EBITDA and a reconciliation of Adjusted EBITDA to Net income (loss).
Strategy Capital Allocation Governance Financial ResultsMarket OpportunityAbout Yelp 29
Strategy execution

2017 2018 2019
$137
$115
$167
Strategy Capital Allocation Governance Financial ResultsMarket OpportunityAbout Yelp 30
Free Cash Flow1
($ in millions)
1Net cash provided by operating activities for FY 2017 was $167.6 million. Net cash provided by operating activities for FY 2018 was $160.2 million. Net cash provided by operating activities for FY 2019 was $204.8 million.See Appendix for how we define Free cash flow, a reconciliation of Free cash flow to Net cash provided by (used in) operating activities, and information about the limitations of Free cash flow as an analytical tool
Strong cash flow generation

Appendix

($ in millions) 2013 2014 2015 2016 2017 2018 2019
Net Income / (Loss) ($10.1) $36.5 ($32.9) ($1.7) $153.0 $55.4 $40.9
+ Tax & Other Income 1.2 (25.4) 11.6 (0.3) 26.6 (29.5) (5.4)
+ Depreciation & Amortization 11.5 17.6 29.6 35.3 41.2 42.8 49.4
+ Stock Based Compensation 26.1 42.3 60.8 86.3 100.4 114.4 121.5
- Gain on Disposal of a Business Unit 0.0 0.0 0.0 0.0 (163.7) 0.0 0.0
+ Restructuring & Integration 0.7 0.0 0.0 3.5 0.3 0.0 0.0
+ Fees Related to Shareholder Activism 0.0 0.0 0.0 0.0 0.0 0.0 7.1
Adjusted EBITDA $29.4 $70.9 $69.1 $123.0 $157.8 $183.1 $213.5
/ Net Revenue $233.0 $377.5 $549.7 $716.1 $850.8 $942.8 $1,014.2
AdjustedEBITDA Margin 12.6% 18.8% 12.6% 17.2% 18.5% 19.4% 21.1%
Adjusted EBITDA reconciliation
We define Adjusted EBITDA as Net income, adjusted to exclude: provision for (benefit from) income taxes; other income, net; depreciation and amortization; stock-based compensation expense; and, in certain periods, certain other income and expense items.
This presentation includes Adjusted EBITDA and Adjusted EBITDA margin, non-GAAP financial measures that Yelp uses to evaluate its business. Yelp includes Adjusted EBITDA because it is a key measure used by Yelp’s management and board of directors to understand and evaluate core operating performance and trends, to prepare and approve its annual budget and to develop short- and long-term operational plans. In particular, the exclusion of certain expenses in calculating Adjusted EBITDA can provide a useful measure for period-to-period comparisons of Yelp’s core business. Accordingly, Yelp believes that Adjusted EBITDA provides useful information to investors and others in understanding and evaluating Yelp’s operating results in the same manner as its management and board of directors. Adjusted EBITDA has limitations as an analytical tool, and you should not consider it in isolation or as a substitute for analysis of Yelp’s results as reported under GAAP. You can read more about the limitations of Adjusted EBITDA, as well as the basis of presentation of the numbers in the table above, in Yelp’s most recent Annual Report on Form 10-K or Quarterly Report on Form 10-Q at www.yelp-ir.com or the SEC’s website at www.sec.gov. Because of these limitations, you should consider Adjusted EBITDA alongside other financial performance measures, including various cash flow metrics, Net income (loss) and Yelp’s other GAAP results.
1 Amounts have not been recast in accordance with Accounting Standards Update 2014-09, "Revenue from Contracts with Customers (ASC 606)."
11 1
32

Free cash flow reconciliation
($ in millions) 2017 2018 2019
Net cash provided by operating activities $167.6 $160.2 $204.8
- Purchases of property, equipment and software (30.2) (45.0) (37.5)
Free Cash Flow $137.4 $ 115.2 $167.3
Net cash provided by (used in) investing activities $81.1 $ (164.4) $124.3
Net cash provided by (used in) financing activities $27.2 $ (207.7) $ (491.5)
33
We define Free cash flow as Net cash provided by operating activities, reduced by purchases of property and equipment that are included in cash flows used in investing activities.
This presentation includes Free cash flow, a non-GAAP financial measure that Yelp uses to evaluate its business. Yelp includes Free cash flow because it is a key measure used by Yelp’s management and board of directors to understand and evaluate how much cash from operations we have available for discretionary and non-discretionary items after the deduction of capital expenditures. Accordingly, Yelp believes that Free cash flow provides useful information to investors and others in understanding and evaluating Yelp’s operating results in the same manner as its management and board of directors. Free cash flow has limitations as an analytical tool, including that Free cash flow does not represent the total residual cash flow available for discretionary purposes and does not reflect our future contractual commitments, and you should not consider it in isolation or as a substitute for analysis of Yelp’s results as reported under GAAP. Because of these limitations, you should consider Free cash flow alongside other financial performance measures, including various cash flow metrics, Net income (loss) and Yelp’s other GAAP results. You can read more about the basis of presentation of the numbers in the table above, in Yelp’s most recent Annual Report on Form 10-K or Quarterly Report on Form 10-Q at www.yelp-ir.com or the SEC’s website at www.sec.gov.