investor presentation january 2017 · market capitalisation (invest bank) adx banking sector index...
TRANSCRIPT

Investor Presentation For the year ended 31 December 2016
26 March 2017

Dec 16 Dec-15 Variance
(%)
Cash and dep. with banks 2,426 2,169 12% Investment securities 706 803 -12% Loans and advances 11,953 10,901 10% Other assets 1,040 1,034 1% Total assets 16,125 14,907 8% Deposit from customers 12,177 11,331 7% Due to banks & other liabilities 987 752 31% Equity 2,961 2,824 5% Total liabilities & equity 16,125 14,907 8% Contingent liabilities 7,986 8,299 -4%
Invest bank - Consolidated statement of financial position As at 31 December 2016 All fig. in AED million
15% 15%
4% 5%
74% 73%
6% 7%
Dec-16 Dec-15
Assets composition
Other Assets
Loans and advances
Investment securities
Cash and dep. with banks
76% 76%
6% 5%
18% 19%
Dec-16 Dec-15
Liabilities & equity composition
Equity
Due to banks & other Liabilities
Deposit from customers
•Total assets posted an increase of 8% against 2015 as loans and advances increased significantly by 10%.
• Increase in assets was mainly funded from increase in deposits from customers.
•Represent balance of Letter of Credits AED 989M (2015: 1,123M); 12% decline and Letter of guarantees AED 6,997M (2015: 7,175M); 2.5% decline.
Page 1

-
2,000
4,000
6,000
8,000
10,000
12,000
2012 2013 2014 2015 2016
8,1
41
8,7
64
9,8
56
10
,90
1
11
,95
3
Loans and advances
Invest bank Financial performance – Balance Sheet All fig. in AED Million
-
4,000
8,000
12,000
16,000
2012 2013 2014 2015 2016
11
,41
0
12
,29
9
13
,83
0
14
,90
7
16
,12
5
Total assets
-
500
1,000
1,500
2,000
2,500
3,000
2012 2013 2014 2015 2016
2,3
47
2,5
96
2,7
84
2,8
24
2,9
61
Equity
-
3,000
6,000
9,000
12,000
2012 2013 2014 2015 2016
8,5
19
9,0
08
10
,19
4
11
,33
1
12
,17
7
Customer deposits
Page 2
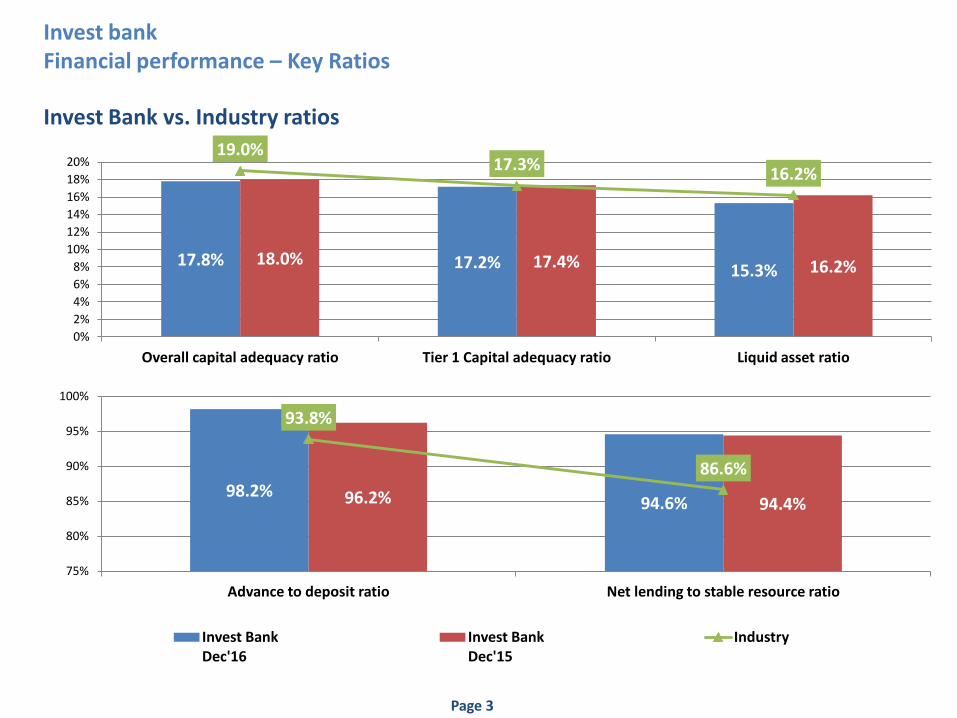
Invest bank Financial performance – Key Ratios
Invest Bank vs. Industry ratios
Page 3
17.8% 17.2% 15.3% 18.0% 17.4% 16.2%
19.0% 17.3%
16.2%
0%
2%
4%
6%
8%
10%
12%
14%
16%
18%
20%
Overall capital adequacy ratio Tier 1 Capital adequacy ratio Liquid asset ratio
98.2% 94.6% 96.2% 94.4%
93.8%
86.6%
75%
80%
85%
90%
95%
100%
Advance to deposit ratio Net lending to stable resource ratio
Invest Bank Dec'16
Invest Bank Dec'15
Industry
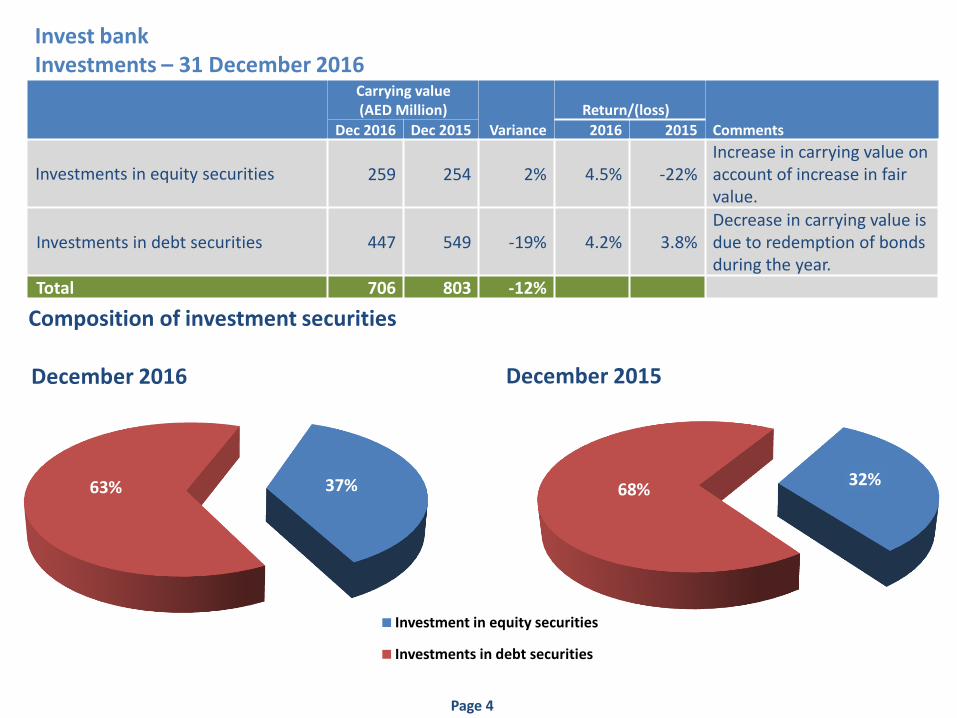
Invest bank Investments – 31 December 2016
Carrying value (AED Million)
Variance
Return/(loss)
Comments Dec 2016 Dec 2015 2016 2015
Investments in equity securities 259 254 2% 4.5% -22% Increase in carrying value on account of increase in fair value.
Investments in debt securities 447 549 -19% 4.2% 3.8% Decrease in carrying value is due to redemption of bonds during the year.
Total 706 803 -12%
Composition of investment securities
Page 4
37% 63%
December 2016
Investment in equity securities
Investments in debt securities
32% 68%
December 2015

Dec-16 Dec-15 Variance
Interest income 769 726 6% Interest expense (258) (226) 14% Net interest income 511 500 2% Non interest income 230 211 9% Total operating income 741 711 4% General & administration (177) (173) 2% Depreciation (12) (12) - Operating profit 552 526 5% Impairment (280) (274) 2% Net profit 272 252 8% Earning per share 0.17 0.16 6%
• Interest income increased in line with increase in average interest bearing assets from AED 12.7B in 2015 to AED 13.5B in 2016 (6%).
• Interest expense increased on account of increase in average deposit rates by 12 bps against 2015 and increase in average interest bearing liabilities from AED 10.8B in 2015 to AED 11.7B in 2016 (9%).
• Non interest income increased due to increase in lending related fees.
Invest bank – Statement of profit or loss For the year ended 31 December 2016 All fig. in AED Million
69% 27%
3% 0% 1%
Dec 2016
70%
25%
3% 1% 1%
Dec 2015 Net Interest Income
Fee & commission Income
Forex income
Investment income
Other income
Composition - Statement of profit or loss
Page 5

Invest bank Financial performance – Income statement All fig. in AED Million
-
100
200
300
400
2012 2013 2014 2015 2016
32
5
32
8
36
0
25
2
27
2
Net profit
-
100
200
300
400
500
600
2012 2013 2014 2015 2016
44
2
47
3
50
3
52
6
55
2
Operating profit
-
200
400
600
800
2012 2013 2014 2015 2016
56
6
60
8
66
5
71
1
74
1
Operating income
-
50
100
150
200
250
300
2012 2013 2014 2015 2016
11
7
14
5
14
3
27
4
28
0
Loan loss charge
Page 6

Invest bank Financial performance – Profitability ratios
6.2%
2.2% 4.0%
6.5%
2.1%
4.4%
0%
1%
2%
3%
4%
5%
6%
7%
Yield on loans and advances
Cost of deposits Margin (Yield on loans & adv less cost
of dep)
Yield
Invest Bank Dec'16
Invest Bank Dec'15
3.8%
1.2%
5.0%
Industry average 2016
2.9
8%
2.7
7%
2.7
6%
1.7
5%
1.7
5%
1.59%
0.00%
0.50%
1.00%
1.50%
2.00%
2.50%
3.00%
3.50%
2012 2013 2014 2015 2016
Return on average assets
Invest Bank Industry average
14
.54
%
13
.27
%
13
.38
%
8.9
9%
9.3
7%
12.32%
0%
2%
4%
6%
8%
10%
12%
14%
16%
2012 2013 2014 2015 2016
Return on average equity
Invest Bank Industry average
22
%
22
%
24
%
26
%
26
%
38%
0%
5%
10%
15%
20%
25%
30%
35%
40%
2012 2013 2014 2015 2016
Cost to income ratio
Invest Bank Industry average
Page 7
Net interest margin

Invest bank Financial performance
6.5
8%
8.0
9%
7.3
7%
7.8
7%
7.7
%
96% 89% 109% 100% 102%
0%
20%
40%
60%
80%
100%
120%
3%
4%
5%
6%
7%
8%
9%
2012 2013 2014 2015 2016
Non Performing Loan ratio vs. Provision coverage
NPL Ratio Provision coverage
Page 8

Invest bank Share performance – Market capitalisation
1.21
1.09
0.00
0.20
0.40
0.60
0.80
1.00
1.20
1.40
1.60
1.80
2012 2013 2014 2015 2016
Price / book value
Invest Bank Industry average
AED 3.6 B
Dec’16: 2.26
0.00
0.50
1.00
1.50
2.00
2.50
3.00
-
2,000
4,000
6,000
8,000
10,000
2012 2013 2014 2015 2016
Shar
e p
rice
Share price vs. Index
Market capitalisation (Invest Bank) ADX banking sector index Share price (Invest Bank)
13.24
10.38
-
2
4
6
8
10
12
14
0
2
4
6
8
10
12
14
2012 2013 2014 2015 2016
Price / earning ratio
Invest Bank Industry average
Page 9

Invest bank Dividend performance
47%
30%
0%
10%
20%
30%
40%
50%
60%
70%
80%
90%
2012 2013 2014 2015 2016
Dividend Payout Ratio
Invest Bank
Industry average
4%
3% 0%
2%
4%
6%
8%
10%
12%
14%
2012 2013 2014 2015 2016
Dividend Yield
Invest Bank
Industry average
Page 10
The Bank has proposed dividend at 8.08% for 2016 (2015: 7.5%)
Average dividend percentage for 60 companies listed on DFM/ADX 5.2%. [Al Iqtisadi 13 March 2017]

Invest bank Share holders value creation – 2005 – 2016
Page 11
3,589
910
678
-
- 2,001
678
2,001
1,351
1,351
910
-
500
1,000
1,500
2,000
2,500
3,000
3,500
4,000
4,500
Share capital on listing -
2005
Share dividend
2005 -2016
Share price appreciation 2005 -2016.
Market capitalisation
- 2016
Cash dividend 2005 - 2016
Shareholders value at
listing (2005)
Return to shareholders 2005 - 2016
4,030
All fig. in AED Million
at AED 1 par
AED 2.26* less par value
AED 2.26/share
*31 Dec 2016 price
75%
1.5 X

Invest bank Investor base – 31 December 2016
Ownership statistics by nationalities of shareholder
1.03%
0.68% 0.003%
98.30%
2016 Arab
Foreigners
GCC
National 1.02%
2.71% 0.003%
96.26%
2015
58% 42%
2016
Institution
Individual
48% 52%
2015
Ownership statistics by nature of shareholder
Page 12

Invest bank Share distribution – 31 December 2016
Page 13
51.89%
37.99%
2.81%
5.67%
0.72%
0.72%
0.08%
0.10%
0.01%
0.009%
More than 50M
10M-50M 5M-10M 1M-5M 500K-1M 100K-500K 50K-100K 10K-50K 5K-10K 1-5K
0
10
20
30
40
50
60
70
80
90
100
110
120
<5K
Nu
mb
er o
f sh
areh
old
ers
Shares held
33 shareholders own 90% of shares.