investor presentation june 2012 - lamaune iron
TRANSCRIPT

Investor Presentation June 2012

Forward Looking Statements
The content of this presentation has been prepared for the purpose of providing general information about, and an
overview of Lamaune Iron Inc. (the “Company") and its operations. It is not meant to be a complete review of all
matters concerning the Company. Whilst the Company has taken all reasonable care to ensure the information and
facts contained in this presentation are accurate and up-to-date, it does not make any representation or warranty,
express or implied as to the accuracy or completeness of any information included in this presentation. The Company
does not accept liability for any loss arising directly or indirectly from the use of or reliance on this presentation or
information it contains.
This presentation does not constitute an invitation or inducement to engage in investment activity in the ordinary
shares of the Company nor does it purport to contain information that shall form the basis of, or be relied upon in
making such investment decisions. If you require any advice, please consult with a professional financial adviser.
Past performance cannot be relied on as a guide for future performance.
This presentation may contain certain forward-looking statements concerning the financial condition, results of
operations and businesses of the Company. All statements other than statements of historical fact are, or may be
deemed to be, forward-looking statements. Forward-looking statements are statements of future expectations that
are based on management’s current expectations and assumptions and involve known and unknown risks and
uncertainties that could cause actual results, performance or events to differ materially from those expressed or
implied in these statements. All forward-looking statements contained in this presentation are expressly qualified in
their entirety by the cautionary statements contained or referred to in this section. You should not place undue
reliance on forward-looking statements. Each forward-looking statement speaks only as of the date of the
presentation. The Company does not undertake any obligation to publicly update or revise any forward-looking
statement as a result of new information, future events or other information. In light of these risks, results could differ
materially from those stated, implied or inferred from the forward-looking statements contained in this presentation.
2

Investment Highlights
Low-cost 100%-owned Ontario Iron Project
Rich 25-35% Fe Grade
Deposit Outcrops on Surface - Zero Strip Ratio
Excellent Access to Rail and Port Infrastructure
Potential Offtake Partners in Great Lakes Region
Experienced and Proven Management Team & Board
3

Strong Worldwide Demand for Iron
4

0
20
40
60
80
100
120
140
160
180
Iron Ore Monthly Price ($US per metric ton)
196
Feb 2002
Feb Feb Feb Feb Feb Feb Feb Feb Feb 2003 2004 2005 2006 2007 2008 2009 2010 2011
Feb 2012
Iron Ore Largest Metal Commodity Market
5

100%-Owned Ontario Iron Project
Lamaune Iron Property
Thunder Bay
Armstrong
Lake Superior
Lake Nipigon
6
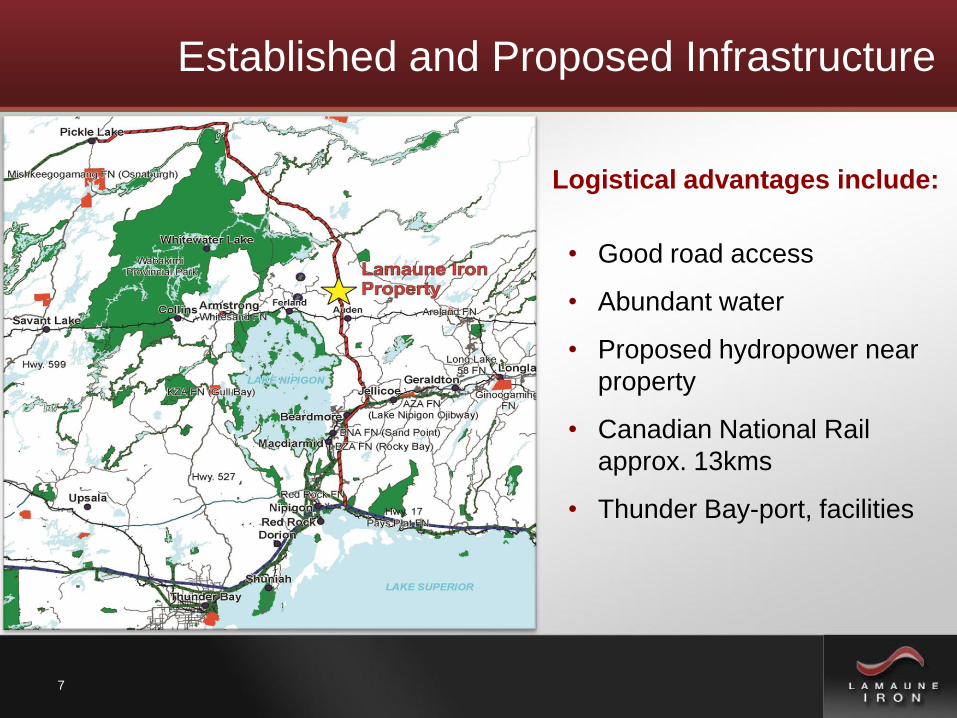
Established and Proposed Infrastructure
• Good road access
• Abundant water
• Proposed hydropower near
property
• Canadian National Rail
approx. 13kms
• Thunder Bay-port, facilities
Logistical advantages include:
7

Lamaune Property 4,096 Hectares
8
Lamaune Iron Project 300-500 M tonnes 25%-35% Fe Exploration Target
Lamaune Gold Prospect 40,000-50,000 oz. Au Exploration Target

Lamaune Iron Project
Magnetite Iron Deposit >12 km of potential strike length containing:
S i z e :
• ‘Exploration Potential’ of 300 to 500 million tonnes of mineralization grading from
25% Fe to 35% Fe (2011 NI 43-101 Technical Report)
G r a d e :
• Preliminary flotation tests indicate 68% Fe grade concentrate at 72% product weight
recovery and 83% Fe yield
9

Work to Date
• Ground and Airborne Magnetic surveys
• Drilled 2005/2010 40 diamond drill holes for 7,933 metres
• Magnetic model to produce a conceptual exploration target
• Preliminary magnetic and flotation testing upgraded to 68% Fe
• High level scoping study
• High level marketing and transportation overview
• NI 43-101 Technical Report for Exploration Potential
COMPLETED 2005/2010
10

Geophysics
2 0 0 9 :
High quality IMPULSE
airborne EM/Mag
further delineated
anomalies
Lamaune Iron-magnetic Inversion 25m Depth
2 0 0 4 :
AeroTEM airborne
EM/Mag survey
identified 8 anomalies
over 9 km
11

Low Cost Mining
• Iron deposit on or near surface • Zero strip ratio for early years
12

Lamaune Iron Section 100+00E
13

Metallurgical Testing
• DTR – Grind to 100% -45micron
– nominally 80% -32micron
• Optimum Grind
Testwork completed on 10 samples of split drill core from central 3.5km zone:
Market Acceptable, Quality Iron Pellets Can Be Processed
DAVIS TUBE RESULTS - At 80% passing 32micron
Sample IDWt. to
Cons (%)Fe (%)
SiO2
(%)
Al2O3
(%)
CaO
(%)
MgO
(%)
P
(%)
S
(%)
TiO2
(%)
MnO
(%)
K2O
(%)
Na2O
(%)
Zn
(%)
LOI-1000
(%)
Sample 1 30.14 67.70 4.72 0.27 0.24 0.52 0.021 1.25 0.05 0.01 0.02 0.01 0.00 -2.57
Sample 2 22.53 66.80 4.98 0.21 0.26 0.45 0.025 1.42 0.06 0.02 0.01 0.00 0.00 -2.36
Sample 3 29.30 62.80 11.20 0.31 0.32 0.58 0.025 0.29 0.04 0.03 0.03 0.02 0.01 -2.67
Sample 4 22.69 66.70 6.26 0.26 0.31 0.39 0.034 0.28 0.09 0.02 0.01 0.01 0.00 -2.88
Sample 5 15.22 63.00 9.37 0.59 0.45 0.79 0.034 1.02 0.08 0.03 0.03 0.10 0.01 -2.03
Sample 6 22.69 68.60 3.22 0.20 0.41 0.50 0.020 0.27 0.05 0.03 0.02 0.00 0.01 -2.53
Sample 7 27.23 61.90 11.90 0.42 0.25 0.37 0.019 0.28 0.08 0.02 0.02 0.09 0.01 -2.71
Sample 8 23.81 68.70 3.91 0.26 0.16 0.15 0.011 1.29 0.12 0.02 0.02 0.01 0.00 -2.49
Sample 9 18.11 59.90 13.00 0.65 0.44 1.03 0.025 4.82 0.10 0.04 0.04 0.08 0.00 -0.75
Sample 10 22.90 61.10 12.30 0.59 0.36 0.91 0.031 4.40 0.08 0.04 0.03 0.09 0.01 -0.70
Average 23.46 64.87 7.99 0.36 0.31 0.55 0.024 1.42 0.07 0.02 0.02 0.04 0.01 -2.24
Sample 5 and 9 may be excluded due to low Wt Recovery - should be >20%.
• Dry Magnetic separation
• Flotation
• Grinding power – BWI, RWI, CWI and UCS
14

0.00
1.00
2.00
3.00
4.00
5.00
6.00
7.00
8.00
9.00
10.0
55 60 65 70 75 80 85 90 95 100
2
0.00
0.20
0.40
0.60
0.80
1.00
1.20
1.40
1.60
1.80
2.00
Metallurgical Testing
Lamaune Flotation
Grade/Yield Curve
Preliminary sighter flotation
tests indicate success at
reducing silica to acceptable
levels and iron recoveries.
68% Fe, 4.5% SiO2, 0.3% S Grade Concentrate at a 72% Product
Weight Recovery and 83% Fe Yield can be Achieved
15
Yield, % Fe
Gra
de
, %
SiO
Gra
de
, %
S
Target Silica
Rougher Yield
RD1138 RD1139 RD1136 RD1136 Sulphur
This circuit is common in the
iron ore mines of Minnesota
and Northern Michigan

Proposed Circuit
• Crush to -200mm
• Autogenous milling to below
3mm, remove 50% of the
tails using magnetic
separation
• Grind to 55micron (pebble
mills), remove 90 to 92% of
tails with magnetic separation
• Final grind to 80% -25micron
using energy efficient tower
mills, magnetically separate
• Reverse and Scavenger
Flotation
• Filter, ball and pelletize
16

Overall Capital Cost
Item Cost Millions 2.5 Mtpa
Cost Millions 5 Mtpa 7.5 Mtpa
Mining 26.4 36.8 48.2
Concentrator 261.1 395.7 504.7
Pellet Plant 229.5 347.9 443.7
Infrastructure 82.0 96.7 113.2
Contingency (15%) 90.0 131.6 166.5
Total Capital Cost 689 m 1,008 m 1,276 m
Ty p i c a l 2 . 5 M t p a C o n c e n t r a t o r – A B M Ta s m a n i a
17
($US M)
Cost Millions

Internal Rate of Return
18
Change of IRR with Project Scale
Price of Pellets $US/t
0.0%
2.5Mtpa
5Mtpa
7.5Mtpa
Operating Cost
10.0%
15.0%
20.0%
25.0%
30.0%
35.0%
40.0%
20 40 60 80 100 120
%IR
R
140 160
5.0%
-5.0%
-10.0%

North American Iron Market
19
Lamaune Iron Property
Iron Ore Port
Iron Producer (Fe)
Major City
Railway Line
Shipping Route

Significant Iron Market
• Major market consists of 23 integrated steel mills in North America with
combined capacity of 69 million tonnes of annual steel production
• Preferred option for Lamaune iron ore pellets is direct shipping from
pellet plant to steel mill
• Potential offtake partners:
M a r k e t i n g & Tr a n s p o r t a t i o n O ve r v i e w
C o m p l e t e d 2 0 1 0
Essar Steel (Algoma)
U.S. Steel and ArcelorMittal
AK Steel and Severstal
Sault Ste. Marie, Ontario
Hamilton, Ontario
Middletown, Ohio
20
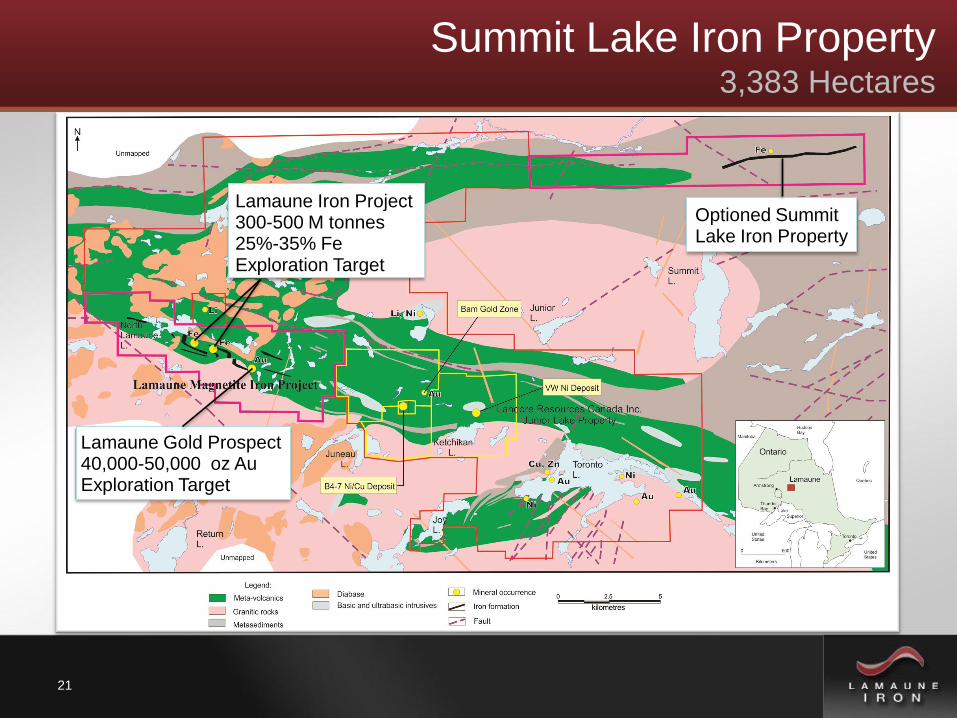
Summit Lake Iron Property 3,383 Hectares
21
Lamaune Iron Project 300-500 M tonnes 25%-35% Fe Exploration Target
Lamaune Gold Prospect 40,000-50,000 oz Au Exploration Target
Optioned Summit Lake Iron Property

Growth Potential
• 5.6 km strike length indicated by government geophysics
• Summit geophysical anomaly similar in intensity to Lamaune
Magnetite Iron Project
• Discovered in 1957, no recent exploration
• Partially delineated by historic ground geophysics and drilling
• Historic drill logs indicate Banded Iron Formation, potentially
similar to Lamaune Iron
• Located 25 km northeast of Lamaune Magnetite Iron Project
Summit Lake Magnetite Iron deposit:
22

Lamaune Gold Prospect
• Drilled 2009/2010 75 diamond NQ core drill-holes for 11,644 metres
• Conceptual Exploration target of 1,350,000 to 1,650,000 tonnes containing
between 40,000 and 50,000 ounces of gold at 0.3g/t cut-off
• Open along strike and down plunge
• Preliminary Metallurgical testing gave recovery of 94.4%. Low grade
amenable to heap leaching with the high grade to gravity separation
C o m p l e t e d
P l a n n e d
• Extension drilling carried out in conjunction with Iron infill drilling
23
Gold Prospec t Of fse ts Produc t ion Cos ts

Lamaune Gold Section 117+50E
24

Key Milestones for 2012/2013
• Drilling leading to NI 43-101 compliant resource
L a m a u n e P r o p e r t y
• Metallurgical Recovery Testwork
• Resource Estimate
• Preliminary Economic Assessment (Scoping)
25
Engineering Studies:
Marketing
Drilling
• Identifying potential offtake partners

Corporate Information
William Humphries (Chairman)
Edward Badida CA(Chief Financial Officer and Director)
Richard Prickett CA(Director)
Michele Tuomi P.Geo. (Technical Consultant)
Taheh Holdings
Quilvest Switzerland
Directors
Caldwell Associates
Investec
TD Waterhouse
Directors and
Management
Major
Shareholders
Number o f
Shareholders
20%
11%
10%
6.5%
4%
3.5%
26
850
Number o f Shares
In Issue 62,641,883
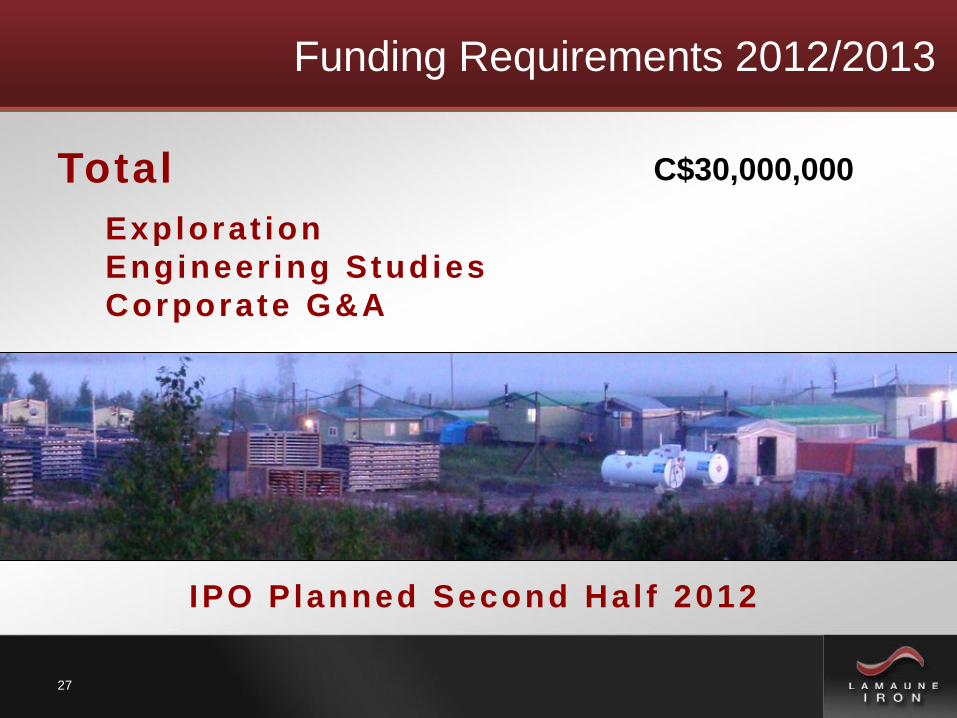
Funding Requirements 2012/2013
Total
Explorat ion
Engineer ing Studies
Corporate G&A
IPO Planned Second Hal f 2012
C$30,000,000
27
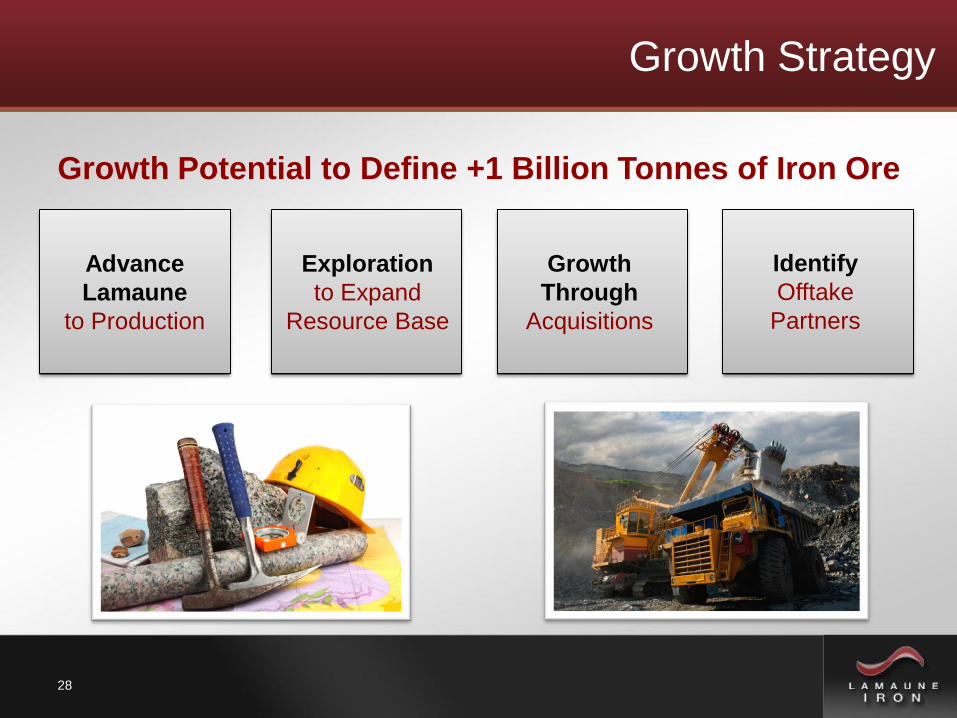
Growth Strategy
Advance
Lamaune
to Production
Exploration
to Expand
Resource Base
Growth
Through
Acquisitions
28
Identify
Offtake
Partners
Growth Potential to Define +1 Billion Tonnes of Iron Ore
Investment Highlights
Low-cost 100%-owned Ontario Iron Project
Rich 25-35% Fe Grade
Deposit Outcrops on Surface - Zero Strip Ratio
Excellent Access to Rail and Port Infrastructure
Potential Offtake Partners in Great Lakes Region
Experienced and Proven Management Team & Board
29