investor presentation leverkusen, may 2016
TRANSCRIPT

Investor Presentation
Leverkusen, May 2016

covestro.com
Welcome & Strategy

The agenda
2
Capital Markets Day Covestro, Düsseldorf / Leverkusen
08:00 Welcome & Strategy Patrick Thomas, CEO
08:15 Coatings, Adhesives, Specialties (CAS) and Q&A Daniel Meyer, Head of Coatings, Adhesives, Specialties business unit
09:15 Polyurethanes (PUR) and Q&A Markus Steilemann, Head of Polyurethanes business unit, Board member
10:15 Coffee break
10:35 Polycarbonates (PCS) and Q&A Michelle Jou, Head of Polycarbonates business unit
11:20 Financial Performance Frank H. Lutz, CFO
11:40 Key Investment Highlights Patrick Thomas, CEO
11:50 Q&A All Speakers
12:30 Lunch break
13:30 Shuttle to Covestro, Leverkusen Shuttle
14:30 PUR / PCS Innovation & Application Centers Leverkusen
16:00 Shuttle to Airport DUS Shuttle
Thursday, 12th May 2016

The presentation team
3
Patrick Thomas
CEO
Dr. Markus Steilemann
Head of Polyurethanes business unit, Board member
Michelle Jou
Head of Polycarbonates business unit
Daniel Meyer
Head of Coatings, Adhesives, Specialties business unit
Frank H. Lutz
CFO

Covestro at a glance
Inventor and leader in high-tech material solutions driven by global trends
Adj. EBITDA
2015A €1.6bn
Sales
2015A €12.1bn
Adj. EBITDA margin
2015A 13.6%
Key Covestro
Financials:
EMLA 44%
NAFTA 28%
APAC ex China 12%
China 16%
Automotive / Transportation
20%
Construction 17%
Wood / Furniture 16%
Electrical / Electronics
12%
Chemicals 8%
Sports / Leisure, Cosmetics,
Health, Others 27%
Sales Split by Geography(b)
Sales Split by End-market
• Leading global polymer producer in polyurethanes and its
derivatives as well as polycarbonates
• Proven track record of process and product innovation, customer
proximity as well as market-driven solutions
• State-of-the-art asset base with leading process technology and
total production capacity of 4,800kt(a) distributed across 8 world-
scale production facilities in three main regions
• Backward-integration into chlorine, propylene oxide and other
feedstock, aimed at sourcing critical raw materials internally with no
or limited merchant market sales
• Headquartered in Leverkusen, Germany, with 15,750 employees(c)
globally
2015A
2015A
Notes: (a) Includes total nameplate capacity for PUR and PCS in 2015A, rounded to nearest 100kt
(b) based on Covestro Annual Report 2015A; EMLA = Europe, Middle East, Africa, Latin America (without Mexico); NAFTA = USA, Canada, Mexico; APAC = Asia, Pacific
(c) Employees refers to full-time-equivalents (FTE), rounded to nearest 50
4

Covestro business units
5
Three industry-leading, structurally attractive business units
Rigid foam:
• Building insulation
• Cold chain
• Automotive parts
Flexible foam:
• Furniture
• Bedding/mattresses
Business Units Coatings, Adhesives, Specialties (CAS) Polycarbonates (PCS) Polyurethanes (PUR)
Sales 2015A €2.1bn or 17% of Covestro €3.2bn or 26% of Covestro €6.1bn or 50% of Covestro
Global Position(a)
Global #1:
• Aliphatic isocyanate derivatives
• Aromatic isocyanate derivatives
• Polyurethane dispersions
Joint Global #1 (1,280kt)
• EMEA: #2 (540kt)
• NAFTA: #2 (230kt)
• APAC: #2 (510kt)
Global #1 (3,470kt)
• MDI: #2 (1,420kt)
• TDI: #2 (720kt)
• Polyether polyols: #2 (1,330kt)
Key Applications
• Surface coatings
• Adhesives and sealants
• Elastomers
• Specialty films
• Automotive parts
• IT and electrical equipment, electronics
• Construction (windows, roof structure)
• Consumer products, medical and other
applications
Adj. EBITDA Margin 2015A 23.5% 17.7% 10.2%
Notes: (a) Based on total nameplate capacity for PCS, MDI, TDI and Polyether polyols at year-end 2015A relative to competitors as per Covestro internal estimates; for PCS: joint global leader (SABIC is the other #1); based on entire
polycarbonates nameplate capacity as per Covestro internal estimates; for CAS: based on total volume in 2015A relative to competitors as per Covestro internal estimates.

Covestro is a leader across its entire portfolio
and across regions
6
Global industry positions
Reg
ion
al
Ca
pac
ity
Sh
are
Po
sit
ion
#2 in Americas
#1 in EMEA
#2 in APAC
#1 in Americas
#2 in EMEA
#2 in APAC
#2 in Americas
#2 in EMEA
>#10 in APAC
#2 in Americas
#2 in EMEA
#2 in APAC
#1 in Americas
#1 in EMEA
#1 in APAC
Polyurethanes
Co
ve
str
o G
lob
al
Po
sit
ion
(20
15
A)(
a)
Polycarbonates
27%
Joint
#1(b)
Other
Players
MDI
#2
TDI
#2
Polyether
polyols
#2
Other
Players
Other
Players
Other
Players
20% 27%
Coatings, Adhesives, Specialties
Aliphatic isocyanate
derivatives
#1
Polyurethane
dispersions
#1
Other
Players
47%
Other
Players
17%
PC
Other
Players
15%
#1 in PUR #1 in CAS
Notes: (a) Based on total nameplate capacity for MDI, TDI, Polyether polyols and PCS in 2015A relative to competitors as per Covestro internal estimates; for CAS: based on total nameplate capacity for Aliphatic isocyanate derivatives
and Polyurethane dispersions in 2015A relative to competitors as per Covestro internal estimates
(b) Joint #1 position between Covestro and SABIC based on total nameplate capacity for PCS in 2015A relative to competitors as per Covestro internal estimates

Above GDP industry growth supported by global trends
7
Exposure to fundamental macro trends
Global trends Needs Industry demand outlook 2015A – 2020E(a) Covestro solutions
• Zero emission concepts
• Low energy buildings
• Food preservation
• Low cost durable goods
• Affordable housing
• Living comfort
• Public infrastructure
Climate
change
Mobility
Growing
population
Increasing
urbanization
• Energy efficient mobility
• Lightweight transportation • Lightweight materials for
transportation
• Roofing and glazing for buildings
• Blends and composites for
electronics / IT and consumer
goods
• High performance surfaces and
coatings
• High-tech films
• Solvent-free coatings and adhesives
• Building insulation
• Insulation along the cold chain
• Foam mattresses and comfort
solutions
• Weight-saving car parts
PU
(b)
PC
C
AS
e(c
)
2.7Mt 3.3Mt
2014A 2020E
15.2Mt
18.5Mt
2015A 2020E
3.8Mt 4.7Mt
2015A 2020E
~4%
CAGR
~4%
CAGR
~4%
CAGR
Notes: (a) Assumes global GDP CAGR 2015A – 2020E of ~3%
(b) Comprises MDI, TDI and polyether polyols
(c) Shows PU raw materials industry demand in coatings, adhesives and sealants
Source: Company information. CASe market: Orr & Boss 2014A & Covestro internal estimates with annual growth of 4% for 2015A

8
Products Chemical backbone
Chlorine Phosgene
Caustic soda
Hydrochloric acid
GP
P(b
)
• Common assets economies of scale
• Chemical know-how
• Process technology
• Chemical know-how
• Process technology
• Customer access
• Global presence
Services
A common chemical backbone across all segments
Significant synergies in scale, process technology and chemical know-how
TDI
MDI
PET
PCS
CAS
Propylene oxide(a)
Notes: (a) Contracts and JV activities
(b) Gas Phase Phosgenation
Customer industries
• Automotive/transportation
• Construction
• Wood/furniture
• Electrical/electronics
• Chemicals
• Sports, leisure, cosmetics,
health, other industries
Synergies

Shanghai, China
Baytown, USA
Americas EMEA APAC
Map Ta Phut, Thailand
4 sites, Germany
PUR PCS CAS
Antwerp, Belgium
Covestro integrated sites in all key regions
9
Common backbone chemistry provides scale and synergies
Covestro operates 8 interlinked world-scale sites in all key regions

Focused R&D to build and protect profitable competitive positions
10
Research and development strategy
Existing Market
New
Adjacent Growth
New Technology
Te
ch
nolo
gy
Core Efficiency
& Sustain
Adjacent Growth
New Market
New
2 3
1
• Product R&D primarily in close collaboration with external
partners in adjacencies, guided by stringent stage-gate
processes
• Process R&D critical to maintain cost leadership position
• Areas of potential bolt-on acquisitions to boost R&D and
business development
1 Product R&D:
• PDI
• CO2 polyols
• PCS composites
Process R&D:
• IMPACT technology
• Automotive interior 2
• Wind blades
• LED lighting
• Ophthalmic lenses
3
Examples

Building upon 80 years of innovation and leadership
Covestro contributions to polymer industry
2014
INSQIN® Waterborne
PU for synthetic leather
and other coated fabrics
1937
Otto Bayer
discovers
polyurethanes
1953
Hermann Schnell
discovers polycarbonates
1959
Moltopren®
adopted by
fashion industry
1962
Polyurethane rigid foam
launched as insulation for
cooling devices
1967
Bayer presents the
first car made almost
entirely from plastic 1954
Kuno Wagner
invents crosslinking agents for
lightfast Polyurethane
coatings
1982
Special grade of Makrolon®
used in optical storage media
First Makrolon® automobile headlamp
1985 First Bayblend® flame retardant
grades for business machines
1991
NASA memory foam first
released under the "Tempur”
brand, establishing a major
customer for Covestro’s Softcell
1993 2 component waterborne
PU forparquet coating,
wood coating and plastic
coatings
1995 Introduction of Makrolon® based films
for high security documents
1998
First automotive glazing application
for the Smart rear window
2001
Covestro integrated
site built in Shanghai, China
2010
Significant investments in expansion of
facilities at site in China
2011
Shanghai TDI plant
with new gas-phase
phosgenation technology
2012
Introduction ofmicrocell technology,
with improved insulation efficiency
2013
Replacing epoxy
resin by PU resin
for wind blades
2014
Construction of new
production line in Dormagen
to use CO2 as a new raw
material for foams
2015
First bio-based
cross-linker (PDI)
Acquisition of TCG to build
position in Thermoplastic
composites
2015 1935
Global polyurethanes & polycarbonates industry demand (kt)
Product innovation
Process innovation
Corporate events
11

Production Raw
materials Global trends R&D
R&D resources
allocated based
on benefits for:
• People
• Planet
• Profit
Address customer needs for
more sustainable solutions
(e.g. lightweight, durable,
bio-based)
Examples:
• CO2 Polyols
• INSQIN® (artificial leather)
• Desmodur® Eco
(coating hardener)
• Baytherm® Microcell
(insulation foam)
• Makrolon®
(LED Lighting, Automotive)
People & Planet & Profit
12
Covestro sustainability along the value-chain
Products
to markets
More sustainable
procurement
addressing
customer needs
and profit
improvement:
Examples:
• C1 feedstock
(e.g. CO2)
• Bio-based
feedstock
(e.g. BDO(a))
• Low carbon
energy
• Best-in-class safety track record
• Cost efficiencies by energy efficient process
1.11
0.68
2013A 2015A
Plant & process safety
LoPCIR(c)
0.80
0.34
2005A 2015A
Occupational safety
Reduction by
58%
RIR(b)
0.69
0.42
2005A 2015A
Specific CO2e emissions
2.19
1.53
2005A 2015A
Specific energy consumption
Reduction by
30%
MWh PE / t t CO2e / t
Reduction by
39%
Reduction by
39%
Notes: (a) BDO refers to 1,4-butanediol
(b) Number of incidents recordable after Occupational Safety & Health Administration (OSHA)-regularities per 200,000 hours worked
(c) Number of LoPC (Loss of Primary Containment) incidents per 200,000 hours worked by operational employees

Leverage industry leadership to capture growth in our industries
and improve our asset and cost base
13
Covestro strategy
1 Capture market growth
over the next years with existing world-scale assets
Optimize asset footprint
through site consolidation, restructuring and efficiency projects 2
Improve cost position
by 2019, align overall costs with best-in-class chemical industry benchmarks 3
Protect and build profitable competitive positions
through focused R&D 4
Embed sustainability
in every element of the strategy 5

covestro.com
Coatings, Adhesives,
Specialties (CAS)

Niche enablers business focused on high-end products
CAS at a glance
• Global leading supplier of high-performance materials to the coatings and adhesives industry
and other specialties (films, elastomers, textiles, medical and cosmetics)
• Inventor of and technology leader in isocyanate derivatives for coatings, adhesives, sealants
and specialties
• More than 2,300 products based primarily on six monomers, serving over ten high-end
industries and over 4,300 customers
• Product pricing driven by value-added to end-customer, as CAS materials are critical to the
performance of the final product, but form a small proportion of the overall cost
• Market-driven innovation in close collaboration with all partners in the value chain, developing
customized solutions for specific problems (“forward marketing”)
• Efficient production processes benefitting from low cost technology and integration
• Has delivered high, resilient margins and strong cash flow and returns
#1 Producer of
aliphatic
isocyanates(a)
€2.1bn Sales
23.5% Adj. EBITDA
Margin
2,300+ Products
4,300+ Customers(b)
Active components for surface coatings
Active components for specialties
Active components for adhesives and sealants
Notes: (a) Based on total aliphatic isocyanates volume in 2015A relative to competitors as per Covestro internal estimates
(b) Includes direct customers only
2

Focused on selected high-value part of PU resins industry
CAS product lines
Total PU Resins volume: 2,600kt
ISOCYANATE DERIVATIVES + POLYOLS = POLYURETHANE RESINS Key Industrial Applications
13,100kt
€24bn
34,400kt
€100bn
Industrial Furniture
22% Auto
OEM Metal 13%
Auto Refinish
12%
Construction Concrete
10%
Corrosion Protection
9%
Others 34%
Coatings:
1,700kt
Packaging 27%
Automotive & Transportation
26% Industrial
15%
Construction 13%
Footwear 5%
Others 15%
Adhesives:
700kt
Construction 61%
Automotive & Transportation
27%
Others 12%
Sealants:
200kt
Aromatic
15%
PUD(d)
14%
Aliphatic
10%
Polyol
61%
2,600kt
€7bn
Notes: (a) Coatings, adhesives and sealants
(b) Excluding decorative coatings
(c) Volumes rounded to nearest 100kt
(d) Polyurethane dispersions
Source: Orr & Boss as of 7/2015, annual figures for 2014A
3
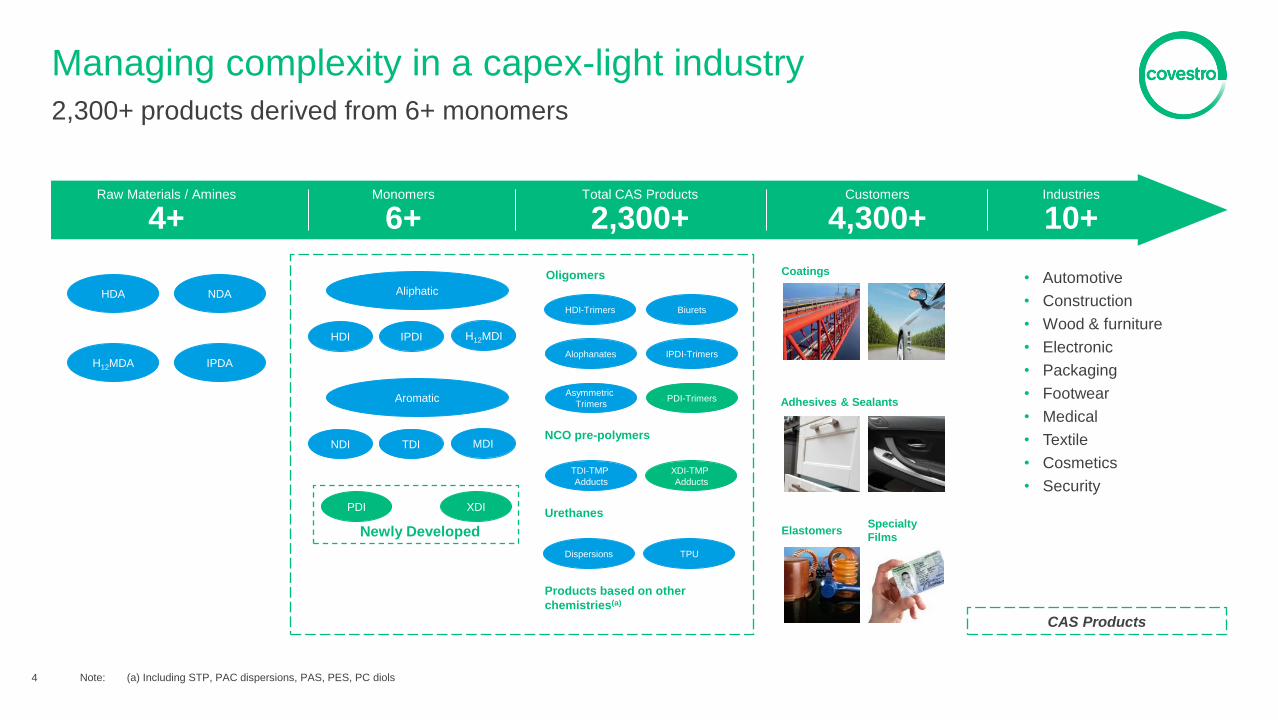
Managing complexity in a capex-light industry
2,300+ products derived from 6+ monomers
Biurets HDI-Trimers
Alophanates H12MDA IPDA
HDA NDA
XDI PDI
Newly Developed
H12MDI IPDI HDI
NDI TDI MDI
• Automotive
• Construction
• Wood & furniture
• Electronic
• Packaging
• Footwear
• Medical
• Textile
• Cosmetics
• Security
IPDI-Trimers
Asymmetric
Trimers PDI-Trimers
Oligomers
XDI-TMP
Adducts
TDI-TMP
Adducts
NCO pre-polymers
Dispersions
Urethanes
TPU
Products based on other
chemistries(a)
CAS Products
Raw Materials / Amines
4+ Monomers
6+ Customers
4,300+ Industries
10+ Total CAS Products
2,300+
Elastomers Specialty
Films
Coatings
Adhesives & Sealants
Note: (a) Including STP, PAC dispersions, PAS, PES, PC diols
Aliphatic
Aromatic
4
Additives
Extender / Pigments
Organic solvents or water
Resins / Binders and Hardeners
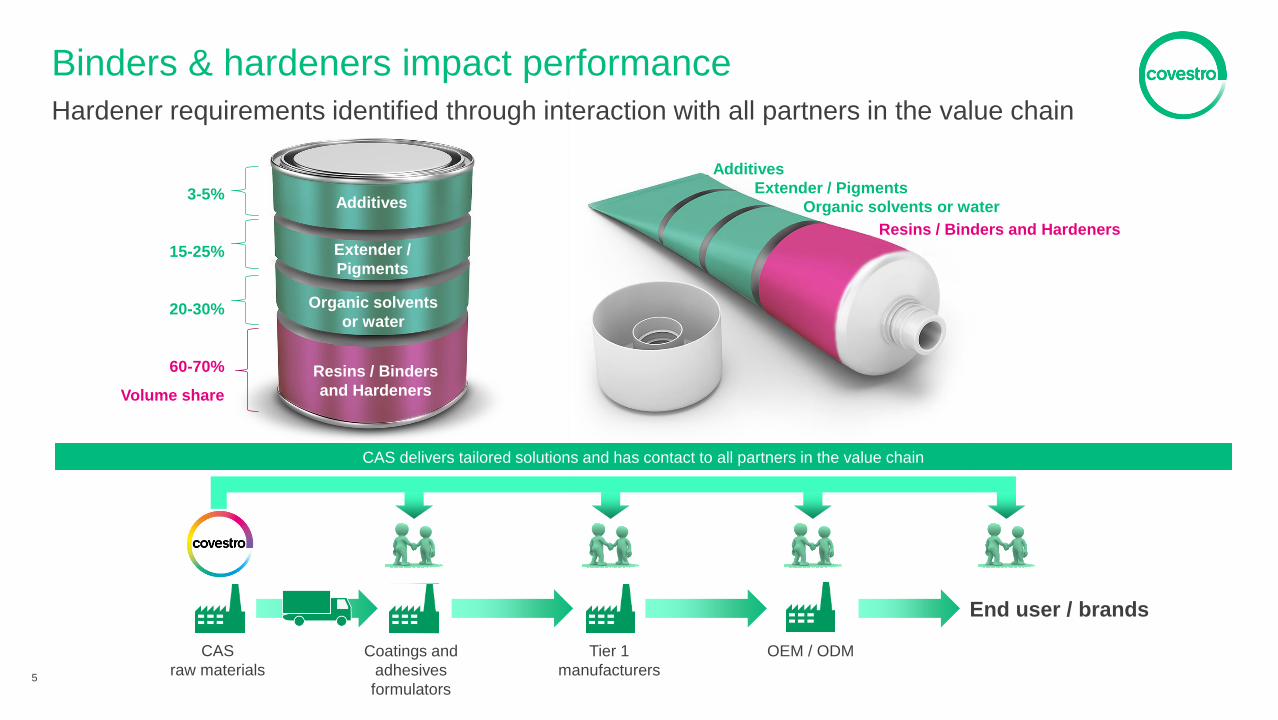
Binders & hardeners impact performance
Hardener requirements identified through interaction with all partners in the value chain
Additives
Extender /
Pigments
Organic solvents
or water
Resins / Binders
and Hardeners
CAS delivers tailored solutions and has contact to all partners in the value chain
CAS
raw materials
OEM / ODM Tier 1
manufacturers
Coatings and
adhesives
formulators
End user / brands
5
3-5%
15-25%
20-30%
60-70%
Volume share

Industry specifics
Application method
Environment Substrate Curing CAS Portfolio
Biurets HDI-Trimers
Alophanates IPDI-Trimers
Asymmetric
Trimers PDI-Trimers
Oligomers
XDI-TMP
Adducts
TDI-TMP
Adducts
NCO pre-polymers
Dispersions
Urethanes
TPU
Products based on other
chemistries(a)
Total CAS Products
2,300+
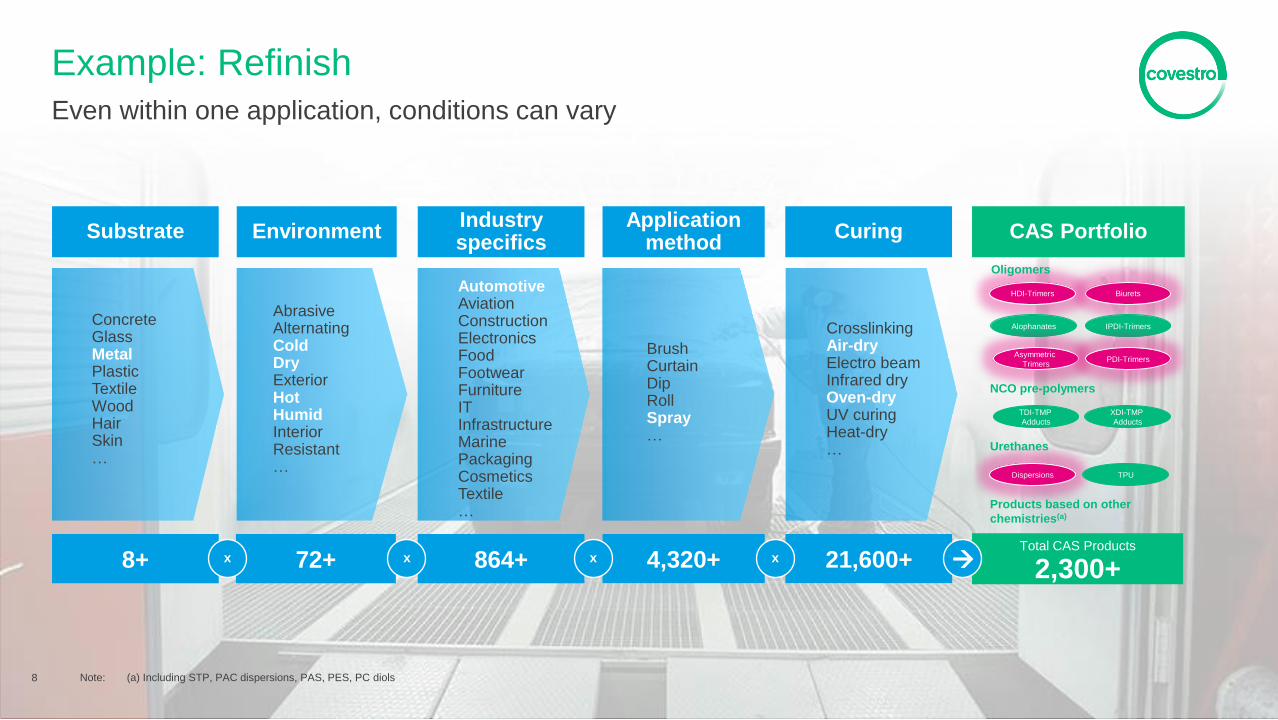
Automotive Aviation Construction Electronics Food Footwear Furniture IT Infrastructure Marine Packaging Cosmetics Textile …
Brush Curtain Dip Roll Spray …
Concrete Glass Metal Plastic Textile Wood Hair Skin …
Abrasive Alternating Cold Dry Exterior Hot Humid Interior Resistant …
Crosslinking Air-dry Electro beam Infrared dry Oven-dry UV curing Heat-dry …
Factors of customers’ challenges solved by CAS products
Multiple application conditions affect the choice of product
6 Note: (a) Including STP, PAC dispersions, PAS, PES, PC diols
864+ 4,320+ 72+ 21,600+ 8+ x x x x

7
Example: Refinish
Even within one application, conditions can vary
7
Example: Refinish
Even within one application, conditions can vary
Industry specifics
Application method
Environment Substrate Curing
864+ 4,320+ 72+ 21,600+ 8+
CAS Portfolio
Total CAS Products
2,300+
Automotive Aviation Construction Electronics Food Footwear Furniture IT Infrastructure Marine Packaging Cosmetics Textile …
Brush Curtain Dip Roll Spray …
Concrete Glass Metal Plastic Textile Wood Hair Skin …
Abrasive Alternating Cold Dry Exterior Hot Humid Interior Resistant …
Crosslinking Air-dry Electro beam Infrared dry Oven-dry UV curing Heat-dry …
Biurets HDI-Trimers
Alophanates IPDI-Trimers
Asymmetric
Trimers PDI-Trimers
Oligomers
XDI-TMP
Adducts
TDI-TMP
Adducts
NCO pre-polymers
Dispersions
Urethanes
TPU
Products based on other
chemistries(a)
8 Note: (a) Including STP, PAC dispersions, PAS, PES, PC diols
x x x x

Example: Sport Shoes
Even within one application, performance requirements can vary
9

Example: Sport Shoes
Even within one application, performance requirements can vary
Industry specifics
Application method
Environment Substrate Curing CAS Portfolio
Total CAS Products
2,300+
Automotive Aviation Construction Electronics Food Footwear Furniture IT Infrastructure Marine Packaging Cosmetics Textile …
Brush Curtain Dip Roll Spray …
Concrete Glass Metal Plastic Textile Wood Hair Skin …
Abrasive Alternating Cold Dry Exterior Hot Humid Interior Resistant …
Crosslinking Air-dry Electro beam Infrared dry Oven-dry UV curing Heat-dry …
Biurets HDI-Trimers
Alophanates IPDI-Trimers
Asymmetric
Trimers PDI-Trimers
Oligomers
XDI-TMP
Adducts
TDI-TMP
Adducts
NCO pre-polymers
Dispersions
Urethanes
TPU
Products based on other
chemistries(a)
10 Note: (a) Including STP, PAC dispersions, PAS, PES, PC diols
864+ 4,320+ 72+ 21,600+ 8+ x x x x

Construction market strives for cost and time savings.
Current standard is three-layer-technology with 18-24 hours
curing time.
PASQUICK™ enhances productivity as a two-layer-technology,
reducing the number of layers and speeding up the
drying process to 4-6 hours.
• Accelerates applying process at the applicator through
fewer coating layers
• Faster curing without compromising long-term performance
• Joint marketing campaign with direct customers to
leverage market potential
Construction: PASQUICK™
Inventing productivity win
11
Metal Alternating Construction Brush / Spray Crosslinking (2C) Polyaspartic
Success Factors
The Challenge
Our Solution

Automotive: Desmodur® blulogiq
Inventing faster curing
Automotive industry focuses on reducing CO2 emissions
by using lighter materials and looking for more efficient
production processes.
Desmodur® blulogiq is the first technology that enables faster curing at
low temperatures for coating of plastic parts and
coating of multi-material cars at temperatures
below 100 °C.
• Higher efficiency for automotive coating processes
• Up to 30% faster curing for plastic parts like bumpers,
mirror housings or tailgates
• Reduction of energy consumption up to 15% and
CO2-emissions up to 10% compared to the best OEM
metal coating process
12
Metal Dry Automotive Spray Oven-dry HDI-Trimer
Success Factors
The Challenge
Our Solution

Automotive: Desmodur® eco N 7300
Inventing renewable hardeners
Automotive industry focuses on reducing CO2 emissions.
Material production has strong impact on a car Life Cycle
Analysis. OEMs looking for more sustainable materials.
Desmodur® eco N 7300 7300 is the first bio-based hardener that enables the
development of polyurethane coatings, with a significantly
better carbon footprint than petro-based hardeners.
• Delivers very high performance to the coating
• 70% based on renewable resources, reducing the use of
fossil resources
• Significantly supports to meet the targets of the 21st
United Nations Climate Conference agreed in December
2015 in Paris
13
Metal Dry Automotive Spray Oven-dry PDI-Derivative
Success Factors
The Challenge
Our Solution

Food packaging: Desmodur® quix 175
Inventing safe packaging
Lamination adhesives for retort packaging need up to
2 weeks curing until packaging laminates can be shipped
and filled.
Desmodur ® quix 175 as raw material for lamination adhesives speeds up
curing significantly and laminates can be shipped and
filled after 2-3 days.
• Decreases process costs and reduces lead times at
packaging manufacturers
• As safe as currently used system, but significantly
faster curing
• We approach packaging manufacturers directly to accelerate
market launch
14
Plastic / Aluminum Interior Packaging Roll-to-roll Heat-dry XDI-Derivative
Success Factors
The Challenge
Our Solution

Specialty Films: Polycarbonate films
Providing a secure life with ID cards
High security in ID cards and passport documents
that can be manufactured and personalized efficiently.
Makrofol® ID Polycarbonate films provide highest level of forgery
protection and card durability.
This technology enables many security features, of which
some cannot be disclosed in public.
• Development of partnerships to optimize customer‘s
processes and card designs with high security features
• Best film quality and custom formats for reliable print
results, highest yields and simple handling
• Innovation in new films for card personalization and
customer productivity
15
Plastic Interior Packaging Roll-to-roll Oven-dry Films
Success Factors
The Challenge
Our Solution
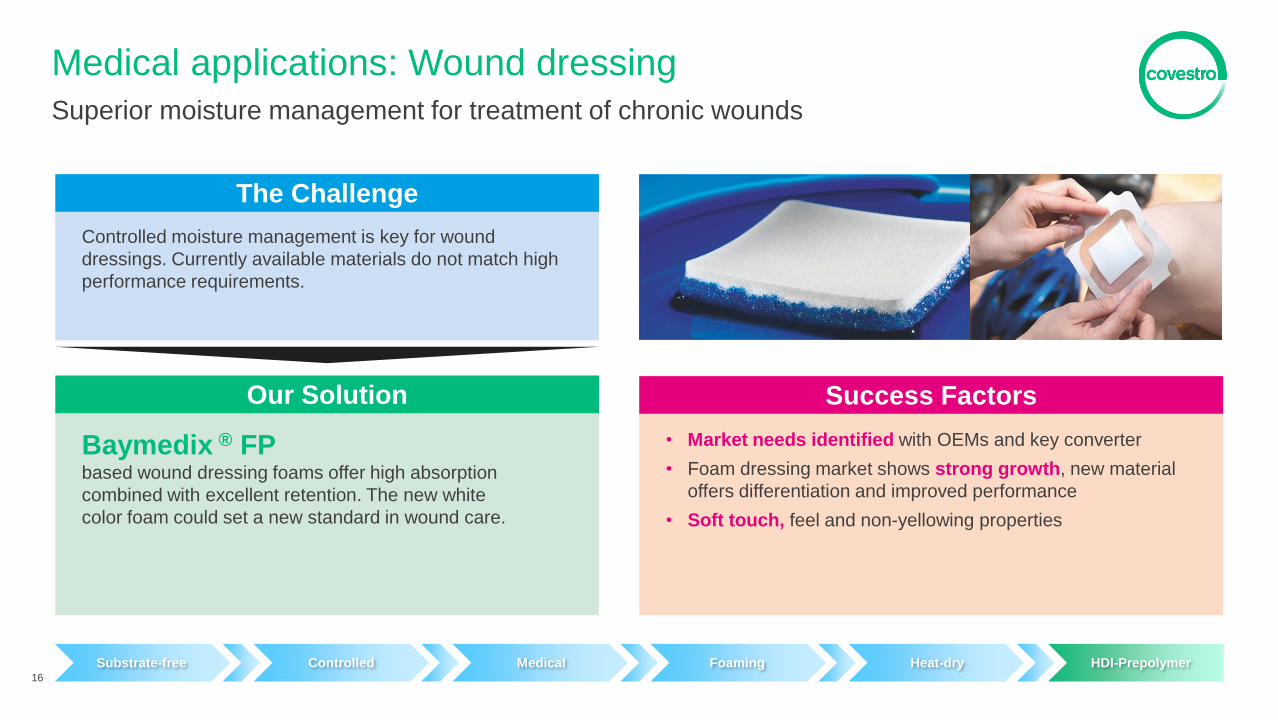
Medical applications: Wound dressing
Superior moisture management for treatment of chronic wounds
Controlled moisture management is key for wound
dressings. Currently available materials do not match high
performance requirements.
Baymedix ® FP based wound dressing foams offer high absorption
combined with excellent retention. The new white
color foam could set a new standard in wound care.
• Market needs identified with OEMs and key converter
• Foam dressing market shows strong growth, new material
offers differentiation and improved performance
• Soft touch, feel and non-yellowing properties
16
Substrate-free Controlled Medical Foaming Heat-dry HDI-Prepolymer
Success Factors
The Challenge
Our Solution

Cosmetics: Polyurethane solutions for hair care
Push polyurethane-based film formers as innovative ingredients
Film forming market is dominated by heritage polymers
such as acrylic polymers, etc. PUR-based polymers
represent a small market so far, but enable customers to
develop new and innovative product claims.
Baycusan® C1008 allows to design multifunctional hair care products with
superior aesthetics and long lasting performance,
customized for different hair types and needs. Major
benefits are flexible hold, heat protection, frizz control
and split end repair.
Covestro‘s polyurethane ingredients have enabled first product
launches at market leader such as Schwarzkopf Professional,
Brand Osis:
• Heat Protection Spray
• Anti-frizz Cream
17
Hair Alternating Cosmetics Spray Air-dry PU dispersion
Success Factors
The Challenge
Our Solution

Textile surfaces: INSQIN®
Inventing inspiring touches
The fashion and sportswear industry faces rising demand
for more sustainable materials.
INSQIN® enables eco-friendly production of synthetic materials,
improving worker safety, eliminating risks of environmental
pollution and needing up to 95% less water
and up to 50% less energy.
• Functionalities and effects bring new possibilities in design,
comfort, performance and manufacturing.
• Collaboration to integrate stakeholders along the
value-chain
• Partner Manufacturer Program to foster supply chain
transparency and good manufacturing practice
18
Textile Interior Automotive / Footwear / Furniture / Textile
Roll-over-knife Heat-dry PU dispersion
Success Factors
The Challenge
Our Solution

Reduce installation time and improve installation process
safety of power cables to ensure world class protection
through high performance elastomers in offshore wind
turbines.
Tailor-made Cast PU Elastomers Cast PU elastomers are the state of the art raw materials for
cable protection improving longevity and performance of
offshore windfarms.
• Product range with long term track record of high
performance in the marine environment
• Strong partnerships along the value chain
• Major decrease of installation time and costs for operators
• Covestro technologies with a vast amount of installed
references in the market
19
Controlled Off-shore Casting Reaction MDI-based system
Off-shore: Cast polyurethane elastomers for windfarms
Inventing sustainable systems for a challenging environment
Success Factors
The Challenge
Our Solution
Cast elastomer

New technology: Additive Manufacturing / 3D-printing
Inventing industrial 3D-printing
Existing Additive Manufacturing materials performance and
cost are currently not suitable for industrial applications.
Desmodur®, Desmopan®, Makrolon® will enable higher performance materials (improved
toughness, resistance, flexibility, optics, touch…) easily
tunable to meet application requirements.
Those materials can be fully integrated in a reliable
ecosystem to produce industrial parts.
• Sell filaments, powders and liquid resins designed for
Additive Manufacturing
• Create and manage ecosystem of partners to deliver
solutions to brands / OEM
• Actively build and manage IP portfolio
20
Success Factors
The Challenge
Our Solution
Controlled New technology Printing Crosslinking Urethane based Substrate-free

covestro.com
CAS Investment Highlights and Strategy

Shanghai Baytown
Leverkusen
7
Global set-up provides proximity to customers and markets
CAS global asset base
Selected customers Comments
• Active in selected countries
Development partners
• Global asset base
• Require global marketing and technical service
Global key accounts
• Important channel to markets
Distributors
• Three world-scale monomer production hubs in all key regions complemented by regional derivative plants
• Efficient production processes benefitting from low cost technology and integration
• Technical centers in all key regions ensure proximity to customers
• Superior technical support capabilities help to build long-term relationships
• Specialty films, elastomers and other specialties facilities allow to capture high growth in adjacent applications
• Global footprint provides for leadership in a fragmented industry across regions
Production Technical centers Specialties
22
Production
Technical centers
Specialties

Holding global leadership positions across entire portfolio
CAS positioning in the industry
Notes: (a) 2015A share of total volumes
Source: Orr & Boss, hot cast elastomers global position as per company estimates and volume share as per Orr & Boss analysis
PC films TPU films Elastomers
53% 47%
#1
83%
17%
80%
20%
#1 #1
82%
18%
81%
19%
90%
10%
CAS global position
Global industry landscape in derivative products(a)
Aliphatic isocyanate derivatives Aromatic isocyanate derivatives Polyurethane dispersions
Specialties
CAS volume share Others volume share
#1 #1 #1
23

10
High margin resilience over time demonstrates specialty nature
CAS financial performance
Note: (a) Defined as net sales proceeds less variable product costs per kg
24
Through the cycle production and profitability overview
• Value-add to customers and diversified application profile secures stable margins
• Gross margin driven by high value portfolio as well as low cost technology
Quantity (kt) Margin(a) (€ per kg)
Global crisis with V shape recovery
Competitor start up HDI APAC region
2009A 2008A 2010A 2011A 2012A 2013A 2014A 2015A

Growing portfolio-adjusted revenues and EBITDA margin
1,984
1,876 1,928 2,093 5.1%
(1.3)%
4.3% 2.7%
2012A 2013A 2014A 2015A
Sales Growth %
Net sales and core volume growth
Adj. EBITDA and margin
364 367 437
491
18.3% 19.6%
22.7% 23.5%
2012A 2013A 2014A 2015A
Adj. EBITDA Adj. EBITDA margin (%)
Core volume(a) growth (%)
Adj. EBITDA margin (%)
Net sales (€m)
Adj. EBITDA (€m)
25
CAS historical financial performance
Automotive / Transport
26%
Construction 14%
Wood & Furniture 11%
Footwear & Textiles
8%
Electrical & Electronic
5%
Others 36%
EMLA 50%
NAFTA 33%
APAC 27%
Sales split by
Sales split (%), 2015A
End-market
Region
Note: (a) Reference values until FY 2015 recalculated effective March 31, 2016. Main changes result from CAS portfolio adjustments.

Global industry leader with high and resilient profitability
CAS Key Investment Highlights
1 High-end solution provider to intrinsically complex customer industries
unlocking above-average growth potential
Market-driven innovation capability and customer proximity
help create new application space and maintain leadership 2
Global leading and defendable position
in an industry with distinct barriers to entry 3
Strong financial profile due to high margin resilience and low capex requirements
represent solid platform for future business expansion 4
26

covestro.com
Polyurethanes (PUR) Polyether polyols
MDI
TDI
PUR innovations
Summary

Inventor of and leader in polyurethanes
• Inventor and producer of polyurethane raw materials
and systems mainly for rigid and flexible foams(a)
• Broad portfolio spanning MDI and TDI (isocyanates)
and polyether polyols
• Competitive integration from feedstock to systems
• Global production platform comprising 18 facilities
located in Europe, the United States and Asia(b)
• Total production capacity of around 3,500kt globally
• Largest business unit generating half of Covestro sales
and around 40% of EBITDA
PUR at a glance
€6.1bn Sales 2015A
10.2% adj. EBITDA
margin 2015A
#1 Manufacturer of
PU globally(c)
50% of total Covestro
sales in 2015A
Comfort / Furniture
Upholstery
Construction
Metal Panel
Automotive
e.g. Instrument Panel
Cold Chain
Refrigerator
Innovation
Process Technology
Innovation
CO2-based polyether polyols
Notes: (a) As well as integral foam, semi rigid foam, RIM, TPU and CASE applications
(b) Includes all MDI, TDI and polyether polyols facilities that partially reside at one site; feedstock, TPU and systems houses are excluded
(c) Based on total combined nameplate capacity for MDI, TDI and polyether polyols in 2015A year end as per Covestro internal estimates
2
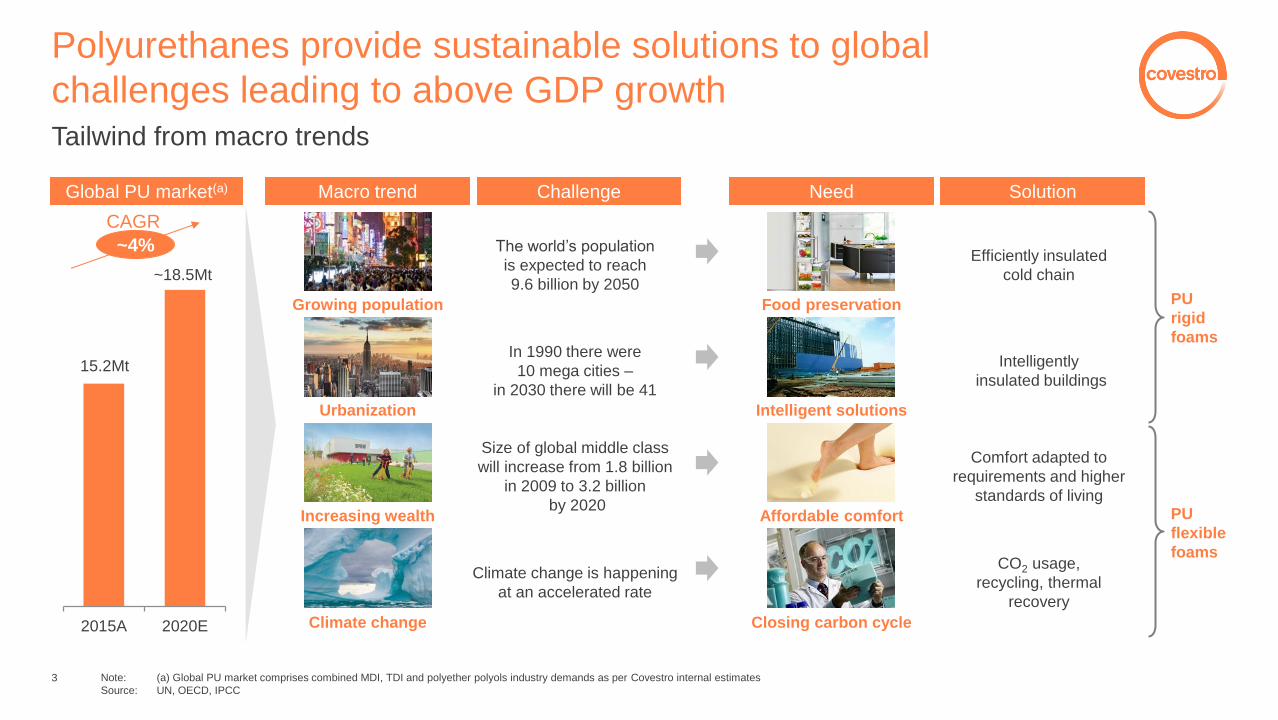
Polyurethanes provide sustainable solutions to global
challenges leading to above GDP growth Tailwind from macro trends
Macro trend Challenge Need Solution Global PU market(a)
2015A 2020E
~4%
CAGR
15.2Mt
~18.5Mt
Growing population
The world’s population
is expected to reach
9.6 billion by 2050
Food preservation
Efficiently insulated
cold chain
Urbanization
In 1990 there were
10 mega cities –
in 2030 there will be 41
Intelligent solutions
Intelligently
insulated buildings
Increasing wealth
Size of global middle class
will increase from 1.8 billion
in 2009 to 3.2 billion
by 2020 Affordable comfort
Comfort adapted to
requirements and higher
standards of living
Climate change
Climate change is happening
at an accelerated rate
Closing carbon cycle
CO2 usage,
recycling, thermal
recovery
PU
rigid
foams
PU
flexible
foams
Note: (a) Global PU market comprises combined MDI, TDI and polyether polyols industry demands as per Covestro internal estimates
Source: UN, OECD, IPCC
3

Polyurethanes in automotive – all-purpose material
with unique value propositions PU-based applications show structural growth above the automotive market(a)
• High performance materials for increased comfort
& ergonomics
• Lightweight, high productivity through short cycle
times
• Resin for Carbon Fiber Composite
• High performance material – substituting steel or
aluminum
• Freedom of design & Class-A surface quality
• Solutions for noise dampening, low density
interior parts
• Connecting high value surface with structural
support and offering
Seating Headliner Instrument Panel
Load Floor Car Body Parts Body Structure
Note: (a) Market growth CAGR 2010-2015: 4.6% for PU applications in automotive vs. 3.6% for total automotive
Source: Company information, LMC
4

Polyurethanes in cold chain – growth through energy
efficiency requirements and larger size units
• Stricter energy efficiency requirements support growth of PU as first choice
insulation material
• Larger interior space in refrigerators(b) through high performance PU insulation
• Mechanical properties of insulant support efficient usage of other materials (e.g.
thinner steel)
• Trend towards larger size units (e.g. side-by-side refrigerators) in the last decade:
PU-consumption increased from ~5kg/unit to ~8kg/unit
PU-based applications show significant structural growth above the refrigerator market(a)
Note: (a) Market growth CAGR 2010-2015: 7.2% for PU in refrigerators vs. 2.3% unit growth for total refrigerators
(b) Refrigerators include fridges, freezers and wine coolers
Source: Company information, Euromonitor, Nexant
5

Covestro is one of two global leaders with full scope advantage
as basis for innovation and growth
Industry structure and position
Size of bubble represents total MDI, TDI and polyether polyols
nameplate capacity (2015A)
Competitive position of key PU players (2015A)
• Full-spectrum chemistry scope allows for broad
solutions offering
• Global backbone in technical support and
production start-ups for customers
• Proximity to customers and customized blends
Full innovation
leverage
• Reliable supply out of large production facilities
globally
• Joint sales of polyols and isocyanates (“one-stop-
shop”) allow for economies of scope
• Offering of specialty polyol and isocyanate grades
Broad coverage
of customer
needs
• Optimized asset utilization at any point in the
industry cycle
• Broad geographical, customer & application
portfolio
• Niche applications with limited competition
Smoothened
cyclicality
Advantages of broad access play
Ge
og
rap
hic
foo
tpri
nt
Regional
Global
PU chemistry scope(a) Limited Full-spectrum
There are several
small local
producers of
individual
intermediates used
to manufacture PU
BASF
Wanhua
Dow
Huntsman
MCNS Tosoh
Vencorex
Covestro
Notes: (a) Excluding CASE
Source: Covestro internal estimates 6

Comfort/ furniture
30%
Construction 25%
Automotive 15%
Appliances 10%
Chemicals 10%
Others 10%
EMLA 43%
NAFTA 33%
APAC 24%
TDI c. 20%
Polyether polyols c. 40%
MDI c. 40%
Balanced business with attractive growth invested
for margin improvements PUR in numbers
Sales split by
Sales split (%), 2015A
End-markets
Strategic Business Entities
Adj. EBITDA and margin
Adj. EBITDA (€m) Adj. EBITDA margin (%)
Net sales and Core volume growth
Net sales (€m)
• EBITDA margin bottoming out in 2014; working on improving results
• Core volume growth outpaces turnover increase due to sales declining roughly in line with raw
material prices
• PUR asset base has been strengthened by more than €1.1bn capex in 2012–2015
Total sales: €6.1bn
Regions
724
639 592
624
12.1%
10.6% 9.4%
10.2%
2012A 2013A 2014A 2015A
adj. EBITDA adj. EBITDA margin
Core volume growth (%)
5,993 6,052
6,282 6,088
4.2% 3.1%
4.0%
1.8%
2012A 2013A 2014A 2015A
Net Sales Core volume growth
7

covestro.com
Polyurethanes (PUR) Polyether polyols
MDI
TDI
PUR innovations
Summary
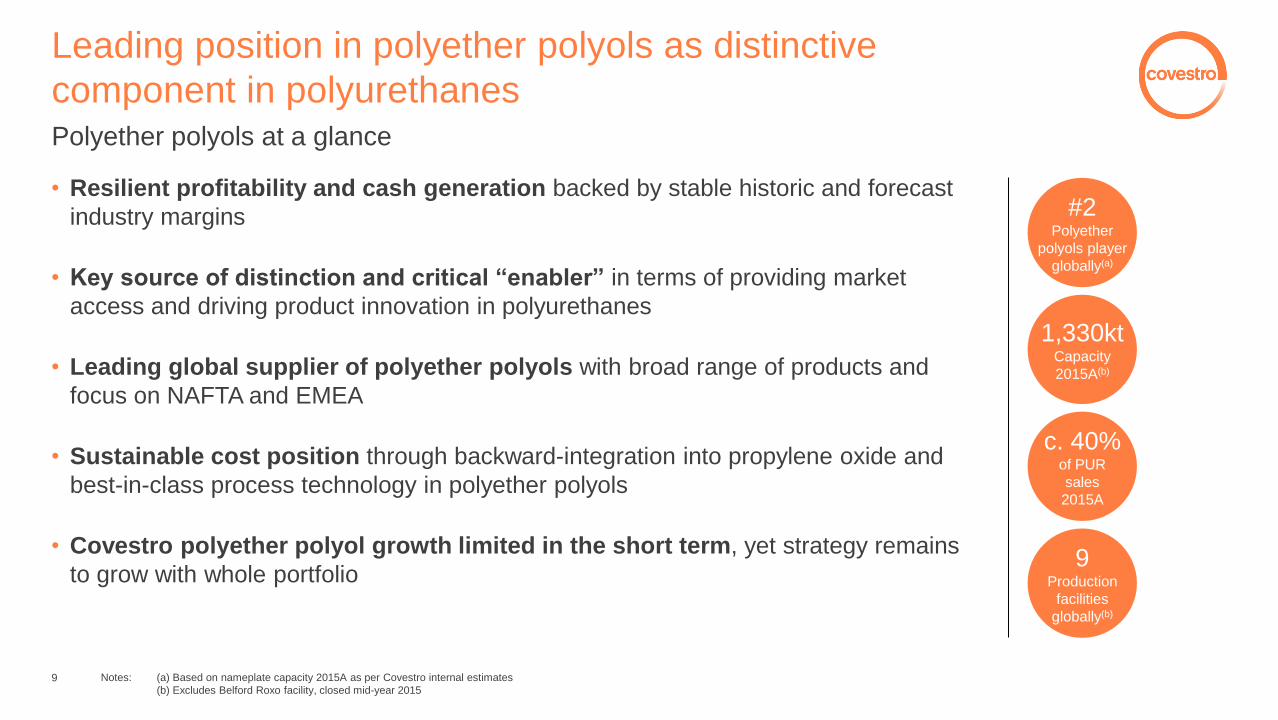
c. 40% of PUR
sales
2015A
9 Production
facilities
globally(b)
#2 Polyether
polyols player
globally(a)
1,330kt Capacity
2015A(b)
Leading position in polyether polyols as distinctive
component in polyurethanes Polyether polyols at a glance
• Resilient profitability and cash generation backed by stable historic and forecast
industry margins
• Key source of distinction and critical “enabler” in terms of providing market
access and driving product innovation in polyurethanes
• Leading global supplier of polyether polyols with broad range of products and
focus on NAFTA and EMEA
• Sustainable cost position through backward-integration into propylene oxide and
best-in-class process technology in polyether polyols
• Covestro polyether polyol growth limited in the short term, yet strategy remains
to grow with whole portfolio
Notes: (a) Based on nameplate capacity 2015A as per Covestro internal estimates
(b) Excludes Belford Roxo facility, closed mid-year 2015 9
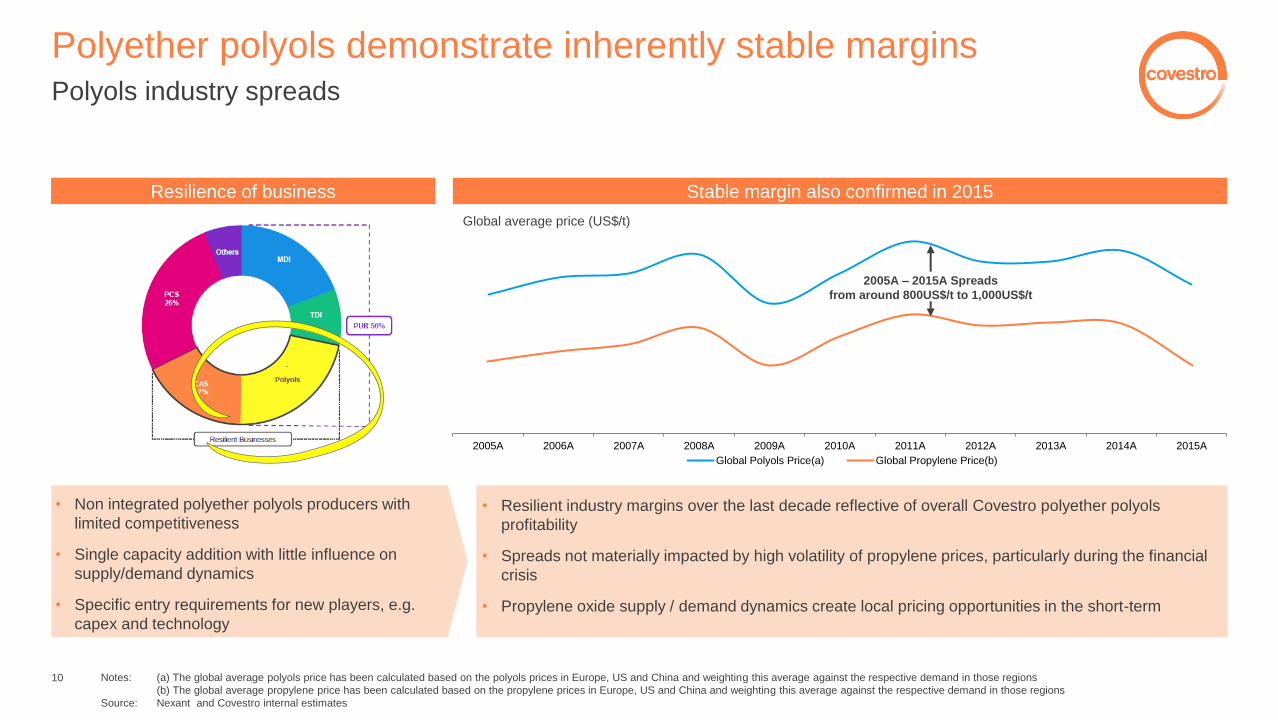
Polyether polyols demonstrate inherently stable margins Polyols industry spreads
Resilience of business
• Non integrated polyether polyols producers with
limited competitiveness
• Single capacity addition with little influence on
supply/demand dynamics
• Specific entry requirements for new players, e.g.
capex and technology
Stable margin also confirmed in 2015
2005A 2006A 2007A 2008A 2009A 2010A 2011A 2012A 2013A 2014A 2015A
Global Polyols Price(a) Global Propylene Price(b)
Global average price (US$/t)
• Resilient industry margins over the last decade reflective of overall Covestro polyether polyols
profitability
• Spreads not materially impacted by high volatility of propylene prices, particularly during the financial
crisis
• Propylene oxide supply / demand dynamics create local pricing opportunities in the short-term
Notes: (a) The global average polyols price has been calculated based on the polyols prices in Europe, US and China and weighting this average against the respective demand in those regions
(b) The global average propylene price has been calculated based on the propylene prices in Europe, US and China and weighting this average against the respective demand in those regions
Source: Nexant and Covestro internal estimates
2005A – 2015A Spreads
from around 800US$/t to 1,000US$/t
10
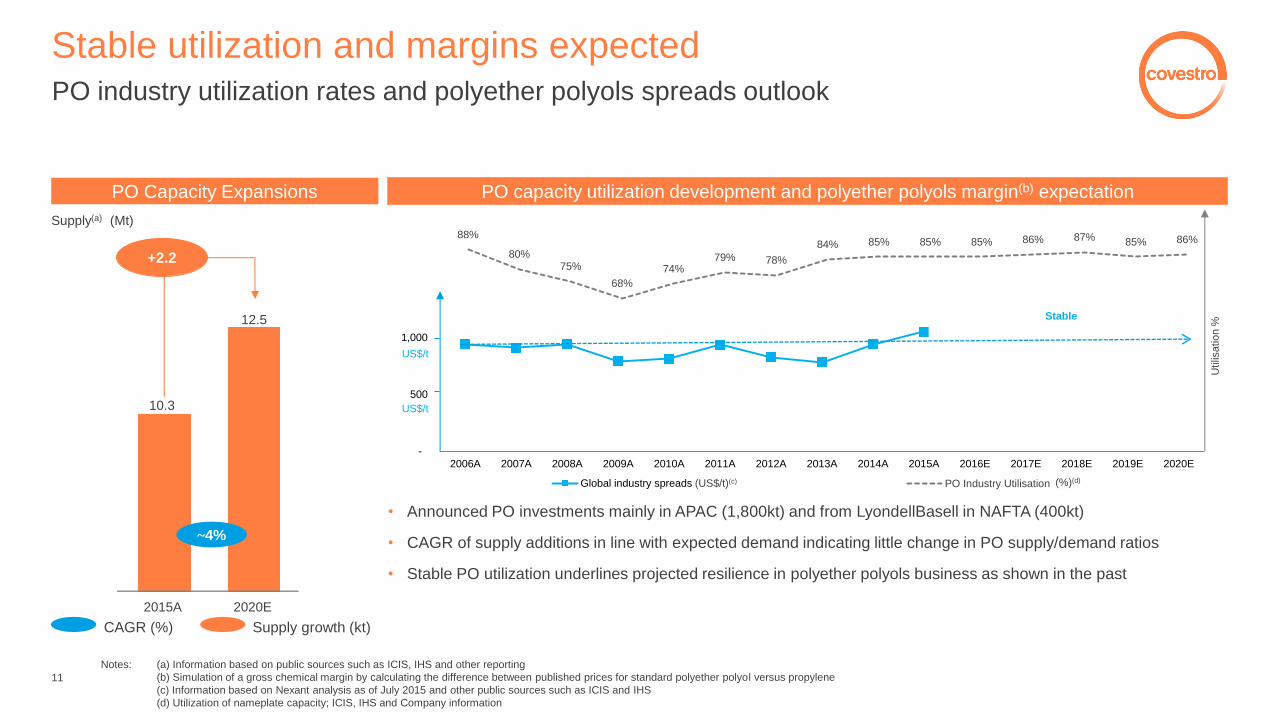
88%
80% 75%
68%
74% 79% 78%
84% 85% 85% 85% 86% 87% 85% 86%
PO Industry Utilisation
-
500
1,000
1,500
2,000
2006A 2007A 2008A 2009A 2010A 2011A 2012A 2013A 2014A 2015A 2016E 2017E 2018E 2019E 2020E
Global industry spreads
Stable utilization and margins expected PO industry utilization rates and polyether polyols spreads outlook
PO Capacity Expansions
Supply(a) (Mt)
+2.2
~4%
Supply growth (kt) CAGR (%)
10.3
12.5
2015A 2020E
PO capacity utilization development and polyether polyols margin(b) expectation
Stable
Utilis
atio
n %
US$/t
US$/t
• Announced PO investments mainly in APAC (1,800kt) and from LyondellBasell in NAFTA (400kt)
• CAGR of supply additions in line with expected demand indicating little change in PO supply/demand ratios
• Stable PO utilization underlines projected resilience in polyether polyols business as shown in the past
(%)(d) (US$/t)(c)
Notes: (a) Information based on public sources such as ICIS, IHS and other reporting
(b) Simulation of a gross chemical margin by calculating the difference between published prices for standard polyether polyol versus propylene
(c) Information based on Nexant analysis as of July 2015 and other public sources such as ICIS and IHS
(d) Utilization of nameplate capacity; ICIS, IHS and Company information
11

1.5 1.3
0.8 0.6
4.8
Dow Covestro Shell BASF Others
29% 27% 1%
71% 73%
99%
2.1
2.4
4.5
Americas EMEA APAC
Covestro global #2 producer with strong positions
in NAFTA and EMEA Polyether polyols positioning in the industry
• Polyether polyols landscape comprising 4 major players; Covestro is #2 producer globally with strong positions in NAFTA and EMEA
• APAC is highly fragmented based on a large merchant propylene oxide market; ~50 small producers(b) accounting for c. 20% share
• Higher margins and barriers to entry for the business model of propylene oxide backward-integrated polyols vs. stand-alone polyols business
• Key entry barriers: capital intensity, propylene oxide access, competitive polyols process technology; R&D and technical infrastructure
Polyether polyols industry capacity share by region(a) Top polyether polyols producers globally by capacity(a)
Capacity (Mt), 2015A Capacity (Mt), 2015A
Covestro
position #2 >#10 #2
Covestro Covestro Covestro
c. 15
other
players
c. 10
other
players
~60
other
players
Notes: (a) Based on nameplate capacity
(b) Producers with capacity <70kt p.a. each
Source: Covestro internal estimates
12

Competitive cost position through propylene oxide
backward-integration with strong partner Covestro joint venture with LyondellBasell
• Secure access of propylene oxide in Europe and US
• Producer cost economics vs. market price in a limited merchant market for propylene oxide
• US Propylene Oxide JV not exposed to propylene oxide co-product volatility (TBA / MTBE or Styrene monomer)
• COVESTRO exposed to styrene monomer co-product volatility out of EMEA joint venture
Key benefits to Covestro
LyondellBasell agreements
• US propylene oxide joint venture
− Started in 2000
− Long-term off-take of propylene oxide from JV plants
• EMEA propylene oxide Joint Venture
− 50 / 50 manufacturing JV for world-scale facility in Rotterdam
− Propylene oxide output used captively by Covestro as feedstock; sells styrene monomer in merchant market
13

Polyether polyols drive innovation to protect and
expand profitable competitive positions Role of polyether polyols in Covestro portfolio
Polyether polyols mixed with isocyanates lead to versatile applications
Average mix = 1mol MDI to ~0.7mol polyether polyols Average mix = 1mol TDI to ~2mol polyether polyols
Flexible foam Rigid foam
Bedding
• design and comfort driven mattress material
Furniture
• durable and supportive cushions
Automotive parts
• padding for auto seating
Automotive parts • strong, durable and light • noise and heat insulation
Cold chain • affordable temperature
preservation
Building insulation • space and energy efficient • flexible processing
14

covestro.com
Polyurethanes (PUR) Polyether polyols
MDI
TDI
PUR innovations
Summary
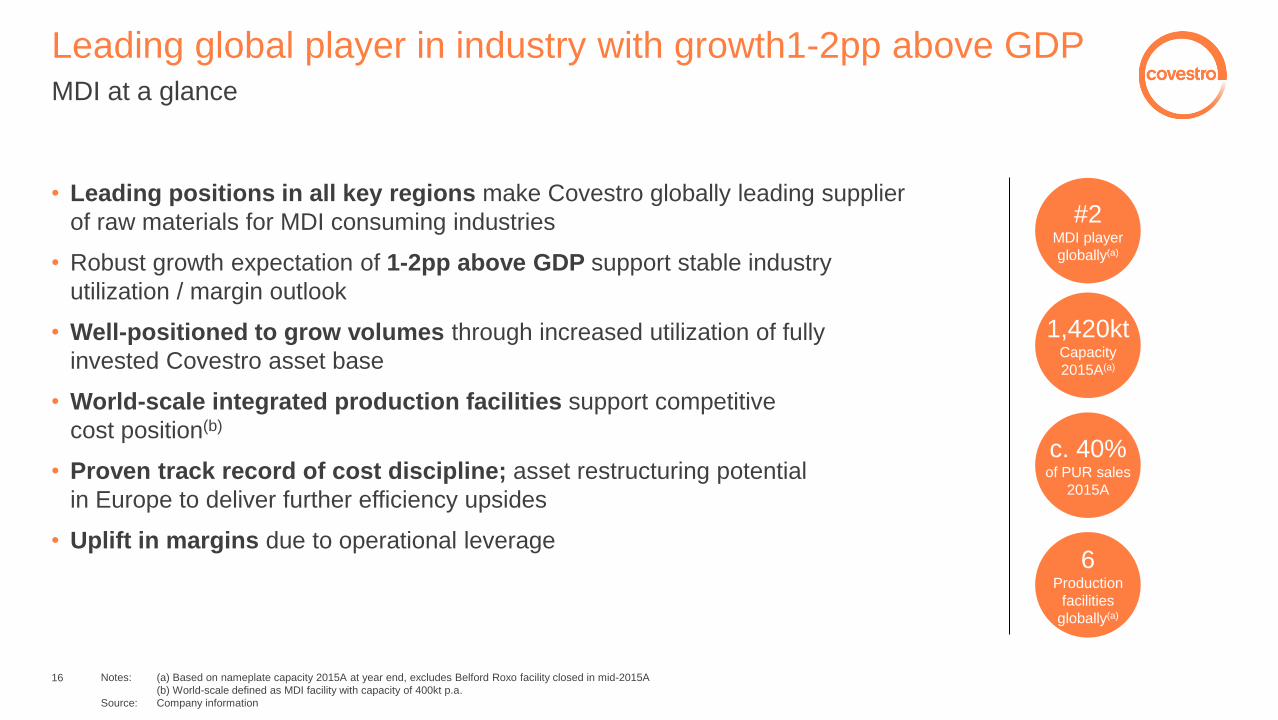
Leading global player in industry with growth1-2pp above GDP MDI at a glance
• Leading positions in all key regions make Covestro globally leading supplier
of raw materials for MDI consuming industries
• Robust growth expectation of 1-2pp above GDP support stable industry
utilization / margin outlook
• Well-positioned to grow volumes through increased utilization of fully
invested Covestro asset base
• World-scale integrated production facilities support competitive
cost position(b)
• Proven track record of cost discipline; asset restructuring potential
in Europe to deliver further efficiency upsides
• Uplift in margins due to operational leverage
1,420kt Capacity
2015A(a)
6 Production
facilities
globally(a)
#2 MDI player
globally(a)
c. 40% of PUR sales
2015A
Notes: (a) Based on nameplate capacity 2015A at year end, excludes Belford Roxo facility closed in mid-2015A
(b) World-scale defined as MDI facility with capacity of 400kt p.a.
Source: Company information
16

Diverse end-markets across all regions support
robust growth outlook MDI industry demand
Underlying application growth driver(a) MDI demand by region CAGR
2015A – 2020E
+5%
+3%
+5%
+3%
• Increase in global construction activity
‒ broader macro upturn
‒ high growth in emerging economies
• Growing demand for insulation foam to comply with
regional energy efficiency directives, particularly in
developed markets
• Higher consumption of appliances (refrigerators) in
developing regions
• Steady GDP-driven growth in other applications, e.g.
CASE, textiles and footwear
Construction ~5%
Appliances ~4%
CASE(b) ~4%
Others(c) ~4%
Demand ('000kt)
CAGR (%)
1.8 2.7 3.4
0.1
0.2
0.3
1.6
1.9
2.4 0.8
1.1
1.3
4.4
5.9
7.4
2010A 2015A 2020E
APAC LATAM EMEA NAFTA Spalte1
4-5%
6.4%
Notes: (a) Figures represent per annum growth between 2015A and 2020E
(b) CASE refers to coatings, adhesives, sealants and elastomers
(c) Others include applications such as flexible foams and polyurethane elastomer used in for example coated textiles and shoe soles
Source: Covestro internal estimates
17

5,350 5,710 5,920 6,170 6,640
7,180 7,450 8,010 7,960 7,960 7,960
4,350 4,650 5,020 5,360 5,710 5,920 6,180 6,450 6,740 7,050 7,370
81% 82% 85% 87% 86%
82% 83% 81% 85%
89% 93%
2010A 2011A 2012A 2013A 2014A 2015A 2016E 2017E 2018E 2019E 2020E
Industry Supply (kt) (a) Industry demand Global industry spread (US$/t) (b) Industry Utilization (%)(c)
Stable utilization and margins expected MDI industry utilization rates vs. spreads outlook
MDI spread over raw materials, MDI industry supply / demand and utilization
Stable
Industry Supply (kt) (a) Industry demand Global industry spread (US$/t) (b) Industry utilization (%) (c)
18
1,106 1,210
1,118 1,206
1,150 1,230
• MDI profitability generally at the lower end of the cycle; average annual increase 2015 vs. 2014 mainly stemming from H1 and NAFTA
• Spreads expected to remain low given the assumed slightly declining utilization rates
• At the end of the decade, potential upside expected
Notes: (a) Based on historical and announced future nameplate capacity based on Nexant & Covestro internal estimates
(b) Global average margin calculated based on margin over raw materials in Europe, US and China and weighting this average against demand in those regions
(c) Industry nameplate capacities as announced, divided by industry demand as per Covestro internal estimates, not adjusted for actual / physical market availability
Source: Company information

Leading cost position in US and China, efficiency
potential in Europe MDI regional industry cost curve
Covestro cost leadership through backward-integration
Western European leader with larger MDI and precursor capacity
Uerdingen more cost efficient relative to other Covestro facilities in Europe due to level of backward-integration and economies of scale
Chinese leader with larger backward-integration and different energy source
Shanghai ahead due to larger MDI train capacity and energy efficiency
North America
MDI Cash Cost(a)
Western Europe
MDI Cash Cost(a)
Asia
MDI Cash Cost(a)
Covestro Baytown North American Follower North American Laggard
A
WesternEurope Leader
CovestroUerdingen
CovestroBrunsbüttel
CovestroTarragona
West EuropeanLaggard
B C
Chinese Leader Covestro Shanghai Chinese Laggard Other North EastAsian Leader
D E
A
B
C
D
E
Note: (a) Cost of production based on total raw material costs less co-product credits, utility costs, direct fixed costs and allocated fixed costs at specific level of utilization based on Covestro internal estimates
Source: Company information 19

• Shutdown in
New Martinsville
• Investment
in Shanghai
• De-bottle-
neckings
• Restructuring
Japan
• Belford Roxo
exit 2015
• EMLA
restructuring
potential
Competitive cost position through continuous efficiency
improvements Covestro asset efficiency
Track record of improving cost position in MDI
EMEA restructuring potential
• Operation stop in MDI Tarragona planned for 2017
• Stop of chlorine supply driven by phase out of Mercury cell
based chlorine production
• Possible re-usage of idle TDI infrastructure and precursors in
Brunsbuettel would enable economic doubling of MDI capacity
by 200kt p.a.
Closure of Belford Roxo, Brazil
• Operations discontinued since July 2015
• Decision driven by relative cost competitiveness vs. other
production sites
Covestro global average MDI cash costs driven by structural and technology improvements
without benzene(a)
2005A 2008A 2015A 2020E TARGET
Note: (a) Covestro global average MDI production cash costs without benzene at uniform currency, labor and energy / feedstock prices based on management information
20

covestro.com
Polyurethanes (PUR) Polyether polyols
MDI
TDI
PUR innovations
Summary

c. 20% of PUR sales
2015A
3 Production
facilities
globally
#2 TDI player
globally(a)
720kt Capacity
2015A(a)
Global leader in long-term growth industry TDI at a glance
• Leading producer of raw materials for TDI consuming industries globally with
leading positions in all major regions
• Demand growth above GDP driven by all key end-markets and regions,
particularly APAC
• TDI margins currently at the bottom of the cycle due to significant
overcapacities
• Superior cost position through backward-integration, proprietary gas-phase
technology and world-scale, integrated asset base(b)
• Cost savings and increased profitability out of restructuring of European asset
base
• Growth into recently expanded world-scale asset base and eventual recovery
of margins expected to deliver uplift in financials
Notes: (a) Based on nameplate capacity 2015A, year-end
(b) World-scale defined by company assessment as TDI facility with capacity of 250kt p.a.
Source: Company information, Nexant
22

Underlying application growth driver(a) TDI demand by region CAGR
2015A – 2020E
Growth above GDP driven by all key end-markets
and regions TDI industry demand
+4%
+1%
+4%
+3% • Solid growth across all major end-uses
• Higher consumption of mattresses and furniture by
emerging middle class in developing regions
• Ongoing recovery of global automotive industry with
rising car production and increased demand for new cars
due to solid economic growth
• Favourable substitution trends in CASE(b)
owing to relative advantages vs. competing materials
Bedding ~3%
Furniture ~3%
Automotive ~3%
CASE(b) ~4%
CAGR (%)
0.8 1.0
1.2
0.1
0.2
0.2
0.6
0.7
0.9
0.3
0.3
0.4
1.9
2.3
2.7
2010A 2015A 2020E
APAC LATAM EMEA NAFTA 2
3-4%
3.9%
Demand ('000kt)
23
Notes: (a) Figures represent per annum growth between 2015A and 2020E
(b) CASE refers to coatings, adhesives, sealants and elastomers
(c) Others include applications such as flexible foams and polyurethane elastomer used in for example coated textiles and shoe soles
Source: Covestro internal estimates

1,621
1,165 1,252 1,230 1,185 1,144
2,100 2,170 2,540 2,640 2,650 2,750 2,700 2,860
3,160 3,220 3,220
1,860 1,940 2,060 2,150 2,240 2,250 2,320 2,400 2,490 2,580 2,670
88% 90%
81% 82% 85%
82% 86% 84%
79% 80% 83%
2010A 2011A 2012A 2013A 2014A 2015A 2016E 2017E 2018E 2019E 2020E
Industry supply (kt)(a) Industry demand (kt) Global industry spreads (US$/t)(b) Industry utilization (%) ©
TDI margins currently at the bottom of the cycle due to
significant overcapacities
TDI industry utilization rates vs. spreads outlook
TDI spread over raw materials, TDI industry supply / demand and utilization
• H2 pressure on industry margins to remain, owing to wave of new capacity resulting in bottom of cycle conditions
• Improvement from 2018E onwards, consistent with higher utilization rates
‒ margin recovery may be volatile based on levels of competition and plant availabilities
• Possible upside from potential capacity exits / delays as near-term pressure weighs on higher cost producers
“bottom of the cycle“
Industry supply (kt) (a) Industry demand Global industry spread (US$/t) (b) industry utilization (%) (c)
Notes: (a) Based on historical and announced future nameplate capacity additions based on Nexant & Covestro internal estimates
(b) Global average margin calculated based on margin over raw materials in Europe, US and China and weighting this average against respective demand in those regions
(c) Industry nameplate capacities as announced, divided by industry demand as per Covestro internal estimates, not adjusted for actual / physical market availability
Source: Company information
24

Combination of scale, integration and technology provides
global cost leadership TDI regional industry cost curve
Covestro Baytown North American Follower
A
Covestro Dormagen Western Europe Follower West European Laggard
B
Covestro Shanghai Chinese Follower Other North East AsianLeader
C
Covestro cost leadership through backward-integration
Covestro advantages from superior process technology
Raw material integration and process technology advantages driving superior cost position for Covestro
North America
TDI Cash Cost(a)
Western Europe
TDI Cash Cost(a)
Asia
TDI Cash Cost(a)
A
B
C
Notes: (a) Cost of production based on total raw material costs less co-product credits, utility costs, direct fixed costs and allocated fixed costs at specific level of utilization based on Covestro internal estimates
Source: Company information 25

covestro.com
Polyurethanes (PUR) Polyether polyols
MDI
TDI
PUR innovations
Summary

Meeting fire classification standards in building and
construction industry.
Reliable, high speed continuous processing.
Improved product and process
technology Combination of new processing tool (Fixed Plastic
Distribution Rake) with tailor made formulation.
• Enabling improved processing of metal panels
• Improved product meeting the demanding European fire
standards
Construction: Improved product and process technology
Levering processing know-how and polyether development
Success Factors
The Challenge
Our Solution
27

Reducing energy consumption in refrigerators and improving
production efficiency.
Baytherm® Microcell High energy efficiency at lower costs
This enables better thermal insulation e.g. in refrigerators,
meaning chilled items inside stay fresh longer
• Increase presence in PU insulation, i.e. building,
construction and cold-chain
• 20% finer cells for 5% better insulation
• Optimized curing for 10% improved productivity
Appliances: Micro polyurethane insulation foam
A better cold chain with effective insulation performance
Success Factors
The Challenge
Our Solution
conventional today
28

• Reduce the carbon footprint
• Make CO2 react …! (the catalyst quest)
• Find an alternative carbon source!
Polyether polyols made of carbon
dioxide New technology developed to use CO2 as alternative building
block for polyether replacing a proportion of the petrochemical
precursors.
• Overcomes key industry challenges and provides superior
technology in core of polyurethanes
• Reduced carbon footprint
• Replaces petrochemicals
• Performance of end-products unimpaired
• Driver of potential polyether polyols growth in mid-term
Next generation polyols
Polyether polyols made of carbon dioxide
Success Factors
The Challenge
Our Solution
29

The wind industry’s main target is still the reduction of the cost
of wind power to achieve parity with fossil fuels.
Polyurethane for wind turbine rotor
blades Replacing Epoxy resins by PU resins in blades or large blade
parts
• faster production processes
• increased performance
• Polyurethane system design leading to superior processing
behavior and material properties:
better fracture toughness, faster infusion and lower
cycle times than current solutions.
• International certification(a) achieved
Construction: Process technology
Polyurethane for wind turbine rotor blades
Success Factors
The Challenge
Our Solution
Notes: (a) DNV GL: Det Norske Veritas and Germanischer Lloyd – a leading international industry standard for the safety, reliability and performance of wind turbines 30

Meeting fire classification standards in building and
construction industry.
Polyurethane rigid foam with improved
resistance to fire Breakthrough to non-combustibility leading to broader
accessible market
• Introduction of new chemistry for enhanced flame
retardancy in construction insulation
• Starting with best-in-class PU fire performance
Construction: New molecules for better flame retardancy
New polyurethane rigid foam for enhanced flame retardancy
Success Factors
The Challenge
Our Solution
31

covestro.com
Polyurethanes (PUR) Polyether polyols
MDI
TDI
PUR innovations
Summary
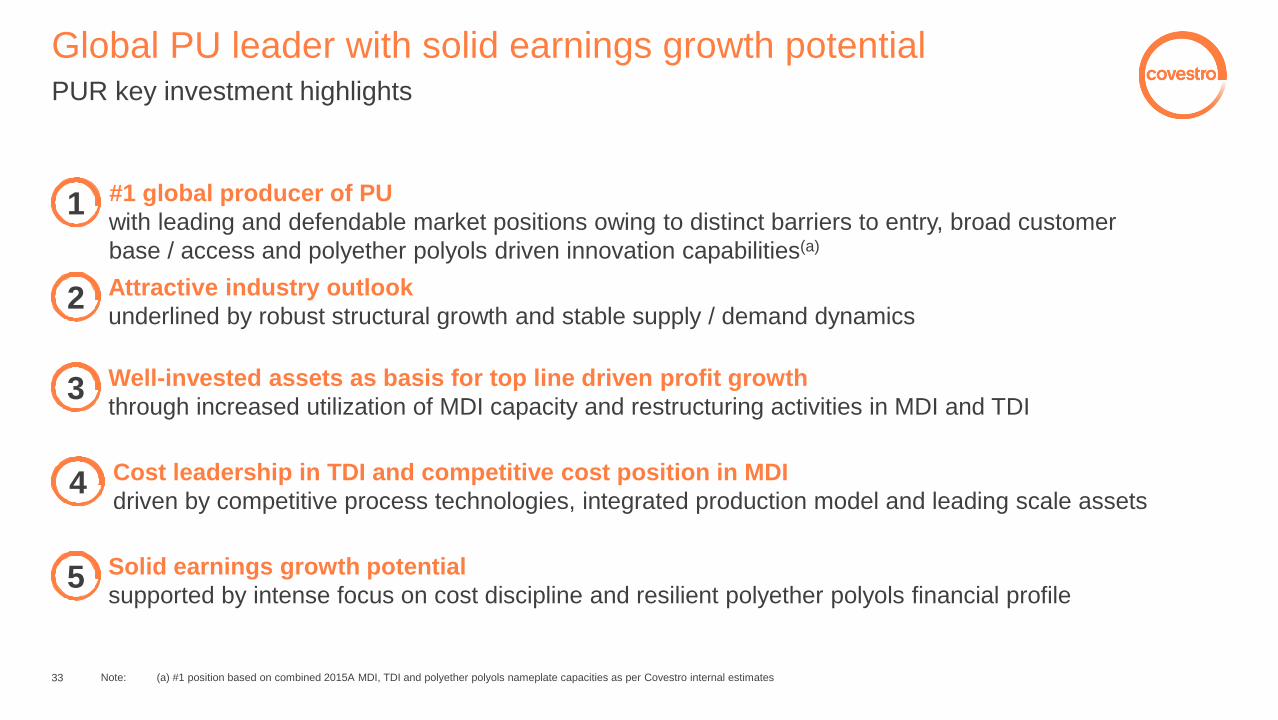
1 #1 global producer of PU
with leading and defendable market positions owing to distinct barriers to entry, broad customer
base / access and polyether polyols driven innovation capabilities(a)
5 Solid earnings growth potential
supported by intense focus on cost discipline and resilient polyether polyols financial profile
Global PU leader with solid earnings growth potential PUR key investment highlights
Attractive industry outlook
underlined by robust structural growth and stable supply / demand dynamics 2
Well-invested assets as basis for top line driven profit growth
through increased utilization of MDI capacity and restructuring activities in MDI and TDI 3
Cost leadership in TDI and competitive cost position in MDI
driven by competitive process technologies, integrated production model and leading scale assets 4
Note: (a) #1 position based on combined 2015A MDI, TDI and polyether polyols nameplate capacities as per Covestro internal estimates 33

covestro.com
Polyurethanes (PUR) Backup

Polyether polyols drive innovation to protect and
expand profitable competitive positions Role of polyether polyols in Covestro portfolio
Role in the Portfolio Covestro Production Chain
• Versatile Polymer structure thus key performance enabler for final
polyurethane products.
• Multiple options in the built up of the chemical structure is driving innovation
• Broad product portfolio for tailored solutions thus broader application and
customer base.
• Corner stone in the PUR portfolio for broad access to market and customers.
Propylene Propylene
oxide
by-product
styrene
Polyether
polyols 1,330kt
~350kt
840kt
Purchased raw-material Contracts & JV activities Covestro activities
Propylene
oxide
35

Top 5 87%
Others 13%
Top 5 90%
Others 10%
Top 5 93%
Others 7%
Strong Covestro industry position supported by distinct
entry requirements MDI barriers to entry
Global capacity by producer
2015A
2005A
2020E
Industry
Capital intensity
• Considerable investment required to develop world-
scale plants(a)
‒ US$1.2 – 1.3bn (+ / - 30%)
‒ 3 – 4 years to full operation
• Well-invested, large- to world-scale
asset base
• Economies of scale
• Total capacity 1,420kt(b)
Process technology • State-of-the-art technology along the process chain
vital
• Competitive process technology
• Cost leader in NAFTA and advantageous position in
Asia
• Restructuring potential in EMLA
Feedstock integration • Long-term supply contracts for precursors standard
• Backward-integration as major value lever
• Favorable backward-integration and long-term
contracts
• Access to systems houses where required by
industry
Technical capabilities
and expertise
• Systems demanding greater knowledge and
expertise
• Permits required to handle hazardous feedstock,
e.g. phosgene
• Superior expertise and know-how in application
development and customer insight
• Reputation cemented through 60+ years experience
Proximity to markets • Importance of proximity to markets
• Global asset base critical to support ambitions of
global customer base
• Diverse, global footprint
• Plants in all core regions
• Ability to service all key areas of demand
Covestro position
Notes: (a) World-scale defined as MDI facility with capacity of 400kt p.a.
(b) Based on nameplate capacity 2015A at year end, excludes Belford Roxo facility closed in mid-2015A
Source: Covestro internal estimates
36

Well-positioned production network to
supply customer demand globally Covestro MDI operations
• Nameplate capacity: 460kt(a)
• Start of production: 2006
Shanghai, China
• Nameplate capacity: 200kt
• Start of production: 1988
• Economic expansion to 400kt
p.a. possible based on
existing TDI infrastructure and
precursors
Brunsbüttel, Germany
• Nameplate capacity: 200kt
• Start of production: 1964
• Expansion in 2002
• EMEA facility with focus on
specialties production
Uerdingen, Germany
Shanghai, China
Pittsburgh, PA, USA Tarragona, Spain
Leverkusen, Germany
Niihama, Japan
Amagasaki, Japan
• Nameplate capacity: 70kt
• Start of production:
MDI-1 1978, MDI-2 1995
• Covestro has 60% JV share
of Sumika Bayer Urethane
• 2010 shutdown of older MDI
train
• Nameplate capacity: 55kt
• Start of production: 1983
• Operations discontinued
since July 2015
Belford Roxo, Brazil
• Nameplate capacity: 320kt
• Start of production: 1974
• Continuous investments into
increased reliability
• Nameplate capacity: 170kt
• Start of production: 1971
• Operation stop planned end
of 2017
Baytown, TX, USA
Covestro Innovation
Centers
Covestro MDI Facility
Notes: All nameplate capacities based on 2015A
(a) Excluding potential additional nameplate production capacity of 40kt once fully ramped up and subject to potentially necessary investments; only to be performed if backed by additional market demand 37

Top 5 76%
Others 24%
Top 5 74%
Others 26%
Top 5 68%
Others 32%
Strong Covestro position safeguarded by distinct entry
requirements plus state-of-the-art GPP technology TDI barriers to entry
Industry Global capacity by producer Covestro position
2015A
2005A
2020E
Capital intensity
• World-scale plant(a) requires:
‒ >US$1bn investment in full train
‒ 3 – 4 years to full operations
• 3 large- to world-scale production facilities and
total capacity of 720kt
• Benefits from economies of scale
Process technology • Advanced technology along the process chain
important particularly in high cost locations
• Limited options for licensing
• State-of-the-art gas-phase phosgenation (GPP)
technology leading to global cost leadership(b)
‒ highly cost efficient and
eco-friendly
Feedstock integration • Supply contracts as standard option
• Backward-integration advantageous
• Favorable backward-integration and long-term
contracts
Technical capabilities and
expertise
• Permits required to handle hazardous feedstock,
e.g. phosgene
• Track record and suitable infrastructure important
• World-class expertise and know-how in
customer-centric application development
• Proven reputation with 60+ years experience
• Impeccable safety record
Proximity to markets • Benefits for established global players
• Required to service large-scale multi-nationals with
diverse operations
• Global footprint and customer insight
• Facilities in all core regions
Notes: (a) World-scale defined by company assessment as TDI facility with capacity of 250kt p.a
(b) Covestro global cost leadership position as per company estimates
Source: Company information
38

Ongoing European efficiency program to further enhance
quality of existing world class assets Covestro TDI operations
• Nameplate capacity: 250kt
• Start of production: 2011
• Technology used: Features
new Covestro Gas-Phase
Phosgenation
• Cost leader in APAC and
well-positioned to capture
strong demand in Asia
Shanghai, China
• Nameplate capacity: 125kt
• Start of production: 1977
• Technology used: Liquid-
Phase Phosgenation
• TDI production shut down in
2015A
Brunsbüttel, Germany
• Nameplate capacity: 250kt
• Start up beginning 2015
• Technology used: Features
new Covestro Gas-Phase
Phosgenation
• Cost leader resilient to new
capacity additions in EMEA
Dormagen, Germany
Covestro TDI Facility Covestro Innovation Centers
Shanghai, China
Leverkusen, Germany
Amagasaki, Japan
• Nameplate capacity: 220kt
• Start of production: 2000
• Technology used: Liquid-
Phase Phosgenation
• Serves both US and non-US
markets
Baytown, TX, USA
Pittsburgh, PA, USA
Notes: All nameplate capacities based on 2015A 39

covestro.com
Polycarbonates (PCS)

Global leading producer of polycarbonates serving
key growth end-markets
2
• Inventor of polycarbonates and joint global leader in polycarbonates together with SABIC
• Offers products and solutions for a wide range of applications
• Optimally integrated production processes along the value chain
• Global platform with 5 production sites, 5 R&D centers, 7 compounding centres with business unit headquarters in Shanghai, China
• Total current primary production capacity of around 1,300kt
• Upswing in industry margin level, as a result of increasing industry utilization rates
PCS at a glance
Joint #1
Producer of
PC globally(a)
€3.2bn Sales 2015A
17.7%
Adj. EBITDA
margin
2015A
26% of total
Covestro
sales 2015A
Construction
Stadium Roofing Electronics
Laptop housing
Consumer Products Robot
Housing
Mobility
Automotive Glazing
Information Technology
LED Street Lamp Medical
Dialyzer Housing
Notes: (a) Together with SABIC, as per Covestro internal estimates

Positioning and access to customers is key
3
PCS global asset footprint and world-scale plants(a) in all key regions
Shanghai, CHN
Guangzhou, CHN
Map Ta Phut, THA
Amagasaki, JP
Seoul, KOR
Global PCS Headquarter
APAC Head Office
Busan, KOR
Greater Noida, IND
Antwerp, BEL
Leverkusen, GER
EMEA & LATAM Head Office
Tielt, BEL
Filago, ITA
Nera Montoro, ITA
Uerdingen, GER
Baytown, TX
Pittsburgh, PA
Sheffield, MA
Newark, OH
NAFTA Head Office
Primary production plants
• Production of polycarbonate resin for either
external sales or internal feedstock for
compounding and sheet plants
• Refinement of polycarbonate resin with color
and/or other additives (e.g. ABS)
• Color matching, technical service and small-scale
production capabilities
Compounding plants
• Production and sales of solid sheet in all regions
and multi-wall sheet in EMEA and APAC
Sheet plants
Polycarbonate resin production
Polycarbonate sheet companies
Compounding plants
Innovation center
Business development center
Process research center
Note: (a) Defined as a plant consisting of single lines with capacities of 100kt or more each

Polycarbonates (PC) Key PC properties Key applications
• Medical devices
• Robotics
• Personal safety (helmets, headgear, eyewear)
• Packaging (water bottles, pitchers)
• Automotive interior & exterior panels
• Bodywork parts
• Lighting systems
• Glazing
• Outer door panels
• Radiator grills
• Windows
• Conservatories
• Roof structures
• Partition walls
• IT equipment
• Housing for mobile devices & consumer electronics
• Chargers
• Switchbox and other electrical systems • Diffusion panel of LCD monitors
• LED parts
Break-resistant
Lightweight
Transparent
High dimensional stability
Heat-resistant
High flame retardance
High impact strength
Electrical insulation
Resins:
Makrolon©
Bayblend©, Apec©, Makroblend©
Sheets
Composites
Engineering thermoplastics with a unique combination of
properties serving numerous industries
4

Strong growth and margin improvement in 2015 driven by higher
industry utilization
5
PCS historical financial performance
• Sales in 2015 rose by 12.4% against prior year to €3,172 million. Shifts in
exchange rates had a positive effect on sales.
• Core volume growth amounted to 5.1%. The expansion in volumes added
4.6% overall to sales. Sales improved in all three regions, due especially to
higher demand from the automotive industry.
• Both the movement in exchange rates and higher volumes had a positive
impact on sales, outweighing the effect of lower selling prices.
• Adjusted EBITDA in 2015 increased to €560 million and adjusted EBITDA
margin to 17.7% in 2015.
• This increase resulted from a more favorable supply and demand situation
that enabled us to improve our margins and generate pricing advantages.
2,822 2,645 2,822 3,172
3.0% (3.2)%
9.0% 5.1%
2012A 2013A 2014A 2015A
Sales Growth %
Net sales and core volume growth
Adj. EBITDA and margin
185
94 160
560
6.6% 3.6%
5.7%
17.7%
2012A 2013A 2014A 2015A
Adj. EBITDA Adj. EBITDA margin (%)
Core volume growth (%)
Adj. EBITDA margin (%)
Net sales (€m)
Adj. EBITDA (€m)

Material, application, and production know-how ensure
leading market access and development
First choice development partner
for leading OEM, Tier-1 and
Tier-2 component suppliers, as
well as for design houses
Cutting-edge material and process
innovation at value based cost
Global footprint
6
Cu
sto
mer
need
s
Co
vestr
o s
olu
tio
n
Customer requirements
Material & concept development
New application technologies
Scale up & customer production
Customer product development
• Optimized manufacturing process • Specialized material solutions • Global competitive offerings • Distinctive automotive interior
design
Premium interior solutions with
best-in-class product & technology
portfolio
Support across the whole value
chain
Combination of best-in-class
expertise in thermoplastics and
polyurethane technologies
Reduction of cost and complexity
Innovative polycarbonate grades,
e.g. for transparent and
translucent ambient lighting
New designs for lifestyle colors,
surface decoration and soft touch
and feel
Premium Automotive Interior Door Trim Strip with Backlight Part Manufacturing Process Commercial Production

2.7
0.7 0.4 0.2
0.8 1.0 1.3
0.5 0.5 0.6
0.5 0.6
0.9 0.5
0.7
1.0 0.5
0.6
0.7
2005A 2010A 2015A 2020E
Optical Media Consumer, Appliance, Medical, Packaging Construction Automotive Electrical Electronics
Macro trends support above GDP demand growth across diverse
customer industries and regions
7
Polycarbonates industry demand
Accelerated growth 2015A-2020E Polycarbonates by application CAGR
2015A – 2020E
Selected examples for continuous upgrades, substitutions and new
application developments:
Upgrade to “smart” electronics and new device class, e.g. smartphones
/ TV
New revolutionary technologies, e.g. wearable computing and sensors,
service robots
Penetration of LED luminaires
Upgrade of automotive interior and exterior
Medical device applications, e.g. disposable surgical instruments and as
glass substitutes
(Mt) CAGR 2015A-2020E
Underlying drivers
GDP 2.6%
GDP ~3%
GDP 2.8%
5.6%
3.4%
~4% % CAGR APAC ~5%
EMEA ~2%
NAFTA ~3% +3%
+7%
+6%
+3%
+4%
-8%
Source: Covestro internal estimates
3.5 3.8
4.7

World polycarbonate demand
Mt, 2000A – 2020E
Compensate ODS Rise of ODS Growth in future products Fin. Crisis
ODS demand of PCS
PCS demand (excl. ODS)
2000A – 2007A 2008/09A 2010A – 2013A 2014A – 2020E
2015A
Source: Company information
Development of diverse applications drives the demand of PC
8
• Optical Data Storage decline not affecting anymore the business set-up & overall market performance
• Future demand drivers coming from new applications
Polycarbonates industry demand
Supply of PCS
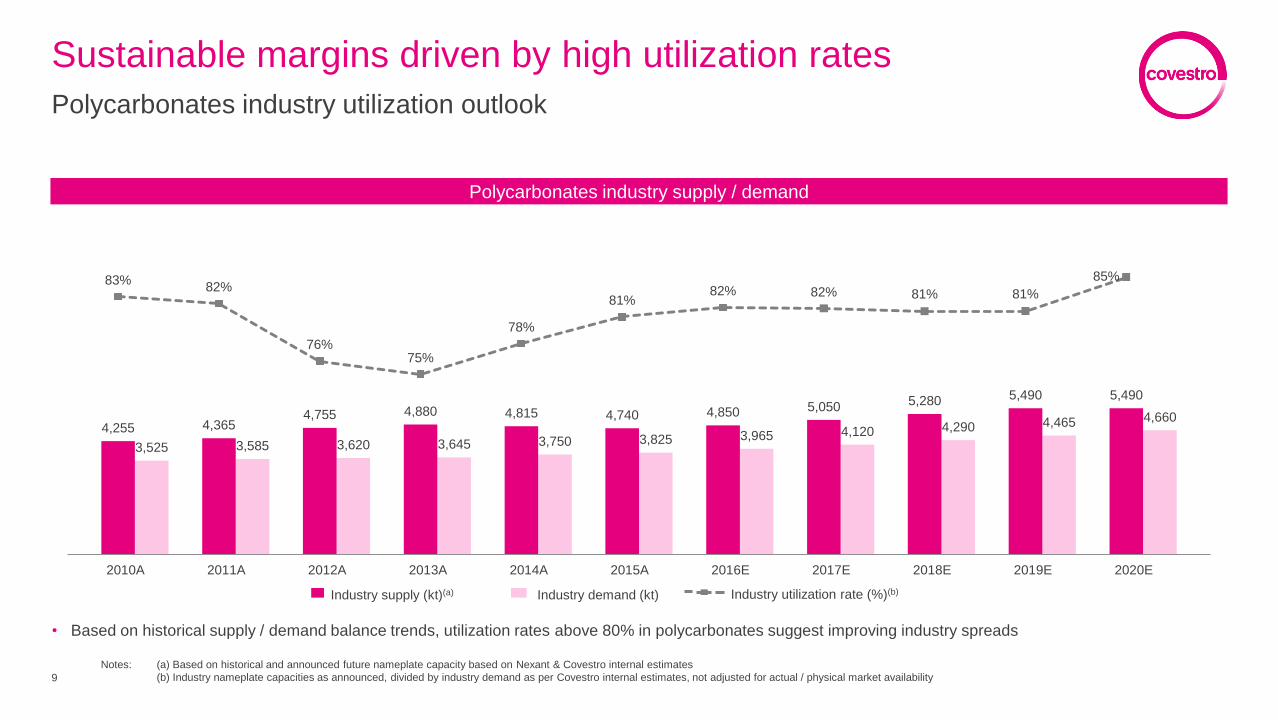
3,525 3,585 3,620 3,645 3,750 3,825 3,965 4,120 4,290 4,465 4,660 4,255 4,365
4,755 4,880 4,815 4,740 4,850 5,050 5,280 5,490 5,490
83% 82%
76% 75%
78%
81% 82% 82% 81% 81%
85%
2010A 2011A 2012A 2013A 2014A 2015A 2016E 2017E 2018E 2019E 2020E
Sustainable margins driven by high utilization rates
9
Polycarbonates industry utilization outlook
Industry supply (kt)(a) Industry demand (kt)
• Based on historical supply / demand balance trends, utilization rates above 80% in polycarbonates suggest improving industry spreads
Polycarbonates industry supply / demand
Industry utilization rate (%)(b)
Notes: (a) Based on historical and announced future nameplate capacity based on Nexant & Covestro internal estimates
(b) Industry nameplate capacities as announced, divided by industry demand as per Covestro internal estimates, not adjusted for actual / physical market availability

APAC 40%
EMLA 36%
NAFTA 24%
Broad access to customer applications and regions allows for
optimized risk distribution and asset utilization
10
Covestro positioning in the industry
Broad
range
Narrow
range Local
footprint
Global
footprint
Bre
adth
of
applic
atio
ns s
pectr
um
Positions in the industry(a)
Regional small
producers / compounders /
blenders
Geographic reach / footprint
PCS sales split by end-markets
2015A
PCS sales split by regions 2015A
• Reduced exposure to cyclicality of single customer
industries
• Access to high growth end-markets
• Optimized risk distribution
• Optimized asset utilization
Full market
access
• Greater technical specification requirement
• Comprehensive technical service
is key
• Premium pricing in selected segments (e.g.
automotive)
High value
applications and
segments
• Niche applications with strong differentiation
potential
• Customer loyalty and distinct barriers to entry
• Room to maneuver
Limited
disruptions from
new capacity
additions
Advantages of broad play
Trinseo
Teijin
Regional small
producers / compounders /
blenders
SABIC Covestro
Mitsubishi
33%
27%
17%
23%
Automotive /Transport
Electrical /Electronics
Construction
Others
Notes: (a) Bubbles represent 2015A global nameplate capacity as per Covestro internal estimates (legend bubble ~50kt)

Leading cost positions in all regions
11
PCS regional industry cost curve
Covestro cost leader in North America. NAFTA has the lowest cost level due to favorable feedstock and energy prices
Leader benefitting from regional sourcing advantages (excludes transportation costs)
Covestro cost leader in Western Europe
Leader benefitting from technology and backward integration
Covestro’s leading cost position in China due to integration and economies of scale
NAFTA
Cash Cost(a)
EMEA
Cash Cost(a)
APAC
Cash Cost(a)
Covestro Baytown North American Follower North American Laggard
A
EMEA Leader Covestro Uerdingen Western EuropeFollower
West EuropeanLaggard
B
Asian Leader Covestro Shanghai Covestro Map TaPhut
Asian Laggard
E
A
B
C
D
C
E
D
Assumptions: (a) Cash cost ex gate, 82% utilization rate for all plants based on nameplate capacity. Integrated players are shown without any margins for BPA, phenol, acetone, etc.

Innovative composite material provides potential for future
growth Continuous Fiber Reinforced Thermoplastics Composites (CFRTP)
What customers have been looking for What Covestro aspires to provide
Current status
High performance material to support broad application
requirement
Composites Solutions for high-end IT, automotive, and consumer products applications
• Developed manufacturing process based on acquired technology and scaling up production capacity in South Germany
• Close cooperation with many players in the IT value chain to position CFRTP Composites as a material of choice including many key
OEMs in IT industry
• Deploy IP strategies regarding processing, application and product solutions
• Aim for first commercialization in 2017
Energy saving solution Efficient production process to provide easy-to-use and high quality products
Affordable process substitutes of metal
Lightweight materials, e.g. 1/5 of the weight of stainless steel
12

R&D spend in 2015: €68m (+11%)
LED Lighting: Development of TC grade allows for weight
reduction and provides more design freedom.
Automotive interior trim: Process optimization combined with
design freedom drives value for customer – allows for system
integration
Direct Coating/Direct Skinning: allows coated components to be
manufactured efficiently in one step, eliminating the need for
surface treatment
Adjacent Growth
New Market
16%
Core
Efficiency & sustain
46%
Adjacent Growth
New Technology
38%
Ne
w
Exis
tin
g
Te
ch
no
log
y
1
2
3
Existing New
Market
3
2
1
Approximately 15% of the PCS sales volume comes from new products, i. e. products not older than 5 years
Pro-active and market-driven innovation are our crucial value
drivers
13
29%
Project examples per category

1 Leading player in an attractive industry
with above GDP growth, driven by broad application range and fast-growing, high-requirement
customers favoring large-scale global players
Favorable supply / demand outlook
with increasing industry utilization rates supporting higher industry margins 2
Well-invested own global asset base
with competitive cost position in all key regions 3
Best-in-class market access to a broad customer base
with globally proven market reputation of product and application development 4
Excellent position to capture global demand growth, leading to
attractive financial outlook
14
PCS key investment highlights

covestro.com
Polycarbonates (PCS) Backup

PC with superior properties against PMMA, crucial for our key
industries
16
TemperatureResistance[°C]
Impact Strength(23°C) [kJ/m²]
Flame retardance
Stiffness
OpticalTransmission [%]
Weathering stability/ Yellowness Index
PC
PMMA
148
100
89
92
95
2
18
26
2400 3300
good excellent
Key end-product application fields require the specific combination of PC properties, PMMA with limited overlap
Source: Covestro internal estimates

covestro.com
Financial Performance

Covestro well positioned to deliver
2
Key financial highlights
Solid historical core volume growth driven by growth across all segments over the period 2012-2015, with strong recent momentum in Q1’16
Strong cash generation supported by limited need for new asset investments until 2019 and focus on margin expansion through operational leverage and profitability
enhancement measures
Attractive dividend policy with first dividend payment of €0.70 per share for the stub year 2015 and a targeted dividend pay-out in FY2016 of 30-50% based on Covestro
Group IFRS net income
Robust financial profile based on solid equity ratio, investment grade rating, successful re-financing of debt and target of further net debt reduction
Performance culture based on consistent bonus metrics STI solely based on Group KPIs and LTI based on total shareholder return
Positive value creation measured by ROCE above WACC in 2015, first time after 4 years

Improving financial performance in past years
3
Key performance indicators
• Core volume growth primarily driven by increasing utilization of available
capacities in line with demand, particularly in APAC, yet showing some
volatility over time
• FY2015 showed solid development despite de-stocking in Q3, followed by
dynamic core volume growth in Q1’16
• FOCF positive in every year with proven ability to adapt to earnings volatility
through short-term measures. FOCF over the last years affected by capex
and fluctuations in net working capital driven by scheduled plant turnarounds
• Record FOCF in FY2015 based on strong EBITDA contribution, release of
working capital and capex below D&A
• Return on capital employed (ROCE) above weighted average cost of capital
(WACC) used as indicator for value generation
• In FY2015, ROCE above WACC achieved for first time in 4 years based on
significantly improved earnings
4,083 4,125
4,342 4,458
2012A 2013A 2014A 2015A
Sales
FOCF
ROCE
Core
volume
growth
+5.3%
(kt) +2.7%
+1.0%
181 415
313
964
2012A 2013A 2014A 2015A
Sales
+129%
+208% -25%
6.6%
4.2%
6.2%
9.5% 7.1% 6.9% 6.9%
7.2%
2012A 2013A 2014A 2015A
ROCE WACC
(€m)
(in%)

Focus on core volume growth
4
Core vs. non-core volume development (2012A–2015A)
• Core volumes are the focus of business operations and refer to the core products in the PUR, PCS and CAS segments, externally sold, calculated as percentage
change from the prior year in kilo tons
• Non-core volumes include external sales from business opportunities outside the core business, e.g. sales of raw materials and by-products such as hydrochloric
acid, sodium hydroxide solution (caustic soda) and styrene
• Low Group core volume growth in 2013A, mainly impacted by declining PCS core volumes (cycle trough year), followed by solid Group core volume growth in
2014A, especially driven by increasing PCS core volumes, and in 2015A, despite de-stocking by customer industries in Q3’15
(kt)
4,083 4,125 4,342 4,458
6,398 6,174 6,104 6,261
2012A 2013A 2014A 2015A
Core volumes (kt) Non-core volumes (kt)
+2.7%
+2.6%
+5.3%
-1.1%
+1.0%
-3.5%

Below mid-cycle profitability provides margin upside
5
EBITDA delivery
2005A 2006A 2007A 2008A 2009A 2010A 2011A 2012A 2013A 2014A 2015A
Covestro adj. EBITDA margin development (2005A – 2015A)
2 4 1
Below mid-cycle margins due to low industry utilization rates driven by
capacity overhang and ODS phase-out; recent momentum based on improved
pricing delta
Peak margins driven by high
utilization rates in PUR and PCS
Mid-cycle margins driven by solid PUR utilization rates. PCS margin decline driven by increasing APAC
competition
Highly volatile margins driven by economic crisis and
massive inventory movements(a)
3
18.7% 16.5%
15.4%
11.2%
5.9%
13.4% 10.8% 10.7%
9.9%
13.6%
Group adj. EBITDA margin % PUR adj. EBITDA margin %
PCS adj. EBITDA margin % CAS adj. EBITDA margin %
9.3%
Notes: Group financials prior to FY2012A based on Bayer AG's MaterialScience segment financials as published by Bayer AG. Due to reorganization of reporting structure in 2006A, no segment data available for 2005. Financials for
FY2012A – 2014A based on Covestro Combined Financial Statements
(a) De-stocking (Q4 2008A to Q2 2009A and Q4 2011A) and re-stocking (Q3 2009A to Q3 2011A)

Net saving expected to start ramping up in 2017
6
Structured profitability enhancement program on track
Targeted
gross savings
c. 420
(€m)
c. 150
c. 270
Profitability
enhancement potential
by 2019
Expected net savings
Potential by 2019
Key Measures Status
Asset
optimi-
zation
plan
Fixed asset
management cost
improvements
• Rolling out fixed asset management cost initiatives
• More efficient turnaround execution
• Further operational optimizations
ongoing
Asset
restructuring /
efficiency
projects
• Closure of Belford Roxo
• TDI EMEA restructuring
• Site consolidation: closure of S.Korea PC sheet production
• MDI EMEA restructuring: closure of TAR
executed
executed
executed
underway
Continuous
improvement • In manufacturing area ongoing
Cost
improve-
ment
measures
Corporate
overhead cost
savings
• Streamlining IT infrastructure and business model
• More tailor-made service function designs to replace current TSA(a) with
Bayer
ongoing
BU-level specific
savings
• Streamline sales force and back-office
• Focus on core areas and customers
• Consolidation within regional functions, product management and sales
• Maximize use of existing trade and distribution channels
ongoing
Continuous
improvement • In non-manufacturing area ongoing
Phasing of net savings
• Net zero costs and benefits
expected in 2016
• Linear ramp up of net
benefits in 2017 and 2018
• Realization of full net
benefits of >€100m in 2019
Accumulated
inflation of
existing cost
base
Note: (a) Transitional Service Agreements

High EBITDA to FOCF conversion rate
7
Free operating cash flow development 2012A-2015A
• Historic FOCF development largely driven by adjusted EBITDA, special items, changes in working capital and capital expenditures
• In FY2015, positive contribution from changes in working capital fully eaten up by negative special items (carve-out/IPO and site restructuring)
(€m) +129% +208% -25%
1,244 1,056 1,161
1,641
-33
28
-39 -222 -148
118
-157
115
-633
-583
-612 -509
-249
-204
-40 -61
2012 2013 2014 2015
Adj. EBITDA Special items Working Capital Capex Other effects
181 415 313 964 FOCF

Track record of positive FOCF across the cycle
8
Record free operating cash flow in 2015
Covestro Net Sales vs. FOCF (2005A –2015A)
• Accumulated more than €4bn in free operating cash flow since 2005A
• Free operating cash flow positive every year including 2008A–2009A cycle trough
• Attractive outlook for cash flow driven by volume growth, higher asset utilization, focus on cost discipline and limited need for further growth capex
9,446 10,161 10,435
9,738
7,520
10,154 10,832
11,610 11,357 11,761 12,082
673 592
277
110
345
265 210 181
415 313
964
2005A 2006A 2007A 2008A 2009A 2010A 2011A 2012A 2013A 2014A 2015A
Net sales Free operating cash flow
(€m)
Notes: Financials prior to FY2012A based on Bayer AG's MaterialScience segment financials as published by Bayer AG.
Free operating cash flow (FOCF) is calculated as net operating cash flow less cash outflows for property, plant and equipment and intangible assets

Successful bond placing secured long-term financing
9
Baa2 rating (Moody’s) with stable outlook
Financial Debt as of March 31, 2016
Highlights
Successful bond placing of €1.5bn
• Financial debt maturity significantly prolonged
Unchanged ambitions for 2016: Further net debt reduction and increasing dividend
• Based on a dividend pay-out ratio of 30%-50% of net income
Mid-term targets ( 2019): Total net debt to adj. EBITDA ratio of 1.5x and at least sustainable or increasing dividend
Total Debt
(€m) 3,963 1,876
2,087
1,031 3,118 810
500
500
500
808
Net Debt Financial Debt
Pension
provisions Cash
Bayer Debt(a)
(Jun-16)
Bond I
(Mar 2018;
0.6% + Euribor) Bond II
(Oct 2021;
1.0%) Bond III
(Sep 2024; 1.75%)
Other Debt
Notes: (a) €600m of Bayer loan prematurely paid back in April 2016

Use of cash reflects strong cash generation
10
Internal Portfolio Dividend policy
• Clear commitment to sustainable dividend growth –
or at least stable dividend in difficult economic
environment
• For stub year 2015, dividend of €0.70 paid
• Target dividend pay-out ratio of 30-50% based on
Covestro Group IFRS net income in FY 2016
• Efficient capital structure and strong free cash flow
allowing for sustainable dividend policy
• Capex (budget) below D&A in 2015A-2019E
• Goal to further reduce net debt
• Long-term preparation of next growth investments
underway
• Disciplined & focused approach
• Bolt-on acquisition to boost R&D and business
development
• Focus on high margin, differentiated business areas
and continuous portfolio optimization

Limited need for capital expenditures until 2019
11
Early preparations for new growth investments underway
Strict underlying investment approval process assuring adequate returns under consideration of risk profile
4.3% 5.7% 5.6% 5.6% 5.3% 5.0%
6.8% 8.5% 8.5%
7.4% 6.8%
2019E … 2015A
514
2014A
673
2013A
631
2012A
652
2011A
574
2010A
505
2009A
512
2008A
831
2007A
889
2006A
753
2005A
642
Growth Efficiency Sustain
(€m)
149% 178% 165% 84% 88% 99% 97% 91% 111%
D&A1 Capex as % of D&A
136% 74%
CapEx as % of sales
• Growth investments (capacity expansions)
• Building up Caojing as new, multi-BU, world-scale site to
participate in Chinese market growth
• Accompany market growth by filling asset utilization
• Optimize existing asset landscape through focus on efficiency
and sustain investments
• Exploit operational leverage to generate high cash flows in
preparation of next investment cycle
• New growth investments lead to capacity expansions
• Lead times: 5-6 year for planning process, 3-4 years for
construction (provided all regulatory approvals in place)
• Strengthen leading industry positions
• Ensure growth rates at least on attractive market levels
until 2008 2009 to 2019 2020 and beyond
605693669
582576607504500507471
699
Capex as % of sales
Notes: Financials prior to FY2012A based on Bayer AG's MaterialScience segment financials as published by Bayer AG. Financials for FY2012A – 2014A based on Covestro Combined Financial Statements. 2015 as reported in the
Annual Report 2015
(1) 2015 adjusted for impairment losses
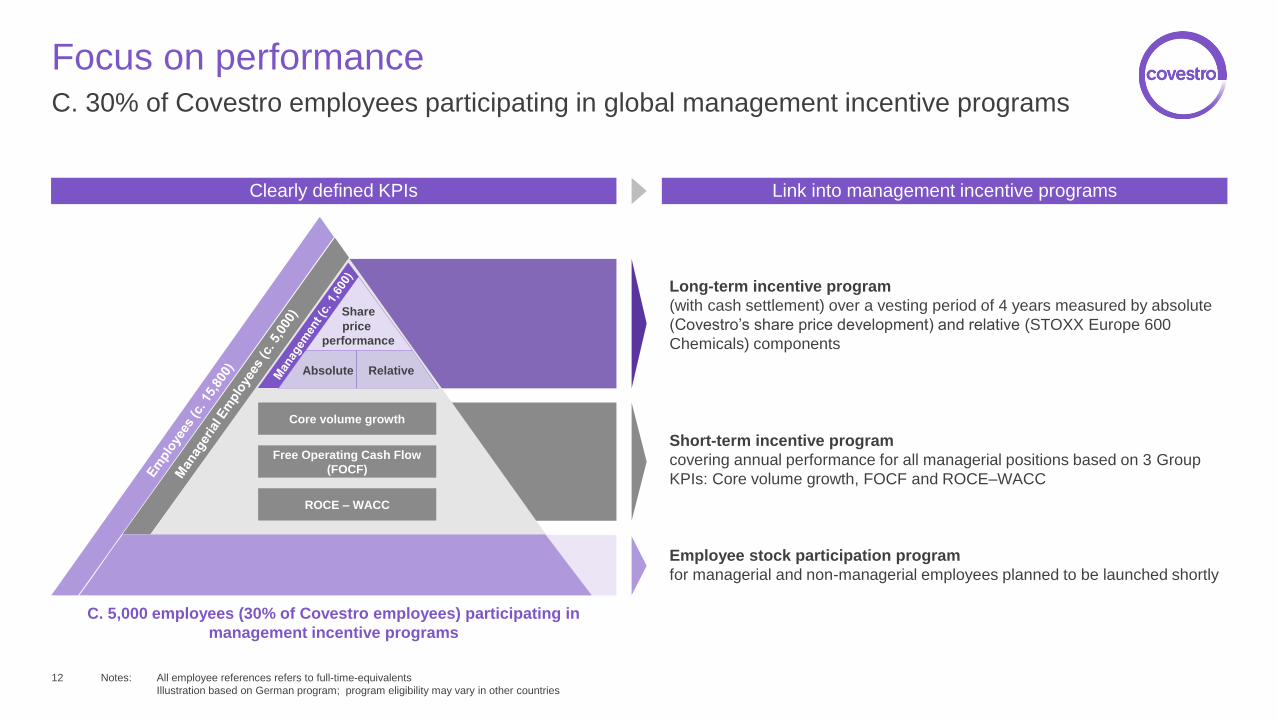
Focus on performance
12
C. 30% of Covestro employees participating in global management incentive programs
Clearly defined KPIs Link into management incentive programs
Notes: All employee references refers to full-time-equivalents
Illustration based on German program; program eligibility may vary in other countries
C. 5,000 employees (30% of Covestro employees) participating in
management incentive programs
Share
price
performance
Core volume growth
ROCE – WACC
Free Operating Cash Flow
(FOCF)
Short-term incentive program
covering annual performance for all managerial positions based on 3 Group
KPIs: Core volume growth, FOCF and ROCE–WACC
Long-term incentive program
(with cash settlement) over a vesting period of 4 years measured by absolute
(Covestro’s share price development) and relative (STOXX Europe 600
Chemicals) components
Employee stock participation program
for managerial and non-managerial employees planned to be launched shortly
Absolute Relative

LTI component based on total shareholder return
13
Long-term incentive program “Prisma”
Program details
• Cash settled plan with four-year performance periods
(January to December)
• Globally consistent program for all eligible employees
• Target amount based on fixed percentage of annual base salary
• Payout criteria based on:
1. TSR (Total Shareholder Return) as absolute performance criterion
2. Outperformance factor as relative payout criterion based on STOXX
Europe 600 Chemicals index
• Start & end prices for Covestro share and index are determined by the
average closing prices during November & December before the start and at
the end of the performance period
Ending Share Price + Cumulated Dividends
Starting Share Price = TSR Factor
100% + ( Change in Covestro
Share Price -
Change in Index
Price ) = Outperformance Factor
Outperformance
Prisma Payout = Prisma
Target Amount x ( TSR Factor x Outperformance Factor )
Payout Percentage

STI solely based on three financial Group KPIs
14
Short-term incentive program “Profit Sharing Plan (PSP)”
Program details
• Based on three equally weighted Group performance metrics core volume
growth, FOCF and ROCE above WACC
• PSP target amounts (equal 100% payout) are a percentage of annual base
salary, linked to individual position grade, ranging from 18% for entry
managerial level to 100% for board members
• For each metric, payout can range from zero to 300%, depending on Group
achievement levels; total payout capped at 250%
Notes: Program description based on German program; program details and eligibility may vary in other countries
Core Volume Growth FOCF ROCE above WACC

Outlook 2016 confirmed
15
Committed to deliver
Sales and Earnings Forecast
2015
Mid-single-digit increase
At high level, above the average of recent years
Premium on cost of capital
+2.7%
€964m
+9.5%
Forecast
Core Volume Growth
Free Operating Cash Flow
ROCE
Basic Assumptions
• Our guidance is based on current exchange rates
• We assume a similar macroeconomic environment as in 2015

Covestro well positioned to deliver
16
Key financial highlights
Solid historical core volume growth driven by growth across all segments over the period 2012-2015, with strong recent momentum in Q1’16
Strong cash generation supported by limited need for new asset investments until 2019 and focus on margin expansion through operational leverage and profitability
enhancement measures
Attractive dividend policy with first dividend payment of €0.70 per share for the stub year 2015 and a targeted dividend pay-out in FY2016 of 30-50% based on Covestro
Group IFRS net income
Robust financial profile based on solid equity ratio, investment grade rating, successful re-financing of debt and target of further net debt reduction
Performance culture based on consistent bonus metrics STI solely based on Group KPIs and LTI based on total shareholder return
Positive value creation measured by ROCE above WACC in 2015, first time after 4 years

covestro.com
Financial Performance Backup

Key raw materials secured through long-term contracts
18
Raw material exposure
Major raw material split (2015A) Comments
• Crude oil defines floor price for majority of petrochemical raw materials used,
additional charges on crude oil price depend on the specific supply / demand
dynamics in relevant raw material segments
• Key raw materials mostly secured through contracts with purchasing prices
typically fixed on a monthly basis
• Contracts include defined volumes and in some exceptional cases take-or-
pay obligations (e.g. carbon monoxide and chlorine)
• Chlorine, carbon monoxide and hydrogen (if no own production facility is
available) sourced from onsite partners (at cost plus) or externally via long-
term contracts
• Energy sourcing secured by long-term contracts covering access to crucial
assets on-site or over-the-fence (steam generation, supply grids), respective
costs are included in manufacturing costs, not in raw material expenses
• ‘Others’ contains more than 300 raw materials with each less than 3% of total
raw material costs
Notes: (a) Total raw material exposure refers to actual raw material expenses, excluding approx.
€0.2bn energy costs
Total raw material exposure €5.1bn(a)
Benzene
Phenol
Propylene
Toluene Acetone HDA
Others
(€m)

Covestro benefitted from depreciation of Euro in 2015
19
Currency exposure
Sales by region (2015A)
Foreign currency hedging
• Covestro’s foreign exchange exposure is mainly derived from business
activities in APAC and NAFTA region
• Material receivables and payables in liquid currencies are fully hedged
• The planned and contracted exposure is closely monitored but not hedged at
present. Should the exchange rate risk increase significantly hedging of such
exposure will be executed.
Notes: (a) Property, plant and equipment
(b) Defined as percentage of sales based on functional (reporting) currency of Covestro legal entities
Assets by region (2015A)(a)
Sales per reporting currency (2015A)(b)
EUR 41%
USD 25%
CNY 12%
HKD 9%
Others 13%
EMLA 44%
APAC 28%
NAFTA 28%
EMLA 28%
APAC 50%
NAFTA 22%
(€m)
(€m)

covestro.com
Key Investment Highlights

Global leader in high-tech material solutions
2
Covestro key investment highlights
1 Leading and defendable global industry positions
based on focused portfolio
Favorable industry dynamics
with robust above GDP growth prospects in a diverse range of end-markets 2
Positioned to deliver volume growth
through well-invested, large-scale asset base with competitive cost position 3
Portfolio including high-value CAS business
with attractive and historically resilient margin profile 4
Attractive cash flow growth outlook
underpinned by disciplined cost management 5
Headed by experienced management with full commitment to value creation