investor presentation – morgan stanley emerging … · 15 65 9 6 5 2 21 0 10 20 30 40 50 60 70...
TRANSCRIPT

Miclyn Express Offshore Limited ABRN 141 683 552 3 Harbour Front Place #11-01 / 04 HarbourFront Tower 2 Singapore 099254
Telephone: +65 6545 6211 Fax: +65 6545 9211
Internet: www.miclynexpressoffshore.com
7 June 2010 The Listing Manager Australian Stock Exchange Exchange Centre Level 6 20 Bridge Street Sydney NSW 2000 INVESTOR PRESENTATION – MORGAN STANLEY EMERGING COMPANIES CONFERENCE Miclyn Express Offshore (ASX:MIO) advises that CEO Diederik De Boer and CFO Nick Gleeson will be presenting to institutional investors on Wednesday, 9 June at the Morgan Stanley Emerging Companies Conference in Sydney. A copy of the presentation is attached. Kind regards, MICLYN EXPRESS OFFSHORE LIMITED
ADAM CLAYTON Investor Relations Manager Tel: +65 6829 6122 Mob: +65 8298 5155

Miclyn Express Offshore On course to deliverJune 2010
STRICTLY CONFIDENTIAL
2
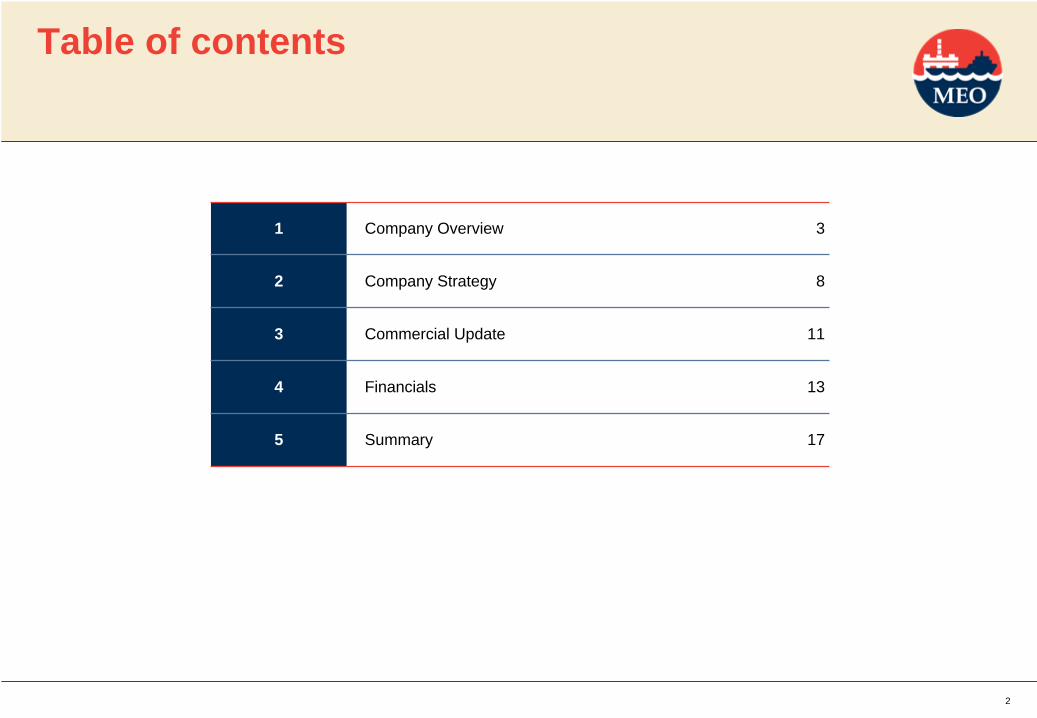
1 Company Overview 3
2 Company Strategy 8
3 Commercial Update 11
4 Financials 13
5 Summary 17
Table of contents

Company Overview 1
4
15
65
9 6
5
2
21
0
10
20
30
40
50
60
70
OSV Crew /UtilityVessels
Tugs and Barges Coastal SurveyVessels
Num
ber o
f ves
sels
BargesTugs
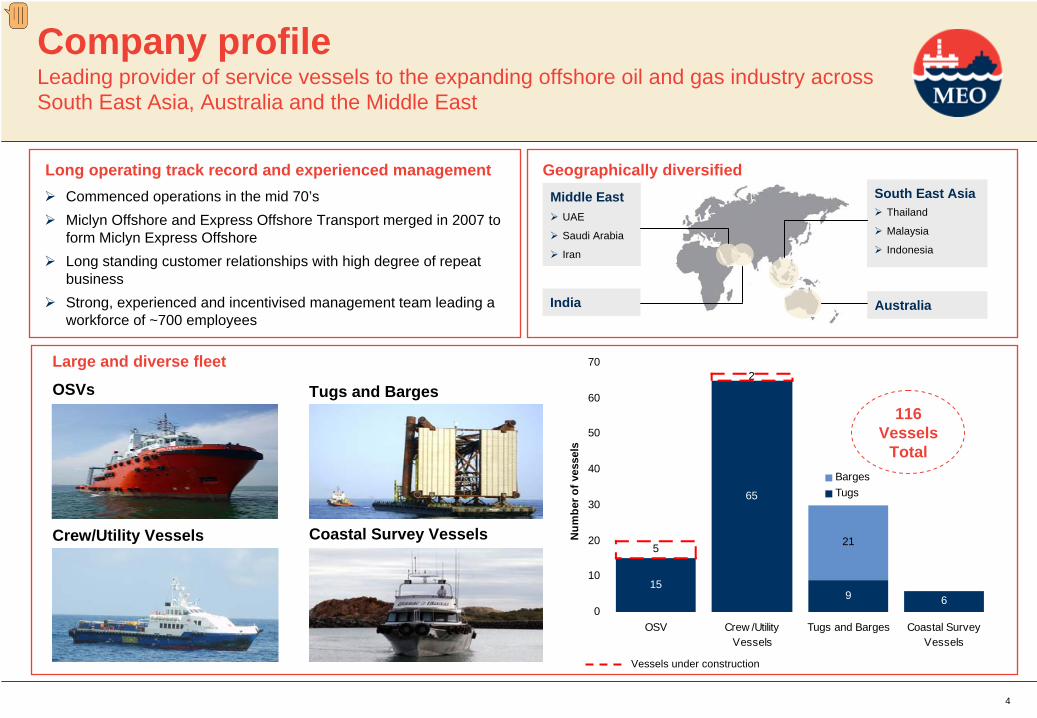
Commenced operations in the mid 70’s Miclyn Offshore and Express Offshore Transport merged in 2007 toform Miclyn Express OffshoreLong standing customer relationships with high degree of repeat businessStrong, experienced and incentivised management team leading a workforce of ~700 employees
Long operating track record and experienced management
Company profile Leading provider of service vessels to the expanding offshore oil and gas industry across South East Asia, Australia and the Middle East
OSVs
Crew/Utility Vessels
Tugs and Barges
Coastal Survey Vessels
116 Vessels
Total
Geographically diversified
Large and diverse fleet
Middle EastUAE
Saudi Arabia
Iran
South East AsiaThailand
Malaysia
Indonesia
India Australia
Vessels under construction

5
9.7
6.0 5.43.8
14.5 14.9
4.2 3.64.6
3.74.5
11.4
13.1
11.3
13.5 13.3
0
2
4
6
8
10
12
14
16
18
30 Jun 07 30 Jun 08 30 Jun 09 31 Dec 09 Current
OSVs Crew /Utility Tugs and Barges Coastal Survey
Support bases in proximity to customer operational locations in Indonesia, Thailand, Saudi Arabia and UAESamson Maritime investment provides operational base within close proximity of NW Shelf projects in AustraliaAbility to repair fleet with minimal downtimeEnables close interaction with customers
Zero lost time incidents since
Dec 2007
13 million man hours without loss
time incident
HSQE accreditation essential to obtaining pre-qualified bidder statusMIO never been rejected for a charter contract due to non-compliance with HSQE practicesVery robust systems embedded in culture
Strong established customer relationships
Strong HSQE record
Infrastructure in key operating regions
>25 years relationship
Young Fleet
18.1
14.2
OSV Industry Ave
Crew/Utility Industry Ave
Provider of choice Business model creates high barriers to entry

6
Leveraged to offshore oil and gas Minimal exposure to the spot market
Exploration Development Production Offshore Civil Construction
Phase Length: 1 to 3 years 2 to 4 years 5 to 55 years 1 to 3 years
Sensitivity to oil price: High Medium Low None
Percentage of MEO revenue, CY2010A1
19% 26% 40% 15%
OSV’s
Tugs and Barges
Crew/Utility Vessels
Coastal Survey Vessels
Stages in the offshore oil and gas cycle
Note 1: excludes shipyard revenue, which represents 1.4% of total revenues

7
Location: Batam, Indonesia (20km from Singapore)
Size: Land area ~133,350sqm (with slipway)
Sea frontage of approximately 216m
Almost 100 permanent staff
Activity: Repairs and maintenance
Complex conversions and customisations
Newbuilding (OSV’s)
Constructor I
Vertically integrated model Shipyard provides a key competitive advantage
Newbuild timetable:
Vessel Type Expected completion
Constructor II Accommodation Oct/Nov 2010
Magellan I & II AHT Mar/Apr 2011
Sovereign I & II Multi Purpose Apr/May 2012
Control over cost, timing and quality
Ability to prioritise internal work
Save 20-30% margin charged by external shipyards
Higher DCR’s, utilisation and increased switching costs through conversion and customisation

Company Strategy 2

9
82 84 81
97 94
85
7568
64
44
63
8590
8591
85
0
10
20
30
40
50
60
70
80
90
100
FY2007A FY2008A FY2009A FY2010F CY2010F
(%)
OSVs Crew /Utility Vessels Tugs and Barges Coastal Survey Vessels
Maximising utilisation is key Fleet strategy that delivers attractive growth
Crew/Utility Vessel Fleet
Renewal
OSV Fleet Expansion
Sell older vessels into unrelated business segmentsAdd newer, higher specification vessels that deliver top line growth through higher charter rates and utilisationCustomer led CAPEX decisions – only purchase against long term contracts
Build 2-3 high end OSV’s p.a. in BatamshipyardSelectively pursue synergistic acquisition opportunities
Earnings Visibility
Actively pursue long term charter contracts to drive up utilisationMaintain vessel mix that is conducive to long term charterability
Target 20% top line growth p.a. over the medium term
Fleet strategy

10
Geographic strategy
Expand through Samson Maritime platform by placing MIO vessels into the NW Shelf
Australia
Utilise JV with BLT to comply with local flag requirement and expand presence
Indonesia
Increase exposure through wholly owned local flag structure
Malaysia
High Growth Regions
Grow by leveraging off existing clients and renew existing contracts for Crew/Utility Vessels
Thailand
Consolidate positions UAE and Iran and grow presence in Saudi Arabia and Qatar
Middle East
Established Regions

Commercial Update 3

12
CY2010 earning visibility has improved 11.1% since IPO
Commercial Update
CY2010 contracted and highly probable revenue vs. prospectus forecast
Significant events post IPO
Six crew/utility vessel purchases against long term charter contracts
Disposal of two older vessels (OSV and crew/utility) for a gain of US$1.2m
Four Australian charter contracts won through Samson acquisition (two Samson vessels and two MIO vessels)
Two Samson vessels deployed into higher yielding charter opportunities in Saudi Arabia through MIO customer relationships
New charter contracts disclosed to market contribute an aggregate of US$32.7m in revenue
Continued rollover of existing charter contracts
Tug and barge utilisation firming
Additional older crew/utility vessel disposals in negotiation
Ongoing negotiations for new charter contracts remain positive
Fleet utilisation is firming and MIO remains on track to achieve CY2010 forecast
82.0 88.8
26.8
58.773.5
0
20
40
60
80
100
120
OSVs Crew /UtilityVessels
Tugs andBarges
Coastal SurveyVessels
Total
(%)
86.2
102.5
48.7
76.784.6
As at 31 May 2010
As at 31 Dec 2009

Financials 4

14
OSV’s 44%
Crew/Utility Vessels 32%
Tugs 12%
Barges 7%Coastal Survey Vessels 4%
Shipyard 1%
FY2008A FY2009A FY2010F CY2010F
Revenue 93.1 98.0 124.7 148.0
Operating costs (37.7) (39.5) (51.1) (57.2)
Gross profit 55.4 58.5 73.6 90.8
Gross Margin 59.5% 59.7% 59.0% 61.3%
Other income (0.3) 1.5 0.9 0.5
Overheads (9.8) (11.0) (15.7) (18.0)
Operating earnings 45.3 49.0 58.8 73.3
Gain on disposal of vessels 8.7 2.5 2.7 3.6
EBITDA 54.0 51.5 61.5 76.9
Depreciation and amortisation (8.2) (10.2) (13.7) (15.5)
EBIT 45.8 41.3 47.8 61.4
Net finance costs (5.0)Income tax expense (3.3)
NPAT 53.1
Profit attributable to minority interest (0.1)
Profit attributable to shareholders 53.0
Financial highlights Strong track record of revenue and EBITDA growth with attractive operating margins
Pro Forma Consolidated Income Statement (US$m) CY2010F Revenue by Vessel Segment
15
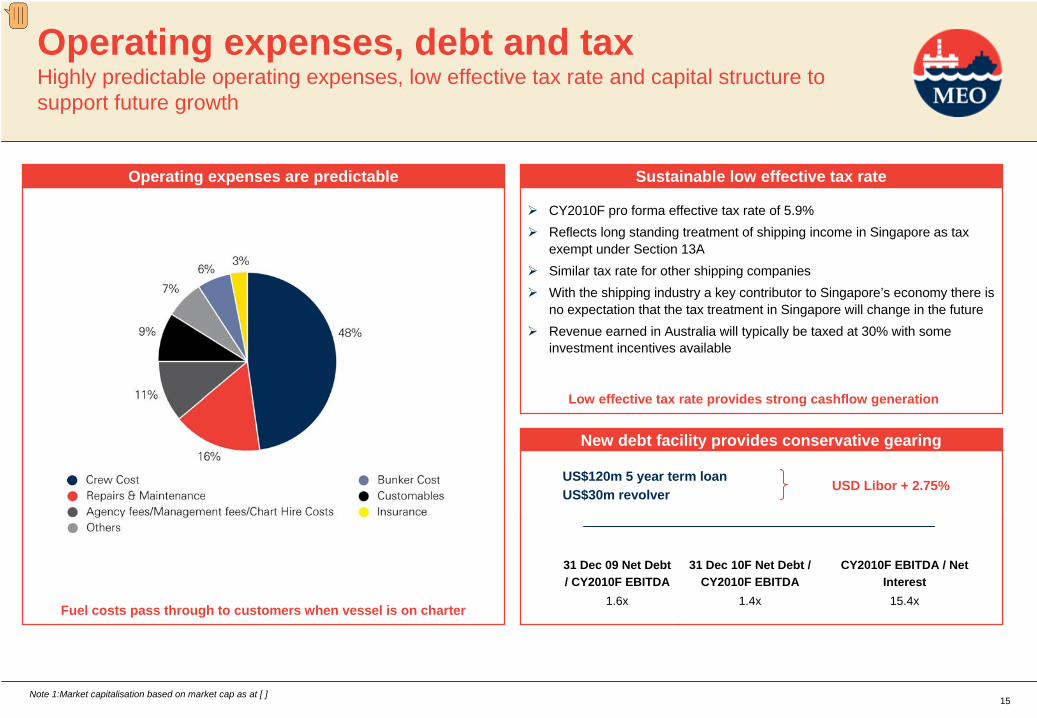
Fuel costs pass through to customers when vessel is on charter
Operating expenses are predictable
Operating expenses, debt and tax Highly predictable operating expenses, low effective tax rate and capital structure to support future growth
New debt facility provides conservative gearing
Note 1:Market capitalisation based on market cap as at [ ]
US$120m 5 year term loanUS$30m revolver
USD Libor + 2.75%
31 Dec 09 Net Debt / CY2010F EBITDA
31 Dec 10F Net Debt / CY2010F EBITDA
CY2010F EBITDA / Net Interest
1.6x 1.4x 15.4x
Sustainable low effective tax rate
CY2010F pro forma effective tax rate of 5.9%Reflects long standing treatment of shipping income in Singapore as tax exempt under Section 13ASimilar tax rate for other shipping companiesWith the shipping industry a key contributor to Singapore’s economy there is no expectation that the tax treatment in Singapore will change in the futureRevenue earned in Australia will typically be taxed at 30% with some investment incentives available
Low effective tax rate provides strong cashflow generation
16
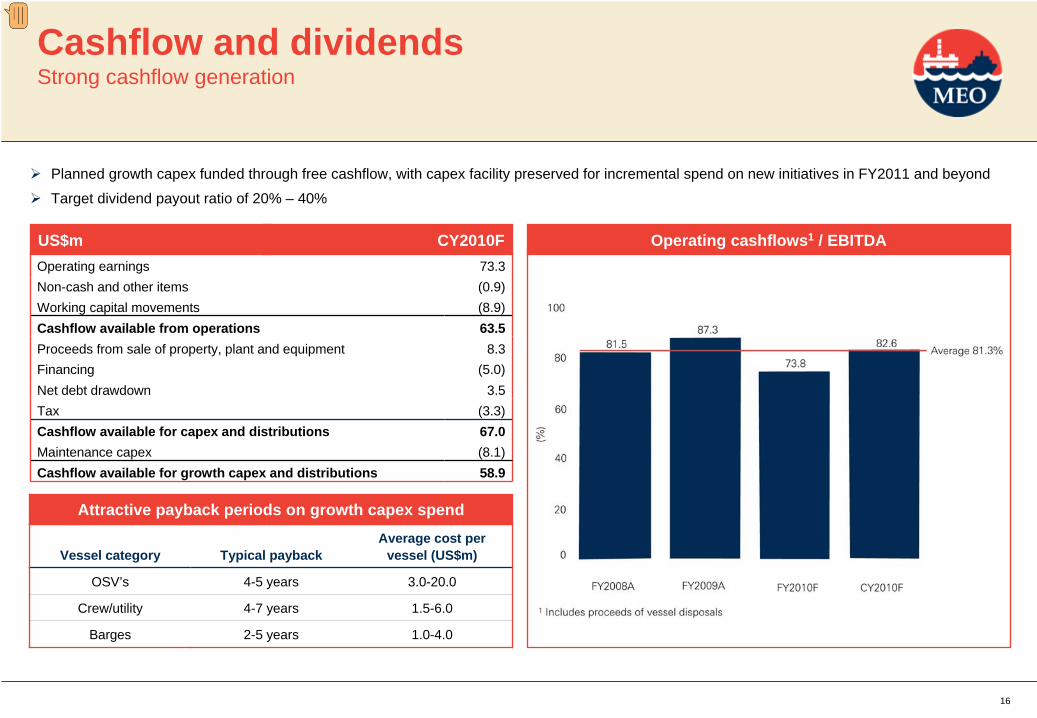
Operating earnings 73.3Non-cash and other items (0.9)Working capital movements (8.9)Cashflow available from operations 63.5Proceeds from sale of property, plant and equipment 8.3Financing (5.0)Net debt drawdown 3.5Tax (3.3)Cashflow available for capex and distributions 67.0Maintenance capex (8.1)Cashflow available for growth capex and distributions 58.9
Operating cashflows1 / EBITDAUS$m CY2010F
Cashflow and dividends Strong cashflow generation
Planned growth capex funded through free cashflow, with capex facility preserved for incremental spend on new initiatives in FY2011 and beyond
Target dividend payout ratio of 20% – 40%
Vessel category Typical paybackAverage cost per
vessel (US$m)
OSV’s 4-5 years 3.0-20.0
Crew/utility 4-7 years 1.5-6.0
Barges 2-5 years 1.0-4.0
Attractive payback periods on growth capex spend

4Summary

18
INVESTMENT HIGHLIGHTS
De-risked through diversified exposure
High degree of earning visibility through long term charter contracts strategy
Leveraged to growing oil and gas sector
High cash delivery to finance future growth
Strong barriers to entry through established customer relationships, support infrastructure and HSQE record
Experienced management with demonstrated track record of delivering strong results
High quality assets
Vertically integrated business model
Summary Well positioned for future growth
On course to deliver CY2010 forecast

19
Reliance on Third Party InformationThe views expressed here contain information that has been derived from publicly available sources that have not been independently verified. No representation or warranty is made as to the accuracy, completeness or reliability of the information. This presentation should not be relied upon as a recommendation or forecast by Miclyn Express Offshore Limited (“Miclyn Express Offshore”).
Forward Looking StatementsSome of the information contained in this document may constitute forward-looking statements that are subject to various risks and uncertainties. Nothing in this document is a promise or representation as to the future. Statements or assumptions in this document as to future matters may prove to be incorrect. Miclyn Express Offshore does not make any representation or warranty as to the accuracy of such statements or assumptions. You acknowledge that circumstances may change and the contents of this document may become outdated as a result. You also acknowledge that no audit or review has been undertaken by an independent third party of the assumptions, data, results, calculations and forecasts contained in or referred to in this document. You should make your own independent assessment of the information.
No WarrantiesWe makes no warranty, express or implied, nor assumes any responsibility in its contents for its accuracy, completeness, its use for any general of particular purpose, nor that such items or use of such items would not violate or infringe rights of others.
No Offer of SecuritiesNothing in this release should be construed as either an offer to sell or a solicitation of an offer to buy or sell Miclyn Express Offshore securities in any jurisdiction.
Pro-Forma Financial InformationReferences to pro forma financials exclude any exceptional items. A reconciliation to statutory financials is contained within the prospectus, available at our website www.miclynexpressoffshore.com.
Important notice and disclaimer