investor presentation november pt bank negara indonesia tbk · legal division compliance division...
TRANSCRIPT

Investor Presentation
November 2010
PT Bank Negara Indonesia (Persero) Tbk(Persero) Tbk

C:\DPS NEW\Pres\PPT\PresPrint.pot
Agendag
O iOverviewof BNI
Going Forward Performance
1

Section 1Section 1
Overview of BNI

C:\DPS NEW\Pres\PPT\PresPrint.pot
Overview of BNI
Key milestones Highlights
BNI established as first wholly owned state bank
BNI first distributed the official currency of Indonesia
Merger with several commercial banks
Primary task of improving Indonesia’s economy with
1946 – 1968
Strong pedigree – initially set up as Central bank
Compelling brand name – 64 years history
emphasis on industrial sectors
First state‐owned bank to go public
Launched BNI Securities in 1995
h d l f
Top product synergies in BNI family
Extensive network – 1,112 branches, four overseas branches and one agencyLaunched life insurance unit in 1996
Asian Financial Crisis
Government recapitalization, owning 99.1% of BNI
Established Syariah banking in 2000
$
four overseas branches and one agency
Large, premium customer base – over10 million customers1969 – 2007
Secondary Offering, US$445m new Tier‐1 capital
Increased public ownership to 23.6%
New management team introduced
I l t d t f tiReinvigorated management team
R b t ROE d ROA i tImplemented transformation program
Government owns 73.3% of BNI
Continue to strengthen BNI through key hires
BNI h bli h d i lf k l d i I d i h h h lf f i
2008 – 2010Robust ROE and ROA improvement trajectory
Dominant bank in Indonesia
3
BNI has established itself as a market leader in Indonesia through over half a century of operations

C:\DPS NEW\Pres\PPT\PresPrint.pot
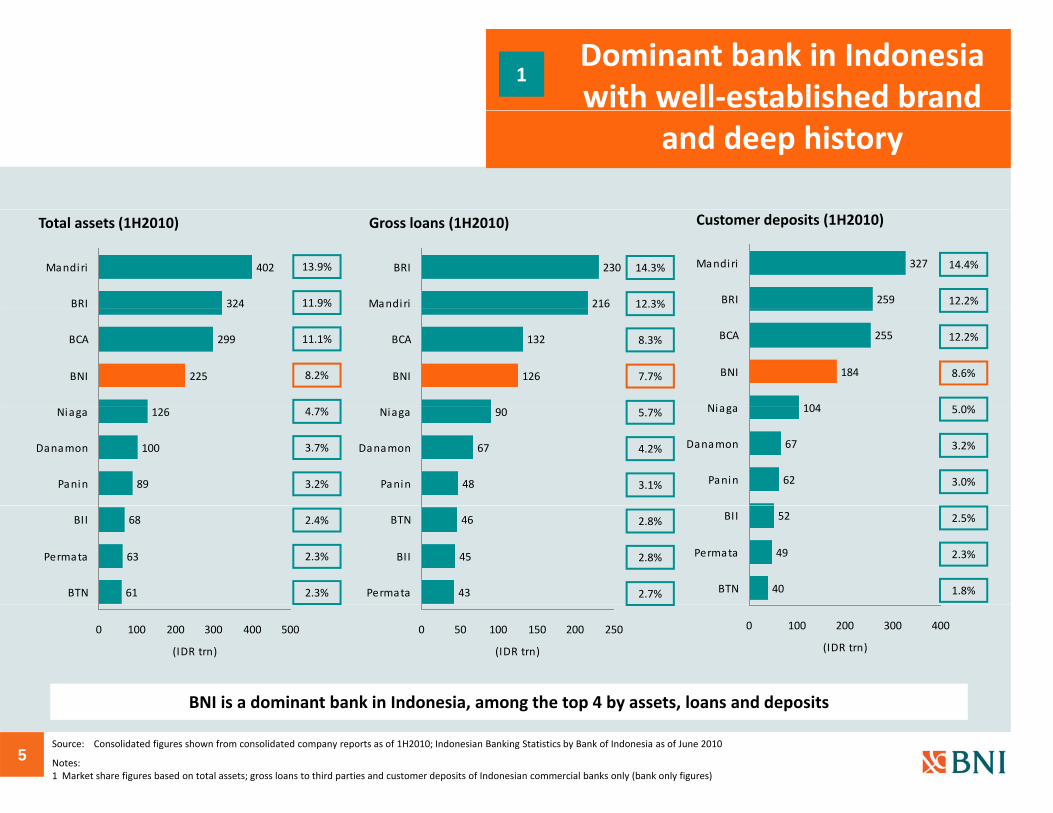
1Dominant bank in Indonesia with well‐established brand
and deep history
BNI has a long track record, rivaled by none, in the Indonesian banking sectorYear of brand establishment
1963
1998
19711946
1956 2008
1957 2002
1959 1968
Strong brand recognized by the industry globally
2010Best Local
2010Best Local
2009No 1
2009No 1
2009 / 2007Top Brand Award –
2005The Banker
2009 / 2008 / 2007Banking Service
2006Indonesia
2010Best Domestic
2010Top 3 Customer Best Local
CashManagement Bank –Large CorporatesAsia Money
Best Local CashManagement Bank –Medium CorporatesAsia Money
No. 1 Arranger for Indonesia Syndicated Loans IFR
No. 1 Bookrunner for Indonesia Syndicated LoansIFR
Top Brand Award –Category: Credit card in Recognition of Outstanding Achievement in Building the Top BrandFrontier Consulting Group and Marketing Magazine
The Banker Award – Bank of the Yearin IndonesiaThe Banker
Banking Service Excellence AwardsInfobank & MRI
Indonesia Corporate Brand Visualization Award Businessweek
Best Domestic FX Provider of Single‐Bank Electronic Trading in IndonesiaAsia Money
Top 3 Customer Satisfaction Among Largest Banks in IndonesiaRoy Morgan
and Marketing Magazine
FXPOLL
BEST DOMESTIC FXPROVIDER OF SINGLE
BANK ELECTRONIC TRADING IN INDONESIA
4
C:\DPS NEW\Pres\PPT\PresPrint.potDominant bank in Indonesia with well‐established brand
1
and deep history
Total assets (1H2010)
13.9%
11.9%
Gross loans (1H2010)
14.3%
12.3%
Customer deposits (1H2010)
14.4%
12.2%216
230
Mandiri
BRI
324
402
BRI
Mandiri
259
327
BRI
Mandiri
11.1%
8.2%
8.3%
7.7%
12.2%
8.6%
5 0%
126
132
BNI
BCA
225
299
BNI
BCA
104
184
255
Niaga
BNI
BCA
4.7%
3.7%
3.2%
5.7%
4.2%
3.1%
5.0%
3.2%
3.0%48
67
90
Panin
Danamon
Niaga
89
100
126
Panin
Danamon
Niaga
62
67
104
Panin
Danamon
Niaga
2.4%
2.3%
2.3%
2.8%
2.8%
2.7%
2.5%
2.3%
1.8%43
45
46
Permata
BII
BTN
61
63
68
BTN
Permata
BII
40
49
52
BTN
Permata
BII
BNI is a dominant bank in Indonesia among the top 4 by assets loans and deposits
0 50 100 150 200 250
(IDR trn)
0 100 200 300 400 500
(IDR trn)
0 100 200 300 400
(IDR trn)
5
BNI is a dominant bank in Indonesia, among the top 4 by assets, loans and deposits
Source: Consolidated figures shown from consolidated company reports as of 1H2010; Indonesian Banking Statistics by Bank of Indonesia as of June 2010
Notes: 1 Market share figures based on total assets; gross loans to third parties and customer deposits of Indonesian commercial banks only (bank only figures)

C:\DPS NEW\Pres\PPT\PresPrint.pot
Stable deposit franchise ith l t f f di
5
with low cost of funding
Cost of deposits (1H2010)1 CASA ratio (1H2010) Loans‐to‐deposit ratio (1H2010)
73.3BCA 51.6BCA2.88BCA
57.3
59.2
60.2
Mandiri
Mega
BNI
68.5
66.2
63.6
BNI
Mandiri
Mega
4.32
4.11
3.50
BRI
Mandiri
BNI
44.0
44.8
57.1
Niaga
Permata
BRI
86.5
85.5
76.5
Niaga
BII
Panin
5.08
4.81
4.78
Permata
Panin
Niaga
38 5
41.1
43.4
Danamon
BII
Panin
100 2
88.9
87.3
Danamon
BRI
Permata
5 53
5.35
5.29
Danamon
BTN
BII
BNI’s large and stable deposit base has given the bank robust liquidity and low cost of funding
38.5
0.0 20.0 40.0 60.0 80.0
Danamon
(%)
100.2
0.0 20.0 40.0 60.0 80.0 100.0 120.0
Danamon
(%)
5.53
0.00 1.00 2.00 3.00 4.00 5.00 6.00 7.00
Danamon
(%)
6Source: Detailed company reports as of 1H2010
Note: Consolidated figures shown unless otherwise noted1 Cost of deposits calculated as interest expense from deposits to customers and other banks (including bonus and revenue‐sharing expenses on Syariah funding products)/average deposits
(where interest expense split unavailable, total interest expense is applied); 1H2010 figures are annualized
BNI s large and stable deposit base has given the bank robust liquidity and low cost of funding

C:\DPS NEW\Pres\PPT\PresPrint.pot
Extensive domestic and i t ti l t k
4
international network
BNI’s multiple touch points for individual and corporate customers
Individual customer
Mobile Call ATMsDomesticBranches
Consumerloan
Small business
Medium business
BNI Emeralde banking
Int’lBranches
10.9 million deposit accounts
1.8 million credit cards
97,400 mortgage customers
banking center (4,072)Branches(1,112)1
centers(12)
centers(51)
centers(20)
Emerald(24)
e‐banking Branches(5)2
Corporate/SME customer highlights
143,024 corporate deposit accounts
943 corporate lending accounts
71,982 SME lending accountsIndonesia (1,112 branches)Indonesia (1,112 branches)
Platform for efficient and effective cross‐selling of products and services
7
g p
Notes:1 As of September 30, 2010; Domestic branches include 167 conventional branches, 887 sub‐branches, 58 Syariah branches and sub‐branches2 Four overseas branches in Hong Kong, London, Singapore and Tokyo and an agency in New York

C:\DPS NEW\Pres\PPT\PresPrint.pot
Extensive domestic and i t ti l t k
4
international network
BNI’s global remittance network Incoming remittances
1,500,000
2,000,000
ps
1
1
Market share 23.7% 24.5% 27.4%
1,781,255 1,796,5931,511,984
0
500,000
1,000,000
No. of sli
4
1
2 1
3 2610
256
3
4 8
1
1
11
41
1
0
2008 2009 3Q2010
Outgoing remittances
2.9% 4.2% 5.3%
Remittance representatives (12) Overseas offices (5) & alliances (1)
Market shareSaudi ArabiaJeddah (1)Riyadh (2)Damman (1)Kuwait
QatarDoha (1)MalaysiaKuala Lumpur (2)S b h (1)
Singapore OfficeSingPostHong Kong OfficeSeven‐ElevenT lk l
London OfficeNew York Agency OfficeStrategic alliance with BONYfor web‐based remittancesBNI R itt Ltd
249,830 234,745100 000
150,000
200,000
250,000
No. of slips
Virtual offices1 (51)
KuwaitKuwait City (1)Uni Arab EmiratsAbu Dhabi (1)Dubai (1)
Sabah (1)TaiwanTaipei (1)
51 Virtual office in 11 countries:Brunei: 2 virtual officesSingapore: 6 virtual offices
TelkomselExcelcomindoTokyo OfficeSMBC via ATMGenkin Kakitome (Post Office)
BNI Remittance Ltd, Hongkong
1,650 Correspondents Banks38 OTR2 Domestic Outlets
T f Vi 164,651
0
50,000
100,000
2008 2009 3Q2010
N
Forming the backbone of BNI’s market leading remittance business
g pMalaysia : 10 virtual officesTaiwan : 2 virtual officesQatar : 6 virtual officesBahrain : 4 virtual officesKuwait : 5 virtual officesOman : 3 virtual officesJordania : 4 virtual officesUAE : 8 virtual officesSaudi Arabia: 1 virtual offices
Transfer ViaWeb base (i‐banking) Smart RemittanceSWIFTATM (SMBC)Post Office AlliancesSMS BankingStand‐alone application Remittance Plus
File TransferSWIFT Net – MaybankTelex
8
Forming the backbone of BNI s market leading remittance business
Source: Company reports
Note: Consolidated figures shown unless otherwise noted1 Local remittance agencies2 Outgoing transfers (marketing officers)
C:\DPS NEW\Pres\PPT\PresPrint.pot
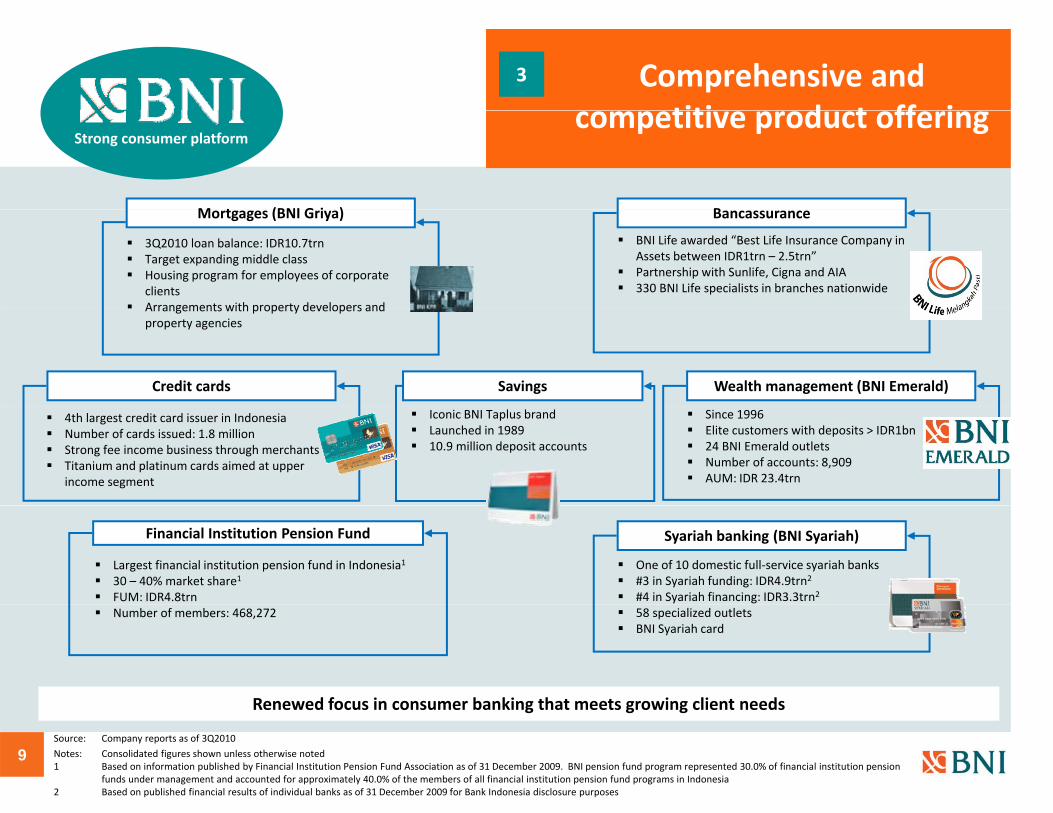
3 Comprehensive and titi d t ff i
M t (BNI G i )
Strong consumer platform
B
competitive product offering
Mortgages (BNI Griya)
3Q2010 loan balance: IDR10.7trnTarget expanding middle classHousing program for employees of corporate clientsArrangements with property developers and
Bancassurance
BNI Life awarded “Best Life Insurance Company in Assets between IDR1trn – 2.5trn”Partnership with Sunlife, Cigna and AIA330 BNI Life specialists in branches nationwide
Credit cards
Arrangements with property developers and property agencies
Wealth management (BNI Emerald)Savings
4th largest credit card issuer in IndonesiaNumber of cards issued: 1.8 millionStrong fee income business through merchantsTitanium and platinum cards aimed at upper income segment
Since 1996Elite customers with deposits > IDR1bn24 BNI Emerald outletsNumber of accounts: 8,909AUM: IDR 23.4trn
Iconic BNI Taplus brandLaunched in 198910.9 million deposit accounts
Financial Institution Pension Fund
Largest financial institution pension fund in Indonesia1
30 – 40% market share1
FUM: IDR4.8trn
Syariah banking (BNI Syariah)
One of 10 domestic full‐service syariah banks#3 in Syariah funding: IDR4.9trn2
#4 in Syariah financing: IDR3.3trn2
Renewed focus in consumer banking that meets growing client needs
Number of members: 468,272 58 specialized outletsBNI Syariah card
9
Renewed focus in consumer banking that meets growing client needs
Source: Company reports as of 3Q2010
Notes: Consolidated figures shown unless otherwise noted1 Based on information published by Financial Institution Pension Fund Association as of 31 December 2009. BNI pension fund program represented 30.0% of financial institution pension
funds under management and accounted for approximately 40.0% of the members of all financial institution pension fund programs in Indonesia2 Based on published financial results of individual banks as of 31 December 2009 for Bank Indonesia disclosure purposes

C:\DPS NEW\Pres\PPT\PresPrint.pot
Comprehensive and titi d t ff i
3
competitive product offering
Trusted partner to Indonesian and multi‐national corporates
Consumer Construction Education
U i it f I d i
Real estateEnergy Communications DiversifiedInfrastructure
University of Indonesia
SalimGroup
Corporate loans Commercial loans Cash management clients
Group
215
100
150
200
250
anagem
ent
f accou
nts)
29,665
46,284
30,000
40,000
50,000
oans (IDRbn)
38,106
50,833
40,000
60,000
loans (IDRbn)
07‐3Q10 CAGR = 17.6%
07‐3Q10 CAGR = 11.0%
9
0
50
100
2007 1H2010
Cash ma
(No. of
0
10,000
20,000
2007 3Q2010
Corporate lo
Leading corporate banking franchise backed by rapidly growing client base
0
20,000
2007 3Q2010
Commercial
10
Leading corporate banking franchise backed by rapidly growing client base
Source: Company reports as of 3Q2010 and 1H2010Notes: Consolidated figures shown unless otherwise noted

C:\DPS NEW\Pres\PPT\PresPrint.pot
Transformation begins with th i ht lthe right people
Change Management Office Internal Audit
S i Pl i
Board of Commissioners
P id t Di tHuman Resources Division
Training & Development Division
Strategic Planning Division
Corporate Secretary
Managing Director – Managing Director – Managing Director –
President Director (Chief Executive Officer/CEO)
Vice President Director (Chief Risk Officer/CRO)
Managing Director –
Consumer Loan Division
Wealth Management Division
Consumer & Retail Banking
Card Business Division
Treasury & FI
International Division
Treasury Division
Network & Services
Network & Services Division
Chief of Network & Services
Corporate Funding & Financial Division
Corporate Banking Division 1
Corporate Banking Division 2
Business Banking
Consumer Funding & Financial Division
Pension Fund Unit
Transactional Banking & Financial Services Division
Middle Business Division
Small Business Division
Managing Director –Compliance
Legal Division
Compliance Division
Managing Director –Operations & IT
Banking Operations Division
IT Division
Chief Financial Officer (CFO)
General Affairs Division
Financial Control Division
Chief Business Risk Officer
Loan Recovery Divisions
Credit Risk Divisions
Managing Director –Entreprise Risk Management
Risk Management Division
BNI h d i ifi h f i b i h i h l i h i h l
Service Committee
DisciplinaryCommittee
Human ResourcesCommittee
Planning & Budgeting Committee
Technology Management Committee
Risk & CapitalCommittee
Subsidiaries Mgmt Unit
Key new hires / appointment made under transformation program since: 2010 2009 2008
11
BNI has undergone significant human resource transformation by putting the right people in the right places

C:\DPS NEW\Pres\PPT\PresPrint.pot
Senior management teamg
Gatot M. SuwondoPresident Director/CEOSince February 2008
Felia SalimVice President Director/CROSince February 2008
Yap Tjay SoenManaging Director/CFOSince February 2008
Krishna R SupartoManaging DirectorBusiness Banking
Ahdi Jumhari LuddinManaging Director Compliance
Suwoko SingoastroManaging DirectorNetwork and Services
Previously: Vice President Director of BNI, MD of Bank Danamon
Previously: Independent Commissioner of BNI, Deputy Chairman ‐ IBRA, Director, Jakarta Stock Exchange
Previously: Commissioner of Bank Mandiri & BNI, Director‐CFO of BII, various executive positions in Astra, Asia Food & Properties, Tuban Petro Chemical, & ANTAM
Since February 2008Previously: President Director of Barclays Securities, Managing Director of Bank Danamon
Since February 2008Previously: Director, Banking Supervisory, Bank Indonesia
Since February 2008Previously: EVP Network &Operation, GM of NetworkDistribution Division
Honggo Widjojo KangmastoManaging DirectorNetwork and ServicesSince May 2010
Darmadi SutantoManaging DirectorConsumer BankingSince May 2010Previously: Director of
il ki S
SutantoManaging DirectorEnterprise Risk ManagementSince May 2010Previously: GM Risk
i i i G
Adi SetiantoManaging DirectorTreasury and Financial InstitutionsSince May 2010
i l G i i l
Sutirta BudimanChief Business Risk OfficerSince September 2010Previously: Commissioner of BNI Securities, CFO of
k i iPreviously: MD Permata Bank, MD Indofood, EVP Bank Mandiri
Retail Banking RBS Management Division, GM Training Division
Previously: GM InstitutionalFunding, GM Bancassurance
Aneka Kimia Raya
12
BNI has been further enhancing its management through key hires with strong industry experience

C:\DPS NEW\Pres\PPT\PresPrint.pot
Board of Commissioners
Peter B. Stok Tirta HidayatPeter B. StokPresident Commissioner(Independent) Since May 2009Previously: Commissioner BankPermata, President DirectorB k Ni P id t
Tirta HidayatVice President CommissionerSince May 2010Previously: Lecturer fromUniversity of Indonesia,Economic Deputy at Vice President office
Achil Ridwan DjayadiningratC i i
Fero PoerbonegoroC i i
Bank Niaga, PresidentDirector Bank Dagang Negara
Bagus RumbogoC i iCommissioner
(Independent)Since February 2008Previously: Managing Director of BNI(Compliance and Human Resource)
Commissioner(Independent)Since February 2008Previously Managing Director of BNI (Treasury & Private Banking)Managing Director of Bank BCA
CommissionerSince May 2010Currently: Advisor to the Ministry of State‐Owned Enterprises
BS KusmuljonoCommissioner(Independent)
Ekoputro AdijayantoCommissionerSince May 2010
This transformation will only be made possible by our effective and experienced professionals
Since May 2010Previously : Commissioner BRI,President Director of PT PNM
Currently: Advisor for Ministry of State‐Owned EnterprisesPreviously SVP Bank Mandiri
13
This transformation will only be made possible by our effective and experienced professionals

Section 2Section 2
Strategy & Next Steps

C:\DPS NEW\Pres\PPT\PresPrint.pot
BNI transformation
Start Small Think Big
Energise, mobilise and start implementing transformation
processFix the basics
Compete with domestic leaders
Differentiate ourselves from the pack and strive to be the
best in classprocess best in class
2008
Improve asset qualityAggressively seek low cost of fundingImplement customer centric operating model
Increase asset qualitySharpening focus of BNI portfolio on corporate and consumerDiversify fee‐based incomeda
y
b i l i i f i i d h d li d f l f
First 6 months 6‐18 months 18‐36 months 36‐60 months
Implement customer centric operating modelImprove cross‐sellingStrengthen capital position
Diversify fee based incomeAggressive CASA growthIncrease efficiency of operations
BNI Tod
15
BNI began implementing its transformation program in 2008 and has delivered a strong set of results so far

C:\DPS NEW\Pres\PPT\PresPrint.pot
Well positioned fort h f thnext phase of growth
1 Dominant bank in Indonesia with well‐established brand and deep history
S l i i d i li2
3 Comprehensive and competitive
Strongly positioned to capitalize on Indonesia’s growth
Top business bank3 p pproduct offering
4 Extensive domestic and international t k
Top business bank
5
network
Stable deposit franchise with low cost of funding
6
g
Significant improvement in credit risk management
Top 3 consumer bank
16

C:\DPS NEW\Pres\PPT\PresPrint.pot
To bet b i b ktop business bank
Business Banking Client PortfolioBusiness Banking Client Portfolio
Diamond Clients
Foundation Clients
orpo
rates
ing
s e alers
uction
Client focused model
8 target industries
Developing deep industry knowledge
1
Base Corporate
Ruby Clients
Portfolio Clientsm‐Sized
panies
Co
& Gas and
Min
ommun
ication
Chem
icals
Agriculture
ood & Beverage
ers & W
holesa
Electricity
ering & Con
str
Understanding who most valuable clients are
Through maintaining strong relationships with li t
2
Base Commercial
Small Businesses
Med
iuCo
mp
Oil & Co Fo
Retail
Engine
e clients
Providing customized sales and service treatment to add value
Relationship‐based pricing and solutions
Business Banking Relationship Managers
Business Banking Products and Services Suite
Relationship based pricing and solutions
Providing first‐class product support
Increasing product specialization
3
We are moving from a product‐centric model to a customer‐based model h d ff l d k h
Business Banking Products and Services SuiteCredit &Funding
TransactionalBanking
TradeFinance
TreasuryProducts
Fostering collaboration across products
17
to enhance our product offering to our clients and market share

C:\DPS NEW\Pres\PPT\PresPrint.pot
To bet 3 b ktop 3 consumer bank
Key Target Customer Segments
i h h
Dominant Value Propositions
Consumer & Retail Banking Products and
Services
High Net Worth
Affluent Families
l
Lifetime Banking Partner
L di th i Di t
Deposits
LendingYoung Elites
Students
Leading the way in Direct Banking
“Wealth management supermarket” for mass
Remittance
Middle Income Families
Wealthy Singles
supermarket for mass affluent
Leader in Wealth Planning & Management
Cards
Wealth ManagementGolden Oldies
g ea t a age e t
BNI will be positioned to become the Lifetime Banking Partner for our retail customers by understanding their needs
18
p g y g

C:\DPS NEW\Pres\PPT\PresPrint.pot
Rights issue to lead t h tnext chapter
1 Strategic transformation underway1 Strategic transformation underway
Ri h i ill f h h b2 Rights issue will further enhance our asset base
3 Rights issue will finance our business growth
19

Section 3Section 3
Performance

C:\DPS NEW\Pres\PPT\PresPrint.pot
Exceptional turnaroundt d tproven to date
2007 3Q2010
1. Asset qualityGross NPL: IDR7.6tnNPL ratio: 8.53%1
Coverage: 71.9%1 +
Q
Gross NPL: IDR5.5tnNPL ratio: 4.38%1
Coverage: 118.3%1
2. Low cost fundCost of deposits: 4.73% LDR: 60.6% +Cost of deposits: 3.53%
LDR: 68.6%
3. Productivity, Efficiency and Profitability
NIM: 5.4%2
CIR: 65.8%ROAA: 0.51%3 / ROAE: 5.6%3 +
NIM: 6.1%2
CIR: 51.5%ROAA: 1.74%3 / ROAE: 19.5%3
4. Strengthen BNI Incorporated
ATMs: 2,476Number of customers: 9.6mNon‐interest income: IDR4.1tn
+ATMs: 4,072Number of customers: 10.9mNon‐interest income: IDR3.4tn
BNI h fi d h b i d i d b k i f k l d hi
5. Strengthen CapitalTier‐1 capital: 11.2%CAR: 15.9%
Tier‐1 capital: 10.2%CAR: 12.4%
21
BNI has fixed the basics and is ready to embark on its strategy for market leadership
Source: Company reportsNotes: Consolidated figures shown unless otherwise noted1 Based on Bank Indonesia classification2 Calculated based on net interest and Syariah income for the relevant year/period as a percentage of average total interest earning assets excluding commitments and contingencies. Annualized for 3Q2010 3 Return on average assets calculated as net income / average assets; Return on average equity calculated as net income to shareholders / equity attributed to bank shareholders. Annualized for 3Q20104 Cost of deposits calculated as interest expense on deposits from customers and other banks/average deposits from customers and other banks. Annualized for 3Q2010

C:\DPS NEW\Pres\PPT\PresPrint.pot
Balance sheet
(IDR bn, FYE 31 December) 2007 2008 2009 3Q2009 3Q2010 YoY (%)
Total assets 183,342 201,741 227,497 203,060 224,811 10.7%
Placement with other Banks & BI 32,382 31,993 38,153 28,283 31,460 11.2%
Marketable securities 52,901 44,529 50,237 43,447 50,261 15.7%
Loans (gross) 88,651 111,994 120,843 122,116 126,074 3.2%
Customer deposits 146 189 163 164 188 469 163 654 183 772 12 3%Customer deposits 146,189 163,164 188,469 163,654 183,772 12.3%
Deposits from other Banks 3,804 4,100 3,819 3,495 3,155 (9.7%)
Marketable securities issued 1,269 1,269 1,261 1,267 1,277 0.7%
Borrowings 6,309 8,617 5,570 7,737 5,185 (33.0%)
Shareholders’ equity 17,220 15,431 19,144 18,406 21,318 15.8%
22Source: Company reports
Note: Consolidated figures shown unless otherwise noted

C:\DPS NEW\Pres\PPT\PresPrint.pot
Loan compositionp
Loan breakdown by segment (%) Loans by currency (%)
6.6% 5.6% 3.9% 3.8%2.0% 2.8% 2.7% 2.6%100%
Gross loans (IDR trn)
(10.4%)
34.7%
07‐09 CAGR (%)
88.7 112.0 120.8 126.1 11.8%13.3%20.1%26.3%
50%
75%
100%
y g ( ) y y ( )
14.9% 15.4%15.3% 16.6%
80%18.5%
( )88.2%86.7%79.9%73.7%
0%
25%
50%
2007 2008 2009 3Q2010
43.0% 42.8% 44.4% 40.3%
40%
60%18.6%
Average yield on IDR loans – 1H2010 (%)
IDR Foreign
28 7%30 0%
33.5% 33.4% 33.7% 36.7%20%17.2% 12.3% 11.8%
13.5% 14.1%
28.7%
10.0%
20.0%
30.0%
0%
2007 2008 2009 3Q2010
Corporate SME Consumer Internationa l Syariah
0.0%
Corporate Medium Small Consumer Credit Card
23Source: Company reports
Note: Consolidated figures shown unless otherwise noted

C:\DPS NEW\Pres\PPT\PresPrint.pot
Loan diversification
Loan breakdown by economic sector Consumer loan composition
27 6%90%
100%
88.7Gross loans (IDR trn)
112.0 120.8 126.1
11.3%10.4%
8.1%5.1%
3.1% 1.8% 2.4%1.1%1.6%2.6%
1.7%1.1%1.6%1.5%2.0%
90%
100%
13.2Gross loans (IDR trn)
17.2 18.4 20.9
3.2%
4.2%6.3% 7.0% 6.9%
27.6% 30.3% 29.3% 29.6%
4 8%3.0% 3.2%
4.9%
60%
70%
80%
26.8%26.5%
22.8%
13.3%
11.3%
60%
70%
80%
20.0%18 8%
4.5%4.6% 6.4% 7.1%
5.3%5.0% 4.7% 7.1%
4.3%6.0% 5.7%4.8%
40%
50%
60%24.7%
40%
50%
60%
28.5% 26.0% 23.4% 22.9%
18.8%20.2% 18.9%
10%
20%
30%
36.0%40.9%
44.7%51.0%
10%
20%
30%
Manufacturing Hospita l i ty Agricul ture
Constructions Electrici ty Gas & Water Mining
0%
10%
2007 2008 2009 3Q 20100%
10%
2007 2008 2009 3Q2010
Mortgages Auto Credit cards
24Source: Company reportsNotes: Consolidated figures shown unless otherwise noted1 Others include Business services, Social services as well as Others not classified2 Consumer loans includes outstanding credit card receivables
Constructions Electrici ty, Gas & Water Mining
Transportation & Comm OthersMulti ‐purpose Unsecured Cash col latera l

C:\DPS NEW\Pres\PPT\PresPrint.pot
Marketable securities
Securities by type1 Currency breakdown
17 6%13.4%
20 2%
100%
y yp y
Total (IDR trn)
3.0% 1.9%5.3%9 5%
2.5% 3.2%100%
17.319.510.216.2
17.6%25.9%
20.2%
80%15.7%
17 3%
2.0%
9.8%
16.7% 16.3%
2.6%
6.8%
9.5%
70%
80%
90%
82.4%74 1%
86.6%79.8%40%
60%21.3%
17.3%22.6%
50%
60%
74.1%
20%
74.3%
52.5%60.5%
56.1%
20%
30%
40%
0%
2007 2008 2009 3Q2010
IDR Foreign
0%
10%
2007 2008 2009 3Q2010
25Source: Company reportsNotes: Consolidated figures shown unless otherwise noted1 Others include Medium term notes and Other debt securities
Certi fi cate of BI Bonds Mutua l funds Credit l inked notes Others

C:\DPS NEW\Pres\PPT\PresPrint.pot
Customer depositsp
Customer deposits by type Deposits by currency
15.0% 15.7% 18.4% 19.4%
60%
80%
100%
100%
62.3%CASA 57.9% 55.1% 56.5%
146.2Customerdeposits (IDRtrn) 163.2 188.5 183.8
85.0% 84.3% 81.6% 80.6%
0%
20%
40%
2007 2008 2009 3Q2010
37.7%42.1% 44.9% 43.5%80%
32.9%32.1%
31 2% 31.4%40%
60%
Dep
osits (ID
Rbn)
Cost of deposits 1
IDR Foreign
8.00
29.4% 25.8% 23.9% 25.1%
31.2%
20%
40%
3.854.73 4.33
3.53
2 00
4.00
6.00st of deposit (%
)
23.9%
0%
2007 2008 2009 3Q2010
Current Savings Time
0.00
2.00
2007 2008 2009 3Q2010
Cos
26Source: Company reportsNotes: Consolidated figures shown unless otherwise noted1 Cost of deposits calculated as the sum of interest expense on deposits to customers and banks; Mudharabah profit‐sharing and Wadiah bonus/Average deposits to customers and other
banks. Annualized for 3Q2010

C:\DPS NEW\Pres\PPT\PresPrint.pot
Liquidity managementq y g
Optimal liquidity1Room for loan expansion
60.668.6
64.168.6
60.0
80.0
sit ratio (%
) 29.9 30.6 28.8 27.3
20
30
40
sets (%)
0.0
20.0
40.0
2007 2008 2009 3Q2010
Loan
to dep
os
0
10
20
2007 2008 2009 3Q2010
Liquid ass
106.6120.0R (%
)
Healthy IDR liquidity Flush with FX liquidity
68 275.080 0%
)
88.0
46.2 42.040.0
80.0
n de
nominated
LDR
52.6
65.0 68.2
20.0
40.0
60.0
80.0
enom
inated
LDR (%
0.0
2007 2008 2009 3Q2010Foreign
0.0
2007 2008 2009 3Q2010
IDR de
27Source: Company reportsNotes: Consolidated figures shown unless otherwise noted1 Liquid assets calculated as sum of cash, government bonds and net placement to other banks and Bank of Indonesia / total assets

C:\DPS NEW\Pres\PPT\PresPrint.pot
Stable deposit franchise ith l t f f di
5
with low cost of funding
Customer deposits by type Deposit breakdown by customers
62 3%CASA 57 9% 55 1% 56 5%
100%
62.3%CASA 57.9% 55.1% 56.5%
146.2Customer deposits (IDRtrn) 163.2 188.5 183.8
19.6%19 8%
2.7%2.2%
1 9%
200,000
163,164
188,469183,772
37.7%42.1% 44.9% 43.5%80%
30.2% 28.7%
23.5%
21.9%
19.8%1.9%
1.2%150,000
bn)
146,189
32.9%32.1%
31.2% 31.4%40%
60%
Deposits (IDRbn)
25.0%
26.5%100,000
Deposits (IDRb
29.4%25.8% 23.9% 25.1%
20% 50.3%49.7%
48.1% 48.9%50,000
Deposit franchise strengthened by cash management business
0%
2007 2008 2009 3Q2010
Current Savings Time Individua l / Reta i l Insti tutiona l Government Syariah
0
2007 2008 2009 3Q2010
28
Deposit franchise strengthened by cash management business
Source: Company reports
Note: Consolidated figures shown unless otherwise noted
C:\DPS NEW\Pres\PPT\PresPrint.pot
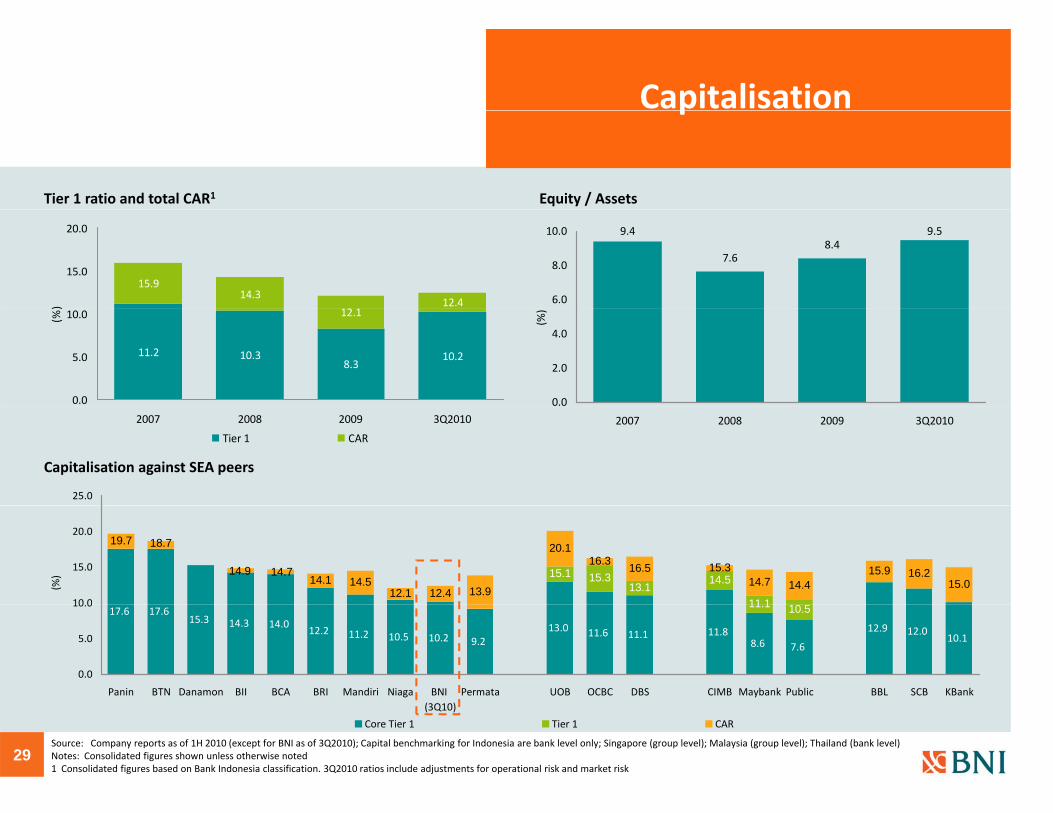
Capitalisationp
Tier 1 ratio and total CAR1 Equity / Assets
12.414.3
15.915.0
20.0
)
9.4
7.68.4
9.5
6.0
8.0
10.0
11.2 10.38.3
10.2
12.1
0.0
5.0
10.0(%)
0.0
2.0
4.0
(%)
25.0
2007 2008 2009 3Q2010
Capitalisation against SEA peers
Tier 1 CAR
2007 2008 2009 3Q2010
13.1 15.3 15.1 14.5
11 1
15.0 16.2 15.9
14.4 14.7 15.3 16.5 16.3
20.1
13.9 12.4 12.1 14.5 14.1
14.7 14.9
18.7 19.7
10 0
15.0
20.0
(%)
17.6 17.615.3 14.3 14.0
12.2 11.2 10.5 10.2 9.213.0 11.6 11.1 11.8
8.6 7.6
12.9 12.010.1
10.5 11.1
0.0
5.0
10.0
Panin BTN Danamon BII BCA BRI Mandiri Niaga BNI ( )
Permata UOB OCBC DBS CIMB Maybank Public BBL SCB KBank
29
(3Q10)
Core Tier 1 Tier 1 CAR
Source: Company reports as of 1H 2010 (except for BNI as of 3Q2010); Capital benchmarking for Indonesia are bank level only; Singapore (group level); Malaysia (group level); Thailand (bank level)Notes: Consolidated figures shown unless otherwise noted1 Consolidated figures based on Bank Indonesia classification. 3Q2010 ratios include adjustments for operational risk and market risk

C:\DPS NEW\Pres\PPT\PresPrint.pot
Strong asset quality and d t i i liprudent provision policy
Gross NPL balance Net charge‐off ratio
3.57%
4.34%
3.48%
3.00%
4.00%
5.00%7,565
5,596 5,762 5,5206,000
8,000
bn)
1.92%
0 00%
1.00%
2.00%
0
2,000
4,000
(IDR
0.00%
2007 2008 2009 3Q2010
NPL ratio2 NPL coverage ratio2
2007 2008 2009 3Q2010
140%8.53%9.00%
71.9%
101.0%
120.1% 118.3%
60%
80%
100%
120%
140%
5.00% 4.77%4.38%
6.00%
0%
20%
40%
2007 2008 2009 3Q2010
0.00%
3.00%
2007 2008 2009 3Q2010
30Source: Company reportsNotes: Consolidated figures shown unless otherwise noted1 Charge‐off ratio calculated as provision expense / average gross loans. Annualised for 3Q20102 Based on Bank Indonesia classification. BNI is in the process of transitioning to a new accounting standard PSAK 55 which would impair all loans that have been individually assessed, this would increase impaired loans from IDR 5.5tn to IDR 6.9tn as of 30 September 2010, the implied impaired loan ratio would be 5.51% and implied loan coverage ratio would be 94.0%

C:\DPS NEW\Pres\PPT\PresPrint.pot
Income statement
(IDRbn, FYE 31 December) 2007 2008 2009 3Q2009 3Q2010 YoY (%)
Net interest income 7,467 9,912 11,133 8,310 9,005 8.4%
Non interest income 4,130 3,549 4,295 3,146 3,404 8.2%
Operating income 11,597 13,461 15,428 11,456 12,409 8.3%
Operating expenses (7,626) (7,228) (7,991) (5,708) (6,391) 12.0%
Pre‐Provision Operating Profit 3 971 6 233 7 437 5 748 6 018 4 7%Pre Provision Operating Profit 3,971 6,233 7,437 5,748 6,018 4.7%
Net provisions (2,704) (4,359) (4,051) (3,483) (1,776) (49.0%)
Profit before tax 1,481 1,932 3,444 2,343 4,249 81.4%
Net Income to shareholders 898 1,222 2,484 1,855 2,954 59.3%
31Source: Company reports
Note: Consolidated figures shown unless otherwise noted

C:\DPS NEW\Pres\PPT\PresPrint.pot
Net interest income
Interest income composition Interest expense compositionInterest
3.2%2.2%
1 8%1.0%2.1% 7.7%
4.3% 3.4%5.4% 3.3% 1.6% 3.4%100%
7.4 6.7 8.3 5.4Interestexpense(IDRbn)
0.5%12 3%
0.3% 0.2%100%
14.5 16.1 18.9 14.4Interest income(IDRbn)
NIM (%) 5.4 6.5 6.1 6.1
1.8%
75%
2.6%3.3%
6.2%
5.5%6.3%
4.9%4.5%
3.0%1.9%24.6%
21.7%16.8% 12.3%
75%
91.5%87.2%
91.8% 90.1%
50%
75 6%
1.2%
2.0%12.3%
50%
25%56.8%65.6%
71.9% 75.6%
25%
Depos i ts Syariah Borrowing Marketable Securi ties
0%
2007 2008 2009 3Q2010
Loans Syariah Marketable Securi ties Placement Govt Others
0%
2007 2008 2009 3Q2010
32Source: Company reports
Note: Consolidated figures shown unless otherwise noted
p y g

C:\DPS NEW\Pres\PPT\PresPrint.pot
Non‐interest income
Non‐interest income breakdown1 Recurring fee income breakdown
21 2%13.8% 13.5% 13.3%
90%
100%
351
4,500
35.6%Non interest income ratio
26.4% 27.8% 27.4%
4,1304,295
23 1%15.5%
7.8%3.9%
5.3% 6.0%
2.2%
1.5% 1.6% 1.8%
4.7%
3.8% 5.1% 4.7%6.6%
6.0% 5.2% 4.6%21.2%
3.6%
60%
70%
80%
680 1,027
266
630
262
322
351
91184
365
3,000
3,549
3,404
17.0%
13.5%15.3% 15.8%
5.1%
8.6%
8.8%15.2%
7.9%23.1%
40%
50%
60%
1,223
424
674
764
995
1 500
(IDR bn
)
31.4%26.0% 29.9% 30.9%
10%
20%
30%
1,5971,976
2,231
1,461
1,500
Monthly account services Credit card
Investment and financial services FX trading
ATM Bill payments
0%
2007 2008 2009 1H 2010
Fee and commissions Gains on marketable securities
Insurance premium Foreign exchange gains
0
2007 2008 2009 3Q2010
33
Bank guarantee Trade finance
OthersOthers
Source: Company reportsNotes: Consolidated figures shown unless otherwise noted1 In 2008, there was a decrease in the value of marketable securities of IDR143bn

C:\DPS NEW\Pres\PPT\PresPrint.pot
Operating expensesp g p
Breakdown of operating expenses Cost income ratio
3.9% 4 9%
3.8% 3.6% 4.2% 4.3%
3.5% 4.7% 5.4% 4.4%
90%
100%
7,626Operatingexpenses(IDR bn)
7,228 7,991 6,391
80.0%
31.3%
9.1%9.8%
12.8%16.1%
4.9% 5.3% 6.7%
70%
80%
90%
65.8%
53.7%51.8% 51.5%
60.0%
31.3%31.5%
28.9%27.2%
40%
50%
60%
40.0%
48.4% 45.6% 43.3% 41.3%20%
30%
20.0%
0%
10%
2007 2008 2009 3Q2010
Personnel Expense Genera l & Adminis trative
Underwri ting Insurance Promotion Expense
0.0%
2007 2008 2009 3Q2010
34Source: Company reports
Note: Consolidated figures shown unless otherwise noted
Underwri ting Insurance Promotion Expense
Depos i t Premium Others

C:\DPS NEW\Pres\PPT\PresPrint.pot
Profitabilityy
Return on average assets1 Return on average equity1
1.74%
2.00%19.5%20.0%
1.74%
1.50%14.4%15.0%
1.16%
1.00%
7.5%
10.0%
0.51%
0.64%
0.50%
5.6%
5.0%
0.00%
2007 2008 2009 3Q2010
0.0%
2007 2008 2009 3Q2010
35Source: Company reportsNotes: Consolidated figures shown unless otherwise noted1 Return on average assets calculated as net income / average assets; Return on average equity calculated as net income to shareholders / equity attributed to bank shareholders.
Annualised for 3Q2010

C:\DPS NEW\Pres\PPT\PresPrint.pot
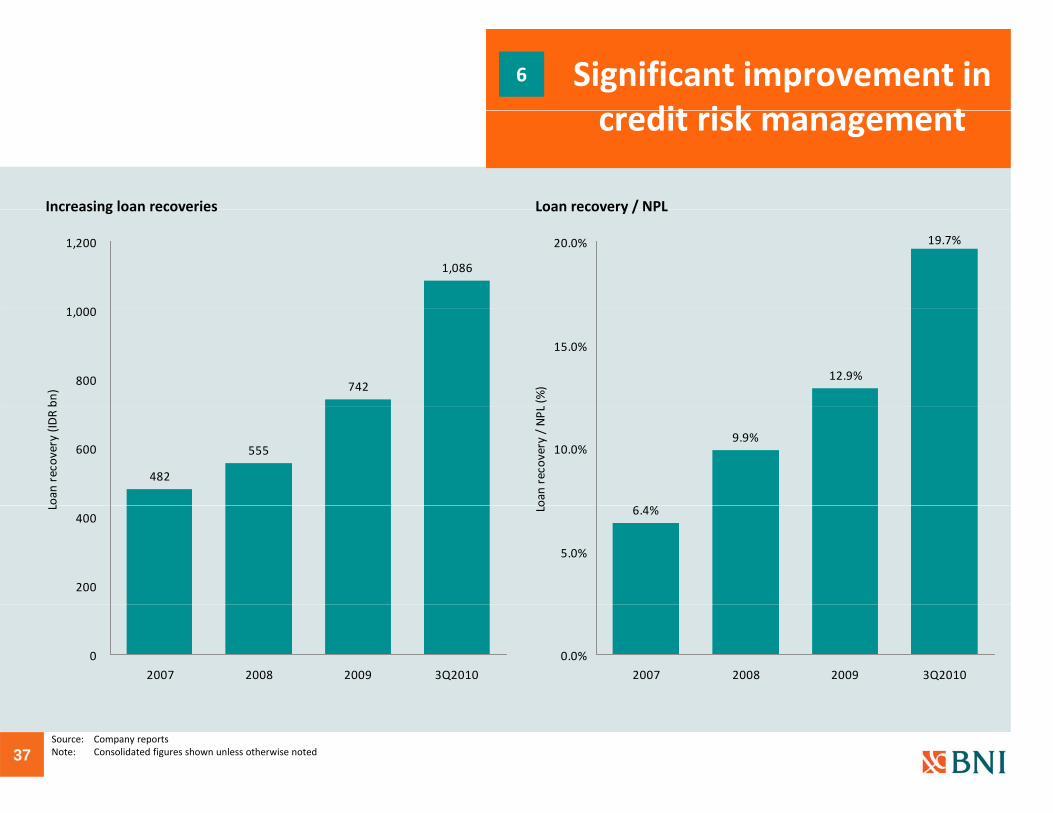
Significant improvement in dit i k t
6
credit risk management
NPL ratio1 Gross NPL1
8.53%
8.00%
10.00%
(%)
NPL ratio
7,565
5,596 5,762 5,5206,000
8,000
DR bn
)
Gross NPL
5.00% 4.77% 4.38%
0 00%
2.00%
4.00%
6.00%
NPL ratio (
0
2,000
4,000
Gross NPL (ID
0.00%
2007 2008 2009 3Q2010
Adequate provisioningGross charge‐off ratio
0
2007 2008 2009 3Q2010
140%
3.25%
4.41%
3.44% 3.56%
3.00%
4.00%
5.00%
rge‐off ratio (%
)
71.9%
101.0%
120.1% 118.3%
60%
80%
100%
120%
140%
rage
ratio (%)
0.00%
1.00%
2.00%
2007 2008 2009 3Q2010
Gross char
0%
20%
40%
60%
2007 2008 2009 3Q2010
NPL cover
36Source: Company reportsNote: Consolidated figures shown unless otherwise noted1 3Q2010 based on Bank Indonesia classification2 Gross provisions (before loan recoveries) / average gross loans. Annualised for 3Q2010
C:\DPS NEW\Pres\PPT\PresPrint.pot
Significant improvement in dit i k t
6
credit risk management
Increasing loan recoveries Loan recovery / NPL
19.7%20.0%
1,086
1 000
1,200
Increasing loan recoveries Loan recovery / NPL
12.9%
15.0%
L (%)742800
1,000
bn)
9.9%10.0%
oan recovery / NPL
482
555600
Loan
recovery (ID
R
6.4%
5.0%Lo
200
400
L
0.0%
2007 2008 2009 3Q2010
0
2007 2008 2009 3Q2010
37Source: Company reportsNote: Consolidated figures shown unless otherwise noted

ApendixApendix
Indonesia Macro Indocators

C:\DPS NEW\Pres\PPT\PresPrint.potStrongly positioned to capitalise on Indonesia’s
2p
growth
Largest Southeast Asia economy Strong private consumption
I d i
Singapore14%
Philippines12%
1,7822,000
n)
36% 57% 58% 55% 74% 50% 62% 2009 Private consumption (% of GDP)
Government consumption9%
Investment30%
Indonesia40%
Thailand20%
Malaysia14%
743
317145 119 96 74
500
1,000
1,500
Nom
inal priv
ate
consum
ption (US$b
Net exports3%
Private consumption
58%
Low banking penetration
2009 Southeast Asia GDP US$1,340bn 2009 Indonesia GDP US$551bn
218 4,683 210 249 546 56 129Credit o/s (US$bn)
74
0
China India Indonesia Thailand Philippines Malaysia Singapore
Credit o/s per capita (US$)
45,004 3,526 7,564 3,923 473 622 565
50%26%
18%24% 8%10%
14%9%
80.0%
120.0%
160.0%
dit / GDP (%
)
125% 106% 98% 96% 51% 36% 29%
Indonesia is the largest Southeast Asia economy with a growing financial sector
61%87%
48% 70%38% 19%
26%
31%3%2%8% 7%3%5%
0.0%
40.0%
Singapore China Malaysia Thailand India Philippines Indonesia
2008
Total cred
Corporate Mortgage retail Non‐mortgage retail
39Source: EIU as of September 2010; Global Insight as of September 2010; Street Research; Low banking penetration data for December 2008; Bank Indonesia
Indonesia is the largest Southeast Asia economy with a growing financial sector The banking sector remains underpenetrated with headroom for growth

C:\DPS NEW\Pres\PPT\PresPrint.pot
2Strongly positioned to capitalise on Indonesia’s p
growth
Credit growth1 Strong expected GDP growth
13.7%
7.2% 7.2%
14.1% 13.3% 12.7%
7.7%
10.4%
6 9%
9.8%7.9%
12.5%
14.2%
8 0%
12.0%
16.0%
35.5%31.0%
18 5%
30.0%
40.0%
2005
‐10E
6.8%6.9%
0.0%
4.0%
8.0%
India China Indonesia Philippines Malaysia Singapore Thailand
18.5% 17.3%15.1%
12.5% 10.6%
0.0%
10.0%
20.0%
Indonesia India China Philippines Singapore Thailand Malaysia
Loan
CAGR 2
2012E 2013E
Positive demographics
1,334.7 1,166.0 240.3 98.0 67.0 27.9 5.0 2009
Population (m)
Indonesia India China Philippines Singapore Thailand Malaysia
Large attractive market densely populated
IndonesiaPopulation: 240 millionMalaysia
56%46% 49% 42%
54%46%
64%
8% 5% 6% 5% 9% 5% 9%
40%
60%
80%
100%
SingaporePopulation: 5 million
Population: 240 millionyPopulation: 28 million
SumateraPopulation: 51 million
KalimantanPopulation: 14 million
SulawesiPopulation: 17 million
Maluku and Papua
DKI JakartaPopulation: 10 million
35%49% 46% 53%
37%49%
28%
0%
20%
China India Indonesia Philippines Thailand Malaysia Singapore
<30 31‐64 65+
Bali and Nusa TenggaraPopulation: 13 million
Java (excluding DKI Jakarta)Population: 127 million
Population: 6 million
40
Growth in Indonesia over the coming years is expected to be strong, supported by positive demographics
Source: EIU as of September 2010, Indonesia Center Bureau of Statistics (BPS)
Note:1 Loan CAGR based on private sector credit growth