investor presentation - tiindia.com · investor presentation november 2017 stock codes: ... four...
TRANSCRIPT

1 Tube Investments of India Limited
Investor Presentation
November 2017
Stock Codes: BSE: 540762 NSE: TIINDIA Bloomberg: TIINDIA:IN Reuters: TBEI.NS CIN: L35100TN2008PLC069496

2
Contents Index
Table of Contents Page No
Corporate Profile 3
Company Businesses • Engineering • Cycles and Accessories • Metal formed products • Gears and Gear Products – Shanthi Gears Limited
14 27 40 59

3
Gross Sales Share
EBITDA Share
Murugappa Group and Philosophy
Note: Market data as on 3rd Nov 2017. Source: BSE Sensex and Conversion Rate of 1USD = Rs.64.5764 as on 3rd Nov 2017 Source: RBI
FY 2016-17
FY 2016-17
Company Name Market
Capitalisation Description
INR 193,750 Mn. (USD 3,000 mn)
Cholamandalam Investment and Finance Company Limited is a Non Banking Finance Company and one of the leading financial provider for vehicle finance, business finance, home equity loans, stock broking & distribution of financial products
INR 47,416 Mn. (USD 734 mn)
Tube Investments of India Limited offers wide range of engineering products such as Precision Steel Tubes, Strips, Chains, Metal formed Automotive components and consumer products including Cycles and Fitness equipment
TIFHL INR 111,754 Mn. (USD 1,731 mn)
TI Financial Holdings holds investments in financial services business
INR 149,825 Mn. (USD 2,320 mn)
Coromandel International Limited is the leading phosphatic fertilizer company in India, with a production capacity 3.2 mn tonnes of phosphatic fertilizer
INR 65,671 Mn. (USD 1,017 mn)
EID Parry (India) Limited offers wide range of agro products such as sugar, microalgal health supplements and bio products, with a capacity to crush 34,750 tones of cane per day (TCD)
INR 68,937 Mn. (USD 1,068 mn)
Carborandum Universal Limited is a pioneer in coated and bonded abrasives, super refractories, electro mineral and industrial ceramics. The Company currently has presence in Australia, South Africa, Russia, Canada and Middle East
Unlisted Cholamandalam MS General Insurance Company Limited is a JV of Murugappa Group with Mitsui Sumitomo Insurance Group of Japan, (5th largest insurance group across the globe)
The fundamental principle of economic activity is that no man you transact with will lose; then you shall not.
- Arthashastra
EID 15%
Chola MS 11%
CIFCL 16%
Coromandel 34%
TII 15%
CUMI 7%
Other 2%
EID 15%
Chola MS 8%
CIFCL 28%
Coromandel
25%
TII 12%
CUMI 9%
Other 3%
4
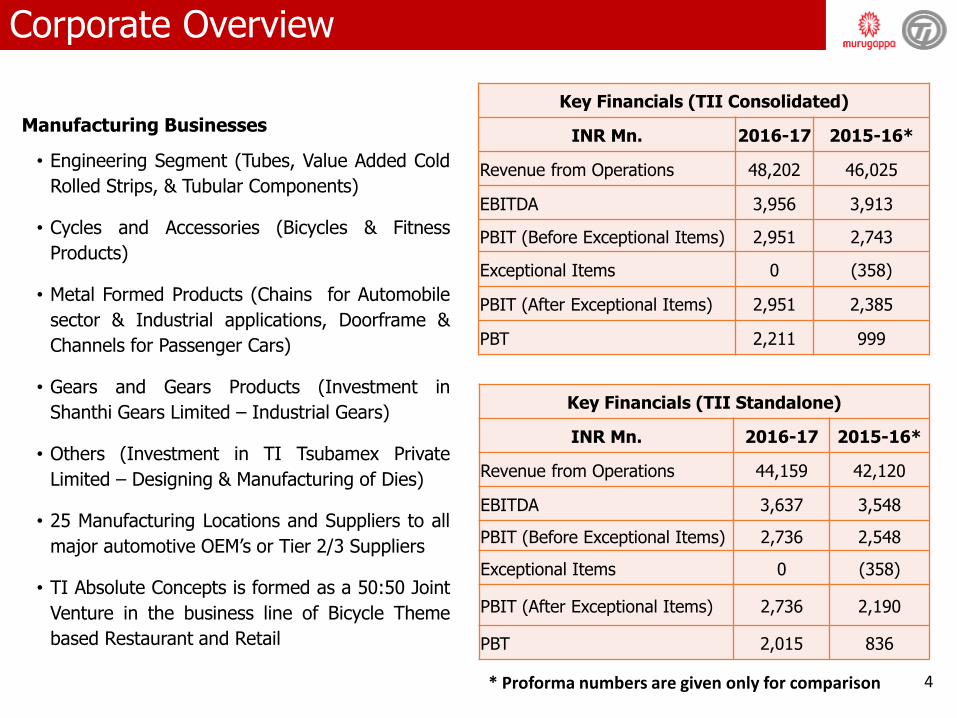
Manufacturing Businesses
• Engineering Segment (Tubes, Value Added Cold
Rolled Strips, & Tubular Components)
• Cycles and Accessories (Bicycles & Fitness
Products)
• Metal Formed Products (Chains for Automobile
sector & Industrial applications, Doorframe &
Channels for Passenger Cars)
• Gears and Gears Products (Investment in
Shanthi Gears Limited – Industrial Gears)
• Others (Investment in TI Tsubamex Private
Limited – Designing & Manufacturing of Dies)
• 25 Manufacturing Locations and Suppliers to all
major automotive OEM’s or Tier 2/3 Suppliers
• TI Absolute Concepts is formed as a 50:50 Joint
Venture in the business line of Bicycle Theme
based Restaurant and Retail
Corporate Overview
Key Financials (TII Consolidated)
INR Mn. 2016-17 2015-16*
Revenue from Operations 48,202 46,025
EBITDA 3,956 3,913
PBIT (Before Exceptional Items) 2,951 2,743
Exceptional Items 0 (358)
PBIT (After Exceptional Items) 2,951 2,385
PBT 2,211 999
Key Financials (TII Standalone)
INR Mn. 2016-17 2015-16*
Revenue from Operations 44,159 42,120
EBITDA 3,637 3,548
PBIT (Before Exceptional Items) 2,736 2,548
Exceptional Items 0 (358)
PBIT (After Exceptional Items) 2,736 2,190
PBT 2,015 836
* Proforma numbers are given only for comparison

5
TII (Standalone) Businesses
Cycles and Accessories Engineering Metal Formed Products
ERW & CDW Tubes, Value Added Cold Rolled Strips & Tubular Components
Largest Supplier of Precision Steel Tubes (CDW)
Second largest bicycle producer in India
• Leader in Chains and Fine blanked components
• Preferred supplier for roll-formed door frames
Bicycles, fitness products and accessories
Chains for Automobile sector & Industrial applications, Doorframe & Channels for Passenger Cars
6
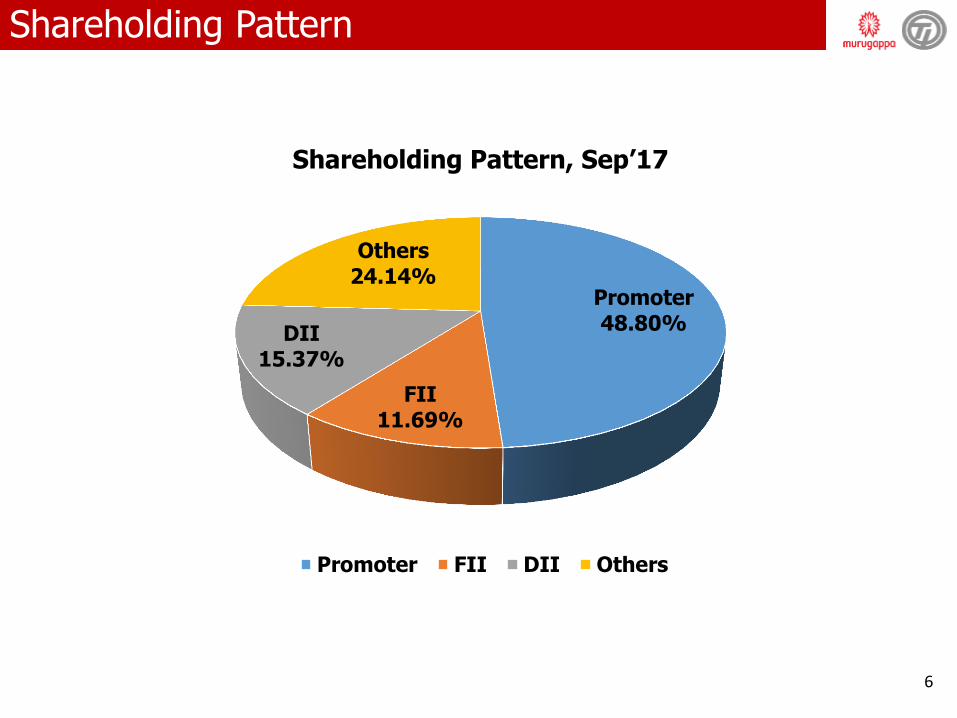
Shareholding Pattern
Promoter 48.80%
FII 11.69%
DII 15.37%
Others 24.14%
Shareholding Pattern, Sep’17
Promoter FII DII Others

7
Key Financials 2016-17
figures in INR Mn.
* Proforma numbers are given only for comparison
Particulars Standalone Consolidated
2016-17 2015-16 * 2016-17 2015-16 *
Gross Sales 42,078 40,414 46,087 44,321
Growth % 4% 4%
Net Sales 39,251 37,739 43,066 41,476
Growth % 4% 4%
EBITDA 3,637 3,548 3,956 3,913
% to Net Sales 9% 9% 9% 9%
PBIT Before Exceptional Item 2,736 2,548 2,951 2,743
% to Net Sales 7% 7% 7% 7%
Exceptional Items - (358) - (358)
PBIT After Exceptional Item 2,736 2,190 2,951 2,385
% to Net Sales 7% 6% 7% 6%
Profit Before Tax 2,015 836 2,211 999
% to Net Sales 5% 2% 5% 2%

8
Key Standalone Financials – H1 2017-18
figures in INR Mn.
Particulars H1
2017-18 2016-17
Gross Sales 22,746 21,007
Growth % 8%
Net Sales 22,003 19,609
Growth % 12%
EBITDA 1,985 2,052
% to Net Sales 9% 10%
PBIT 1,463 1,631
% to Net Sales 7% 8%
Profit Before Tax 1,186 1,219
% to Net Sales 5% 6%
Profit After Tax 809 831
% to Net Sales 4% 4%

9
37,739 39,252
22,003
-
10,000
20,000
30,000
40,000
50,000
60,000
2015-16 * 2016-17 2017-18 YTD
Net Sales
Performance Trends
figures in INR Mn.
* Proforma numbers are given only for comparison
* Proforma numbers are given only for comparison
3,548 3,637
1,985
-
1,000
2,000
3,000
4,000
5,000
2015-16 * 2016-17 2017-18 YTD
EBITDA

10
13.2%
14.6%
14.9%
12%
13%
13%
14%
14%
15%
15%
16%
2015-16 * 2016-17 2017-18 YTD
ROCE%
Performance Trends figures in INR Mn.
^Based on Average Capital Employed
* Proforma numbers are given only for comparison
* Proforma numbers are given only for comparison
2,548 2,736
1,463
836
2,015
1,186
-
1,000
2,000
3,000
2015-16 * 2016-17 2017-18 YTD
PBT and PBIT(Before Exceptional Items)
PBIT PBT

11
Performance Trends
Face Value Per Share – INR 1
Face Value Per Share – INR 1
2.86
8.48
4.32
0.00
2.00
4.00
6.00
8.00
10.00
2015-16 * 2016-17 2017-18 YTD #
Earnings Per Share (Basic)- In INR
52.60
60.92 65.25
0.00
10.00
20.00
30.00
40.00
50.00
60.00
70.00
2015-16 * 2016-17 2017-18 YTD
Book Value Per Share - INR
* Proforma numbers are given only for comparison
* Proforma numbers are given only for comparison
# Not Annualized

12
Performance Trends
Strong Credit Rating CRISIL AA for long term and CRISIL A1+ for short term
* Proforma numbers are given only for comparison
1,240 1,522
962
-
500
1,000
1,500
2,000
2015-16 * 2016-17 2017-18 YTD
Capex in INR Mn
1.42
0.69 0.68
0.00
0.20
0.40
0.60
0.80
1.00
1.20
1.40
1.60
2015-16 * 2016-17 2017-18 YTD
Total Debt/Equity
* Proforma numbers are given only for comparison

13
Businesses
Cycles and Accessories Engineering
Metal Formed Products Gears and Gear Products

14
Leader in CDW tubes for the Automotive industry
Engineering (Tubes and Strips)
15
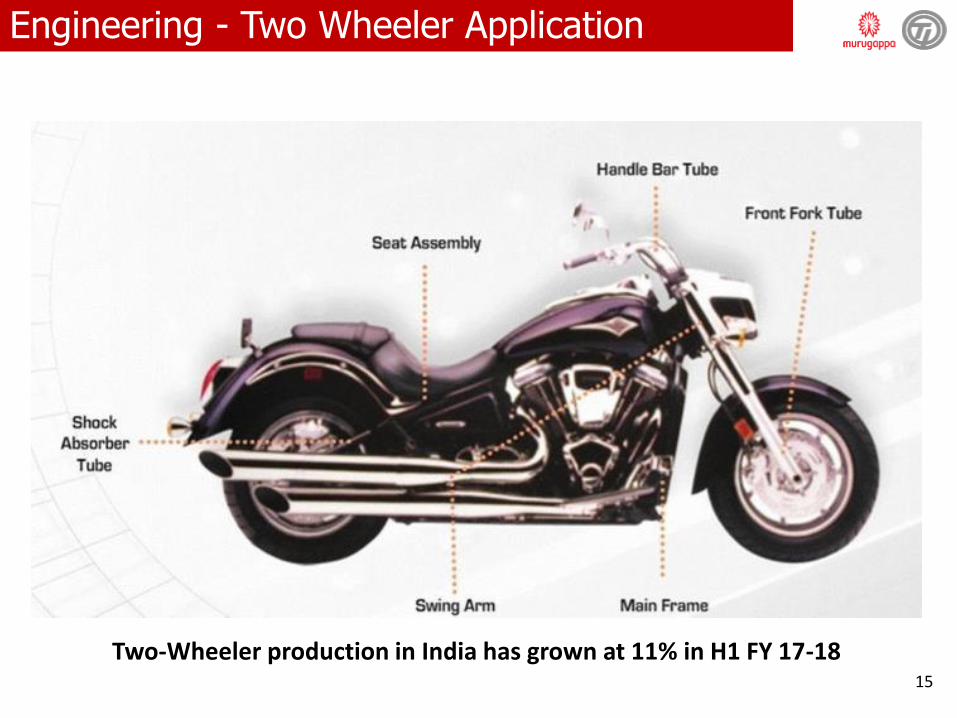
Engineering - Two Wheeler Application
Two-Wheeler production in India has grown at 11% in H1 FY 17-18

16
Engineering - Four Wheeler Application
Passenger Vehicle production in India has grown at 5% in H1 FY 17-18
17
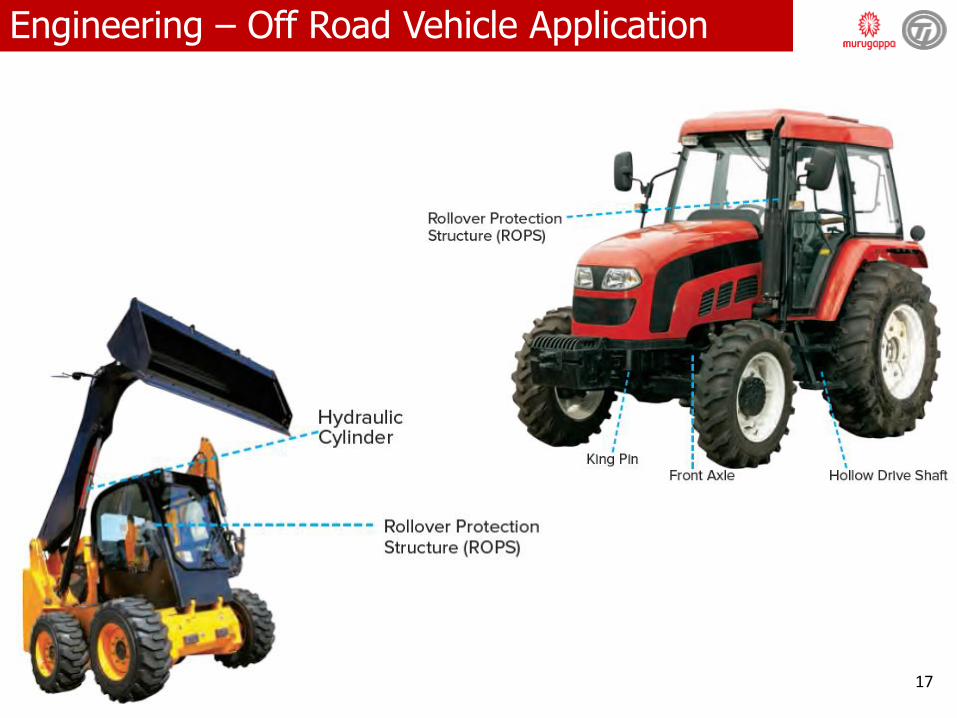
Engineering – Off Road Vehicle Application

18
Precision Steel Tubes (CDW) largely used in
Automobile applications of Two Wheelers/
Passenger Cars and Commercial Vehicles for
applications like Front Forks, Side impact
beams, steering columns etc
CDW tubes also used in Hydraulic Cylinders and
Off-Road Vehicles
Range and adherence to tolerance are the key
factors
Variety of products due to new models
introduced by all auto makers
Customer preference to Value added products
Cost competitiveness through internal
efficiencies
Business Mix H1, FY 17-18
Engineering - Business Drivers
Gear Shift Lever
Rear Axle for Commercial Vehicle
Steering shafts
Auto 77%
Non Auto 23%

19
Engineering - Key Success Factors
• Market leader in High Quality & Safety critical CDW Tubes for 2W and 4W applications
CDW Tube
• Only manufacturer with plants at 4 different locations closer to customers
Multi Location
• Large-dia plant setup in October 2014 providing tubes for hydraulic cylinders, Off-Road applications, import substitution
Gearing for Non-Auto
• Special grades contribute to 71 % of total sales of the CRSS division
• Import substitution program is continuously on CRSS
• Tubular components including Steering column, side impact beam etc
• Value added products form 12% of tube sales
Value Added Products

21
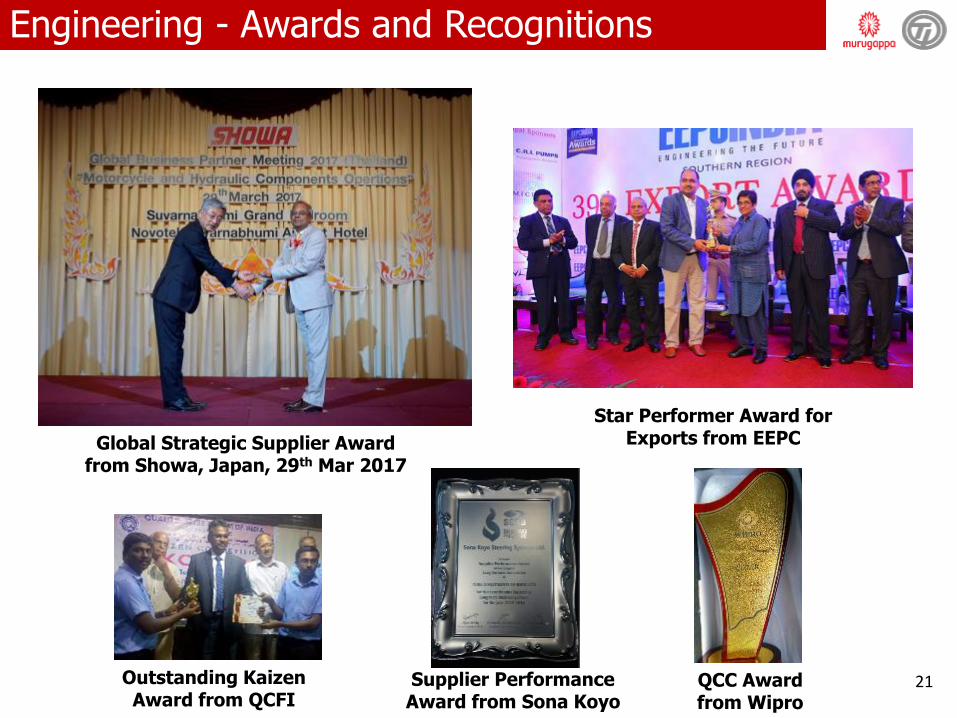
Engineering - Awards and Recognitions
Global Strategic Supplier Award from Showa, Japan, 29th Mar 2017
Star Performer Award for Exports from EEPC
Outstanding Kaizen Award from QCFI
Supplier Performance Award from Sona Koyo
QCC Award from Wipro

22
Engineering - Awards and Recognitions
OSHSAS 18001 Certification for TPI Mohali
IMS: EMS + OHSAS certification received
from M/s BVC for Avadi Complex
“Global Strategic Co-operation Award” from Showa Corporation
Award from WIPRO for consistent improvement in Quality
Best supplier Award for Make in India (Localization) from M/s Spicer for
Tiruttani Tubes Plant

23
Engineering - Awards and Recognitions
• Engineering Division won GOLD Category award with highest score of 96/100 at International Quality Circle Competition (ICQCC) • Maintenance(DPH) - 3G SGA – Gold • Module 1(ERW) - The Y Nots SGA - Gold.
• 150 Companies with 375 teams and 1720 participants from 14 Countries – 129 teams
from India

24
Engineering - Business Highlights H1 17-18
Volume Growth across the segments over PY
Strips grew by 2%
Tubes sales grew by 7% with exports up by 10%
Growth in net sales by 17%
Large Diameter plant stabilized in Quality and Deliveries
Market leadership in Tubular Front Forks (TFF) further strengthened in H1
Samples approved with various new export customers
Bhoomi Puja for Greenfiled tubes plant at Rajpura, Punjab

25
15,326 17,421
10,015
2015-16 * 2016-17 2017-18 YTD
Net Sales
figures in INR Mn.
Engineering - Key Financial Trends
Capital Employed in INR Mn.
^ Based on Average Capital Employed
Particulars 2015-16* 2016-17 2017-18 YTD
NFA 4,383 4,412 4,789
NWC 1,522 1,880 1,614
Total 5,905 6,293 6,403
Capital Expenditure 440 486 643
15%
24% 26%
2015-16 * 2016-17 2017-18 YTD
ROCE %
* Proforma numbers are given only for comparison
* Proforma numbers are given only for comparison

26
figures in INR Mn.
Engineering - Key Financials
* Proforma numbers are given only for comparison
Particulars 2016-17 2015-16* % Growth 2017-18 H1 2016-17 H1 % Growth
Strips: (Vol ‘000 Tonnes) (Incl. group) 82 78 5% 44 42 5%
Tubes: (Vol ‘000 Tonnes) 190 170 12% 107 97 10%
Domestic 164 156 5% 92 84 10%
Exports 26 14 86% 15 13 15%
Gross Sales 19,324 17,097 13% 10,528 9,534 10%
Net Sales 17,421 15,326 14% 10,015 8,594 17%
EBITDA 2,050 1,548 32% 1,124 1,147 -2%
12% 10% 11% 13%
PBIT (Before Exceptional Item) 1,458 945 54% 816 857 -5%
8% 6% 8% 10%
APPLICATION OF FUNDS
Capital Employed 6,293 5,905 6,403 6,198
ROCE% - Based on Avg Capital Employed
24% 15% 26% 29%

27
Pioneers in Promoting Cycling… not just cycles
Cycles and Accessories

28
Standard
In trade sales, the share of standard bicycles is coming down over the years
Government orders for standard cycles continue to flow with more welfare schemes
Specials
In the specials market, while growth is seen in MTB and premium cycles, the overall market has seen a decline
While the trade segment has declined by 17% in the first half, overall market grew by 4% riding on the back of Government Orders
Based on volumes of AICMA members (Source: AICMA Data)
Cycles - Industry
Trade Sales – H1 FY 17-18
40% 28%
60% 72%
Industry TII
Standards Specials
16%
10%
28% 29%
17%
Trade Market Share - H1 FY 17-18
ATLAS AVON HERO TICI Others

29
Cost competitiveness in Standard bicycles and mass specialty bicycles
Product differentiation, Branding and Service are key to success in premium bicycles
Rapid increase in internet penetration throwing up new channels and opportunities
Rising aspiration towards cycling in Urban India
Retail presence enhances customer connect and market share
Brand positioning key for pricing power
Cycles - Business Drivers

30
Cycles - Our Brands

31
•A portfolio of strong brands – BSA, Ladybird, Hercules, Roadeo, Montra and Mach City – addresses all consumer segments
Brand equity
•Roadeo and Montra are premium brands well received and seen exceptional growth
•Representing International brands like Cannondale, Bianchi, Schwinn, Ridley
•PCG registered a growth of 41% vis-à-vis same period last year
Premium Cycle Group
(PCG)
•Large dealer network across India with 10,000+ touch points
•Retail leadership through its exclusive format of Track and Trail
•Track & Trail Urban: 186,
•Track & Trail Sport: 27
•Omni-channel presence through Track & Trail online portal and in-store
Pioneer in Retail
Formats
Cycles - Key Success Factors

32
•Organised 200 Mega Rides across Track and Trail Stores with together ridership of 10,000+
•36 Grand Fondos got 4,000 riders together
•Track and Trail Factory team participated in various cycling competitions
Promoting Cycling not Just Cycles
•TI Cycles has 3 manufacturing plants and 8 additional Warehouses spread across the country
•New Rajpura Plant with Capacity of 3 Mn Cycles p.a. at a Capital Expenditure of INR 958 Mn.
Multi Location Servicing
•49 new Products and 42 product refreshes delivered in H1 of FY 17-18
Pioneer in New
Product Developme
nt
Cycles - Key Success Factors

33
Renewed Retail Experience – Track and Trail
Continuously expanding Track and Trail retail experience into more towns
34
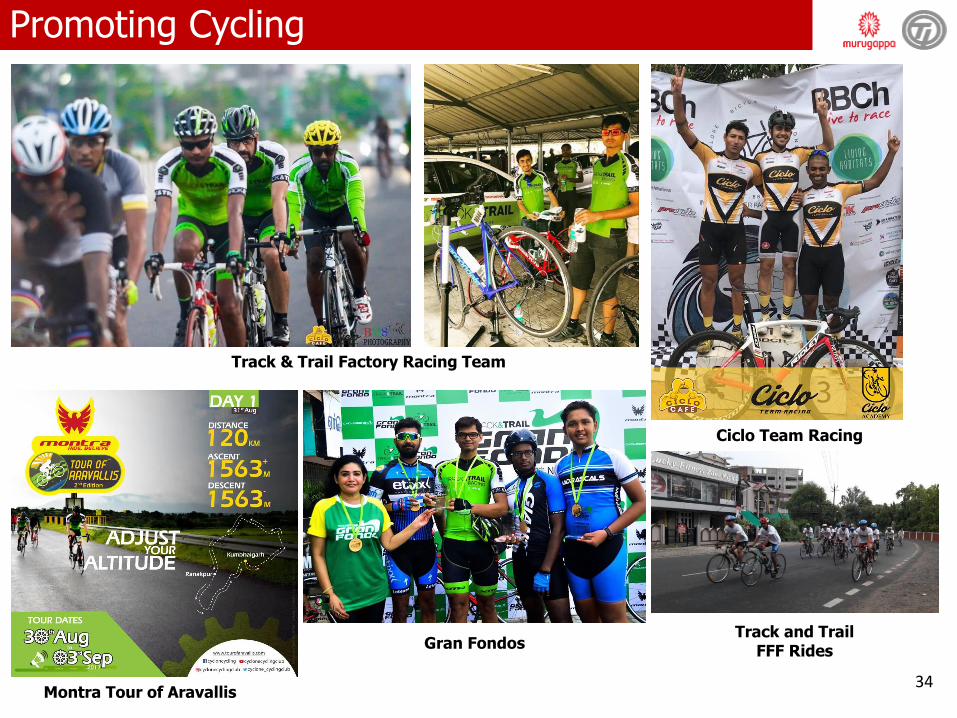
Promoting Cycling
Track & Trail Factory Racing Team
Ciclo Team Racing
Montra Tour of Aravallis
Gran Fondos Track and Trail
FFF Rides

35
Online Bicycle Brand- Brooks
Now live at brooksbicycle.com and Flipkart Offered with complete Assembly and After sale service
36
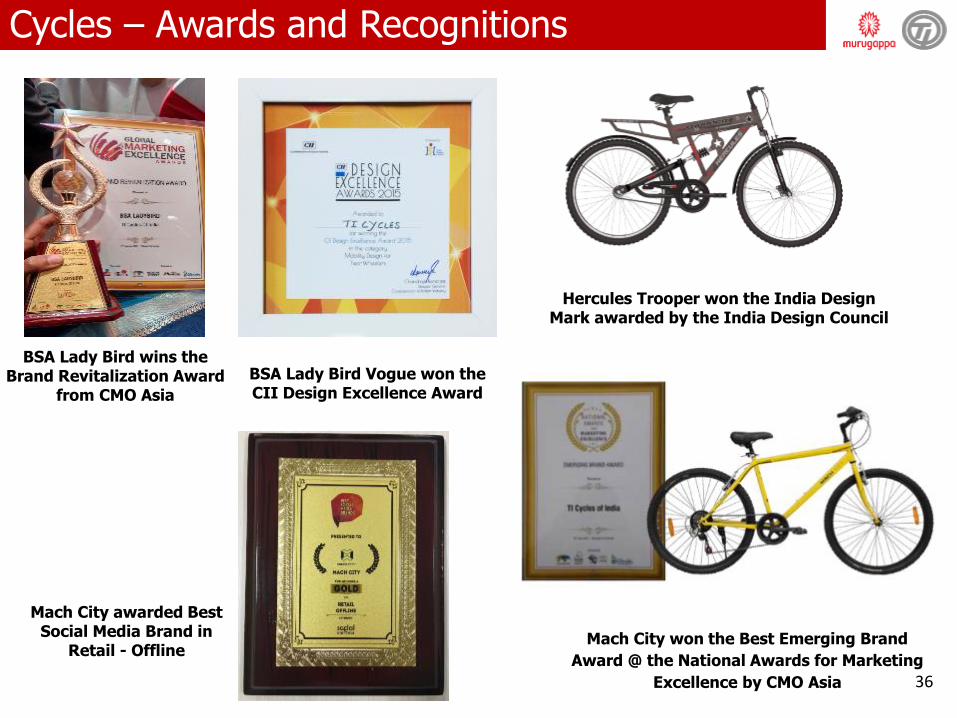
Hercules Trooper won the India Design Mark awarded by the India Design Council
Cycles – Awards and Recognitions
BSA Lady Bird Vogue won the CII Design Excellence Award
BSA Lady Bird wins the Brand Revitalization Award
from CMO Asia
Mach City won the Best Emerging Brand
Award @ the National Awards for Marketing
Excellence by CMO Asia
Mach City awarded Best Social Media Brand in
Retail - Offline

37
Market leadership in H1 at 28.8% among AICMA member companies
41% growth in Premium Cycles Group (Montra, Roadeo and International Brands)
Overall sales volume higher than same period last year by 8%
New Rajpura plant is ramping up on volumes
18 more Track and Trail stores added in H1
Marketing Events
Organized Sales Melas, Service Camps, Mechanic trainings, College Sales & displays all over India
Cycles - Business Highlights H1 2017-18

38
14,675 13,320
7,650
2015-16 * 2016-17 2017-18 YTD
Net Sales
figures in INR Mn.
Cycles - Key Financial Trends
Capital Employed in INR Mn.
^Based on Average Capital Employed
Particulars 2015-16* 2016-17 2017-18 YTD
NFA 1,099 1,518 1,479
NWC 1,547 1,381 2,442
Total 2,646 2,899 3,921
Capital Expenditure 511 540 38
* Proforma numbers are given only for comparison
34%
12% 13%
2015-16 * 2016-17 2017-18 YTD
ROCE %
* Proforma numbers are given only for comparison

39
Cycles - Key Financials
figures in INR Mn.
* Proforma numbers are given only for comparison
Particulars 2016-17 2015-16* % Growth 2017-18
H1 2016-17
H1 % Growth
Volumes
Cycles (Million nos) 4.0 4.6 -13% 2.2 2.0 8%
Gross Sales (incl. Inter Unit) 13,475 14,826 -9% 7,696 6,867 12%
Net Sales (incl. Inter Unit) 13,320 14,675 -9% 7,650 6,788 13%
EBITDA 445 859 -48% 297 328 -9%
3% 6% 4% 5%
PBIT (Before Exceptional Item) 357 788 -55% 234 268 -13%
3% 5% 3% 4%
APPLICATION OF FUNDS
Capital Employed 2,899 2,636 3,921 2,822
ROCE% - Based on Avg Capital Employed
12% 34% 13% 21%

40
Metal Formed Products (Chains, Doorframes and Fine Blanking)
Precision Value added Components

41
Metal formed Products - Product Profile
Metal formed products division cater to both automotive and non-automotive segments as below:
Automotive:
Two Wheeler drive chains, timing chains and Sprockets for Auto-OEMs and After Market
Fine Blanked parts and door frames for Passenger cars
Non-Automotive:
Industrial Chains for the domestic market and exports
Railway sections for Passenger Coaches and Goods Carry Wagons
Business Mix 2017-18 H1
73%
19%
8%
Auto Non-Auto Railways
42
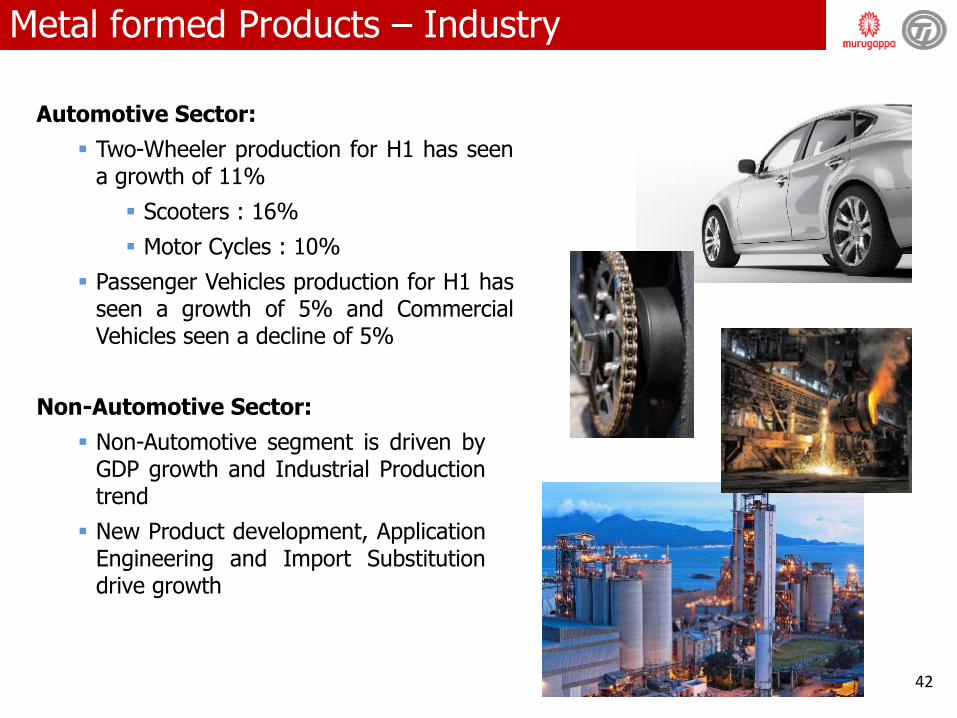
Metal formed Products – Industry
Automotive Sector:
Two-Wheeler production for H1 has seen a growth of 11%
Scooters : 16%
Motor Cycles : 10%
Passenger Vehicles production for H1 has seen a growth of 5% and Commercial Vehicles seen a decline of 5%
Non-Automotive Sector:
Non-Automotive segment is driven by GDP growth and Industrial Production trend
New Product development, Application Engineering and Import Substitution drive growth

43
Metal formed Products – Business Drivers
Auto OEM, Fine Blanked Products , Industrial Chains and Roll Formed Products
• Adequate Capacity
• Good push in the service
• Quality, Consistency and reliability
• Cost Competitiveness
• Factories located closer to customer locations
• New Product Development and Application Engineering and Import Substitution Capability
Auto Aftermarket
• Leveraging brand presence
• Reach and Availability
Exports
• Distributors for Standard Roller Chains
• Price Competitiveness
• Business Development with OEMs for specific programs
• Growth is flat due to global recession

44
Auto Chains– Industry and Customers
Key Customers:
Industry Segments
Two Wheeler Manufacturers (OEMs)
Spare Parts Market – Auto Chains and Sprockets for Motor Cycles

45
Auto Chain- Products
CAM Chain After market brand
Drive Chain KIT

46
Fine Blanking - Industry and Customers
Customers
PH
A
Best Koki
4W OEMs 4W Tier - I
2W OEMs Industrial
Industry Segments
Two Wheeler – Motor Cycles and Scooters OEMs
Four Wheeler – Passenger and Commercial Vehicle OEMs and Tier-I Companies
Industrial Applications

47
Fine Blanking - Products
Transmission Parts
Engine Parts
Motor Cycle
Engine and
Transmission Parts
Scooter Seat Parts
Braking System Parts
Seat Belt and Door Parts
Steering Parts
Transmission Parts
Engine Parts
Hood Parts

48
Indust
ry S
egm
ents
Construction Equipment Manufacturers
Material Handling
( Fork Lifts )
Agricultural Equipment Manufacturers
Cement and Power
Conveyer Manufacturers
Textile and Packing
Primary Metals (Steel)
IC/ECC - Industry and Customers
Key Customers
IWIS Germany
Sedis France
BEA Italy
Mitsubish- Caterpillar

49
Industrial Chains - Products
Power Transmission and Conveying Chains
Agricultural Chains
Engineering Class Chains
50
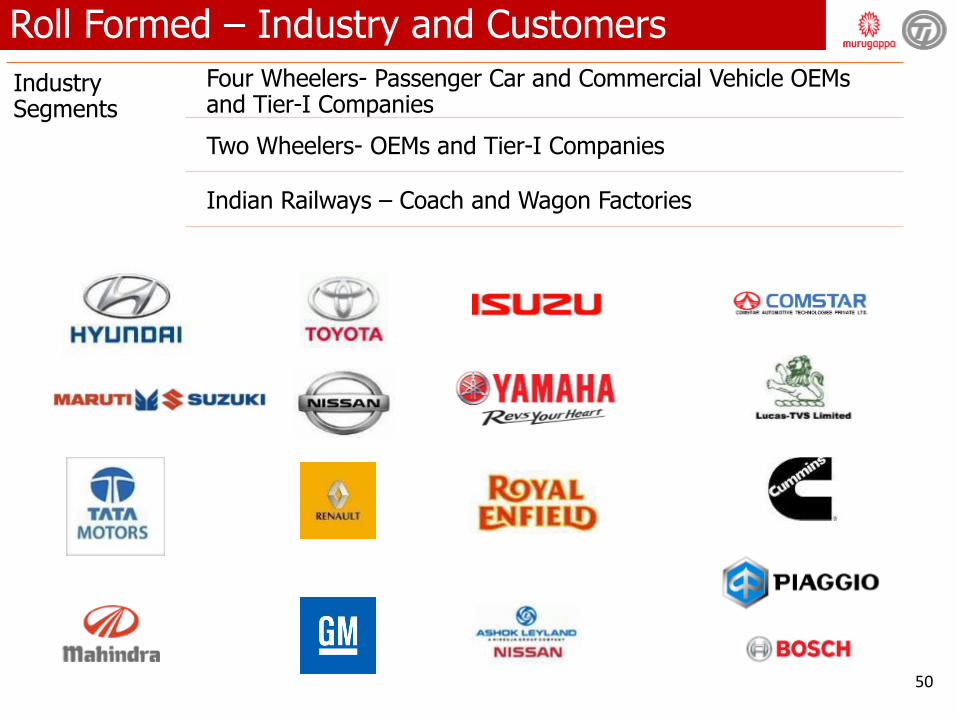
Roll Formed – Industry and Customers
Industry Segments
Four Wheelers- Passenger Car and Commercial Vehicle OEMs and Tier-I Companies
Two Wheelers- OEMs and Tier-I Companies
Indian Railways – Coach and Wagon Factories

51
Roll Formed - Products
Car Door Frames
2W - Mudguard
Divisional Channels
Side Impact Beams Cowl Cross Beam
Four Wheelers
Two Wheelers Motor Casings Railways

52
Metal formed - Key Success Factors
• Market leader in Drive and Cam chains in Auto OEM segment
• Leadership position in Domestic Industrial Chains
• Preferred supplier for Roll formed Door Frames
• Significant player in Fine Blanking Components
Segment Leader
• Strategically located plants close by to leading OEMs for JIT supplies
• Total of 10 Manufacturing Plants (3 Chain Plants + 7 Metal Forming Plants) and 16 Warehouses to service Auto After Market and IC requirements
Multi Location
• Strong brand equity - “Diamond and Rombo” brands
Brand Equity

53
Metal formed - Key Success Factors
• PPM maintained lesser than customer target
• Quality Commitment (Zero Defect) Award from Autoliv
• TPM Excellence Award from Bajaj Auto for Hyderabad TIDC Plant
• Gold Award from Bajaj Auto for Fine Blanking Quality Performance
Quality
• Catering to major 2W OEMs and Tier 1 Auto customers
• Industrial Chain OEMs in Domestic & Exports
• Large dealership network in Auto and Industrial Chains
Customers
• World Class High Speed Presses and Tools for Fine blanking, Chains and Motor casings
Technology

54
Metal formed – Awards and Recognition
“ Excellence in Part Development” award from Lear Corporation for seat recliner
localization development
Awards received from Bajaj Auto Ltd for Fine Blanking Quality and TPM Excellence
Quality Award from Maruti Suzuki India Ltd for Fine Blanking
Quality Commitment (Zero Defect) Award from Autoliv

55
Metal formed – Awards and Recognition
Award from Caterpillar for Supplier Quality Excellence
TIDC Fine Blanking - Award from Autoliv

56
Hyundai new line production has started in Aug’17
Royal Enfield supplies ramped up to meet the demand of their 3rd assembly plant at Oragadam, Chennai
Passenger coach sub-assemblies to ICF and MCF achieved growth of 20%
Metal formed - Business Highlights H1 2017-18
Market Leadership in Chains and Doorframes
Volume Growth across Segments in H1
Auto OEM Chain volumes grew by 13% and Auto After Market by 2%
Domestic Industrial Chain volumes grew by 2% and exports by 6%
Fine Blanking volumes grew by 40%
Doorframes volume grew by 2%

57
9,029 9,958
5,212
2015-16 * 2016-17 2017-18 YTD
Net Sales
Metal formed - Key Financial Trends
figures in INR Mn.
Capital Employed in INR Mn.
^Based on Average Capital Employed
Particulars 2015-16* 2016-17 2017-18 YTD
NFA 2,575 2,709 2,737
Investments 612 612 612
NWC 944 996 1,153
Total 4,131 4,317 4,501
Capital Expenditure 256 456 204
* Proforma numbers are given only for comparison
* Proforma numbers are given only for comparison
19%
21% 21%
2015-16 * 2016-17 2017-18 YTD
ROCE %

58
figures in INR Mn.
Metal formed - Key Financials
* Proforma numbers are given only for comparison
Particulars 2016-17 2015-16* % Growth 2017-18 H1 2016-17 H1 % Growth
Doorframes ('000 Sets) 675 637 6% 340 333 2%
Chains (Million ESS feet) 92.1 91.5 1% 51.7 46.5 11%
Sections for railway wagons (Sets) 1764 1156 53% 312 788 -60%
Gross Sales (incl. Inter Unit) 10,911 9,947 10% 5,452 5,390 1%
Net Sales (incl. Inter Unit) 9,958 9,029 10% 5,212 4,922 6%
EBITDA 1,274 1,232 3% 651 649 0%
13% 14% 12% 13%
PBIT (Before Exceptional Item) 923 863 7% 452 470 -4%
9% 10% 9% 10%
APPLICATION OF FUNDS
Capital Employed 4,317 4,131 4,501 4,393
ROCE% - Based on Avg Capital Employed
21% 19% 21% 22%

59
Gears & Gear Products
Shanthi Gears (SGL) - Strong Brand in Industrial Gears
60
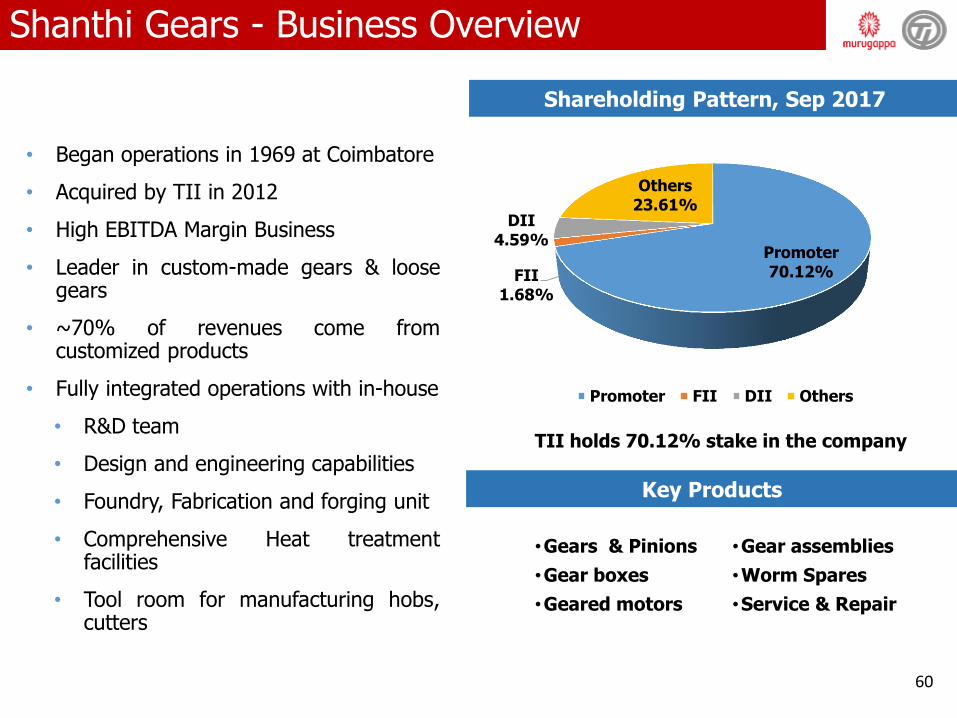
• Began operations in 1969 at Coimbatore
• Acquired by TII in 2012
• High EBITDA Margin Business
• Leader in custom-made gears & loose gears
• ~70% of revenues come from customized products
• Fully integrated operations with in-house
• R&D team
• Design and engineering capabilities
• Foundry, Fabrication and forging unit
• Comprehensive Heat treatment facilities
• Tool room for manufacturing hobs, cutters
•Gears & Pinions
•Gear boxes
•Geared motors
Key Products
Shareholding Pattern, Sep 2017
•Gear assemblies
•Worm Spares
•Service & Repair
Shanthi Gears - Business Overview
TII holds 70.12% stake in the company
Promoter 70.12% FII
1.68%
DII 4.59%
Others 23.61%
Promoter FII DII Others

61
Shanthi Gears
State-of-the-Art Gear Manufacturing
facility In-House Foundry (CI & SG Iron) for
Casing
In house Non-Ferrous Casting
facility for PB & Al-Br
In-house Fabricated Shop with CNC Gas cutting along with Stress Relieving
Furnace
In-House Forging facility to take care
of Urgent jobs
In-House Heat Treatment Shop
(Case carburising & Gas Nitriding)
Integrated Gear Box Manufacturing Facility

62
Shanthi Gears - Gears and Gearboxes
Spur/ Helical Gear
Pinion Shaft Internal Gear Worm and Wheel
Straight Bevel
Spiral Bevel
Worm Gearboxes- Adaptable
Worm Gearboxes- Standard
Worm Gearboxes- Special
Helical Gearboxes Bevel Helical Gearboxes

63
Shanthi Gears - Key Customers

64
Growth of 14% in Sales and 5% in PAT over
H1 of previous year
Focus on Profitable growth through foray into
new geographies and product segments
Increased enquiry activities from repeat
customers and railways
Significant growth registered in Service
Business with new leads
Obtained DSIR certification for R&D facility
Shanthi Gears audited by DGQA and qualified
for all enquiries pertaining to Marine
Shanthi Gears - Business Highlights H1 2017-18

65
1,624 1,807
1,033
2015-16 2016-17 2017-18 YTD
Net Sales
Shanthi Gears - Key Financial Trends
figures in INR Mn.
Capital Employed in INR Mn.
^Based on Average Capital Employed
Particulars 2015-16 2016-17 2017-18 YTD
NFA 736 661 592
Investments 1,119 1,314 1,372
NWC 984 1,051 1,100
Total 2,839 3,027 3,064
Capital Expenditure 83 103 105
8%
10% 11%
2015-16 2016-17 2017-18 YTD
ROCE %

66
figures in INR Mn.
Shanthi Gears - Key Financials
Particulars 2016-17 2015-16 % Growth 2017-18 H1 2016-17 H1 % Growth
Gross Sales 1,999 1,793 11% 1,087 956 14%
Net Sales 1,807 1,624 11% 1,033 860 20%
EBITDA 356 306 16% 196 190 3%
20% 19% 19% 22%
PBIT 285 232 23% 165 158 4%
16% 14% 16% 18%
PBT 285 232 23% 165 158 4%
16% 14% 16% 18%
PAT 225 177 27% 122 116 5%
12% 11% 12% 13%
APPLICATION OF FUNDS
Capital Employed 3,027 2,839 3,064 2,985
ROCE% - Based on Average Capital Employed
9.7% 8.4% 10.8% 10.8%

67
Corporate Office:
Tube Investments of India Ltd. "Dare House", 234 N S C Bose Road, Chennai- 600 001, India.
+91 44 4217 7770
+91 44 4211 0404
This presentation contains forward-looking statements which may be identified by their use of words like “plans,” “expects,” “will,”
“anticipates,” “believes,” “intends,” “projects,” “estimates” or other words of similar meaning. All statements that address expectations or
projections about the future, including, but not limited to, statements about the strategy for growth, product development, market position,
expenditures, and financial results, are forward-looking statements.
Forward-looking statements are based on certain assumptions and expectations of future events. The companies referred to in this
presentation cannot guarantee that these assumptions and expectations are accurate or will be realized. The actual results, performance or
achievements, could thus differ materially from those projected in any such forward-looking statements. These companies assume no
responsibility to publicly amend, modify or revise any forward looking statements, on the basis of any subsequent developments,
information or events, or otherwise.
-------------------------------------------------------------------------------Disclaimer-------------------------------------------------------------------------------