investor presentation q2 2016 results - iss world
TRANSCRIPT
Investor Presentation
Q2 2016 Results
16 August 2016

Forward-looking statements
2
This presentation contains forward-looking statements, including, but not limited to, the statements and expectations
contained in the “Outlook” section of this presentation. Statements herein, other than statements of historical fact,
regarding future events or prospects, are forward-looking statements. The words ‘‘may’’, “will”, “should”, ‘‘expect’’,
‘‘anticipate’’, ‘‘believe’’, ‘‘estimate’’, ‘‘plan’’, "predict," ‘‘intend’ or variations of these words, as well as other statements
regarding matters that are not historical fact or regarding future events or prospects, constitute forward-looking
statements. ISS has based these forward-looking statements on its current views with respect to future events and
financial performance. These views involve a number of risks and uncertainties, which could cause actual results to
differ materially from those predicted in the forward-looking statements and from the past performance of ISS. Although
ISS believes that the estimates and projections reflected in the forward-looking statements are reasonable, they may
prove materially incorrect, and actual results may materially differ, e.g. as the result of risks related to the facility service
industry in general or ISS in particular including those described in the Annual Report 2015 of ISS A/S and other
information made available by ISS.
As a result, you should not rely on these forward-looking statements. ISS undertakes no obligation to update or revise
any forward-looking statements, whether as a result of new information, future events or otherwise, except to the extent
required by law.
The Annual Report 2015 of ISS A/S is available at the Group’s website, www.issworld.com.
Agenda
3
• Highlights
• Regional Performance
• Financials
• Business Update
• Outlook
• Q&A

Highlights
4

Business Highlights Q2 2016
5
Operating Performance
Integrated Facility Services
(IFS)
Strategic Initiatives
• Ground-breaking commercial agreement with IBM to strengthen IFS offering and transform building management
• Customer segmentation and alignment of country organisational structures implemented or in process of being implemented
for approximately 70% of Group revenue
• Phase IV of the procurement excellence programme initiated and geographical scope of procurement excellence expanded
• Business Process Outsourcing (BPO) project now implemented in the Nordic countries, the Netherlands, Belgium &
Luxembourg, Australia, Germany and Austria
• Revenue from Integrated Facility Services (IFS) increased 15% in local currency (Q1 2016: 11%) and represents 37% of
Group revenue (Q1 2016: 35%)
• Revenue from Global Corporate Clients (GCC) increased 16% in local currency (Q1 2016: 15%) and represents 11% of
Group revenue (Q1 2016: 10%)
• Successful, ongoing roll-out of major new/expanded IFS contracts (Danske Bank, Danish State Railways, Novartis,
PostNord)
• New or extended IFS contracts signed with a major logistics company and a number of public institutions (UK), SKANSKA
and SEB (Sweden), a major international bank (Mexico) and Jakarta Airport (Indonesia)
• Organic revenue growth of 3.8% (Q1 2016: 3.7%)
• Total revenue growth of -2% (Q1 2016: 0%), driven by currency effects which reduced revenue by 5%
• Operating margin of 5.4% (Q2 2015: 5.3%)
• Last twelve months (LTM) cash conversion of 97% (Q1 2016: 99%)
• Net profit increased to DKK 498 million (Q2 2015: DKK 479 million)
• Financial leverage of 2.5x (Q2 2015: 2.9x and Q1 2016: 2.3x)
Management
• Pierre-Franҫois Riolacci appointed as Group Chief Financial Officer
• Joins ISS from Air France-KLM, will be based in the Group’s Headquarters in Copenhagen and will start in early November
2016

Key contracts recently expanded or launched
6
Future potential
• As PostNord’s business evolves, the company faces changing
property portfolio needs…
• …which in turn creates opportunities for ISS
• Largest public sector outsourcing contract in Norwegian history…
• …further demonstrating ISS’s public sector and single-service
excellence credentials
• Possible mid-term opportunities within Property Services
(Maintenance & Engineering)
Why ISS?
• Positive existing relationship, highly compelling geographic footprint
and service excellence
• Proof of regional delivery evidenced by major blue chip customers
• Technology-driven, change-management credentials
(INSIGHT@ISS)
• Positive relationship with Norwegian Armed Forces through existing
services (Cleaning and Catering)
• Unique delivery capability in each and every region
• Reduced complexity and cost by choosing one nationwide partner
Scope
• ISS to provide an IFS solution to PostNord across all Nordic
countries
• Current contract could almost triple to SEK 450 million p.a.
• Approximately 400 ISS employees engaged when fully implemented
• 5-year contract (3 years + 2-year extension option)
• Approximately one million square metres of property
• Around 330 workers transferred to ISS
• 7 year contract (4 years + 3-year extension option)
• Total value of up to NOK 2.1 billion (subject to additional work
orders)
Background
• ISS has delivered facility services to PostNord since 2000
• PostNord looking for (1) Increased flexibility and efficiency (2)
Centralisation of control (3) A reduction in their retained organisation
• A majority of the Norwegian Armed Forces’ cleaning needs were
being delivered in-house
• Given a need to improve both efficiency and quality, all cleaning
services were put out to tender in 10 separate regional contracts
• ISS won all 10 tenders
Regional Performance
7

Regional Performance Q2 2016
8
Developed Markets Emerging Markets(1)
75%of Group revenue
43%of Group employees
2%organic growth
(vs. 2% in Q1 2016)
6.2%operating margin(2)
(vs. 6.0% in Q2 2015)
25%of Group revenue
57%of Group employees
8%organic growth
(vs. 10% in Q1 2016)
6.2%operating margin(2)
(vs. 6.1% in Q2 2015)
(1) Emerging Markets comprise Asia, Eastern Europe, Latin America, Israel, South Africa and Turkey
(2) Operating profit before other items and corporate costs

Regional Performance Q2 2016
9
(1) Operating profit before other items and corporate costs
4%organic growth
(vs. 4% in Q1 2016)
5.5%operating margin(1)
(vs. 5.3% in Q2 2015)
• Good performances in France and Germany
• Partly offset by the divestment of the high margin call centre activities in Turkey…
• …as well as difficult market conditions in certain Eastern European countries
• Positive impact from contract launches in Belgium and price and volume increases in Turkey
• Partly offset by lower activity in Israel, as well as planned contract exits in Greece
Co
nti
ne
nta
l E
uro
pe
4%organic growth
(vs. 2% in Q1 2016)
7.1%operating margin(1)
(vs. 7.0% in Q2 2015)
• Supported by strength within the financial sector and certain timing differences in the United Kingdom
• Cost savings initiatives within property services in Denmark
• Partly offset by lower activity in the catering division and contract start-ups in Norway
• Strong performance within the financial sector and public segment in the United Kingdom…
• …as well as contract launches in Denmark and Norway
• Partly offset by Finland – contract downsizing, in particular within the technology sector
No
rth
ern
Eu
rop
e

Regional Performance Q2 2016
10
4%organic growth
(vs. 7% in Q1 2016)
6.9%operating margin(1)
(vs. 6.3% in Q2 2015)
(1) Operating profit before other items and corporate costs
• Operational efficiencies in Australia and Singapore…
• …and cost savings initiatives in India
• Asia continued to deliver double-digit growth rates
• Loss of a large contract within the hospital sector and reduced services within the remote site resource
sector in Australia
• Decreased demand for non-portfolio services in Singapore
4%organic growth
(vs. 2% in Q1 2016)
4.1%operating margin(1)
(vs. 4.5% in Q2 2015)
• Margin decreases in Mexico and Chile, partly due to timing differences
• Partly offset by a strong performance within the IFS division in the USA
• Underlying margin development for the region was stable
• Strong performance and contract start-ups within the IFS division and the aviation segment in the USA
• Contract wins and stronger demand for non-portfolio services in Mexico
• Price increases in Argentina
• Contract exits in Brazil within certain business units following the initiation of structural adjustments of
our business platform
As
ia P
ac
ific
Am
eri
ca
s

Financials
11

0.0
1.0
2.0
3.0
4.0
5.0
6.0
7.0
8.0
65,000
67,000
69,000
71,000
73,000
75,000
77,000
79,000
81,000
Q1
11
Q2
11
Q3
11
Q4
11
Q1
12
Q2
12
Q3
12
Q4
12
Q1
13
Q2
13
Q3
13
Q4
13
Q1
14
Q2
14
Q3
14
Q4
14
Q1
15
Q2
15
Q3
15
Q4
15
Q1
16
Q2
16
Revenue (LTM) Organic growth (%)
17,000
17,500
18,000
18,500
19,000
19,500
20,000
20,500
Q2 2015 Divestments/acquisition
Currency Organic Q2 2016
Revenue
12
DKK million
Q2 2016 revenue growth of -2%
Note net currency impact due primarily to GBP, NOK, AUD, CHF and TRY
-5%
3.8% 19,885
20,206
Q2 2016 organic growth of 3.8%
-1%
-2% -2% -2% -6% -1%
Annual impact on revenue from net acquisitions/divestmentsDKK million
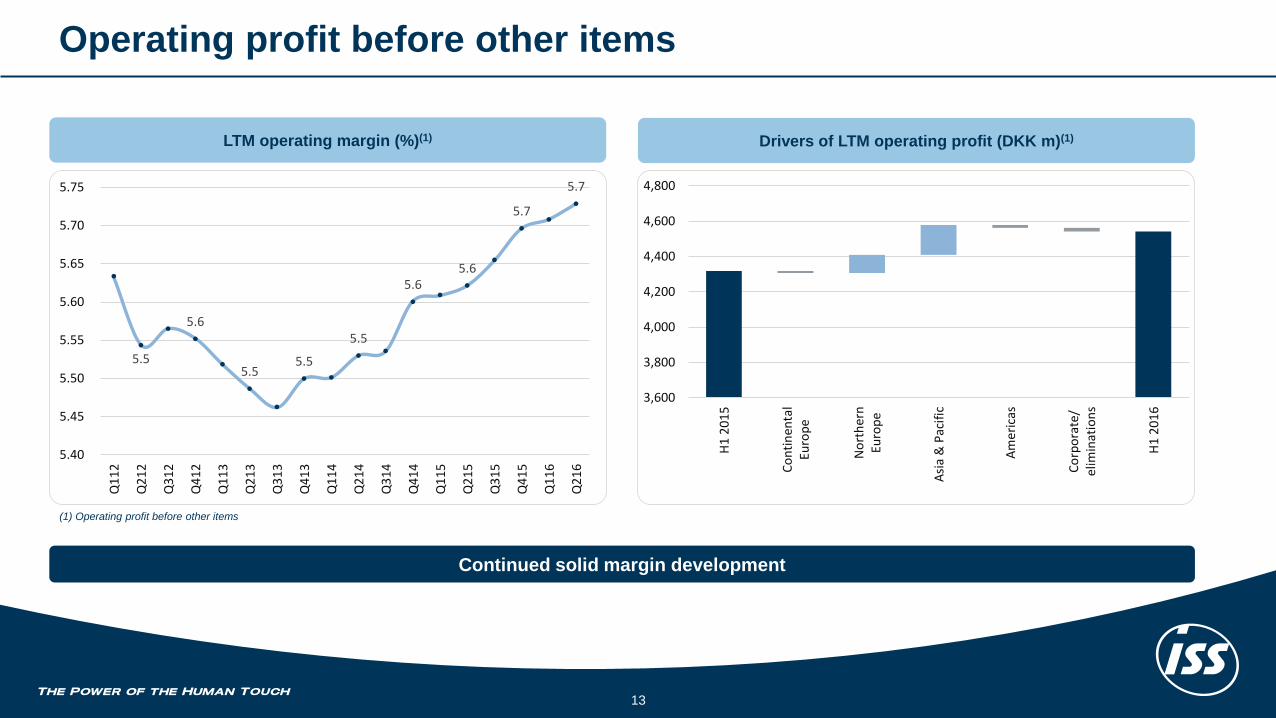
3,600
3,800
4,000
4,200
4,400
4,600
4,800
H1
20
15
Co
nti
nen
tal
Euro
pe
No
rth
ern
Euro
pe
Asi
a &
Pac
ific
Am
eri
cas
Co
rpo
rate
/el
imin
atio
ns
H1
20
16
5.5
5.6
5.55.5
5.5
5.65.6
5.7
5.7
5.40
5.45
5.50
5.55
5.60
5.65
5.70
5.75
Q1
12
Q2
12
Q3
12
Q4
12
Q1
13
Q2
13
Q3
13
Q4
13
Q1
14
Q2
14
Q3
14
Q4
14
Q1
15
Q2
15
Q3
15
Q4
15
Q1
16
Q2
16
Operating profit before other items
13
LTM operating margin (%)(1)
(1) Operating profit before other items
Drivers of LTM operating profit (DKK m)(1)
Continued solid margin development
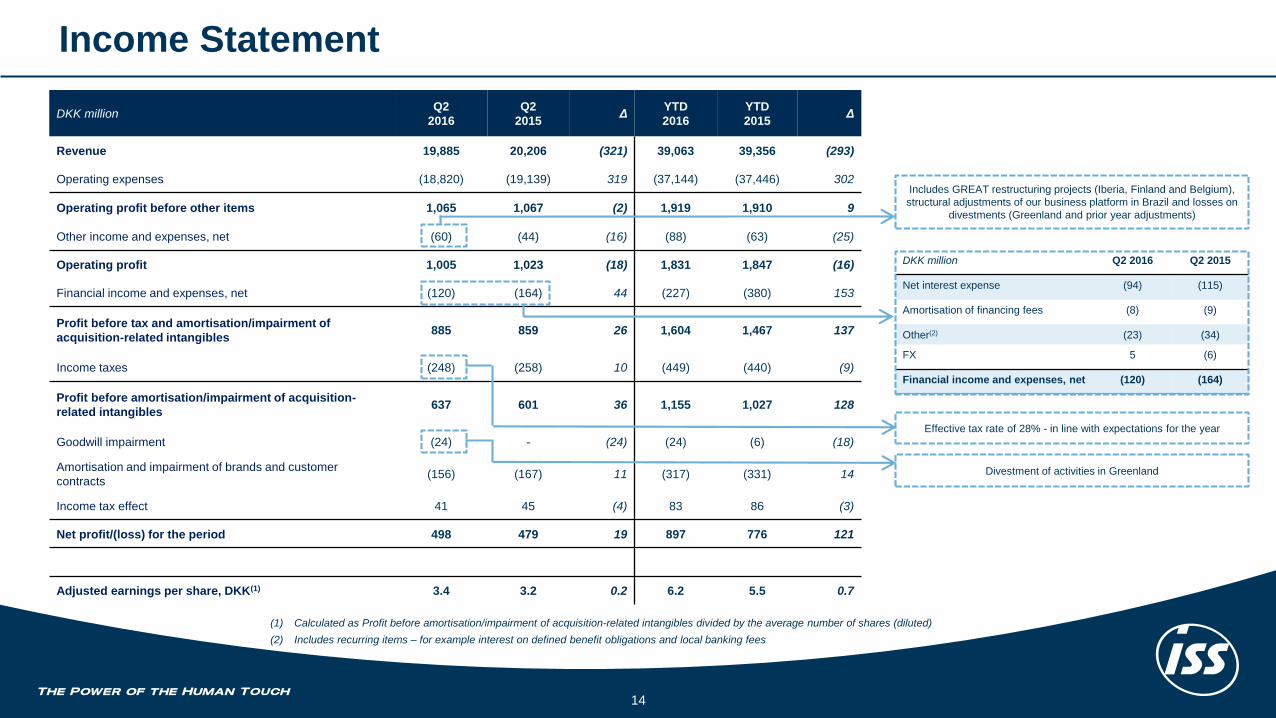
Income Statement
14
DKK millionQ2
2016
Q2
2015Δ
YTD
2016
YTD
2015Δ
Revenue 19,885 20,206 (321) 39,063 39,356 (293)
Operating expenses (18,820) (19,139) 319 (37,144) (37,446) 302
Operating profit before other items 1,065 1,067 (2) 1,919 1,910 9
Other income and expenses, net (60) (44) (16) (88) (63) (25)
Operating profit 1,005 1,023 (18) 1,831 1,847 (16)
Financial income and expenses, net (120) (164) 44 (227) (380) 153
Profit before tax and amortisation/impairment of
acquisition-related intangibles885 859 26 1,604 1,467 137
Income taxes (248) (258) 10 (449) (440) (9)
Profit before amortisation/impairment of acquisition-
related intangibles637 601 36 1,155 1,027 128
Goodwill impairment (24) - (24) (24) (6) (18)
Amortisation and impairment of brands and customer
contracts(156) (167) 11 (317) (331) 14
Income tax effect 41 45 (4) 83 86 (3)
Net profit/(loss) for the period 498 479 19 897 776 121
Adjusted earnings per share, DKK(1) 3.4 3.2 0.2 6.2 5.5 0.7
(1) Calculated as Profit before amortisation/impairment of acquisition-related intangibles divided by the average number of shares (diluted)
(2) Includes recurring items – for example interest on defined benefit obligations and local banking fees
DKK million Q2 2016 Q2 2015
Net interest expense (94) (115)
Amortisation of financing fees (8) (9)
Other(2) (23) (34)
FX 5 (6)
Financial income and expenses, net (120) (164)
Includes GREAT restructuring projects (Iberia, Finland and Belgium),
structural adjustments of our business platform in Brazil and losses on
divestments (Greenland and prior year adjustments)
Effective tax rate of 28% - in line with expectations for the year
Divestment of activities in Greenland
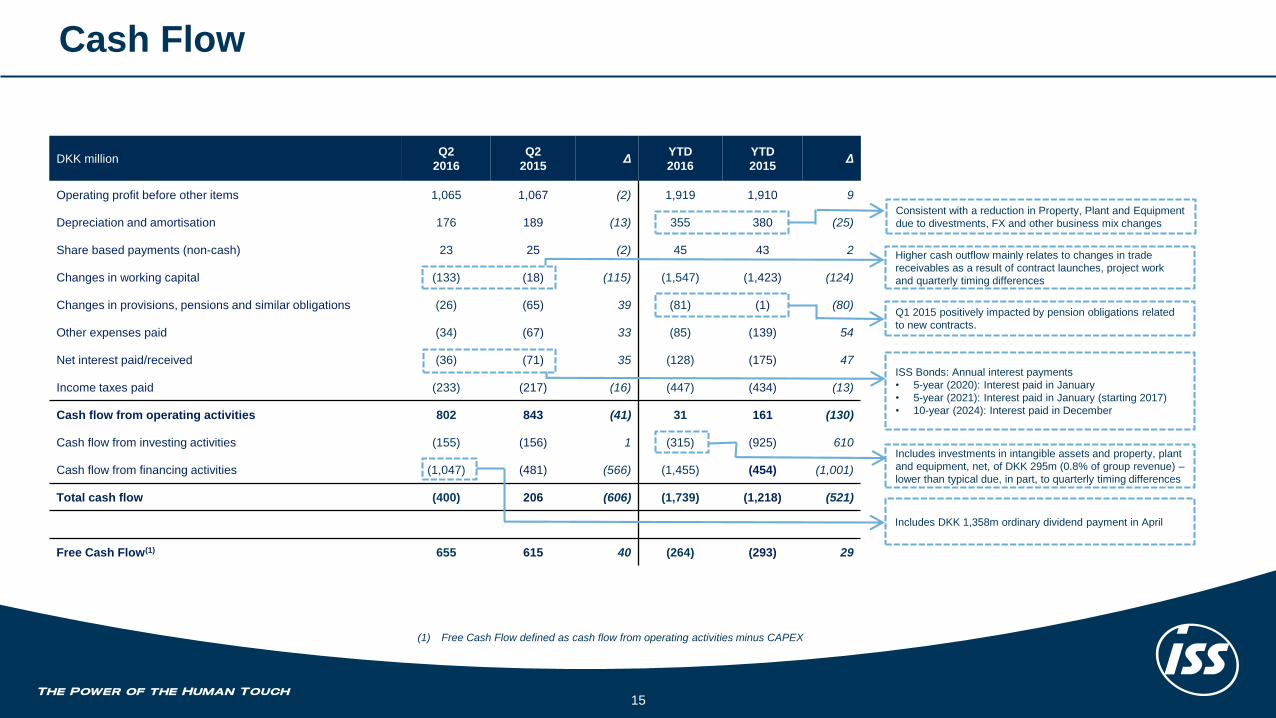
Cash Flow
15
DKK millionQ2
2016
Q2
2015Δ
YTD
2016
YTD
2015Δ
Operating profit before other items 1,065 1,067 (2) 1,919 1,910 9
Depreciation and amortisation 176 189 (13) 355 380 (25)
Share based payments (non-cash) 23 25 (2) 45 43 2
Changes in working capital (133) (18) (115) (1,547) (1,423) (124)
Changes in provisions, pensions and similar obligations (26) (65) 39 (81) (1) (80)
Other expenses paid (34) (67) 33 (85) (139) 54
Net interest paid/received (36) (71) 35 (128) (175) 47
Income taxes paid (233) (217) (16) (447) (434) (13)
Cash flow from operating activities 802 843 (41) 31 161 (130)
Cash flow from investing activities (155) (156) 1 (315) (925) 610
Cash flow from financing activities (1,047) (481) (566) (1,455) (454) (1,001)
Total cash flow (400) 206 (606) (1,739) (1,218) (521)
Free Cash Flow(1) 655 615 40 (264) (293) 29
(1) Free Cash Flow defined as cash flow from operating activities minus CAPEX
ISS Bonds: Annual interest payments
• 5-year (2020): Interest paid in January
• 5-year (2021): Interest paid in January (starting 2017)
• 10-year (2024): Interest paid in December
Consistent with a reduction in Property, Plant and Equipment
due to divestments, FX and other business mix changes
Higher cash outflow mainly relates to changes in trade
receivables as a result of contract launches, project work
and quarterly timing differences
Q1 2015 positively impacted by pension obligations related
to new contracts.
Includes investments in intangible assets and property, plant
and equipment, net, of DKK 295m (0.8% of group revenue) –
lower than typical due, in part, to quarterly timing differences
Includes DKK 1,358m ordinary dividend payment in April

0
20
40
60
80
100
120
FCF (pre-interest)
Net financialexpenses
Net acquisitions/disposals
Dividends Other
6.0
4.9 5.04.5
3.2
2.62.9
2.12.5
0.0
1.0
2.0
3.0
4.0
5.0
6.0
7.0
0
5,000
10,000
15,000
20,000
25,000
30,000
35,000
Q1
12
Q2
12
Q3
12
Q4
12
Q1
13
Q2
13
Q3
13
Q4
13
Q1
14
Q2
14
Q3
14
Q4
14
Q1
15
Q2
15
Q3
15
Q4
15
Q1
16
Q2
16
Net debt (DKK million) Leverage
Capital allocation and leverage
16
Leverage objectives and capital allocation priorities unchanged and entirely consistent with previous communication
Leverage of 2.5x at end Q2 2016(2)ISS allocation of Free Cash Flow (pre-interest)(1) LTM, %
(1) Free Cash Flow (pre-interest) = [Cash flow from operating activities, add back net interest paid/
received] + net acquisition/ divestment of intangible assets (e.g. software) and PPE
(2) Leverage calculated as net debt / pro-forma adjusted EBITDA
Business Update
17

Ground-breaking agreement with IBM
18
FMS@ISS
(Real estate
management)
Cognitive
intelligence
Integration@ISS
(IFS support)
• FMS is our integrated business intelligence platform
providing customers with a single, global portal
• Enables users to make and track Helpdesk requests…
• …and to deliver work order management and asset
management
• FMS will now be based on IBM’s TRIRIGA platform – an
engine upgrade offering enhanced end-user interface
and…
• …access to an extended eco system
• ISS to use the power of Watson IOT to transform the
management of customer buildings around the world
• Sensors deployed throughout buildings coupled with
analytics and cognitive intelligence will automate
interactions with building occupants (end-users) in a real-
time way
• Moving from reactive to pro-active service behaviour
• A visionary approach to delivering excellence in
workplace management
• Objective is to further leverage our integrated, self-
delivery capabilities
• Work force optimisation is a key element in driving both
employee productivity and engagement
• Integration@ISS will now be supported by IBM with
effective analysis of employee skills, tasks, shifts, costs
and subsequent determination of employee workloads
• Initial pilot tests have demonstrated material productivity
improvements can be generated
• TRIRIGA will be rolled out to all existing FMS users…
• …and extended to a significant number of new users
during the next 30 months
• ISS will receive support from a dedicated IBM project
management and acceleration team
• ISS’s Copenhagen headquarters serves as an innovation
lab…
• …and has been rigged up with hundreds of sensors
connected to IBM’s Watson IOT platform
• Watson IOT technology to be implemented at selected
customer sites
• Objective is to develop a global blueprint and platform by
end 2016…
• …and then roll out Integration@ISS to several hundred
customer sites over the first 30 months
• Again, dedicated project management and training
teams will support this initiative
Data, technology and self-delivered service credentials combining to drive the workplace of the future
1
2
3

28
8
9
618
20
12 Business Services& IT
Healthcare
Publicadministration
Transportation &infrastructure
Retail &wholesale
Industry &Manufacturing
Other
40
22
15
6
4
12 Business Services& IT
Healthcare
Publicadministration
Transportation &infrastructure
Retail &wholesale
Other
Update: ISS United Kingdom and ISS Turkey
19
Re
ve
nu
es
pli
t b
y i
nd
us
try
se
gm
en
t, 2
01
5 (
%)
ISS
Un
ited
Kin
gd
om
ISS
Tu
rke
y• The United Kingdom is the largest country within ISS
• Accounted for 15% of 2015 group revenue
• Margins are good (above group average)
• The outsourced FM market is well established
• 53% of UK revenue comes from IFS (2015)
• Approximately 40% of UK revenue comes from the public sector (Heathcare, Defence,
Education, Transport)
• Financial Services is the biggest single industry sector
• Business performance so far in 2016 unaffected by uncertainty pre- or post-BREXIT
• Business opportunities remain encouraging in both the private and public sectors
• Turkey is the 11th largest country within ISS
• Accounted for 4% of 2015 group revenue
• Margins are good (above average)
• The outsourced FM market is less sophisticated than many European countries
• 11% of Turkish revenue comes from IFS (2015)
• Revenue is dominated by private sector customers
• Negligible impact on ISS thus far from attempted coup d’état in July (only 3 small
customers saw a shutdown of their facilities)
• Tourism is the most negatively impacted industry segment thus far in 2016 (accounts
for only 3% of ISS Turkey revenue)
• Business opportunities remain encouraging, notably in Healthcare

0 10 20 30 40 50
Cleaning
Support
Property
Security
FM
50
55
60
65
70
75
80
85
90
95
100
-10
0
10
20
30
40
50
60
70
80
90
2009 2010 2011 2012 2013 2014 2015 2016
cNPS [left axis] Retention rate (%) [right axis]
-5.0
0.0
5.0
10.0
15.0
20.0
25.0
0
1,000
2,000
3,000
4,000
5,000
6,000
2009 2010 2011 2012 2013 2014 2015
Revenues (DKK m) Organic growth (%)
Case Study: ISS Switzerland
20
• Early extension,
and expansion, of
UBS contract until
Dec 2015
• Major
restructuring
strengthens IFS
capability and key
account focus
• IFS contract with
PwC won and
implemented
• Early extension of
UBS contract to
Dec 2020
• Implementation of
new IFS contract
with Swisscom
• Cost reductions
delivered to
customers post
financial crisis but
margins protected
• Sole Cleaning
provider for
Novartis in 2011.
ISS then wins
expanded IFS
contract in 2012
• IFS contract with
Nestlé won and
implemented
• Credit Suisse
contract
expanded
Improved customer satisfaction supports strong retention rate
Revenue split by service, 2015 (%)
Experienced management board
55% 54% 55% 55% 61% 62% 67%% of IFS
revenues
A, Nauer
CEO
with ISS since 1998
R. Fuchs
CFO
with ISS since 2004
R. Wehrli
People & Culture
with ISS since 2014
G. Santagada
Sales & Business Development
with ISS since 2010
Operations
S. Tobler
with ISS since 2004
R. Fitze
with ISS since 2006
C. Favier-Bosson
with ISS since 1998
R. Färber
with ISS since 2013
Key Accounts
P. Döbelin
with ISS since 2007
W. Koch
with ISS since 2008
Reven
ue
s(D
KK
m) O
rgan
ic g
row
th(%
)

Outlook
21

Outlook 2016
22
• Cash conversion will remain a priority in 2016
• Focus on sustainable margin improvement to be maintained
• Development will be supported by ongoing strategic initiatives, including
• Customer segmentation, including Key Account focus
• Organisational structure
• Procurement and Business Process Outsourcing (BPO)
• Margin will be negatively impacted by the divestment of CMC, completed on 30 October 2015
• Expectation narrowed from 2-4% to 2.5-4.0%
• Reflects the solid organic growth for the first half of 2016
• Supported by the large contract launches, especially in Europe and Americas, as well as in our IFS business in
general
• We anticipate continuing to benefit from this for the remainder of 2016
• We remain cautious of the difficult market conditions in certain European countries and Brazil
Impact on total revenue from divestments, acquisitions and foreign exchange rates in 2016
• We expect a negative impact from development in foreign exchange rates of approximately 3-4%(1)
• We expect a negative impact from the divestments and the acquisition of approximately 0-1%(2)
• Consequently, we expect total revenue growth in 2016 to be in the range of -2.5% to +1.0%
Organic Growth2.5 – 4.0%
(2015: 4.4%)
Operating Margin‘Above the level realised in
2015’(2015: 5.7%)
Cash Conversion‘Above 90%’
(2015: 99%)
(1) The forecasted average exchange rates for the financial year 2016 are calcuated using the realised average exchange rates for the first seven months of 2016 and the
average forward exchange rates (as of 12 August, 2016) for the last five months of 2016
(2) Divestments and acquisition completed by 31 July 2016 (including in 2015)
Q&A
23