investor presentation september 2012 - … · number of business correspondents (bcs) ... mutual...
TRANSCRIPT

Investor Presentation
SEPTEMBER 2012

South Indian Bank… At A Glance
2
• Number of years in banking business83 Years
• Number of branches730
• Number of ATM’s743
• Business as on Sept 2012` 67110Cr
• Business Growth (Y – to – Y)19%
• Last 5 years business CAGR26%
• Net Profit for the Half Year ending Sept 2012` 220.18Cr
• Net Interest Margin (Sept 12)3.09 %
• Capital Adequacy Ratio (Basel II –Sept 12)14.43%
• Net Non-Performing Assets (Sept 12)0.86%

3
History & Background
Future Strategy
Overview
Key Strength
Business Performance
CONTENTS

4
HISTORY &
BACKGROUND

First private sector bank to open a NRI branch in Nov,1992
& an IFB branch in March 1993.
One of the oldest Banks in South India.
First among private sector Banks in Kerala to become aSCB in 1946.
Listed in NSE, BSE & CSE- IPO in 1998. FPO In 2006.
Successful QIP in Sept 2007 & 2012
Incorporated on January 25, 1929. Head Office:
Thrissur, Kerala.
The THIRD largest branch network among Private Sector
banks, in India, with all its branches under Core banking
System.
First bank among the Private sector banks in Kerala to
open an "Overseas Branch”, June ’93.
History & Pioneering Initiatives
5

6

Shareholding Pattern – as on Sept-2012
Diversified shareholding & tradition of good corporate governance practices
7
32.46%
7.20%
11.19%
45.27%
3.89%
Individuals
Corporates
FI's and Banks
FII's
Others

Vision & Mission
8
CORPORATE VISION
MISSION
To emerge as the most preferred bank in the country in terms ofbrand, values, principles with core competence in fostering customeraspirations, to build high quality assets leveraging on the strong and vibranttechnology platform in pursuit of excellence and customer delight and tobecome a major contributor to the stable economic growth of the nation.
To provide a secure, agile, dynamic and conducive banking environment tocustomers with commitment to values and unshaken confidence, deploying thebest technology, standards, processes and procedures where customerconvenience is of significant importance and to increase the stakeholders’value.
9
OVERVIEW

Healthy Fundamentals
Adequately Capitalised;
•14.43% CRAR & 12.32% Tier 1 ratio
Asset Quality;
•1.74% GNPAs & 0.86% NNPAs
•51.21% NPA Coverage ratio
•15.52% ROE, 1.06% ROAA
Strong Growth
• One of the fastest growing banks in
India.
• 26% CAGR in business in last 5 years
•Constant growth in Business &
Profitability
Most advanced technology in all
spheres of banking operations &
delivery channels.
Key Competitive Advantage
• Fast expanding branch network
• High Asset Quality with well diversified
Loan portfolio
• 8.87 % market share in Kerala’s NRI
deposit base.
•Strong boost to Income from high
yielding gold loans forming 22.11% of the
loan book.
Significant Turnaround
•Benchmarked HR Practices & Introduced
Performance Linked Incentive
schemes, ESOS, Annual Performance
contest- Awards.
•Forward looking Human Capital
Management Strategy
•Highly skilled human capital- 50% of
human capital under age 30 with
professional qualification
SIB SIB
SIBSIB
Key Strengh
10

Spread of Branches
11
Average Branch & ATM network
growth @ 20% (for last & current FY)
Vast and Rapidly Growing Branch Network

12
17%
48%
20%
15%
Rural
Semi- Urban
Urban
Metro
Branch Network Category wise as on Sept 2012

13
STATESNo: of
BranchesSTATES
No: of Branches
STATESNo: of
Branches
Kerala 401 Chhattisgarh 3 Himachal Pradesh 1
Tamil Nadu 130 Orissa 2 Meghalaya 1
Karnataka 40 Madhya Pradesh 2 Nagaland 1
Andhra Pradesh 46 Rajasthan 2
Maharashtra 25 Pondicherry 2
Delhi 24 Assam 2
West Bengal 10 Jharkhand 2
Uttar Pradesh 9 Bihar 1
Gujarat 9 Uttaranchal 1
Punjab 4 Chandigarh 1
Haryana 4 Jammu & Kashmir 1
Goa 5 Tripura 1 Total 730
State wise distribution of Branches Category wise as on Sept 2012

14
Num
ber
of
Bra
nches a
dded
Network Expansion (Number of branches added)
0
10
20
30
40
50
60
70
FY 07 FY 08 FY 09 FY 10 FY 11 FY 12 FY 13(proposed)
25 25
30
50
61 59
50

15
Nu
mb
er
of
Bra
nch
es
Branch Network
475500 530
580
641
700750
0
100
200
300
400
500
600
700
800
FY 07 FY 08 FY 09 FY 10 FY 11 FY 12 FY 13 (proposed)

16
Nu
mb
er
of
AT
Ms a
dd
ed
Network Expansion (Number of ATMs added)
0
20
40
60
80
100
120
140
160
180
FY 08 FY 09 FY 10 FY 11 FY 12 FY 13 (proposed)
50 55
93
116
174
137

17
Nu
mb
er
of
AT
Ms
ATM Network
225280
373
489
663
800
0
100
200
300
400
500
600
700
800
900
FY 08 FY 09 FY 10 FY 11 FY 12 FY 13 (proposed)

Project SIBERTECH- 100% Core Banking Solution (CBS) using FINACLE from Infosys.
Centralized Data Centre with most advanced technological platform in a new state of the art “Green” complied building at Kochi, Kerala.
Emphasis on IT security & Risk Management - Disaster-recovery site at Bangalore for CBS & Regular IS Audits.
Member of INFINET & 743 On-line ATMs through NFS tie-up with other banks
A host of hi-tech products- International debit & credit cards, high speed & secure Internet & Mobile Banking for retail & corporate clients.
Online Value added services - Stock trading, ticket booking, mobile recharges, shopping, Utility payments, offerings.
SIB FINS Card -A smartcard based FI initiative in association with M/s Coromandel InfoTech India Ltd., Chennai, as the technology service provider.
Successfully implemented RTGS & NEFT in all branches.
Successfully launched Smart card at Christ University, Bangalore which works as Access card, Identity card, ATM card and card for payment of fees in Christ College for around 10000 students.
Best-in-class IT products & solutions in all banking operations like Treasury, Risk Management, AML, Credit Processing, HR, Audit & KYC.
18
EFFICIENT SERVICE LEVERAGING ON TECHNOLOGY

RANGE OF PRODUCTS
19
Loan Products Deposit products Other Products
Retail Business Loans
Housing Loans/
Mortgages
Auto Loans
Personal Loans
Education Loans
Employee Group Loans
SME Loans
•Savings Bank Accounts
•Current Accounts
•Fixed/ Recurring
Deposits
• Depository Account
• Mutual Funds sales
• Life Insurance sales
• General Insurance sales
• Group Insurance sales
• E-payment
• Cash Management Services
• Online Foreign Inward Remittance
• m-Commerce
• New Pension Scheme
•Gold Coins/ingots
Commercial Banking
•Working Capital Loans
•Term Loans
•Letters of Credit
•Banks Guarantees
• Bill Finance
•Wholesale Deposits
Retail Banking
Wholesale Banking
20
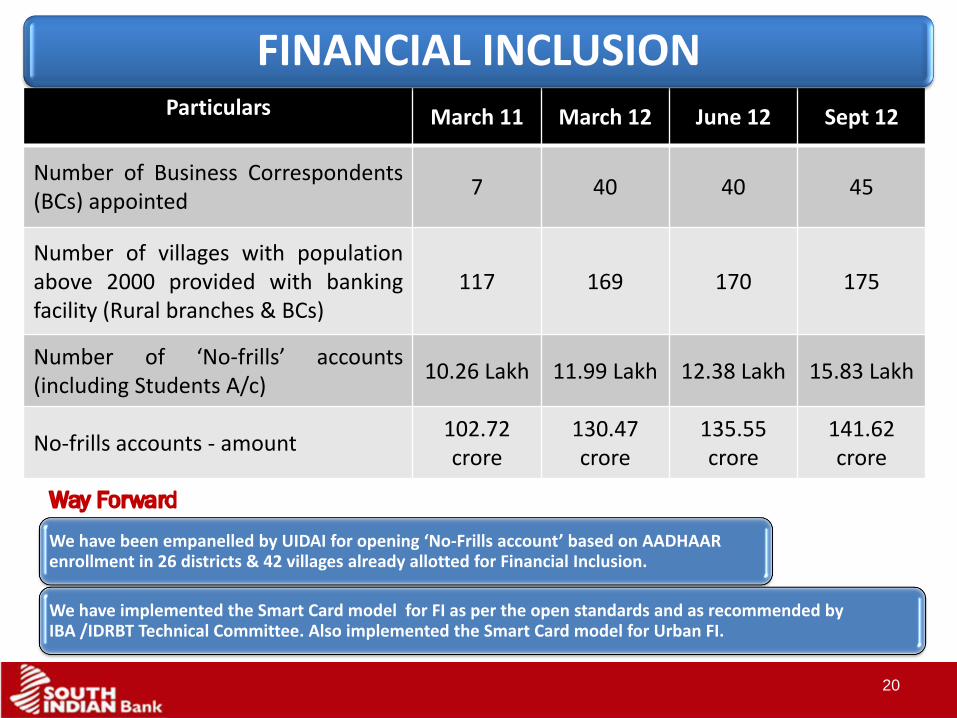
Particulars March 11 March 12 June 12 Sept 12
Number of Business Correspondents(BCs) appointed
7 40 40 45
Number of villages with populationabove 2000 provided with bankingfacility (Rural branches & BCs)
117 169 170 175
Number of ‘No-frills’ accounts(including Students A/c)
10.26 Lakh 11.99 Lakh 12.38 Lakh 15.83 Lakh
No-frills accounts - amount102.72 crore
130.47 crore
135.55 crore
141.62crore
We have been empanelled by UIDAI for opening ‘No-Frills account’ based on AADHAAR enrollment in 26 districts & 42 villages already allotted for Financial Inclusion.
We have implemented the Smart Card model for FI as per the open standards and as recommended by IBA /IDRBT Technical Committee. Also implemented the Smart Card model for Urban FI.
FINANCIAL INCLUSION

Life Insurance with LIC
General Insurance with Bajaj Allianz
Mutual funds –All the leading AMCs in India
Sri Lanka's Hatton National Bank (HNB)
• Improve the remittance flow to India and Sri Lanka
More than 30 exchange houses & banks in middle east
• Facilitating fast remittances for more than 2lakh NRI customers, mostly from Gulf countries
Providing managerial support to overseas exchange house - HADI exchange house
21
Strategic Tie Ups

RECOGNITIONS
Best Bank in Asset Quality (Pvt Sect or Bank) Award - Dun & Bradstreet 2011
Best Bank in Priority Sector Lending (Pvt Sect or Bank) Award - Dun & Bradstreet 2011
Technology Excellence Award 2011-12 from IDRBT
Technology Excellence Award in 2010 from IRDBT
India’s Best Bank 2010 Award – “Business world – Price Water House CoopersBest Banks Survey 2010”
Best Asian Banking Website - Asian Banking & Finance Magazine, Singapore.
Best Old Pvt Sector Bank - Financial Express India's Best Banks 2008-2009.
Best Pvt Sector bank in the Service quality segment Outlook Money - CFore Survey.
Best Website Award from Kerala Management Association
22
23
BUSINESS
PERFORMANCE
Business Performance

24
Net Profit
220.18
177.44
Business
67110
56386
Advance
28620
23348
Deposit
38490
33038
Net NPA
0.86%
0.25%
Gross NPA
1.74%
0.99%
(` in Crores)
Financial Highlights – As on Sept 2012
Sept 2012
Sept 2011
24% 19% 23% 17%

Profitability (Half Year)
25
Net Profit 24%
135177
220229
309
407
0
100
200
300
400
500
SEPT-2010 SEPT-2011 SEPT-2012
Net Profit Operating Profit
(` in Crores)

ROA coming mainly from Core Income
26
*Annualized
Improved Quality of Earnings
0.92
0.98 0.97
1.02
1.071.05 1.05 1.06
0.80
0.85
0.90
0.95
1.00
1.05
1.10
SEPT 2009 SEPT 2010 SEPT 2011 SEPT 2012
ROA*
ROAA*
27
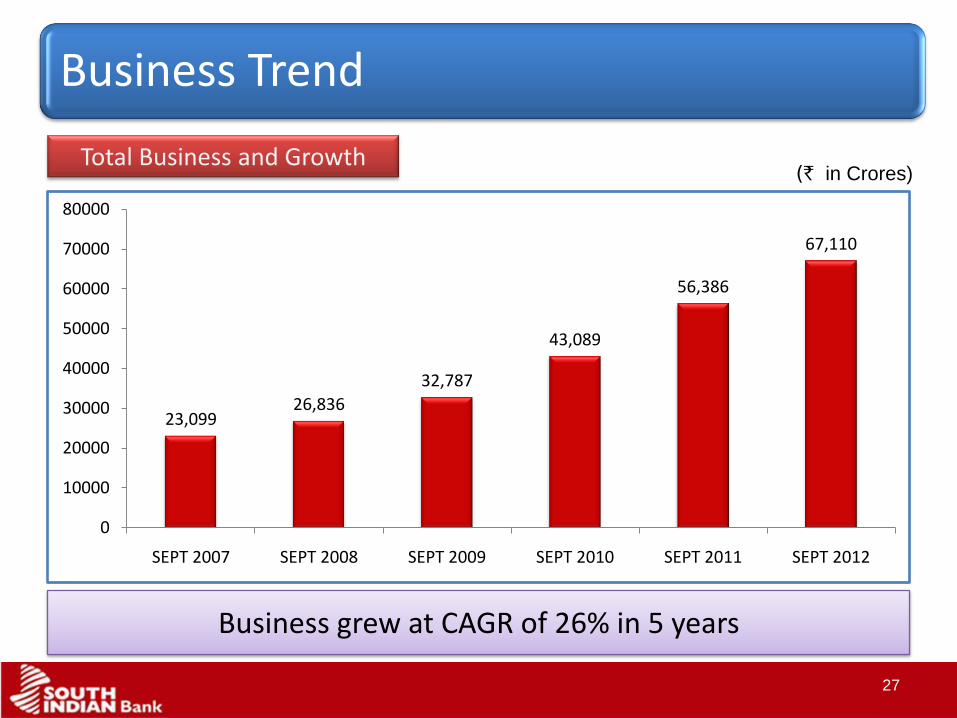
Total Business and Growth
Business grew at CAGR of 26% in 5 years
(` in Crores)
23,09926,836
32,787
43,089
56,386
67,110
0
10000
20000
30000
40000
50000
60000
70000
80000
SEPT 2007 SEPT 2008 SEPT 2009 SEPT 2010 SEPT 2011 SEPT 2012
Business Trend

28
Credit Deposit Ratio
69.21%
71.94%
70.67%
74.36%
66.00%
67.00%
68.00%
69.00%
70.00%
71.00%
72.00%
73.00%
74.00%
75.00%
SEPT 2009 SEPT 2010 SEPT 2011 SEPT 2012
29
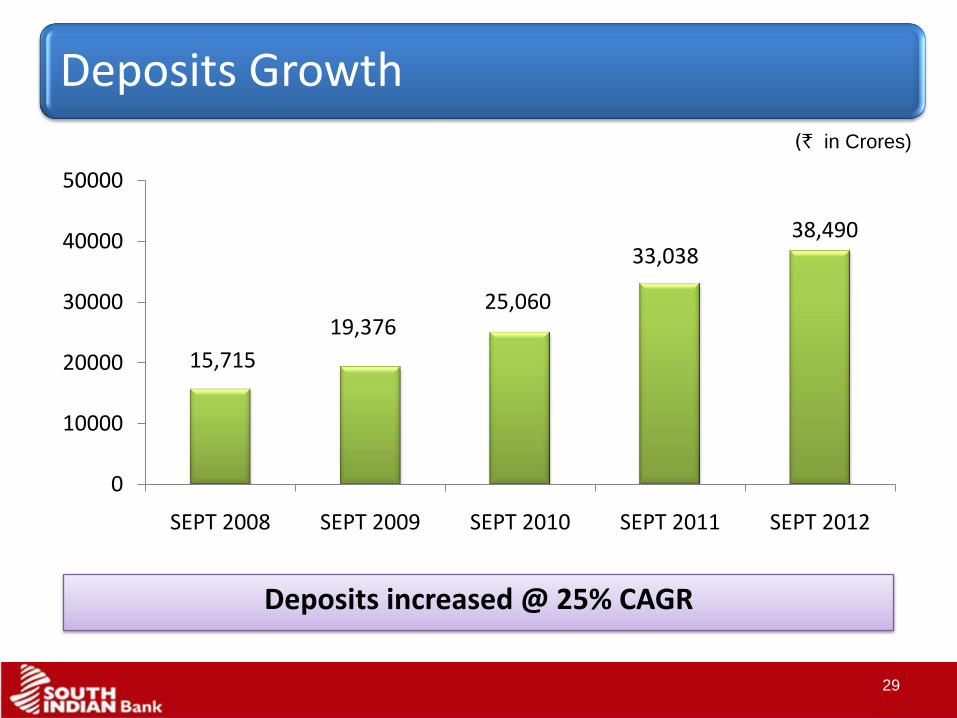
Deposits increased @ 25% CAGR
(` in Crores)
Deposits Growth
15,715
19,37625,060
33,03838,490
0
10000
20000
30000
40000
50000
SEPT 2008 SEPT 2009 SEPT 2010 SEPT 2011 SEPT 2012

30
Low Cost deposits form 19.96% of total deposits.
Annual Trend in Low cost depositsComposition of Deposits
(` in Crores)(` in Crores)
Deposits – Composition and Trend
SB Deposit
632116% CD
Deposit13624%
Term Deposit3080780%
3791
4888
57646321
8451091 1274 1362
0
1000
2000
3000
4000
5000
6000
7000
SEPT 2009 SEPT 2010 SEPT 2011 SEPT 2012
SB Deposit CD Deposit

Advances increased by 27% (CAGR)
31
(` in Crores)
Advances Growth
11121
13411
18029
23348
28620
0
5000
10000
15000
20000
25000
30000
35000
SEPT 2008 SEPT 2009 SEPT 2010 SEPT 2011 SEPT 2012
Adavance

32
Advances – Composition (Sept 2012)
Sector Upto 5 Crores Above 5 Crores Total % to total
Agriculture 1165.48 415.98 1581.46 5.54%
MSME 2032.56 353.39 2385.94 8.34%
Large Scale Industries 407.66 4978.13 5385.79 18.82%
Housing 1137.83 429.25 1567.08 5.48%
Commercial Real Estate 40.40 72.55 112.95 0.39%
NBFC 60.87 1986.75 2047.62 7.15%
Food Credit 0.00 524.49 524.49 1.83%
Infrastructure 0.00 4808.18 4808.18 16.80%
Gold Loan (Non Priority) 5354.44 0.00 5354.44 18.71%
FSLD 832.75 0.00 832.75 2.91%
LC Bills 0.00 2650.07 2650.07 9.26%
Miscellaneous 1246.24 123.17 1369.42 4.78%
Total 12278.23 16341.96 28620.19 100%

33
Trend in Cost of Deposits Trend in Yield on Advances
Trend in Cost & Yield (Annualized)
7.20%6.34%
7.66%
8.30%
0.00%
1.00%
2.00%
3.00%
4.00%
5.00%
6.00%
7.00%
8.00%
9.00%
SEPT 2009 SEPT 2010 SEPT 2011 SEPT 2012
Cost of Deposit
11.68%
10.61%
12.11% 12.76%
0.00%
2.00%
4.00%
6.00%
8.00%
10.00%
12.00%
14.00%
SEPT 2009 SEPT 2010 SEPT 2011 SEPT 2012

34
Trend in Cost of Deposits(cumulative)
Trend in Yield on Advances(cumulative)
Trend in Cost & Yield (Quarterly)
7.60%7.66% 7.77% 7.94%
8.41%
8.30%
5.00%
5.50%
6.00%
6.50%
7.00%
7.50%
8.00%
8.50%
9.00%
Jun-11 Sep-11 Dec-11 Mar-12 Jun-12 Sep-12
11.75%
12.11%12.30%
12.50%
13.01%
12.76%
11.00%
11.20%
11.40%
11.60%
11.80%
12.00%
12.20%
12.40%
12.60%
12.80%
13.00%
13.20%
Jun-11 Sep-11 Dec-11 Mar-12 Jun-12 Sep-12

35
SLR & Non SLR Securities Composition of Investment Bookas on 30- Sept 2012
` in Crores
Category Amount Percentage
Held to Maturity 8913.83 90.76%
Held for Trading 9.61 0.10%
Available for Sale 897.45 9.14%
Total 9820.89 100%
Investment Portfolio
39474593
6146
7621
8699
7591045
381
9531122
0
1000
2000
3000
4000
5000
6000
7000
8000
9000
10000
SEPT 2008 SEPT 2009 SEPT 2010 SEPT 2011 SEPT 2012
SLR Securities Non-SLR Securities
(` in Crores)

36
Sep-11 Dec-11 Mar-12 Jun-12 Sep-12
Total
Investment
Portfolio
3.69 4.07 4.08 4.08 4.43
Total HM
Investment
Portfolio
4.61 4.55 4.51 4.57 4.68
Total HFT
and AFS
together
Investment
Portfolio
0.39 0.64 0.90 1.39 1.67
Duration of Investments
5.95%6.29%
6.73%7.27%
3.20%
4.00%
4.80%
5.60%
6.40%
7.20%
8.00%
8.80%
SEPT 2009 SEPT 2010 SEPT 2011 SEPT 2012
Investment Portfolio
Yield on Investments
(In Years)

37
The bank has CRAR in excess of the required minimum of 9% stipulated by RBI.
CRAR – Basel 2
Adequately Capitalized
17.55
15.86
13.4814.43
0.00
2.00
4.00
6.00
8.00
10.00
12.00
14.00
16.00
18.00
20.00
SEPT 2009 SEPT 2010 SEPT 2011 SEPT 2012
Yearly
38
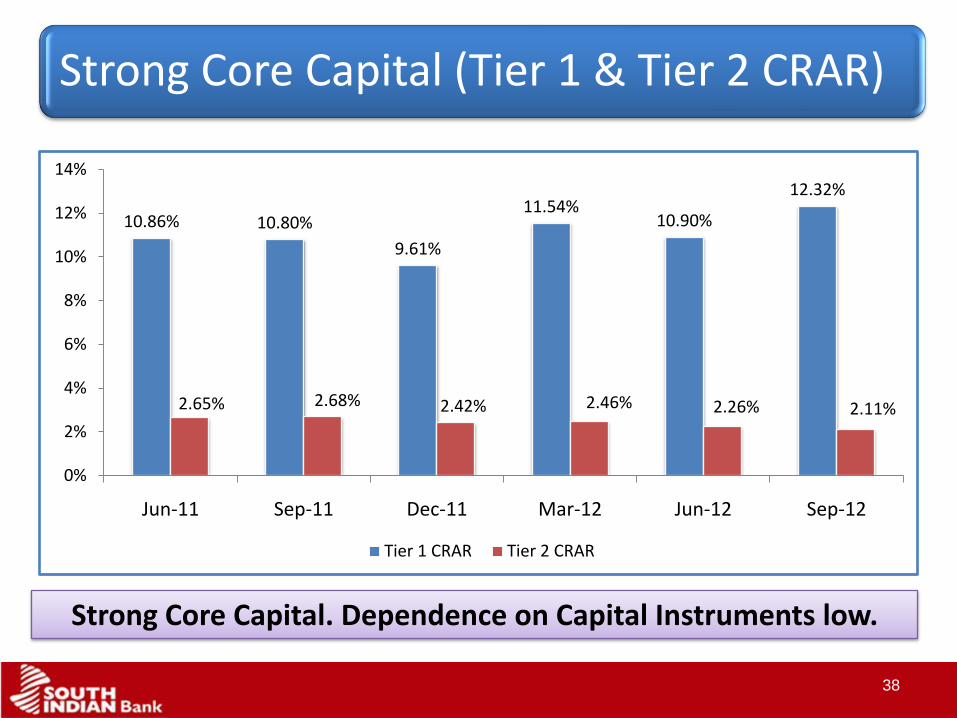
Strong Core Capital. Dependence on Capital Instruments low.
Strong Core Capital (Tier 1 & Tier 2 CRAR)
10.86% 10.80%
9.61%
11.54%10.90%
12.32%
2.65% 2.68% 2.42% 2.46% 2.26% 2.11%
0%
2%
4%
6%
8%
10%
12%
14%
Jun-11 Sep-11 Dec-11 Mar-12 Jun-12 Sep-12
Tier 1 CRAR Tier 2 CRAR

39
RWA Tier 1 Capital Tier 2 Capital Total Capital
Jun 10 11270 1476 326 1802
Sep 10 11861 1551 330 1881
Dec 10 13174 1622 340 1962
Mar 11 14647 1650 401 2051
Jun 11 15152 1645 401 2046
Sep 11 15173 1643 408 2051
Dec 11 17069 1640 414 2054
Mar 12 16987 1960 417 2377
June 12 17955 1957 406 2363
Sep 12 19423 2393 410 2803
(` in crores)
Strong Core Capital (Trend)

40
Gross Annual income grew in 5 years at CAGR 28.25%
Total Income Trend in Expenses
Trend in Income & Expenses
(` in crores)
549684
815
977
1437
1882
0
200
400
600
800
1000
1200
1400
1600
1800
2000
SEPT 2007
SEPT 2008
SEPT 2009
SEPT 2010
SEPT 2011
SEPT 2012
Int Exp Staff Exp Other Exp
668846
10561206
1751
2289
0
500
1000
1500
2000
2500
SEPT 2007
SEPT 2008
SEPT 2009
SEPT 2010
SEPT 2011
SEPT 2012
Int on Adv Int on Inv Oth Int Non-Int Income
41
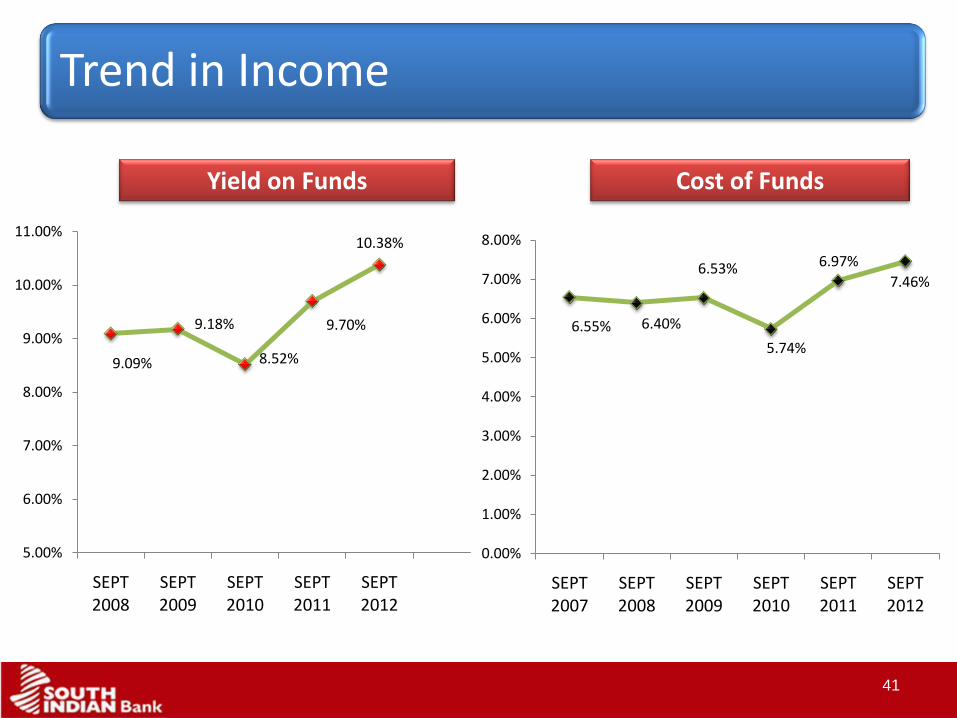
Yield on Funds Cost of Funds
Trend in Income
9.09%
9.18%
8.52%
9.70%
10.38%
5.00%
6.00%
7.00%
8.00%
9.00%
10.00%
11.00%
SEPT 2008
SEPT 2009
SEPT 2010
SEPT 2011
SEPT 2012
6.55% 6.40%
6.53%
5.74%
6.97%
7.46%
0.00%
1.00%
2.00%
3.00%
4.00%
5.00%
6.00%
7.00%
8.00%
SEPT 2007
SEPT 2008
SEPT 2009
SEPT 2010
SEPT 2011
SEPT 2012

42
Particulars Half year ended Sept
2011
Half year ended Sept
2012
Commission, Exchange & Brokerage 15.94 21.11
Profit on sale of investment (Net) 26.24 30.80
Profit on sale of Land, Building & Other assets (Net) 0.02 -0.06
Profit on Exchange Transactions (Net) 11.72 11.62
Miscellaneous Income
1. Processing Fees 6.84 8.25
2. Technology Related 17.96 23.79
3. Bullion 0.58 2.27
4. Transaction Related 23.14 33.32
5. Interest on IT refund - 15.14
6. Others 2.26 1.57
Total 104.70 147.81
(` in crores)
Composition of Other Income

43
Net profit grew at CAGR of 25% (Y-Y) in last 5 years.Net Interest margin (NIM) remains at moderate range.
Growth in Net Profit
Profitability
Net Interest Margin
(` in Crores)
2.64%
3.00% 3.00%
3.09%
2.40%
2.50%
2.60%
2.70%
2.80%
2.90%
3.00%
3.10%
3.20%
SEPT 2009 SEPT 2010 SEPT 2011 SEPT 2012
90101
135
177
220
0
50
100
150
200
250
SEPT 2008 SEPT 2009 SEPT 2010 SEPT 2011 SEPT 2012

44
Return on Average Asset
Efficiency
Return on Equity Return on Asset
44
11.85%
14.43% 14.49%
16.67%17.53%
15.52%
0%
2%
4%
6%
8%
10%
12%
14%
16%
18%
20%
SEPT 2007
SEPT 2008
SEPT 2009
SEPT 2010
SEPT 2011
SEPT 2012
0.94%
1.06%
1.00%
1.03%
1.05%1.06%
0.88%
0.90%
0.92%
0.94%
0.96%
0.98%
1.00%
1.02%
1.04%
1.06%
1.08%
SEPT 2007
SEPT 2008
SEPT 2009
SEPT 2010
SEPT 2011
SEPT 2012

45
Efficiency
Cost / Income Ratio Earning Per Share (Annualized)
45
1.46
2.001.80
2.39
3.13
3.80
0.0
0.5
1.0
1.5
2.0
2.5
3.0
3.5
4.0
SEPT 2007
SEPT 2008
SEPT 2009
SEPT 2010
SEPT 2011
SEPT 2012
52.57%
44.92%
50.72%
49.20%
45.56% 45.16%
40%
42%
44%
46%
48%
50%
52%
54%
SEPT 2007
SEPT 2008
SEPT 2009
SEPT 2010
SEPT 2011
SEPT 2012

46
(` in Lakh)
Profit Per Employee
(` in Lakh)
Productivity
Average Business Per Employee Profit Per Employee
46
534 574636
773
9431038
0
200
400
600
800
1,000
1,200
SEPT 2007
SEPT 2008
SEPT 2009
SEPT 2010
SEPT 2011
SEPT 2012
3.394.05 4.23
5.26
6.43
7.22
0
1
2
3
4
5
6
7
8
SEPT 2007
SEPT 2008
SEPT 2009
SEPT 2010
SEPT 2011
SEPT 2012

47
Productivity
Average Business Per Branch Operating Profit Per Branch
47
43.2449.60
55.63
65.58
81.2586.96
0
10
20
30
40
50
60
70
80
90
100
SEPT 2007
SEPT 2008
SEPT 2009
SEPT 2010
SEPT 2011
SEPT 2012
49.20
62.9269.94
75.44
96.60
111.85
0
20
40
60
80
100
120
SEPT 2007
SEPT 2008
SEPT 2009
SEPT 2010
SEPT 2011
SEPT 2012
(` in Lakh)(` in crore)

48
Asset Quality as on September 2012
Gross NPA & Net NPA(%) Provision Coverage
48
3.41%
1.86%1.61%
1.27%0.99%
1.74%
0.71%
0.40% 0.43% 0.38% 0.25%
0.86%
0.00%
0.50%
1.00%
1.50%
2.00%
2.50%
3.00%
3.50%
4.00%
SEPT 2007
SEPT 2008
SEPT 2009
SEPT 2010
SEPT 2011
SEPT 2012
Gross NPA Net NPA
75.03%70.55%
58.38%
71.20%74.70%
51.21%
0.00%
10.00%
20.00%
30.00%
40.00%
50.00%
60.00%
70.00%
80.00%
SEPT 2007
SEPT 2008
SEPT 2009
SEPT 2010
SEPT 2011
SEPT 2012

49
(` in Crore)
Break-up of Provision
49
Particulars Year ended
31/03/2011
Year ended
31/03/2012
Half Year
ended
30/09/2011
Half Year
ended
30/09/202
For NPA advance 27.74 21.04 2.54 63.86
For Depreciation on
Investments9.37 14.07 14.86 0
For NPA investment 0.26 -0.69 0 0
For standard assets 21.60 39.75 21.17 7.28
For income tax 152.94 170.69 87.37 105.41
For Restructured advances -0.05 4.01 4.94 10.54
General Provision 20 0 0 0
Other impaired assets 0.84 2.79 1.16 -0.33
Others (ADWDRS) 0 -1.80 0 0
Total Provisions and
Contingencies 232.70 249.86 132.04 186.76

50
Performance Highlights Jun-11 Sep-11 Dec-11Year ended
Mar-12June-12 Sep-12
CRAR Basel 2 (%) 13.51% 13.48% 12.03% 14.00% 13.16% 14.43%
Return on Average
Assets (Annualised) 1.02% 1.05% 1.06% 1.12% 1.22% 1.06%
NIM (%) 2.80% 3.00% 3.05% 3.10% 3.15% 3.09%
Gross NPA's 236 230 234 267 295 496
Net NPA 63 58 58 76 95 242
Gross NPA (%) 1.07% 0.99% 0.94% 0.97% 1.08% 1.74%
Net NPA (%) 0.29% 0.25% 0.24% 0.28% 0.35% 0.86%
Provision Coverage 73.15% 74.70% 75.18% 71.36% 67.71% 51.21%
CASA 6790 7038 7280 7179 7835 7684
CASA % 21.47% 21.30% 21.51% 19.67% 21.09% 19.96%
Deposits 31622 33038 33834 36501 37153 38490
Advances 22151 23348 25050 27635 27349 28620
Yield on advances 11.75% 12.11% 12.30% 12.50% 13.01% 12.76%
(` in Crore)
Performance Highlights
50
51
FUTURE STRATEGY

Key Focus
Aims to increase total business mix to ` 1.25 lakh Crore by March 2015.
Enhancing income from Technology products, Treasury, Forex and gold coins
Ramping up low cost as well as retail liabilities.
Enhancing productivity per branch/per employee
52

IMPORTANT NOTICE
53
No representation or warranty, express or implied is made as to, and no reliance should be placed on, thefairness, accuracy, completeness or correctness of such information or opinions contained herein. The informationcontained in this presentation is only current as of its date. Certain statements made in this presentation may not bebased on historical information or facts and may be “forward looking statements”, including those relating to theCompany’s general business plans and strategy, its future financial condition and growth prospects, and futuredevelopments in its industry and its competitive and regulatory environment. Actual results may differ materiallyfrom these forward-looking statements due to a number of factors, including future changes or developments in theCompany’s business, its competitive environment and political, economic, legal and social conditions in India. Thiscommunication is for general information purpose only, without regard to specific objectives, financial situations andneeds of any particular person. This presentation does not constitute an offer or invitation to purchase or subscribefor any shares in the Company and neither any part of it shall form the basis of or be relied upon in connection withany contract or commitment Important Notice whatsoever. The Company may alter, modify or otherwise change inany manner the content of this presentation, without obligation to notify any person of such revision or changes. Thispresentation can not be copied and/or disseminated in any manner.
53

54