investor presentation september 2015 · damages resulting from our research, ... industry; failure...
TRANSCRIPT

1 1
Investor Presentation
September 2015
2
Safe Harbor Statement
This presentation contains "forward-looking information," within the meaning of applicable Canadian securities laws and "forward-looking statements" within the
meaning of the United States Private Securities Litigation Reform Act of 1995 (collectively referred to herein as "forward-looking statements"). Forward-looking
statements can be identified by the use of words, such as "plans," "expects," or "is expected," "budget," "scheduled," "estimates," "forecasts," "intends," "anticipates,"
or "believes" or variations of such words and phrases or state that certain actions, events or results "may," "could," "would," "might" or "will" be taken, occur or be
achieved. These forward-looking statements relate to, among other things, our future results, levels of activity, performance, goals or achievements or other future
events. These forward-looking statements are based on current expectations and various assumptions and analyses made by us in light of our experience and our
perceptions of historical trends, current conditions and expected future developments and other factors that we believe are appropriate in the circumstances. These
forward-looking statements involve known and unknown risks, uncertainties and other factors that may cause actual results or events to differ materially from those
anticipated in our forward-looking statements.
These risks, uncertainties and factors include, but are not limited to: our inability to execute our business plan, or to grow our business; inability to address a slow
return to economic growth, and its impact on our business, results of operations and consolidated financial condition; our limited operating history; inability to
implement our business strategy; fluctuations in our quarterly results; failure to maintain our customer base that generates the majority of our revenues; currency
fluctuations; failure to maintain sufficient insurance coverage; changes in value of our goodwill; failure of a significant market to develop for our products; failure of
hydrogen being readily available on a cost-effective basis; changes in government policies and regulations; lack of new government policies and regulations for the
energy storage technologies; failure of uniform codes and standards for hydrogen fuelled vehicles and related infrastructure to develop; liability for environmental
damages resulting from our research, development or manufacturing operations; failure to compete with other developers and manufacturers of products in our
industry; failure to compete with developers and manufacturers of traditional and alternative technologies; failure to develop partnerships with original equipment
manufacturers, governments, systems integrators and other third parties; inability to obtain sufficient materials and components for our products from suppliers;
failure to manage expansion of our operations; failure to manage foreign sales and operations; failure to recruit, train and retain key management personnel; inability
to integrate acquisitions; failure to develop adequate manufacturing processes and capabilities; failure to complete the development of commercially viable products;
failure to produce cost-competitive products; failure or delay in field testing of our products; failure to produce products free of defects or errors; inability to adapt to
technological advances or new codes and standards; failure to protect our intellectual property; our involvement in intellectual property litigation; exposure to product
liability claims; failure to meet rules regarding passive foreign investment companies; actions of our significant and principal shareholders; failure to maintain the
requirements for continued listing on NASDAQ; dilution as a result of significant issuances of our common shares and preferred shares; inability of U.S. investors to
enforce U.S. civil liability judgments against us; volatility of our common share price; and dilution as a result of the exercise of options.
Readers should not place undue reliance on our forward-looking statements and are encouraged to review the section captioned "Risk Factors" in our regulatory
filings with the Canadian securities regulatory authorities and the U.S. Securities and Exchange Commission for a more complete discussion of factors that could
affect our future performance. Furthermore, the forward-looking statements contained herein are made as of the date of this presentation, and we undertake no
obligation to revise or update any forward-looking statements in order to reflect events or circumstances that may arise after the date of this presentation, unless
otherwise required by law. The forward-looking statements contained in this presentation are expressly qualified by this.

3
• Global provider of energy storage, electrolysis
products hydrogen energy systems and services
• Incorporated in 1995 [NASDAQ: HYGS; TSX: HYG]
• Headquartered in Canada with European facilities in
Germany and Belgium
• 145 patents and patent applications
• More than 2,000 products deployed in 100 countries
worldwide
• Strong professional management team and BOD
Our Company

4
Lines of Business
OnSite Generation Water Electrolyzers
Industrial hydrogen Hydrogen fueling
Power Systems Power Modules
Stationary & Backup
power
Mobility power
Energy Storage Load Control, Smart Grid and Remote Communities

5
Q2 2015 Highlights
Three transformative events this quarter:
• Delivered Kolon 1MW containerized fuel cell system to
Korea as foundation for large multi-MW hydrogen
power plant
• Successfully commissioned E.ON 1MW PEM
electrolyzer for Hamburg energy storage site as
foundation for scaling multi-MW storage solution
• Won the largest commercial order for fuel cells in the
company’s history
We are energizing the world of our customers
Our world is changing too as a result

6
OnSite Generation: Industrial Electrolysis
65 years of technology leadership
1999 2001 2003 2005 2009 2014
Application spectrum
Positioning
Glass Solar Silicone Steel Food Power Plant
Megawatt Scale +500
Reference Sites Top Performance

7
OnSite Generation: Hydrogen Fueling Stations
• Toyota, Honda, Daimler and Hyundai
launch mass production fuel cell vehicles
2015 – 2017
• Hydrogenics has delivered 45 stations
• 9 wins in 2014 (most for shipment in 2015)
California, USA
Stuttgart, Germany
Hamburg, Germany

8
Fuel Cell Mobility Application – on the Move
• Celerity platform continues to attract significant international
interest for bus, truck, train and other mobility applications in
NA, EU & Asia
• CEC awarded $4.7M in funds for Hydrogenics Celerity
platform in two California projects
‒ New Flyer 40ft battery transit bus operated by SunLine Transit
‒ Port of LA class 8 drayage truck to be used on the Alameda Corridor as
well as ports of Long Beach and Los Angeles.
• Interest growing in China for Hydrogenics Heavy Duty (HD)
Fuel Cell Products

9
> 50 € million Alstom Transport Project
• Breakthrough commercialization agreement
• Agreement to power regional commuter trains
in Germany with HyPM™ HD fuel cell systems
• Minimum commitment of 100 trains over the
next 10 years – minimum 200 units
• Total order value >€50 Mill (plus service and
maintenance)
• Delivering prototype in 2015
• Alstom already has LOIs from 5 cities to
purchase trains
• Hydrogenics HD platform technology was the
critical determining factor in the selection
process
10
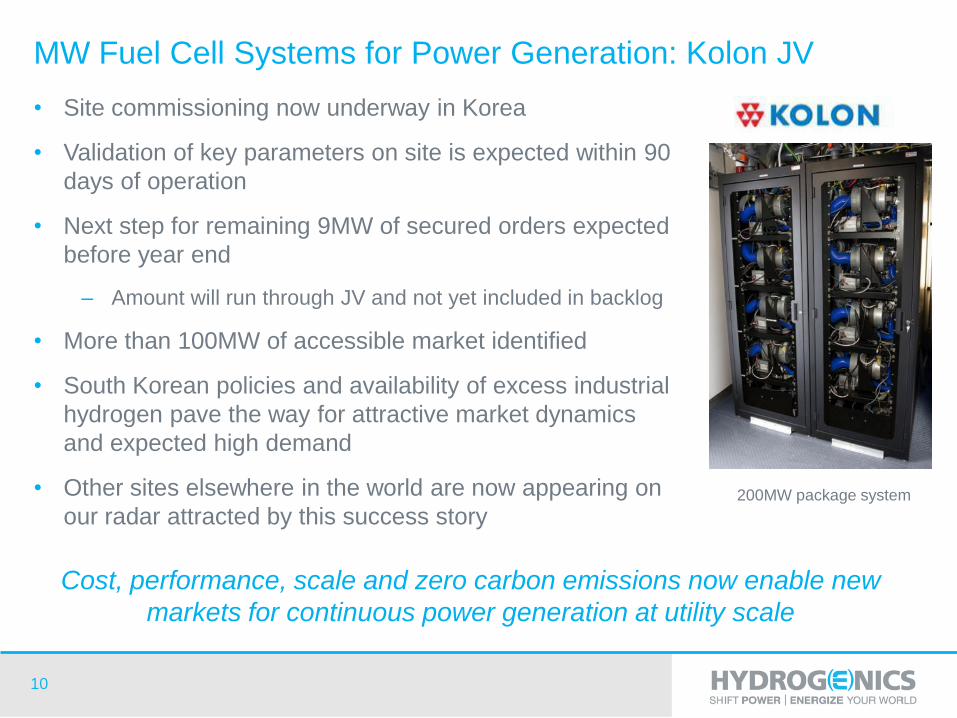
MW Fuel Cell Systems for Power Generation: Kolon JV
• Site commissioning now underway in Korea
• Validation of key parameters on site is expected within 90
days of operation
• Next step for remaining 9MW of secured orders expected
before year end
‒ Amount will run through JV and not yet included in backlog
• More than 100MW of accessible market identified
• South Korean policies and availability of excess industrial
hydrogen pave the way for attractive market dynamics
and expected high demand
• Other sites elsewhere in the world are now appearing on
our radar attracted by this success story
Cost, performance, scale and zero carbon emissions now enable new
markets for continuous power generation at utility scale
200MW package system
11
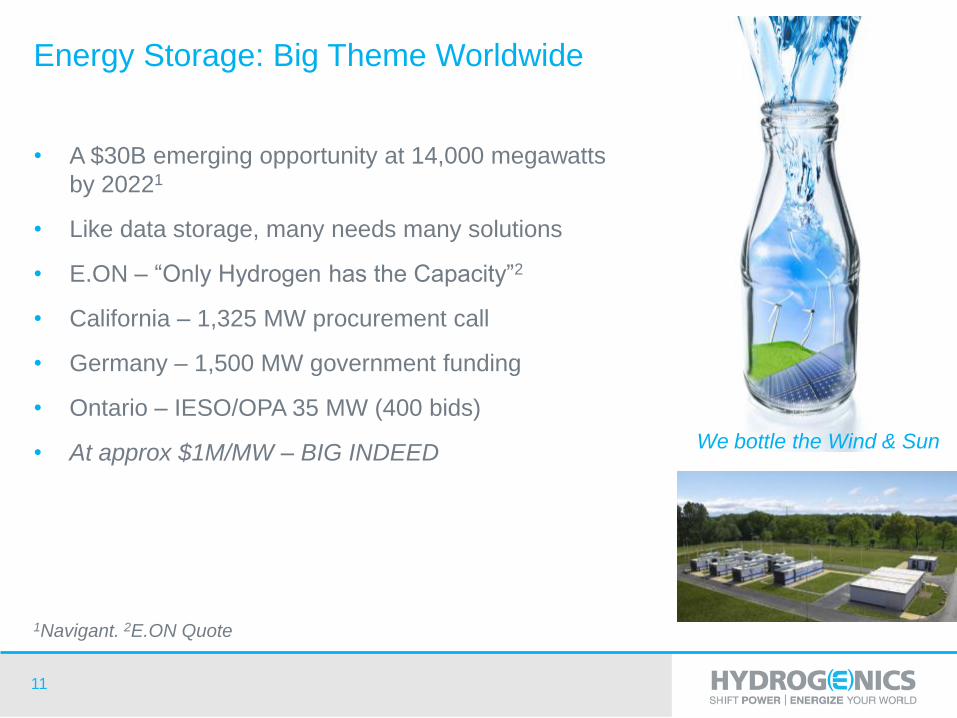
Energy Storage: Big Theme Worldwide
• A $30B emerging opportunity at 14,000 megawatts
by 20221
• Like data storage, many needs many solutions
• E.ON – “Only Hydrogen has the Capacity”2
• California – 1,325 MW procurement call
• Germany – 1,500 MW government funding
• Ontario – IESO/OPA 35 MW (400 bids)
• At approx $1M/MW – BIG INDEED
1Navigant. 2E.ON Quote
We bottle the Wind & Sun

12
Power-to-Hydrogen Conversion Has Many Paths to Value –
Hence a Strong Business Foundation
GAS GRID
Electrolysis H2 storage (optional)
POWER GRID
Power-to-Hydrogen
Power-to-Power
Wind turbine
Solar PV
CHP
Fuel cells
Methanation
Refuelling stations
Refineries
Chemical plants
Power-to-Gas
Hydrogen network Power network Gas network Liquid fuels network
SURPLUS OR LOW-COST ELECTRICITY
Blending
O2 H2O
CO2
H2
Heat
Speciality chemicals
Ammonia
Power-to-Chemicals
Industry
Hydrogen Vehicles (FCEV)
Power-to-Mobility
Gas turbines
Low C02 fuels
Methanol
Power-to-Fuels
CNG

13
EU Fuel Quality Directive
• After significant lobbying, the European Parliament passed a resolution on April
28, 2015 to adopt amendments to the Fuel Quality Directive relating to the
quality of petrol and diesel fuels.
‒ Fuel Quality Directive defines the renewable content of fuels; the omnibus resolution
covers many facets of fuel production
‒ Recognizes hydrogen under classification of “renewable liquid and gaseous fuels of
non-biological origin” -- for the first time covers hydrogen produced by electrolysis
from renewable power / Power-to-Gas
‒ Amendment also places greater restrictions on production of bio-fuels (land use)
• Renewable hydrogen used by a refinery in production of conventional fuels will
be counted at 2x as a result it is expected that it will be cheaper than bio-
diesel to meet Fuel Quality Directive; business case is to be confirmed
• For resolution to become law, it must be passed by each EU member country;
German government is expected to pass FQD Amendment in Q2 2016
• This is the door opener to commercial Power to Gas Projects

14
Numerous Third Party Reports Lend Credibility to Our Solution
Publication Potential for water electrolysis (P2G)
“Study of the requirement for electricity storage in Germany” Agora Energiewende
GER: 16 GW (2023), 80 GW (2033) and 130
GW (2050)
“Reduction of CO2 emissions by addition of hydrogen to natural gas” by Haines, Polman and de Laat, in IEA Greenhouse Gas Control Technologies Volume 1
UK: 23.5 GW of electrolysis in 2050
“Study of hydrogen and methanation as processes for capturing the value of excess electricity” Report by ADEME GRTGaz and GRDF, France
FR: 1.2-1.4 GW of P2G plant in France by 2030 and up to 24 GW by 2050
“The role of power-to-gas in the future Dutch energy system” ECN and DNVGL for TKI Gas, 2014
HOL: 20 GW of installed P2G capacity if deep CO2 emission reduction targets in the energy system (-80% to -95% by 2050)
NREL Hydrogen Energy Storage workshop proceedings February 2015
Commercialization of Energy Storage in Europe FCH-JU (McKinsey) March 2015
GER: 18GW (2030), 46GW (2030 High RES), and 170GW (2050 High RES)

15
Energy Storage – Q2 Highlights
• E.ON 1.5MW project commissioned
‒ First time official gas production
‒ EON operator training now underway
‒ August - unattended operation
• Ontario 2MW project
‒ Will be first North American MW PTG project
‒ Will provide detailed system design for
5MW platform
‒ Operation mid 2016
• Funding agreement has been secured for a further North American
- 5MW project
‒ Overall Pipeline remains strong with the following status:
‒ $13.5M Won
‒ $34.5M Firm spec and quote
‒ $46M Qualified leads

16
Quarterly Achievements Set Stage for Accelerated Growth
• E.ON: Successful operation of the world’s largest single stack
electrolysis unit with highest energy density is the basis for
commercial scale up of hundreds of MW of energy storage power to
gas projects already quoted in our pipeline
• Kolon: Successful operation of our containerized MW fuel cell power
generation unit for South Korea is the first step toward multi-mega
watt projects in Korea and elsewhere
• Alstom: Successful win of significant rail contract in international
competition shows the strength of our team, our technology and the
commercial maturity of the solution
• In combination these three “first of a kind” achievements are the
foundation for accelerated growth in the coming year

17
Apr. 1/15
Backlog
Orders
Received
FX
Orders
Delivered
Jun. 30/15
Backlog
OnSite Generation $ 27.7 $ 3.6 $ - $ 4.5 $ 26.8
Power Systems 28.1 50.0 0.3 2.9 75.5
Total $ 55.8 $ 53.6 $ 0.3 $ 7.4 $ 102.3
As of June 30, 2015
($M)
Order Backlog
Expected Revenue Recognition
During next 12 mths Beyond next 12 mths
OnSite Generation 24.1 2.7
Power Systems 6.7 68.8
Total 30.8 71.5

18
Company Outlook Supported by Pipeline Trends
• Strong backlog at $102.3M, of which $30.8M will ship within next 12 months
• Already secured substantial programs with established customers – additional
orders to follow
• MW power generation (Kolon) next step is substantial, following proof of 1MW
• Energy storage pipeline has 1-15MW projects with good maturity
$M
0
50
100
150
200
250
300
Revenue 2014 Firm Orders MW Power Generation
Balance of Major
Programs
Energy Storage Pipeline
Funded R&D Projects
Pending Customer Firm-up
Qualified Leads
Firm Order with PO - Long Term Firm Order with PO - Current Revenue

19
Six months ended Jun. 30 Change
2015 2014 $ %
Revenue $ 14.9 $ 18.8 (3.9)
(21)%
Gross Profit 2.2
5.2
(3.0) (57)%
Gross Margin % 14.7%
27.5%
Operating Expenses
Selling, general and administrative
(excluding stock-based compensation,
amortization and depreciation) 4.8 5.5
(0.7)
(13)%
Research and product development 2.1 1.8 0.3 13%
Adjusted EBITDA $ (4.7) $ (2.0) $ 2.7
131%
Notes
• Adjusted EBITDA is defined as net loss excluding: cash settled long term compensation indexed to share price, share settled
stock-based compensation expense, net finance income and expenses, depreciation and amortization. Adjusted EBITDA is a
non-IFRS measure and may not be comparable to similar measures used by other companies.
• Management uses Adjusted EBITDA as a useful measure of ongoing operational results.
(in $ millions)
YTD Results

20
Cash and cash equivalents
and restricted cash $ 9.9 $ 10.4 (0.5) (5)%
Trade, other and grants receivable 11.8 12.9 (1.1) (8)%
Inventories 15.4 14.7 0.7 4%
Trade and other payables 9.7 13.2 (3.5) (26)%
Dec. 31,
2014
$ %
($M)
Change June 30,
2015
Consolidated Balance Sheet Highlights

21