investor presentation(dec2011) eng fv
TRANSCRIPT
8/2/2019 Investor Presentation(Dec2011) ENG FV
http://slidepdf.com/reader/full/investor-presentationdec2011-eng-fv 1/24
Investor Presentation
December 2011
8/2/2019 Investor Presentation(Dec2011) ENG FV
http://slidepdf.com/reader/full/investor-presentationdec2011-eng-fv 2/24
Disclaimer
This presentation material is being presented to you solely for your information only and may not be taken away you and may not be
reproduced, redistributed or passed on, directly or indirectly, to any other person or published, in whole or in part, for any purpose.
This presentation material is not an offer or sale of the securities of Korea Electric Power Corporation ("KEPCO" or the "Company") in the United States and
does not constitute a prospectus or other offering circular, in whole or in part. Neither any part of this presentation nor any information or statement containedtherein shall form the basis of or be relied upon in connection with any contract or commitment whatsoever. Any decision to purchase securities in the
context of the offering of securities, if any, should be made solely on the basis of information contained in a published prospectus or other offering circularissued by the Company in connection with such an offering.
This presentation material has been prepared by the Company, solely for the use at this presentation and have not been independently verified. Norepresentations or warranties, express or implied, are made as to, and no reliance should be placed on, the accuracy, fairness or completeness of the
information presented or contained in this presentation. Neither the Company nor any of its affiliates, advisers or representatives accepts any responsibilitywhatsoever for any loss or damage arising from any information presented or contained in this presentation material. Unless otherwise stated, the informationpresented or contained in this presentation material is current as of the date hereof and is subject to change without notice and its accuracy is not guaranteed.
Neither the Company nor any of its affiliates, advisers or representatives make any undertaking to update any such information subsequent to the date hereof.
This presentation material should not be construed as legal, tax, investment or other advice.
Certain information and statements made in this presentation contain "forward-looking statements". Such forward-looking statements can be identified by theuse of forward-looking terminology such as "anticipate," "believe," "considering," "depends," "estimate," "expect," "intend," "plan," "planning," "planned,"
"project," "trend," and similar expressions. All forward-looking statements are the Company's current expectation of future events and are subject to a numberof factors that could cause actual results to differ materially from those described in the forward-looking statements. Caution should be taken with respect tosuch statements and you should not place undue reliance on any such forward-looking statements.
Certain industry and market data in this presentation was obtained from various trade associations, and the Company has not verified such data withindependent sources. Accordingly, the Company makes no representations as to the accuracy or completeness of that data, and such data involves risks and
uncertainties and is subject to change based on various factors.
This presentation material contains certain estimated unaudited financial information relating to the financial condition and results of operations of KEPCO
and its six wholly-owned generation subsidiaries ("GENCOs") as of and for the year ended December 31, 2009, which is presented on a combined basis bysimply adding the non-consolidated information of KEPCO and the GENCOs after adjusting for major intercompany transactions among those entities. Such
information represents preliminary internal estimates made by KEPCO based on Korean GAAP. Such information has neither been audited nor reviewed byKEPCO’s independent accountants or any other independent public accountants, and may differ significantly from the actual results of operations of KEPCOand/or the GENCOs of and for the year ended December 31, 2009 and accordingly should not be relied upon for investment, including but not limited to
purchase of any securities, or for other purposes.
2
8/2/2019 Investor Presentation(Dec2011) ENG FV
http://slidepdf.com/reader/full/investor-presentationdec2011-eng-fv 3/24
Table of Contents
COMPANY PROFILE
BUSINESS & OPERATION
lll FINANCIALS
Overseas BusinesslV
l
ll
3
8/2/2019 Investor Presentation(Dec2011) ENG FV
http://slidepdf.com/reader/full/investor-presentationdec2011-eng-fv 4/24
I. Company Profile
4
8/2/2019 Investor Presentation(Dec2011) ENG FV
http://slidepdf.com/reader/full/investor-presentationdec2011-eng-fv 5/24
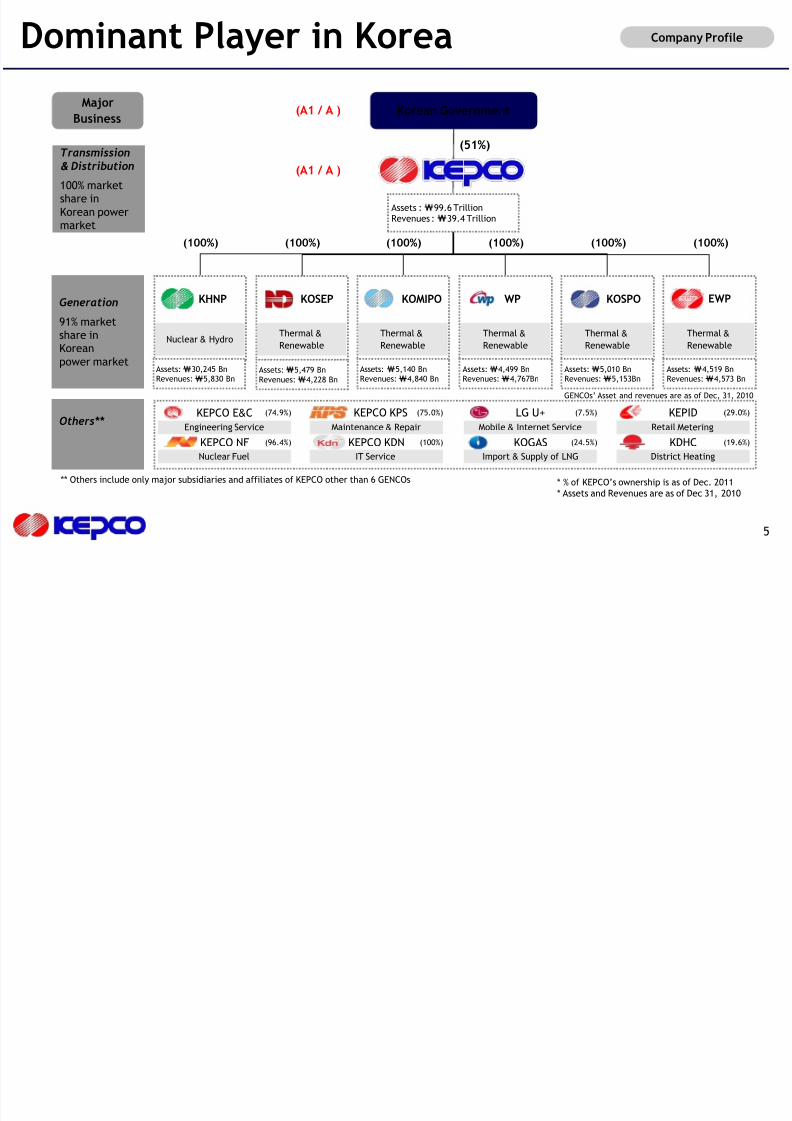
Dominant Player in Korea Company Profile
5
Major
Business
Transmission
& Distribution
100% marketshare in
Korean powermarket
Generation
91% marketshare inKorean
power market
Others**
Korean Government
Assets :₩99.6 Trillion
Revenues :₩39.4 Trillion
Thermal &
Renewable
Thermal &
Renewable
Thermal &
Renewable
Thermal &
Renewable
Thermal &
Renewable
(100%) (100%)
Nuclear & Hydro
Assets:₩30,245 Bn
Revenues: ₩5,830 Bn
(100%) (100%) (100%) (100%)
(51%)
Assets:₩5,479 Bn
Revenues: ₩4,228 Bn
Assets: ₩5,140 Bn
Revenues: ₩4,840 Bn
Assets:₩4,499 Bn
Revenues: ₩4,767Bn
Assets:₩5,010 Bn
Revenues: ₩5,153Bn
Assets: ₩4,519 Bn
Revenues:₩4,573 Bn
KEPCO E&C (74.9%)Engineering Service
KEPCO KPS (75.0%)Maintenance & Repair
Nuclear Fuel IT Service
Mobile & Internet Service Retail Metering
Import & Supply of LNG District Heating
LG U+ KEPID
KOGAS KDHC
(7.5%) (29.0%)
(24.5%) (19.6%)KEPCO NF (96.4%) KEPCO KDN (100%)
KOSEPKHNP KOMIPO WP KOSPO EWP
(A1 / A )
(A1 / A )
GENCOs’ Asset and revenues are as of Dec, 31, 2010
** Others include only major subsidiaries and affiliates of KEPCO other than 6 GENCOs * % of KEPCO’s ownership is as of Dec. 2011
* Assets and Revenues are as of Dec 31, 2010
8/2/2019 Investor Presentation(Dec2011) ENG FV
http://slidepdf.com/reader/full/investor-presentationdec2011-eng-fv 6/24
II. Business & Operation
6
8/2/2019 Investor Presentation(Dec2011) ENG FV
http://slidepdf.com/reader/full/investor-presentationdec2011-eng-fv 7/24
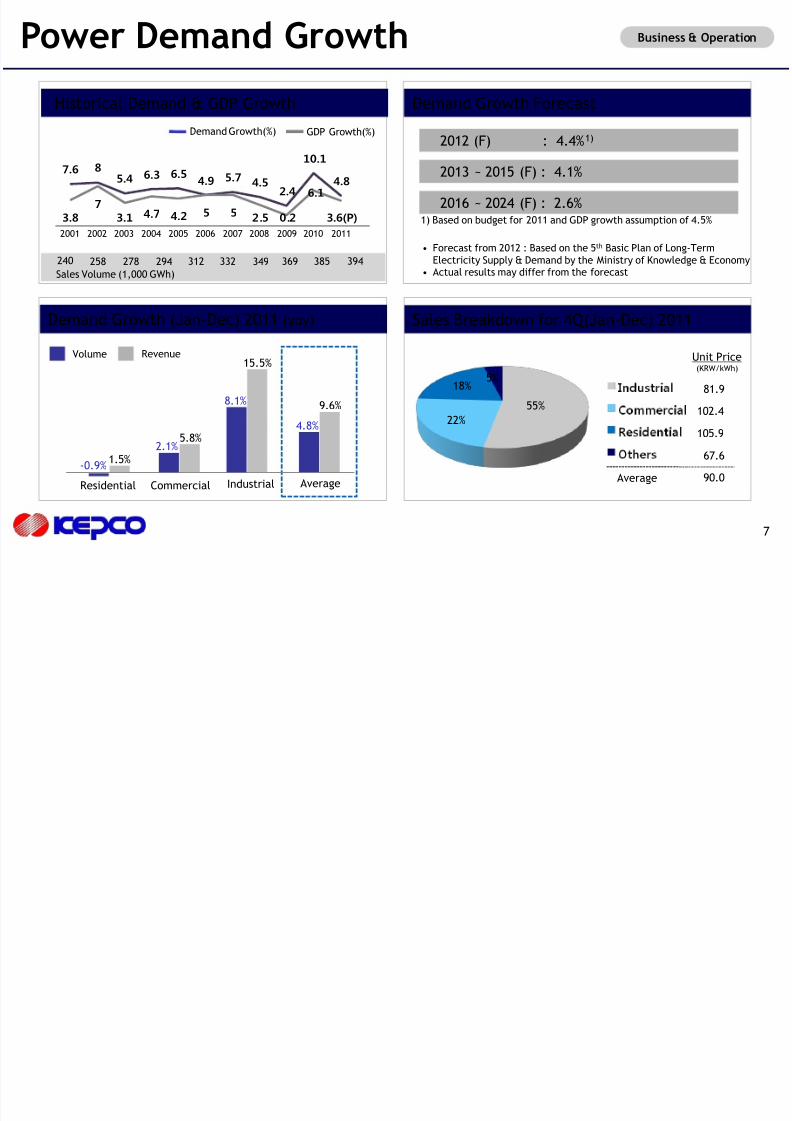
Power Demand Growth Business & Operation
7
2013 ~ 2015 (F) : 4.1%
2016 ~ 2024 (F) : 2.6%
2012 (F) : 4.4%1)
Demand Growth Forecast
• Forecast from 2012 : Based on the 5th Basic Plan of Long-Term
Electricity Supply & Demand by the Ministry of Knowledge & Economy
• Actual results may differ from the forecast
1) Based on budget for 2011 and GDP growth assumption of 4.5%
240 258 278 294 312 332 349 369 385
Sales Volume (1,000 GWh)
394
Volume Revenue
Residential Commercial Average
-0.9%
2.1%
8.1%
4.8%
1.5%
5.8%
15.5%
Industrial
9.6%
Demand Growth (Jan-Dec) 2011 (yoy) Sales Breakdown for 4Q(Jan-Dec) 2011
81.9
102.4105.9
67.6
90.0
55%
22%
18%5%
Unit Price(KRW/kWh)
Average
7.6 85.4 6.3 6.5
4.9 5.74.5
2.4
10.1
4.8
3.8
7
3.1 4.7 4.2 5 52.5 0.2
6.1
3.6(P)
Demand Growth(%) GDP Growth(%)
2001 2002 2005 20092003 2004 2006 2007 20112008 2010
Historical Demand & GDP Growth
8/2/2019 Investor Presentation(Dec2011) ENG FV
http://slidepdf.com/reader/full/investor-presentationdec2011-eng-fv 8/24
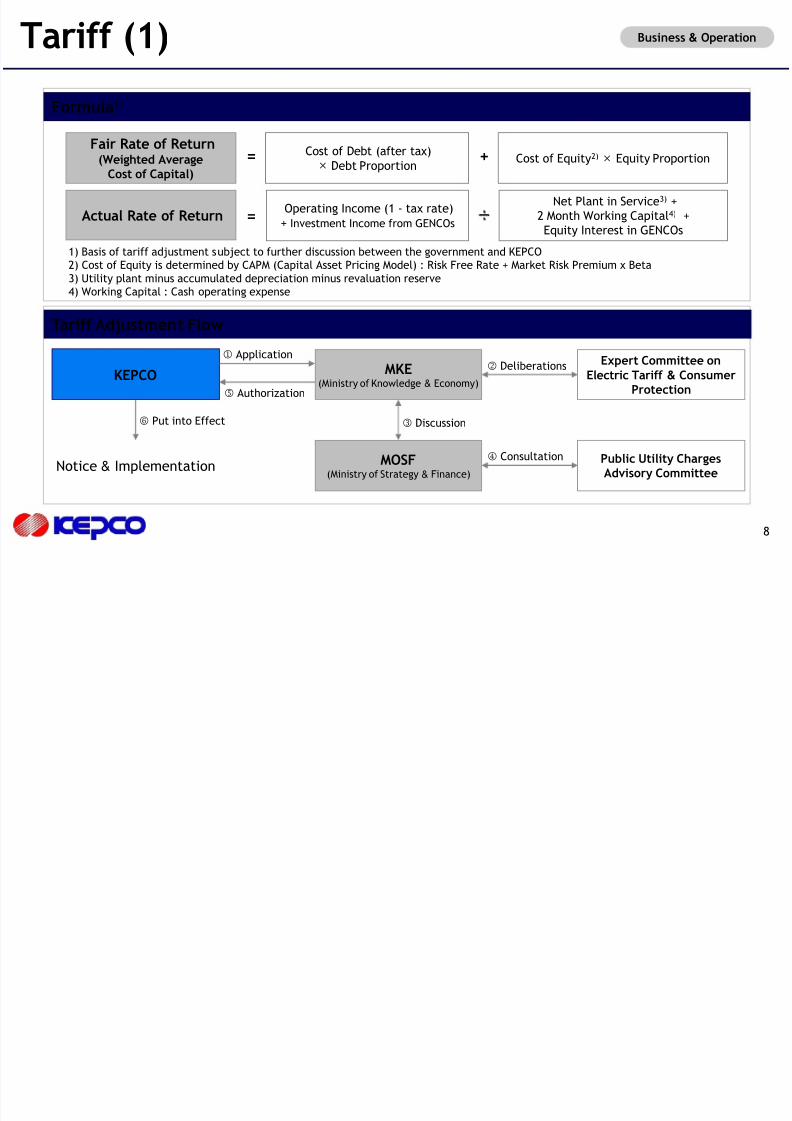
Formula1)
KEPCO MKE(Ministry of Knowledge & Economy)
MOSF(Ministry of Strategy & Finance)
Expert Committee onElectric Tariff & Consumer
Protection
Public Utility ChargesAdvisory Committee
Notice & Implementation
Tariff Adjustment Flow
Application
Authorization
Deliberations
Discussion
Consultation
Put into Effect
1) Basis of tariff adjustment subject to further discussion between the government and KEPCO2) Cost of Equity is determined by CAPM (Capital Asset Pricing Model) : Risk Free Rate + Market Risk Premium x Beta
3) Utility plant minus accumulated depreciation minus revaluation reserve4) Working Capital : Cash operating expense
Fair Rate of Return(Weighted Average
Cost of Capital)
Cost of Debt (after tax)
× Debt ProportionCost of Equity2) × Equity Proportion= +
Actual Rate of ReturnNet Plant in Service3) +
2 Month Working Capital4) +
Equity Interest in GENCOs
Operating Income (1 - tax rate)
+ Investment Income from GENCOs= ÷
Business & OperationTariff (1)
8
8/2/2019 Investor Presentation(Dec2011) ENG FV
http://slidepdf.com/reader/full/investor-presentationdec2011-eng-fv 9/24
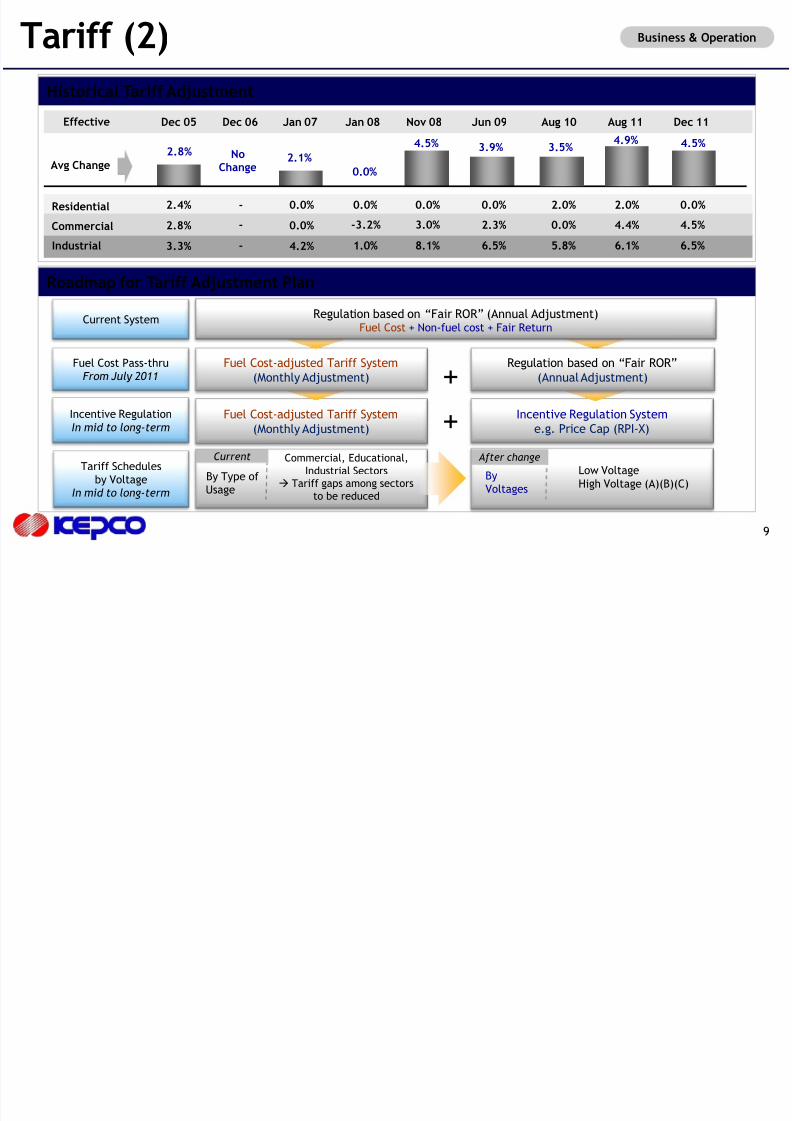
Historical Tariff Adjustment
2.8%
Residential
Commercial
Industrial
2.4%
2.8%
3.3%
Avg Change2.1%
0.0%
-3.2%
1.0%
0.0%
3.0%
8.1%
4.5%
0.0%
2.3%
6.5%
3.9%
0.0%
0.0%
0.0%
4.2%
Effective Dec 05 Jan 07 Jun 09Jan 08 Nov 08Dec 06
NoChange
-
-
-
Business & OperationTariff (2)
2.0%
0.0%
5.8%
3.5%
Aug 10
9
Roadmap for Tariff Adjustment Plan
Incentive Regulation Systeme.g. Price Cap (RPI-X)
+
Fuel Cost-adjusted Tariff System(Monthly Adjustment)
Current System
Fuel Cost Pass-thruFrom July 2011
Incentive RegulationIn mid to long-term
Tariff Schedulesby Voltage
In mid to long-term
+
By Type of Usage
Commercial, Educational,
Industrial Sectors Tariff gaps among sectors
to be reduced
ByVoltages
Low Voltage
High Voltage (A)(B)(C)
Current After change
Fuel Cost-adjusted Tariff System
(Monthly Adjustment)
Regulation based on “Fair ROR”
(Annual Adjustment)
Regulation based on “Fair ROR” (Annual Adjustment) Fuel Cost + Non-fuel cost + Fair Return
4.9%
2.0%
4.4%
6.1%
Aug 11
0.0%
4.5%
6.5%
Dec 11
4.5%
8/2/2019 Investor Presentation(Dec2011) ENG FV
http://slidepdf.com/reader/full/investor-presentationdec2011-eng-fv 10/24
Business & OperationFuel Cost Adjusted-Tariff System
10
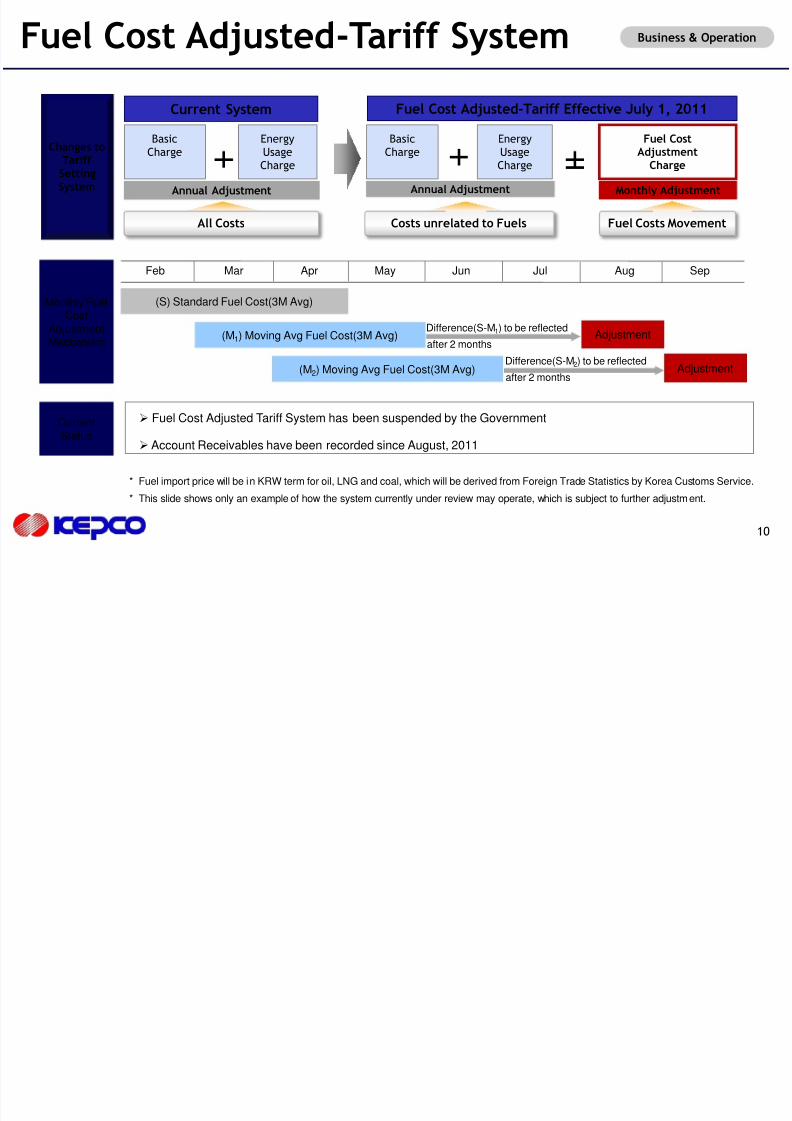
Monthly FuelCost
AdjustmentMechanism
* This slide shows only an example of how the system currently under review may operate, which is subject to further adjustment.
Feb Mar Jun Jul Aug SepApr May
AdjustmentDifference(S-M1) to be reflected
after 2 months
CurrentStatus
* Fuel import price will be in KRW term for oil, LNG and coal, which will be derived from Foreign Trade Statistics by Korea Customs Service.
(S) Standard Fuel Cost(3M Avg)
(M1) Moving Avg Fuel Cost(3M Avg)
(M2) Moving Avg Fuel Cost(3M Avg) AdjustmentDifference(S-M2) to be reflected
after 2 months
Fuel Cost Adjusted Tariff System has been suspended by the Government
Account Receivables have been recorded since August, 2011
Changes toTariff SettingSystem
Current System
BasicCharge
EnergyUsageCharge
Annual Adjustment
All Costs
Annual Adjustment
BasicCharge
EnergyUsageCharge
Costs unrelated to Fuels
Fuel CostAdjustment
Charge
Monthly Adjustment
Fuel Costs Movement
Fuel Cost Adjusted-Tariff Effective July 1, 2011
8/2/2019 Investor Presentation(Dec2011) ENG FV
http://slidepdf.com/reader/full/investor-presentationdec2011-eng-fv 11/24
Fuel Price & Expense Business & Operation
11
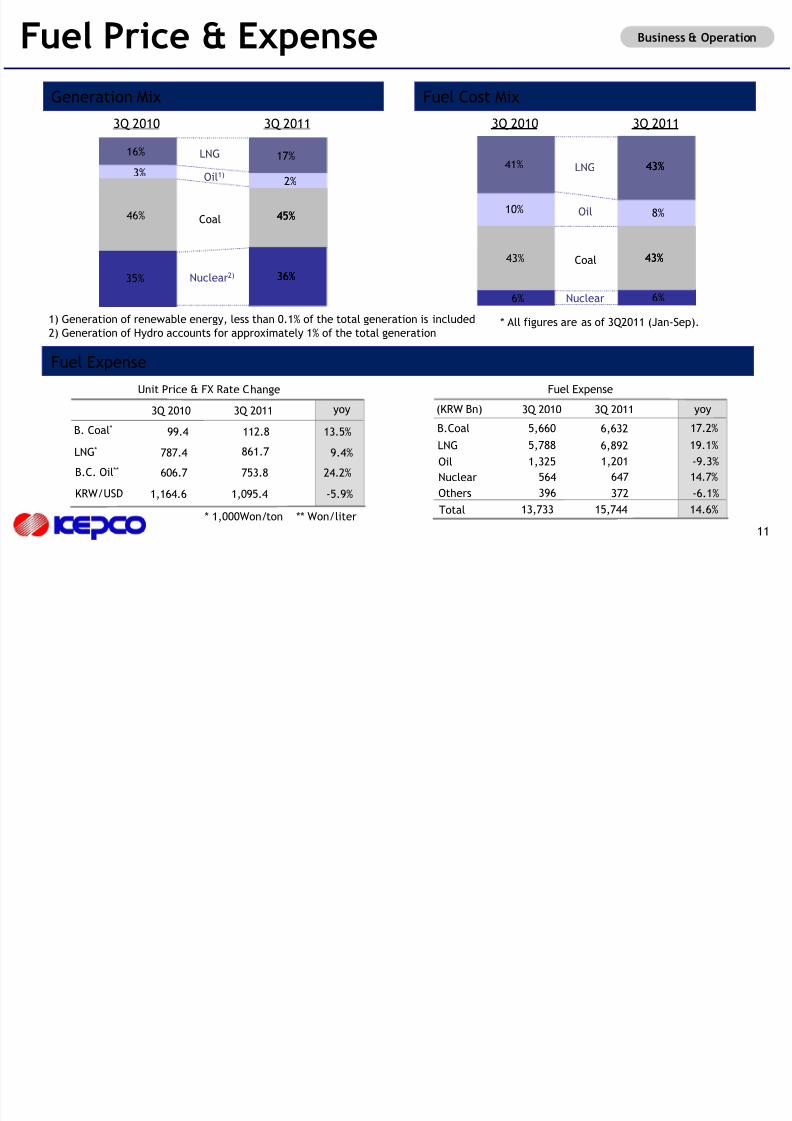
Fuel Cost MixGeneration Mix
3Q 2010 3Q 2011 3Q 2010 3Q 2011
Nuclear2)
Coal
Oil1)
LNG
35%
17%
45%46%
3%
16%
36%
2%
Coal
Oil
LNG
6%
43%43%
6%
43%
10%
41%
Nuclear
8%
Fuel Expense
Unit Price & FX Rate Change
3Q 2010 3Q 2011
B. Coal*
B.C. Oil**
LNG*
KRW/USD
99.4 112.8
606.7 753.8
787.4
1,164.6 1,095.4
yoy
24.2%
-5.9%
13.5%
9.4%
Fuel Expense
3Q 2010 3Q 2011
B.Coal
Oil
LNG
Nuclear
yoy
Others
Total
861.7
* 1,000Won/ton ** Won/liter
(KRW Bn)
5,660
1,325
5,788
564
396
13,733
6,632
1,201
6,892
647
372
15,744
17.2%
-9.3%
19.1%
14.7%
-6.1%
14.6%
1) Generation of renewable energy, less than 0.1% of the total generation is included
2) Generation of Hydro accounts for approximately 1% of the total generation
45%
36%
43%
43%
* All figures are as of 3Q2011 (Jan-Sep).
8/2/2019 Investor Presentation(Dec2011) ENG FV
http://slidepdf.com/reader/full/investor-presentationdec2011-eng-fv 12/24
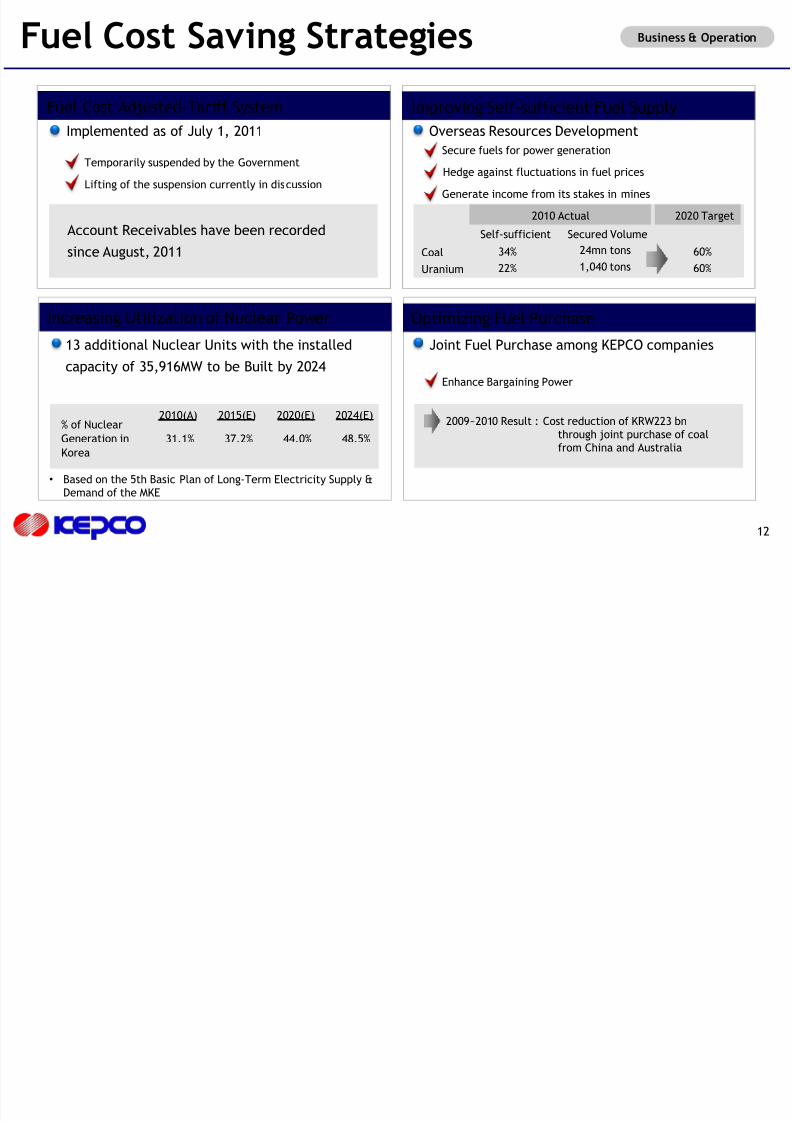
Business & OperationFuel Cost Saving Strategies
12
Optimizing Fuel Purchase
Joint Fuel Purchase among KEPCO companies
Enhance Bargaining Power
2009~2010 Result : Cost reduction of KRW223 bnthrough joint purchase of coalfrom China and Australia
Increasing Utilization of Nuclear Power
13 additional Nuclear Units with the installed
capacity of 35,916MW to be Built by 2024
2010(A) 2015(E) 2020(E) 2024(E)
31.1% 37.2% 44.0% 48.5%
% of Nuclear
Generation in
Korea
• Based on the 5th Basic Plan of Long-Term Electricity Supply &Demand of the MKE
Improving Self-sufficient Fuel Supply
Overseas Resources Development
Hedge against fluctuations in fuel prices
Coal
Uranium
2020 Target2010 Actual
34%
22%
Secure fuels for power generation
Generate income from its stakes in mines
1,040 tons
24mn tons
Secured Volume
60%
60%
Self-sufficient
Fuel Cost Adjusted-Tariff System
Implemented as of July 1, 2011
Account Receivables have been recorded
since August, 2011
Temporarily suspended by the Government
Lifting of the suspension currently in discussion
8/2/2019 Investor Presentation(Dec2011) ENG FV
http://slidepdf.com/reader/full/investor-presentationdec2011-eng-fv 13/24
III. Financials
13
8/2/2019 Investor Presentation(Dec2011) ENG FV
http://slidepdf.com/reader/full/investor-presentationdec2011-eng-fv 14/24
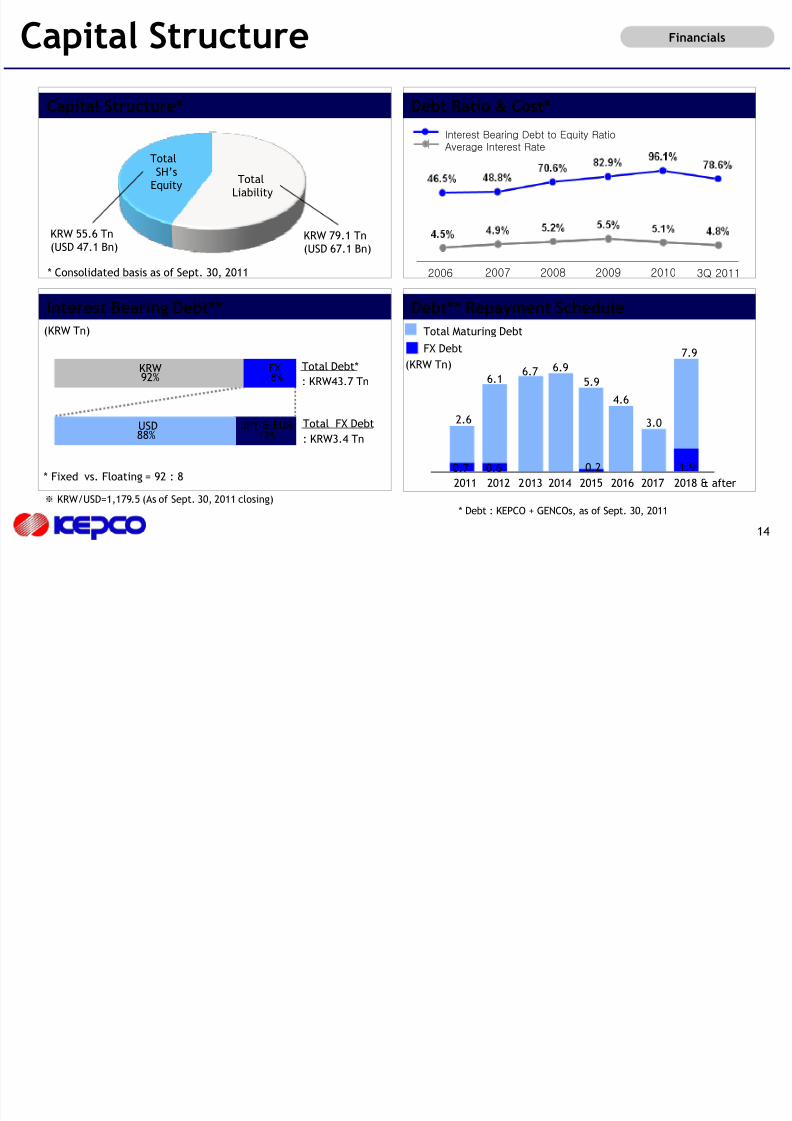
FinancialsCapital Structure
14
Capital Structure*
Interest Bearing Debt** Debt** Repayment Schedule
* Fixed vs. Floating = 92 : 8
(KRW Tn)
Debt Ratio & Cost*
Total
SH’s Equity
TotalLiability
* Consolidated basis as of Sept. 30, 2011
KRW 55.6 Tn(USD 47.1 Bn)
KRW 79.1 Tn(USD 67.1 Bn)
Interest Bearing Debt to Equity Ratio
Average Interest Rate
2006 2007 2008 2009 2010 3Q 2011
FX8%
KRW92%
USD88%
JPY & EUR12%
Total Debt*
: KRW43.7 Tn
Total FX Debt
: KRW3.4 Tn
* Debt : KEPCO + GENCOs, as of Sept. 30, 2011※ KRW/USD=1,179.5 (As of Sept. 30, 2011 closing)
Total Maturing Debt
FX Debt
2011 2012 2013 2014 2015 2016 2017
2.6
6.7 6.9
4.6
3.0
0.60.7
2018 & after
7.9
1.9
5.96.1
0.2
(KRW Tn)
8/2/2019 Investor Presentation(Dec2011) ENG FV
http://slidepdf.com/reader/full/investor-presentationdec2011-eng-fv 15/24
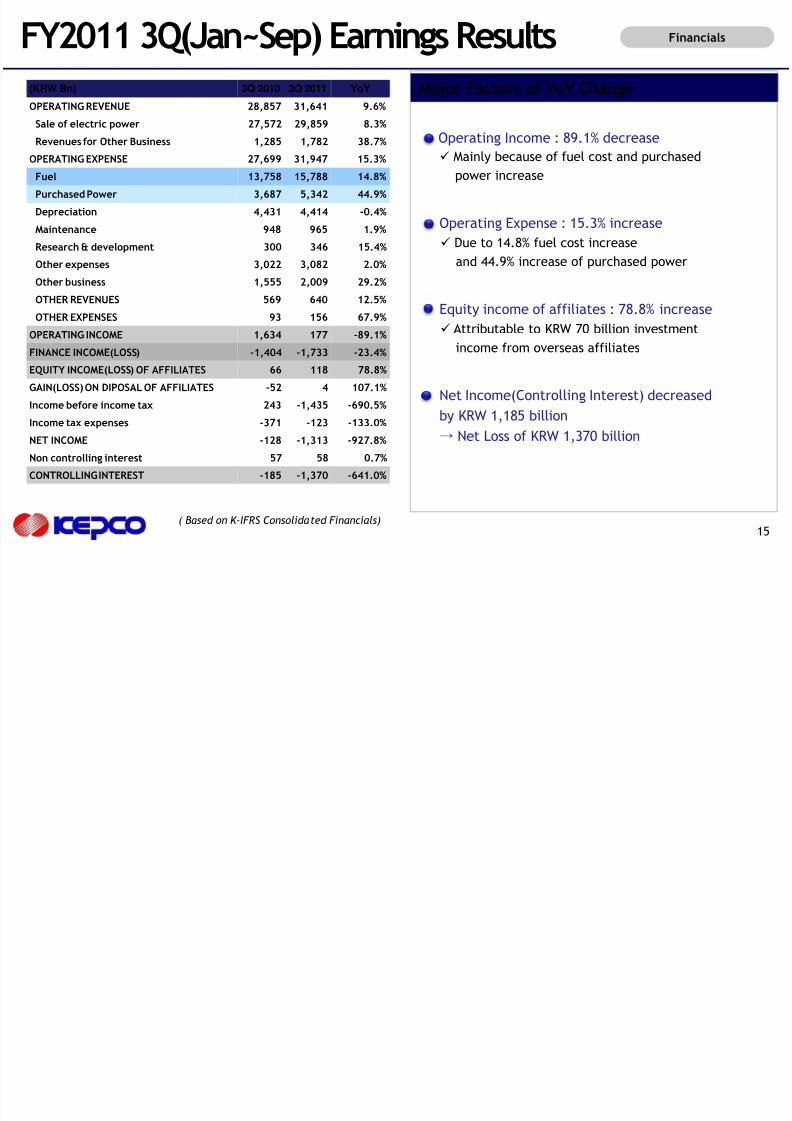
FinancialsFY2011 3Q(Jan~Sep) Earnings ResultsMajor Factors of YoY Change
15( Based on K-IFRS Consolidated Financials)
Operating Expense : 15.3% increase
Due to 14.8% fuel cost increase
and 44.9% increase of purchased power
Operating Income : 89.1% decrease Mainly because of fuel cost and purchased
power increase
Equity income of affiliates : 78.8% increase
Attributable to KRW 70 billion investment
income from overseas affiliates
Net Income(Controlling Interest) decreased
by KRW 1,185 billion→ Net Loss of KRW 1,370 billion
(KRW Bn) 3Q 2010 3Q 2011 YoY
OPERATING REVENUE 28,857 31,641 9.6%
Sale of electric power 27,572 29,859 8.3%
Revenues for Other Business 1,285 1,782 38.7%OPERATING EXPENSE 27,699 31,947 15.3%
Fuel 13,758 15,788 14.8%
Purchased Power 3,687 5,342 44.9%
Depreciation 4,431 4,414 -0.4%
Maintenance 948 965 1.9%
Research & development 300 346 15.4%
Other expenses 3,022 3,082 2.0%
Other business 1,555 2,009 29.2%
OTHER REVENUES 569 640 12.5%
OTHER EXPENSES 93 156 67.9%
OPERATING INCOME 1,634 177 -89.1%
FINANCE INCOME(LOSS) -1,404 -1,733 -23.4%
EQUITY INCOME(LOSS) OF AFFILIATES 66 118 78.8%
GAIN(LOSS) ON DIPOSAL OF AFFILIATES -52 4 107.1%
Income before income tax 243 -1,435 -690.5%
Income tax expenses -371 -123 -133.0%
NET INCOME -128 -1,313 -927.8%
Non controlling interest 57 58 0.7%
CONTROLLING INTEREST -185 -1,370 -641.0%
8/2/2019 Investor Presentation(Dec2011) ENG FV
http://slidepdf.com/reader/full/investor-presentationdec2011-eng-fv 16/24
8/2/2019 Investor Presentation(Dec2011) ENG FV
http://slidepdf.com/reader/full/investor-presentationdec2011-eng-fv 17/24
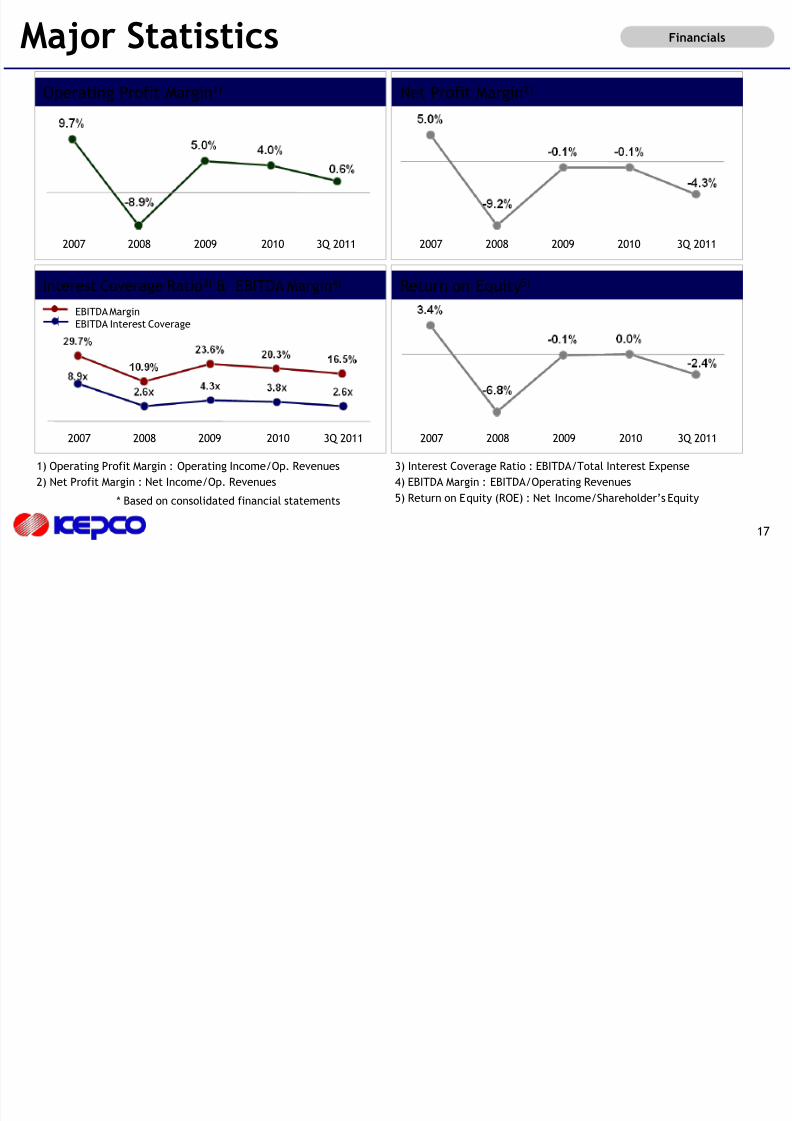
FinancialsMajor Statistics
17
Return on Equity5)Interest Coverage Ratio3) & EBITDA Margin4)
Net Profit Margin2)Operating Profit Margin1)
* Based on consolidated financial statements
1) Operating Profit Margin : Operating Income/Op. Revenues
2) Net Profit Margin : Net Income/Op. Revenues
3) Interest Coverage Ratio : EBITDA/Total Interest Expense
4) EBITDA Margin : EBITDA/Operating Revenues
5) Return on Equity (ROE) : Net Income/Shareholder’s Equity
20102008 2009 3Q 20112007
20102007 2008 2009 3Q 2011
20102007 2008 2009 3Q 2011
20102007 2008 2009 3Q 2011
EBITDA Margin
EBITDA Interest Coverage
A S l Pl
8/2/2019 Investor Presentation(Dec2011) ENG FV
http://slidepdf.com/reader/full/investor-presentationdec2011-eng-fv 18/24
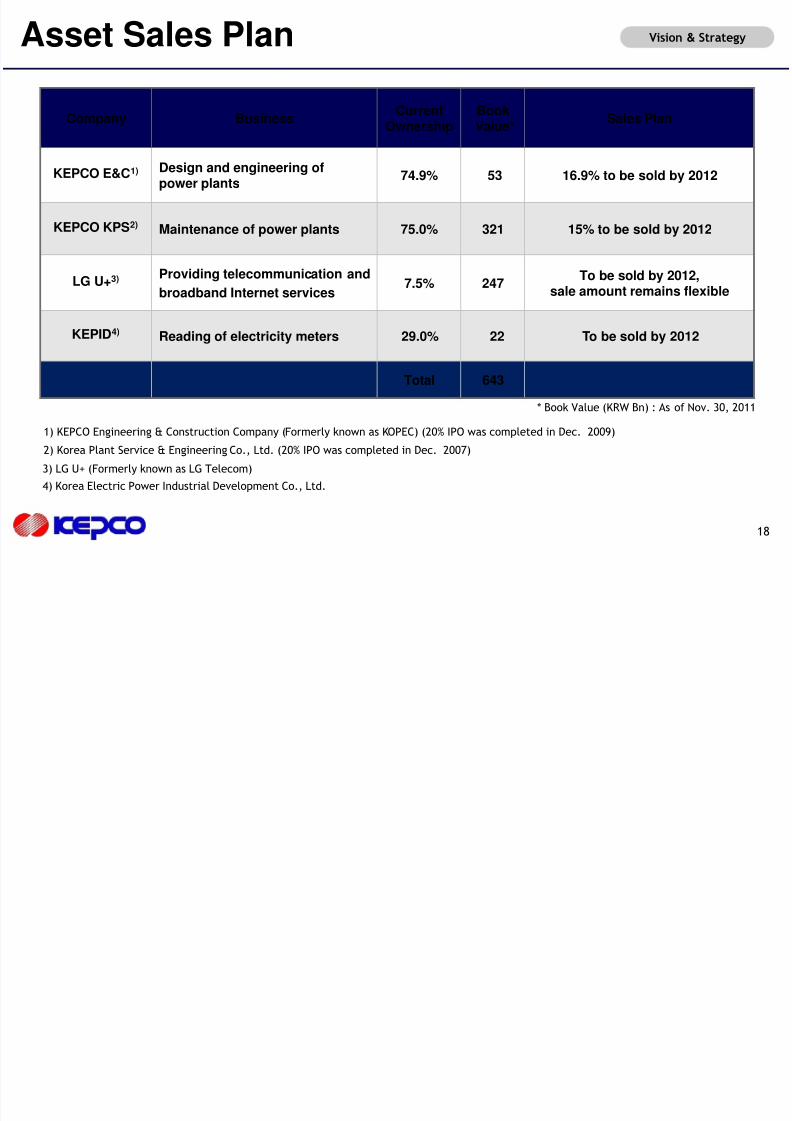
Asset Sales Plan Vision & Strategy
18
1) KEPCO Engineering & Construction Company (Formerly known as KOPEC) (20% IPO was completed in Dec. 2009)
3) LG U+ (Formerly known as LG Telecom)
2) Korea Plant Service & Engineering Co., Ltd. (20% IPO was completed in Dec. 2007)
* Book Value (KRW Bn) : As of Nov. 30, 2011
4) Korea Electric Power Industrial Development Co., Ltd.
Company BusinessCurrent
OwnershipBookValue*
Sales Plan
KEPCO E&C1) Design and engineering ofpower plants
74.9% 53 16.9% to be sold by 2012
KEPCO KPS2) Maintenance of power plants 75.0% 321 15% to be sold by 2012
LG U+3)Providing telecommunication and
broadband Internet services 7.5% 247 To be sold by 2012,sale amount remains flexible
KEPID4) Reading of electricity meters 29.0% 22 To be sold by 2012
Total 643
8/2/2019 Investor Presentation(Dec2011) ENG FV
http://slidepdf.com/reader/full/investor-presentationdec2011-eng-fv 19/24
lV. Overseas Business
19
O B i
8/2/2019 Investor Presentation(Dec2011) ENG FV
http://slidepdf.com/reader/full/investor-presentationdec2011-eng-fv 20/24
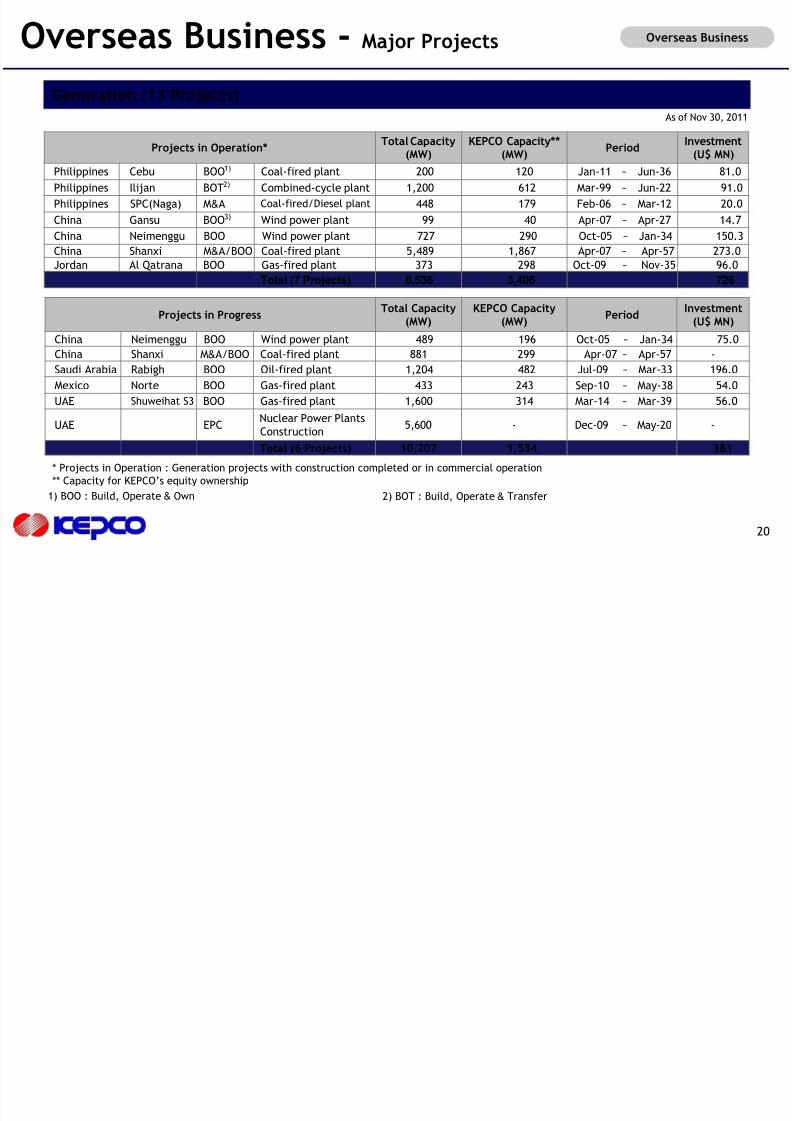
Overseas Business - Major Projects
As of Nov 30, 2011
Generation (13 Projects)
20
Overseas Business
* Projects in Operation : Generation projects with construction completed or in commercial operation
** Capacity for KEPCO’s equity ownership
Projects in ProgressTotal Capacity
(MW)KEPCO Capacity
(MW)Period
Investment(U$ MN)
China Neimenggu BOO Wind power plant 489 196 Oct-05 ~ Jan-34 75.0
China Shanxi M&A/BOO Coal-fired plant 881 299 Apr-07 ~ Apr-57 -
Saudi Arabia Rabigh BOO Oil-fired plant 1,204 482 Jul-09 ~ Mar-33 196.0
Mexico Norte BOO Gas-fired plant 433 243 Sep-10 ~ May-38 54.0
UAE Shuweihat S3 BOO Gas-fired plant 1,600 314 Mar-14 ~ Mar-39 56.0
UAE EPC Nuclear Power PlantsConstruction
5,600 - Dec-09 ~ May-20 -
Total (6 Projects) 10,207 1,534 381
Projects in Operation* Total Capacity(MW) KEPCO Capacity**(MW) Period Investment(U$ MN)
Philippines Cebu BOO1) Coal-fired plant 200 120 Jan-11 ~ Jun-36 81.0
Philippines Ilijan BOT2) Combined-cycle plant 1,200 612 Mar-99 ~ Jun-22 91.0
Philippines SPC(Naga) M&A Coal-fired/Diesel plant 448 179 Feb-06 ~ Mar-12 20.0
China Gansu BOO3) Wind power plant 99 40 Apr-07 ~ Apr-27 14.7
China Neimenggu BOO Wind power plant 727 290 Oct-05 ~ Jan-34 150.3
China Shanxi M&A/BOO Coal-fired plant 5,489 1,867 Apr-07 ~ Apr-57 273.0
Jordan Al Qatrana BOO Gas-fired plant 373 298 Oct-09 ~ Nov-35 96.0
Total (7 Projects) 8,536 3,406 726
1) BOO : Build, Operate & Own 2) BOT : Build, Operate & Transfer
O B i
8/2/2019 Investor Presentation(Dec2011) ENG FV
http://slidepdf.com/reader/full/investor-presentationdec2011-eng-fv 21/24
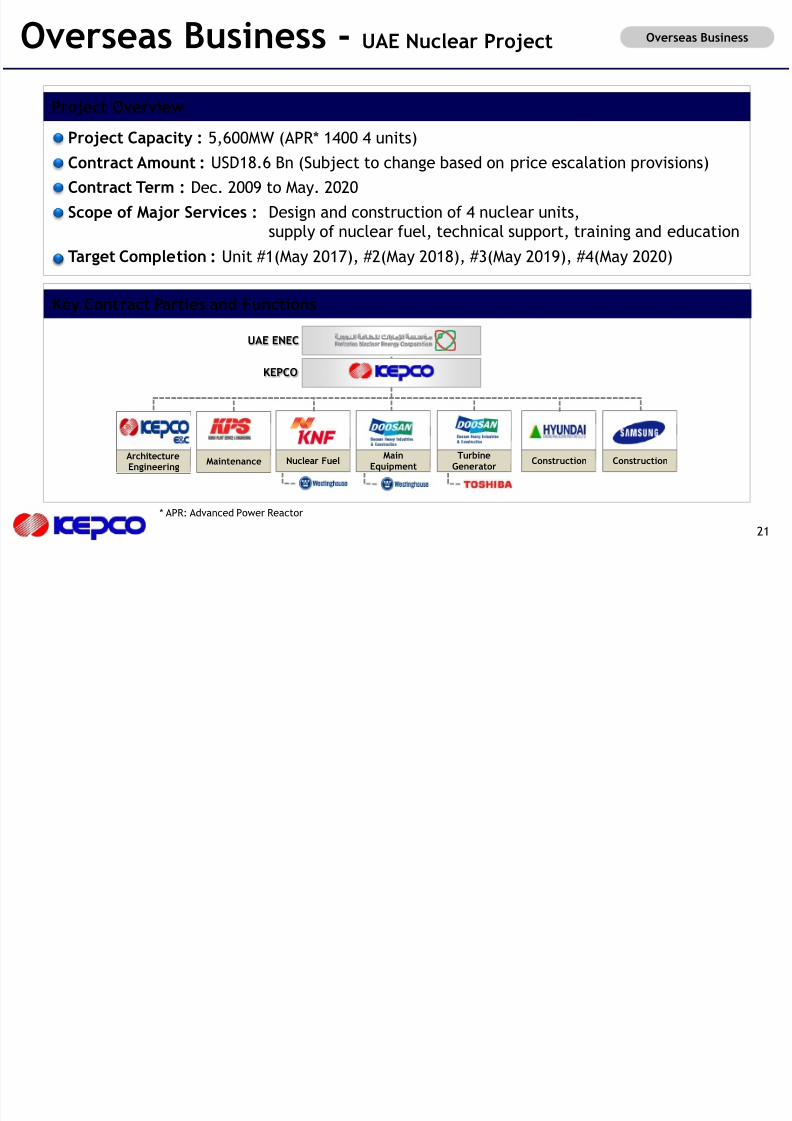
Key Contract Parties and Functions
Project Overview
Overseas Business - UAE Nuclear Project
Project Capacity : 5,600MW (APR* 1400 4 units)Contract Amount : USD18.6 Bn (Subject to change based on price escalation provisions)
Contract Term : Dec. 2009 to May. 2020
Scope of Major Services : Design and construction of 4 nuclear units,supply of nuclear fuel, technical support, training and education
Target Completion : Unit #1(May 2017), #2(May 2018), #3(May 2019), #4(May 2020)
ArchitectureEngineering
ConstructionConstructionTurbine
GeneratorMain
EquipmentNuclear FuelMaintenance
Overseas Business
* APR: Advanced Power Reactor
21
UAE ENEC
KEPCO
O B i
8/2/2019 Investor Presentation(Dec2011) ENG FV
http://slidepdf.com/reader/full/investor-presentationdec2011-eng-fv 22/24
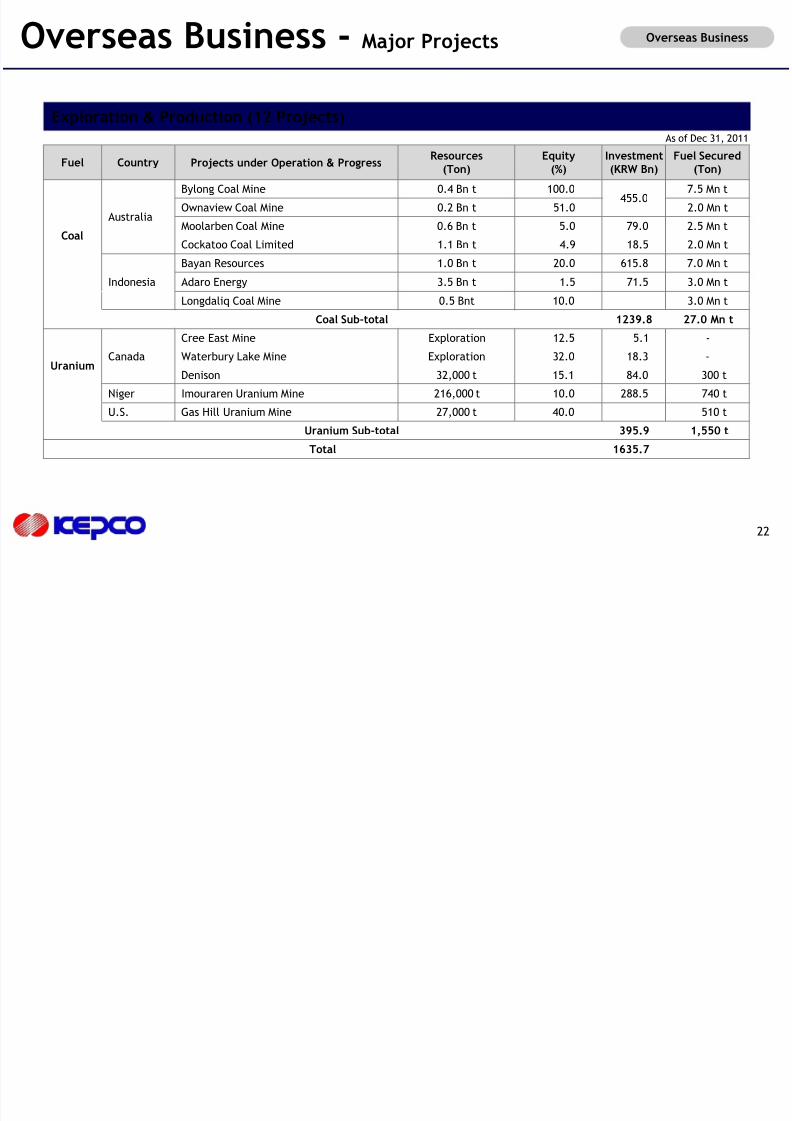
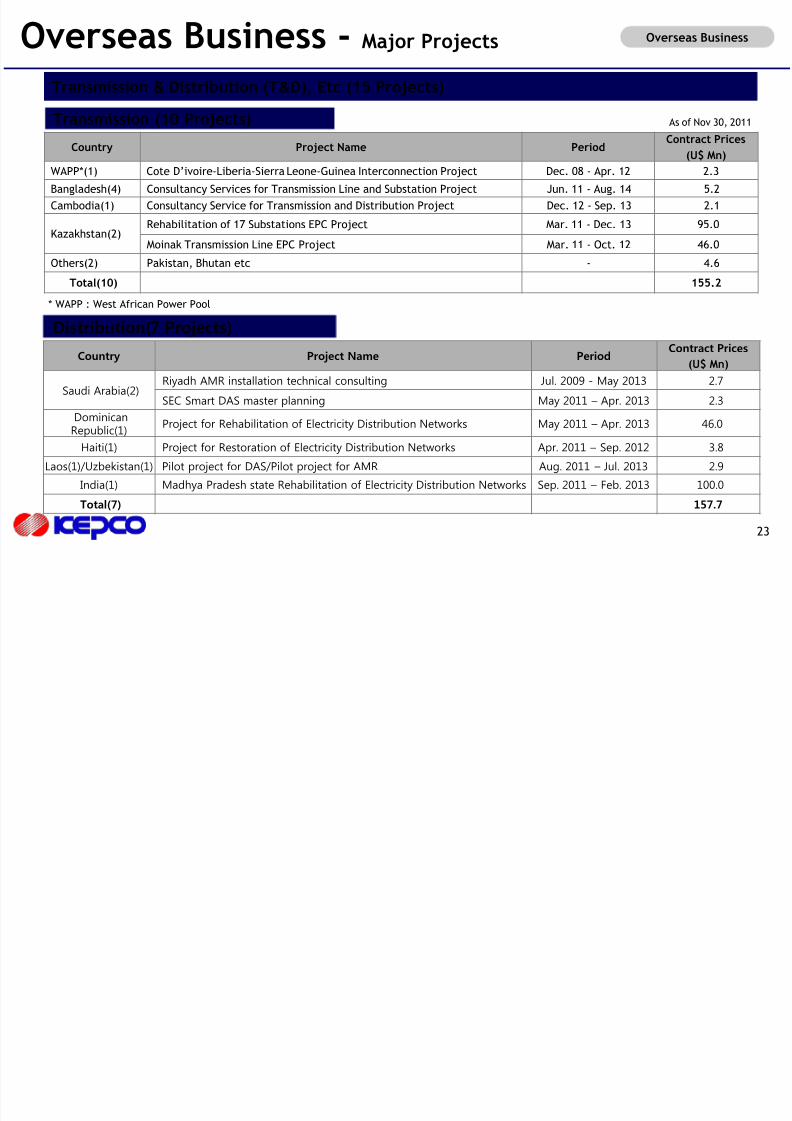
Overseas Business - Major Projects Overseas Business
22
Fuel Country Projects under Operation & ProgressResources
(Ton)Equity
(%)Investment(KRW Bn)
Fuel Secured(Ton)
Coal
Australia
Bylong Coal Mine 0.4 Bn t 100.0455.0
7.5 Mn t
Ownaview Coal Mine 0.2 Bn t 51.0 2.0 Mn t
Moolarben Coal Mine 0.6 Bn t 5.0 79.0 2.5 Mn t
Cockatoo Coal Limited 1.1 Bn t 4.9 18.5 2.0 Mn t
Indonesia
Bayan Resources 1.0 Bn t 20.0 615.8 7.0 Mn t
Adaro Energy 3.5 Bn t 1.5 71.5 3.0 Mn t
Longdaliq Coal Mine 0.5 Bnt 10.0 3.0 Mn t
Coal Sub-total 1239.8 27.0 Mn t
UraniumCanada
Cree East Mine Exploration 12.5 5.1 -
Waterbury Lake Mine Exploration 32.0 18.3 -
Denison 32,000 t 15.1 84.0 300 t
Niger Imouraren Uranium Mine 216,000 t 10.0 288.5 740 t
U.S. Gas Hill Uranium Mine 27,000 t 40.0 510 t
Uranium Sub-total 395.9 1,550 t
Total 1635.7
Exploration & Production (12 Projects)As of Dec 31, 2011
O B i
8/2/2019 Investor Presentation(Dec2011) ENG FV
http://slidepdf.com/reader/full/investor-presentationdec2011-eng-fv 23/24
Overseas Business - Major Projects Overseas Business
23
Transmission & Distribution (T&D), Etc (15 Projects)
As of Nov 30, 2011
Country Project Name Period Contract Prices(U$ Mn)
WAPP*(1) Cote D’ivoire-Liberia-Sierra Leone-Guinea Interconnection Project Dec. 08 - Apr. 12 2.3
Bangladesh(4) Consultancy Services for Transmission Line and Substation Project Jun. 11 - Aug. 14 5.2
Cambodia(1) Consultancy Service for Transmission and Distribution Project Dec. 12 - Sep. 13 2.1
Kazakhstan(2)Rehabilitation of 17 Substations EPC Project Mar. 11 - Dec. 13 95.0
Moinak Transmission Line EPC Project Mar. 11 - Oct. 12 46.0
Others(2) Pakistan, Bhutan etc - 4.6
Total(10) 155.2
Transmission (10 Projects)
* WAPP : West African Power Pool
Country Project Name PeriodContract Prices
(U$ Mn)
Saudi Arabia(2)Riyadh AMR installation technical consulting Jul. 2009 - May 2013 2.7
SEC Smart DAS master planning May 2011 – Apr. 2013 2.3
DominicanRepublic(1) Project for Rehabilitation of Electricity Distribution Networks May 2011–
Apr. 2013 46.0
Haiti(1) Project for Restoration of Electricity Distribution Networks Apr. 2011 – Sep. 2012 3.8
Laos(1)/Uzbekistan(1) Pilot project for DAS/Pilot project for AMR Aug. 2011 – Jul. 2013 2.9
India(1) Madhya Pradesh state Rehabilitation of Electricity Distribution Networks Sep. 2011 – Feb. 2013 100.0
Total(7) 157.7
Distribution(7 Projects)
* WAPP : West African Power Pool
Appendix
8/2/2019 Investor Presentation(Dec2011) ENG FV
http://slidepdf.com/reader/full/investor-presentationdec2011-eng-fv 24/24
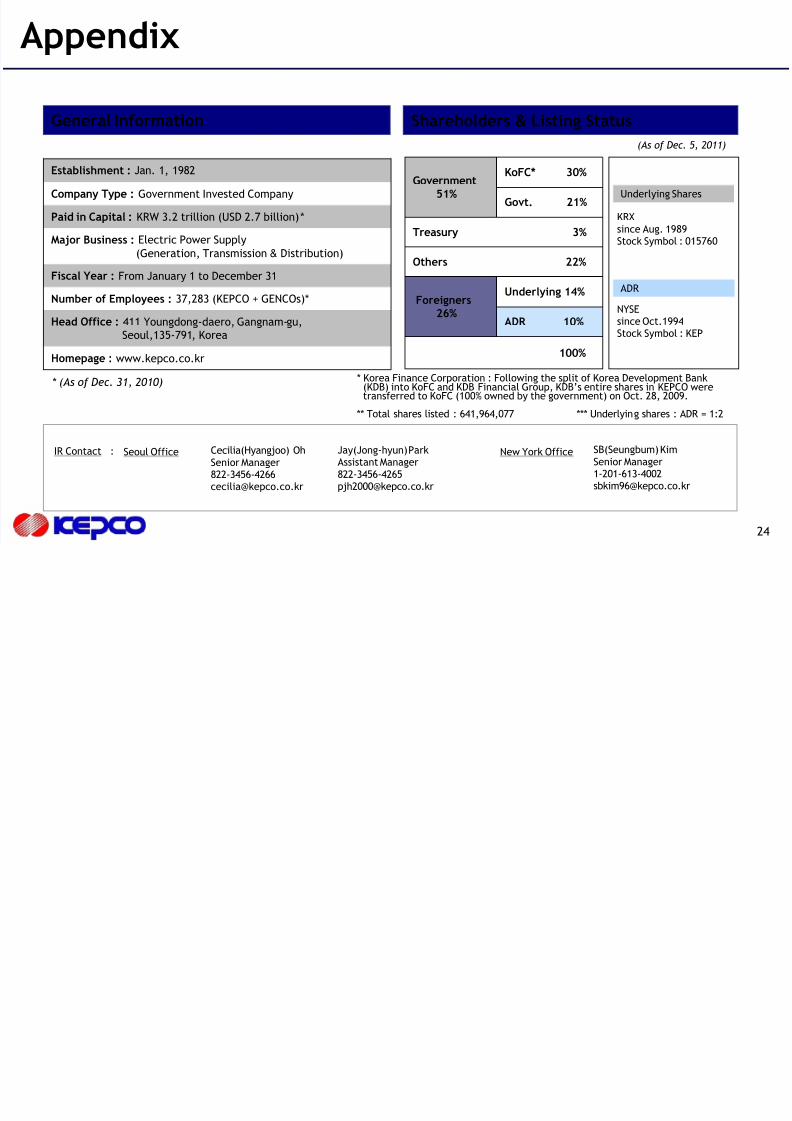
General Information
* (As of Dec. 31, 2010)
Establishment : Jan. 1, 1982
Company Type : Government Invested Company
Paid in Capital : KRW 3.2 trillion (USD 2.7 billion)*
Major Business : Electric Power Supply
(Generation, Transmission & Distribution)
Fiscal Year : From January 1 to December 31
Number of Employees : 37,283 (KEPCO + GENCOs)*
Head Office : 411 Youngdong-daero, Gangnam-gu,Seoul,135-791, Korea
Homepage : www.kepco.co.kr
Shareholders & Listing Status
** Total shares listed : 641,964,077 *** Underlying shares : ADR = 1:2
Government51%
KoFC* 30%
Govt. 21%
Treasury 3%
Others 22%
Foreigners26%
Underlying 14%
ADR 10%
100%
Underlying Shares
KRX
since Aug. 1989Stock Symbol : 015760
(As of Dec. 5, 2011)
ADR
NYSEsince Oct.1994Stock Symbol : KEP
* Korea Finance Corporation : Following the split of Korea Development Bank(KDB) into KoFC and KDB Financial Group, KDB’s entire shares in KEPCO were transferred to KoFC (100% owned by the government) on Oct. 28, 2009.
Appendix
24
SB(Seungbum) Kim
Senior [email protected]
Seoul Office Cecilia(Hyangjoo) Oh
Senior [email protected]
IR Contact : Jay(Jong-hyun) ParkAssistant Manager
New York Office