investor update 9m / q3-fy20 - hathway
TRANSCRIPT

1
Hathway Cable and Datacom Limited
Investor Update – 9M / Q3-FY20
2
The information contained in this presentation is only current as of its date. All actions and statements made herein or otherwise shall be subject to the applicable laws
and regulations as amended from time to time. There is no representation that all information relating to the context has been taken care off in the presentation and
neither we undertake any obligation as to the regular updating of the information as a result of new information, future events or otherwise. We will accept no liability
whatsoever for any loss arising directly or indirectly from the use of, reliance of any information contained in this presentation or for any omission of the information.
The information shall not be distributed or used by any person or entity in any jurisdiction or countries were such distribution or use would be contrary to the
applicable laws or Regulations. It is advised that prior to acting upon this presentation independent consultation / advise may be obtained and necessary due diligence,
investigation etc. may be done at your end. You may also contact us directly for any questions or clarifications at our end. This presentation contain certain statements
of future expectations and other forward-looking statements, including those relating to our general business plans and strategy, our future financial condition and
growth prospects, and future developments in our industry and our competitive and regulatory environment. In addition to statements which are forward looking by
reason of context, the words ‘may, will, should, expects, plans, intends, anticipates, believes, estimates, predicts, potential or continue and similar expressions identify
forward looking statements. Actual results, performances or events may differ materially from these forward-looking statements including the plans, objectives,
expectations, estimates and intentions expressed in forward looking statements due to a number of factors, including without limitation future changes or
developments in our business, our competitive environment, telecommunications technology and application, and political, economic, legal and social conditions in
India. It is cautioned that the foregoing list is not exhaustive This presentation is not being used in connection with any invitation of an offer or an offer of securities
and should not be used as a basis for any investment decision.
Safe Harbour
3
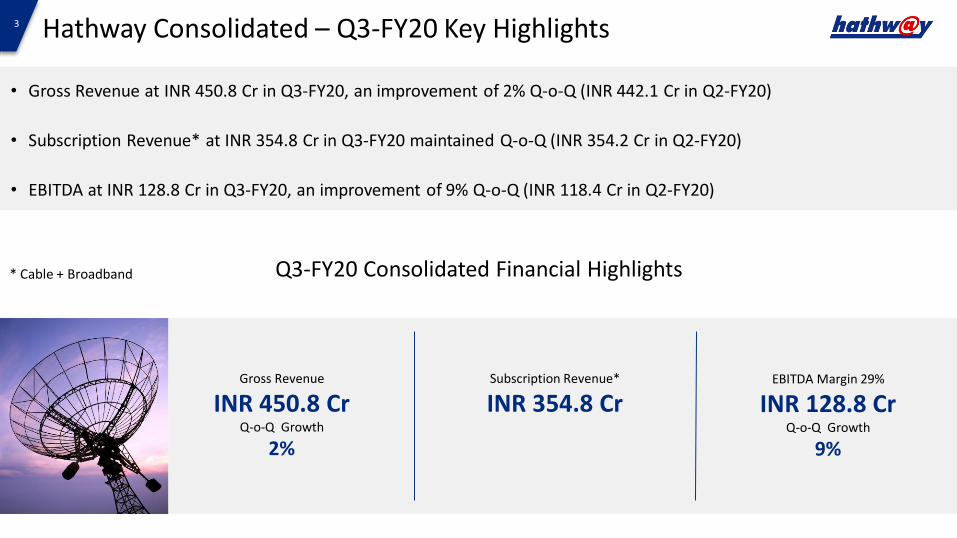
• Gross Revenue at INR 450.8 Cr in Q3-FY20, an improvement of 2% Q-o-Q (INR 442.1 Cr in Q2-FY20)
• Subscription Revenue* at INR 354.8 Cr in Q3-FY20 maintained Q-o-Q (INR 354.2 Cr in Q2-FY20)
• EBITDA at INR 128.8 Cr in Q3-FY20, an improvement of 9% Q-o-Q (INR 118.4 Cr in Q2-FY20)
Hathway Consolidated – Q3-FY20 Key Highlights
Gross Revenue
INR 450.8 CrQ-o-Q Growth
2%
Q3-FY20 Consolidated Financial Highlights
Subscription Revenue*
INR 354.8 CrEBITDA Margin 29%
INR 128.8 CrQ-o-Q Growth
9%
* Cable + Broadband
4
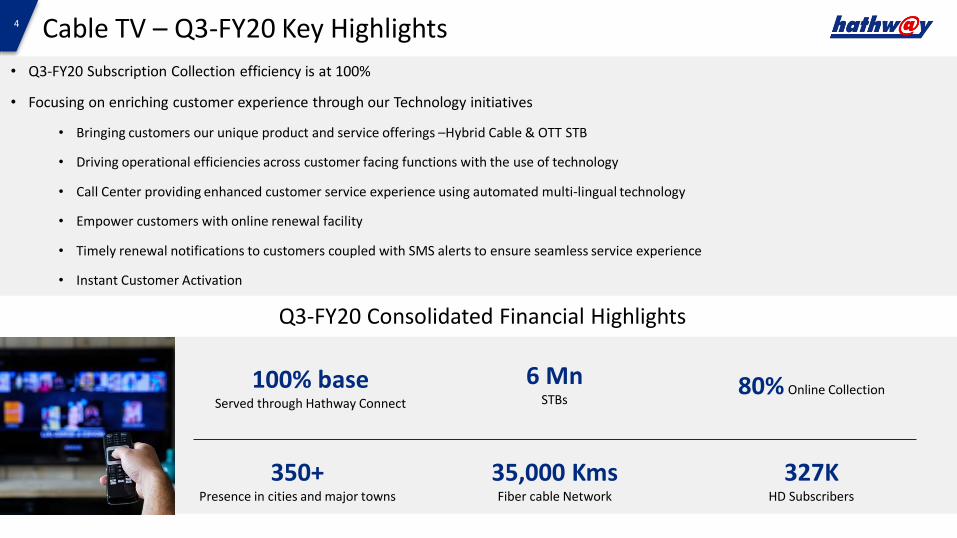
• Q3-FY20 Subscription Collection efficiency is at 100%
• Focusing on enriching customer experience through our Technology initiatives
• Bringing customers our unique product and service offerings –Hybrid Cable & OTT STB
• Driving operational efficiencies across customer facing functions with the use of technology
• Call Center providing enhanced customer service experience using automated multi-lingual technology
• Empower customers with online renewal facility
• Timely renewal notifications to customers coupled with SMS alerts to ensure seamless service experience
• Instant Customer Activation
Cable TV – Q3-FY20 Key Highlights
100% baseServed through Hathway Connect
6 MnSTBs
80% Online Collection
350+Presence in cities and major towns
35,000 KmsFiber cable Network
327KHD Subscribers
Q3-FY20 Consolidated Financial Highlights
5
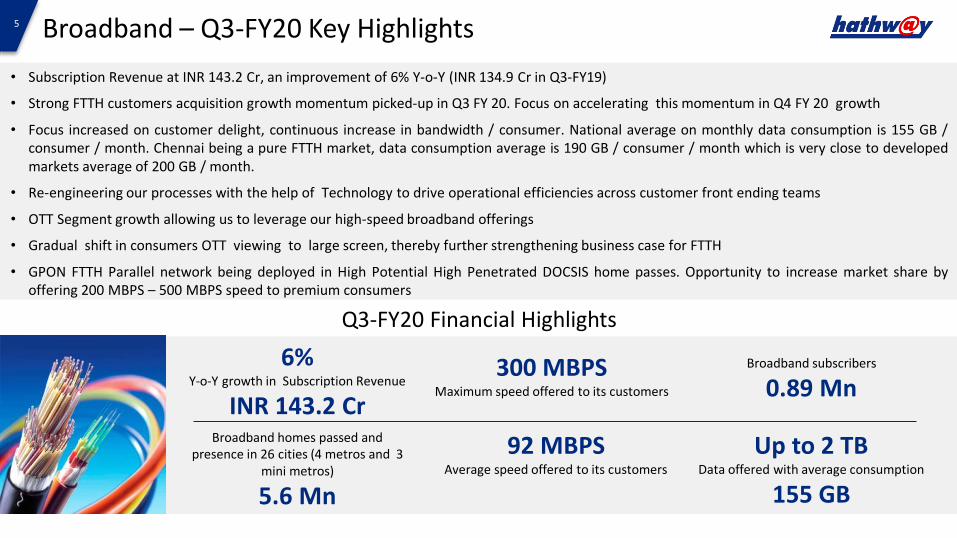
• Subscription Revenue at INR 143.2 Cr, an improvement of 6% Y-o-Y (INR 134.9 Cr in Q3-FY19)
• Strong FTTH customers acquisition growth momentum picked-up in Q3 FY 20. Focus on accelerating this momentum in Q4 FY 20 growth
• Focus increased on customer delight, continuous increase in bandwidth / consumer. National average on monthly data consumption is 155 GB /consumer / month. Chennai being a pure FTTH market, data consumption average is 190 GB / consumer / month which is very close to developedmarkets average of 200 GB / month.
• Re-engineering our processes with the help of Technology to drive operational efficiencies across customer front ending teams
• OTT Segment growth allowing us to leverage our high-speed broadband offerings
• Gradual shift in consumers OTT viewing to large screen, thereby further strengthening business case for FTTH
• GPON FTTH Parallel network being deployed in High Potential High Penetrated DOCSIS home passes. Opportunity to increase market share byoffering 200 MBPS – 500 MBPS speed to premium consumers
Broadband – Q3-FY20 Key Highlights
38%Y-o-Y growth in Subscription Revenue
INR 2,167 Mn
6 MnSTBs
100% baseServed through Hathway Connect
70% Online Collection
350+Presence in cities and major towns
35,000 KmsFiber cable Network
261KHD Subscribers
Q3-FY20 Financial Highlights
6%Y-o-Y growth in Subscription Revenue
INR 143.2 Cr
300 MBPSMaximum speed offered to its customers
Broadband subscribers
0.89 Mn
Broadband homes passed and presence in 26 cities (4 metros and 3
mini metros)
5.6 Mn
92 MBPSAverage speed offered to its customers
Up to 2 TBData offered with average consumption
155 GB
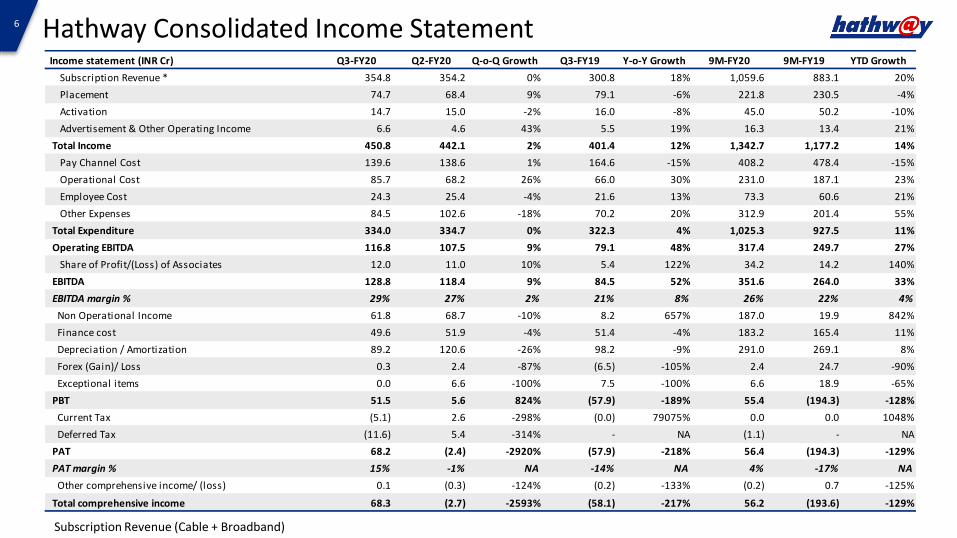
6 Hathway Consolidated Income Statement
Subscription Revenue (Cable + Broadband)
Income statement (INR Cr) Q3-FY20 Q2-FY20 Q-o-Q Growth Q3-FY19 Y-o-Y Growth 9M-FY20 9M-FY19 YTD Growth
Subscription Revenue * 354.8 354.2 0% 300.8 18% 1,059.6 883.1 20%
Placement 74.7 68.4 9% 79.1 -6% 221.8 230.5 -4%
Activation 14.7 15.0 -2% 16.0 -8% 45.0 50.2 -10%
Advertisement & Other Operating Income 6.6 4.6 43% 5.5 19% 16.3 13.4 21%
Total Income 450.8 442.1 2% 401.4 12% 1,342.7 1,177.2 14%
Pay Channel Cost 139.6 138.6 1% 164.6 -15% 408.2 478.4 -15%
Operational Cost 85.7 68.2 26% 66.0 30% 231.0 187.1 23%
Employee Cost 24.3 25.4 -4% 21.6 13% 73.3 60.6 21%
Other Expenses 84.5 102.6 -18% 70.2 20% 312.9 201.4 55%
Total Expenditure 334.0 334.7 0% 322.3 4% 1,025.3 927.5 11%
Operating EBITDA 116.8 107.5 9% 79.1 48% 317.4 249.7 27%
Share of Profit/(Loss) of Associates 12.0 11.0 10% 5.4 122% 34.2 14.2 140%
EBITDA 128.8 118.4 9% 84.5 52% 351.6 264.0 33%
EBITDA margin % 29% 27% 2% 21% 8% 26% 22% 4%
Non Operational Income 61.8 68.7 -10% 8.2 657% 187.0 19.9 842%
Finance cost 49.6 51.9 -4% 51.4 -4% 183.2 165.4 11%
Depreciation / Amortization 89.2 120.6 -26% 98.2 -9% 291.0 269.1 8%
Forex (Gain)/ Loss 0.3 2.4 -87% (6.5) -105% 2.4 24.7 -90%
Exceptional items 0.0 6.6 -100% 7.5 -100% 6.6 18.9 -65%
PBT 51.5 5.6 824% (57.9) -189% 55.4 (194.3) -128%
Current Tax (5.1) 2.6 -298% (0.0) 79075% 0.0 0.0 1048%
Deferred Tax (11.6) 5.4 -314% - NA (1.1) - NA
PAT 68.2 (2.4) -2920% (57.9) -218% 56.4 (194.3) -129%
PAT margin % 15% -1% NA -14% NA 4% -17% NA
Other comprehensive income/ (loss) 0.1 (0.3) -124% (0.2) -133% (0.2) 0.7 -125%
Total comprehensive income 68.3 (2.7) -2593% (58.1) -217% 56.2 (193.6) -129%
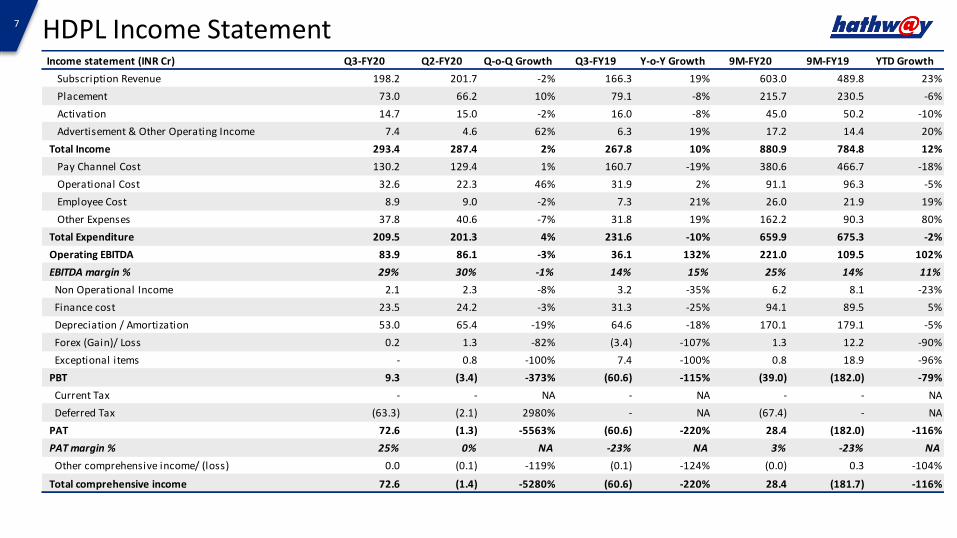
7 HDPL Income Statement Income statement (INR Cr) Q3-FY20 Q2-FY20 Q-o-Q Growth Q3-FY19 Y-o-Y Growth 9M-FY20 9M-FY19 YTD Growth
Subscription Revenue 198.2 201.7 -2% 166.3 19% 603.0 489.8 23%
Placement 73.0 66.2 10% 79.1 -8% 215.7 230.5 -6%
Activation 14.7 15.0 -2% 16.0 -8% 45.0 50.2 -10%
Advertisement & Other Operating Income 7.4 4.6 62% 6.3 19% 17.2 14.4 20%
Total Income 293.4 287.4 2% 267.8 10% 880.9 784.8 12%
Pay Channel Cost 130.2 129.4 1% 160.7 -19% 380.6 466.7 -18%
Operational Cost 32.6 22.3 46% 31.9 2% 91.1 96.3 -5%
Employee Cost 8.9 9.0 -2% 7.3 21% 26.0 21.9 19%
Other Expenses 37.8 40.6 -7% 31.8 19% 162.2 90.3 80%
Total Expenditure 209.5 201.3 4% 231.6 -10% 659.9 675.3 -2%
Operating EBITDA 83.9 86.1 -3% 36.1 132% 221.0 109.5 102%
EBITDA margin % 29% 30% -1% 14% 15% 25% 14% 11%
Non Operational Income 2.1 2.3 -8% 3.2 -35% 6.2 8.1 -23%
Finance cost 23.5 24.2 -3% 31.3 -25% 94.1 89.5 5%
Depreciation / Amortization 53.0 65.4 -19% 64.6 -18% 170.1 179.1 -5%
Forex (Gain)/ Loss 0.2 1.3 -82% (3.4) -107% 1.3 12.2 -90%
Exceptional items - 0.8 -100% 7.4 -100% 0.8 18.9 -96%
PBT 9.3 (3.4) -373% (60.6) -115% (39.0) (182.0) -79%
Current Tax - - NA - NA - - NA
Deferred Tax (63.3) (2.1) 2980% - NA (67.4) - NA
PAT 72.6 (1.3) -5563% (60.6) -220% 28.4 (182.0) -116%
PAT margin % 25% 0% NA -23% NA 3% -23% NA
Other comprehensive income/ (loss) 0.0 (0.1) -119% (0.1) -124% (0.0) 0.3 -104%
Total comprehensive income 72.6 (1.4) -5280% (60.6) -220% 28.4 (181.7) -116%
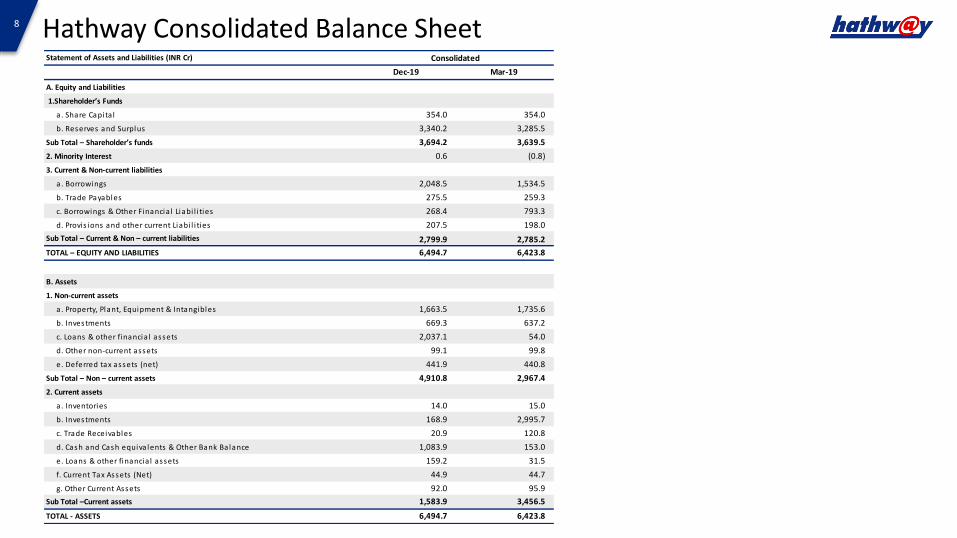
8 Hathway Consolidated Balance SheetStatement of Assets and Liabilities (INR Cr)
Dec-19 Mar-19
A. Equity and Liabilities
1.Shareholder’s Funds
a . Share Capita l 354.0 354.0
b. Reserves and Surplus 3,340.2 3,285.5
Sub Total – Shareholder’s funds 3,694.2 3,639.5
2. Minority Interest 0.6 (0.8)
3. Current & Non-current liabilities
a . Borrowings 2,048.5 1,534.5
b. Trade Payables 275.5 259.3
c. Borrowings & Other Financia l Liabi l i ties 268.4 793.3
d. Provis ions and other current Liabi l i ties 207.5 198.0
Sub Total – Current & Non – current liabilities 2,799.9 2,785.2
TOTAL – EQUITY AND LIABILITIES 6,494.7 6,423.8
B. Assets
1. Non-current assets
a . Property, Plant, Equipment & Intangibles 1,663.5 1,735.6
b. Investments 669.3 637.2
c. Loans & other financia l assets 2,037.1 54.0
d. Other non-current assets 99.1 99.8
e. Deferred tax assets (net) 441.9 440.8
Sub Total – Non – current assets 4,910.8 2,967.4
2. Current assets
a . Inventories 14.0 15.0
b. Investments 168.9 2,995.7
c. Trade Receivables 20.9 120.8
d. Cash and Cash equiva lents & Other Bank Balance 1,083.9 153.0
e. Loans & other financia l assets 159.2 31.5
f. Current Tax Assets (Net) 44.9 44.7
g. Other Current Assets 92.0 95.9
Sub Total –Current assets 1,583.9 3,456.5
TOTAL - ASSETS 6,494.7 6,423.8
Consolidated
9
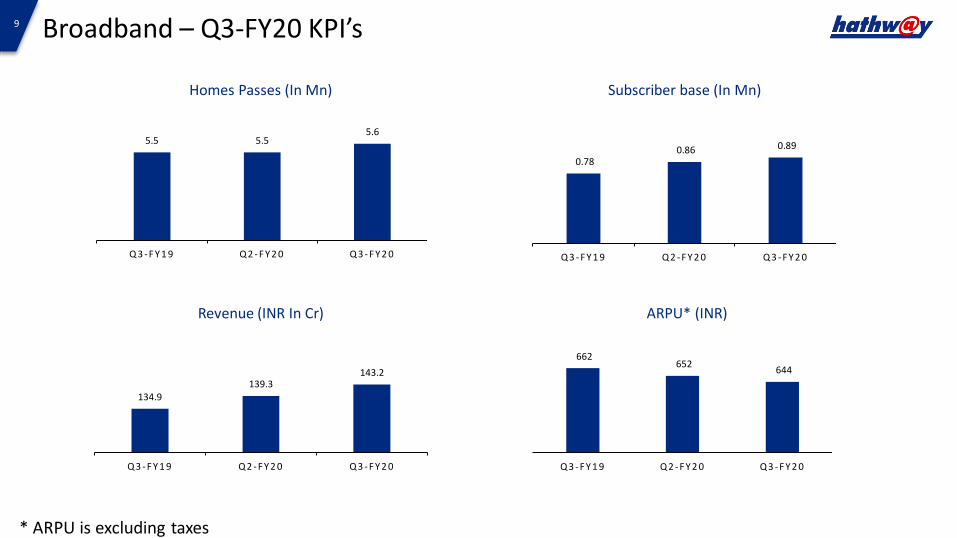
* ARPU is excluding taxes
Broadband – Q3-FY20 KPI’s
Subscriber base (In Mn)
ARPU* (INR)
0.78 0.86 0.89
Q 3 - F Y 1 9 Q 2 - F Y 2 0 Q 3 - F Y 2 0
662 652
644
Q 3 - F Y 1 9 Q 2 - F Y 2 0 Q 3 - F Y 2 0
Homes Passes (In Mn)
134.9139.3
143.2
Q 3 - F Y 1 9 Q 2 - F Y 2 0 Q 3 - F Y 2 0
5.5 5.55.6
Q 3 - F Y 1 9 Q 2 - F Y 2 0 Q 3 - F Y 2 0
Revenue (INR In Cr)
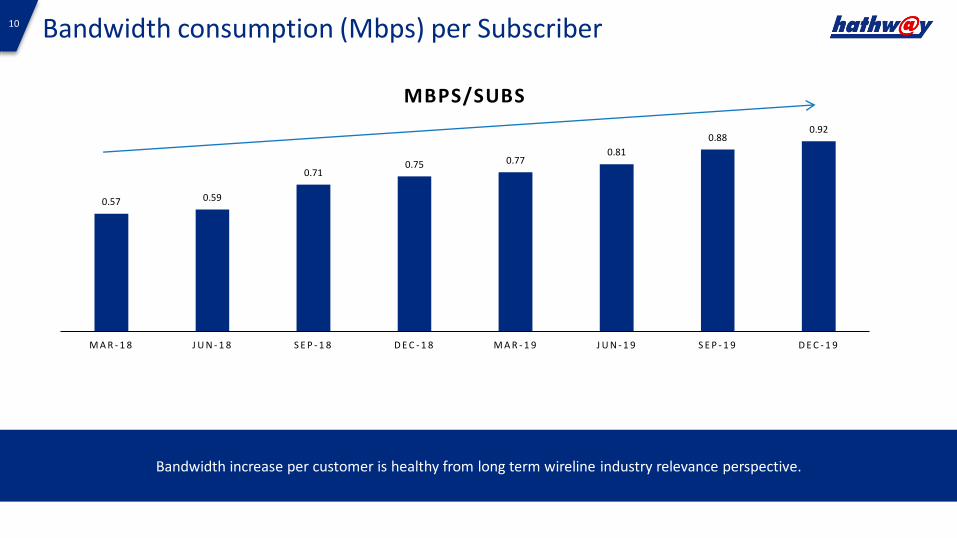
10 Bandwidth consumption (Mbps) per Subscriber
Bandwidth increase per customer is healthy from long term wireline industry relevance perspective.
0.57 0.59
0.710.75 0.77
0.81
0.880.92
M A R - 1 8 J U N - 1 8 S E P - 1 8 D E C - 1 8 M A R - 1 9 J U N - 1 9 S E P - 1 9 D E C - 1 9
MBPS/SUBS
11
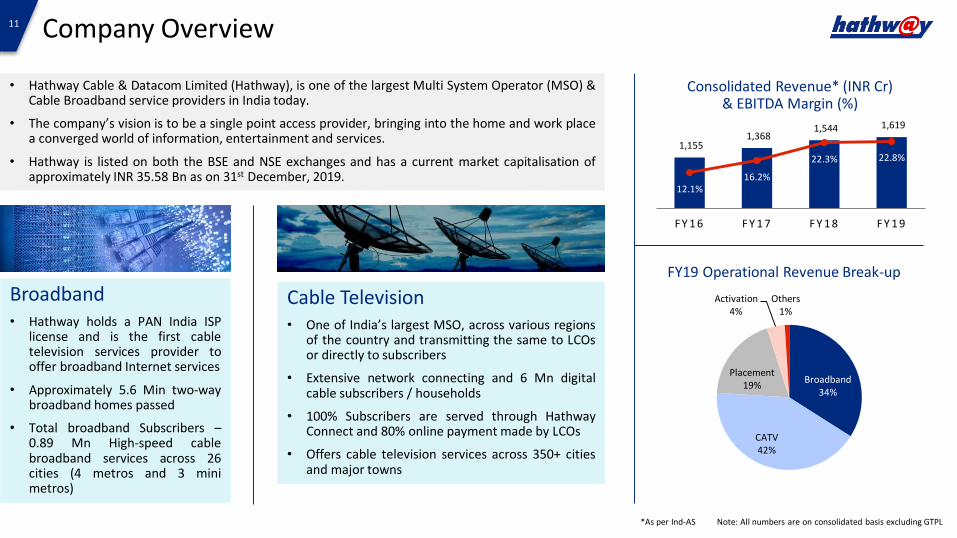
FY19 Operational Revenue Break-up
• Hathway Cable & Datacom Limited (Hathway), is one of the largest Multi System Operator (MSO) &Cable Broadband service providers in India today.
• The company’s vision is to be a single point access provider, bringing into the home and work placea converged world of information, entertainment and services.
• Hathway is listed on both the BSE and NSE exchanges and has a current market capitalisation ofapproximately INR 35.58 Bn as on 31st December, 2019.
Broadband• Hathway holds a PAN India ISP
license and is the first cabletelevision services provider tooffer broadband Internet services
• Approximately 5.6 Min two-waybroadband homes passed
• Total broadband Subscribers –0.89 Mn High-speed cablebroadband services across 26cities (4 metros and 3 minimetros)
Cable Television• One of India’s largest MSO, across various regions
of the country and transmitting the same to LCOsor directly to subscribers
• Extensive network connecting and 6 Mn digitalcable subscribers / households
• 100% Subscribers are served through HathwayConnect and 80% online payment made by LCOs
• Offers cable television services across 350+ citiesand major towns
*As per Ind-AS
1,155 1,368
1,544 1,619
12.1%16.2%
22.3% 22.8%
F Y 1 6 F Y 1 7 F Y 1 8 F Y 1 9
Note: All numbers are on consolidated basis excluding GTPL
Broadband34%
CATV42%
Placement19%
Activation4%
Others1%
Company Overview
Consolidated Revenue* (INR Cr) & EBITDA Margin (%)
12
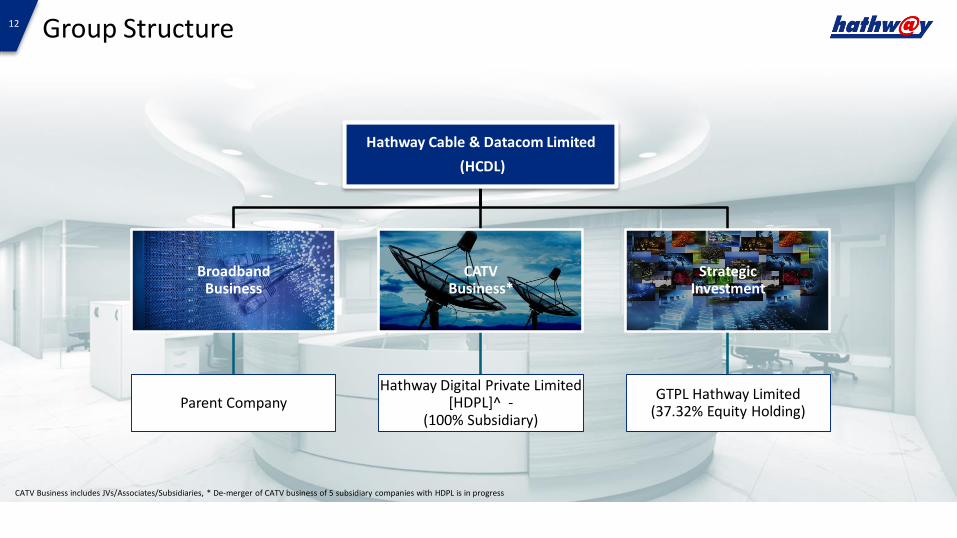
CATV Business includes JVs/Associates/Subsidiaries, * De-merger of CATV business of 5 subsidiary companies with HDPL is in progress
Group Structure
Hathway Cable & Datacom Limited
(HCDL)
Broadband Business
Parent Company
CATV Business*
Hathway Digital Private Limited [HDPL]^ -
(100% Subsidiary)
Strategic Investment
GTPL Hathway Limited (37.32% Equity Holding)
13
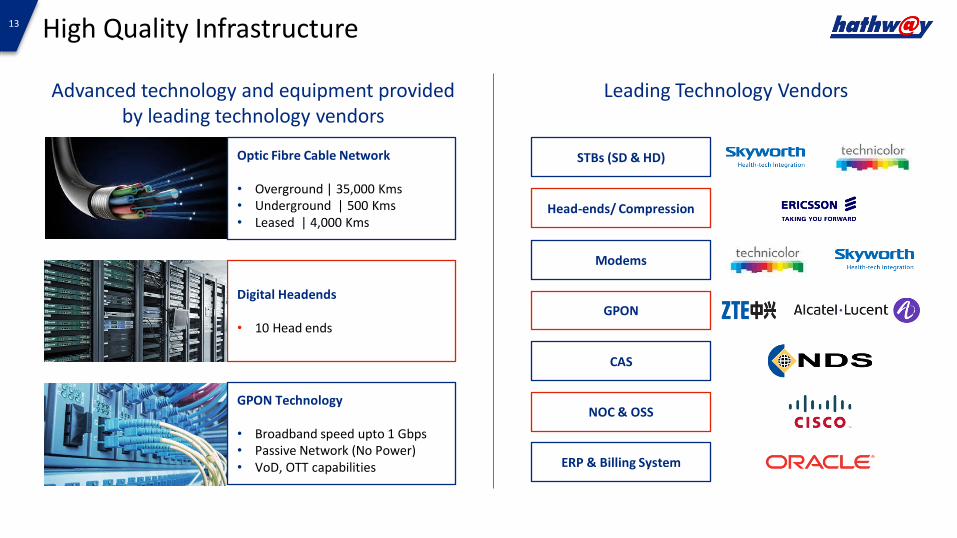
Leading Technology Vendors
Digital Headends
• 10 Head ends
High Quality Infrastructure
Advanced technology and equipment provided by leading technology vendors
CAS
NOC & OSS
ERP & Billing System
GPON
Head-ends/ Compression
Modems
STBs (SD & HD)Optic Fibre Cable Network
• Overground | 35,000 Kms• Underground | 500 Kms• Leased | 4,000 Kms
GPON Technology
• Broadband speed upto 1 Gbps• Passive Network (No Power)• VoD, OTT capabilities
14
Hathway Cable and Datacom Ltd Disclaimer:
The information contained in this presentation is only current as of its date. All actions and statements made herein or otherwise shall be subject to the applicable laws and regulations as amended from time totime. There is no representation that all information relating to the context has been taken care off in the presentation and neither we undertake any obligation as to the regular updating of the information as aresult of new information, future events or otherwise. We will accept no liability whatsoever for any loss arising directly or indirectly from the use of, reliance of any information contained in this presentation orfor any omission of the information. The information shall not be distributed or used by any person or entity in any jurisdiction or countries were such distribution or use would be contrary to the applicable lawsor Regulations. It is advised that prior to acting upon this presentation independent consultation / advise may be obtained and necessary due diligence, investigation etc may be done at your end. You may alsocontact us directly for any questions or clarifications at our end. This presentation contain certain statements of future expectations and other forward-looking statements, including those relating to our generalbusiness plans and strategy, our future financial condition and growth prospects, and future developments in our industry and our competitive and regulatory environment. In addition to statements which areforward looking by reason of context, the words ‘may, will, should, expects, plans, intends, anticipates, believes, estimates, predicts, potential or continue and similar expressions identify forward lookingstatements. Actual results, performances or events may differ materially from these forward-looking statements including the plans, objectives, expectations, estimates and intentions expressed in forwardlooking statements due to a number of factors, including without limitation future changes or developments in our business, our competitive environment, telecommunications technology and application, andpolitical, economic, legal and social conditions in India. It is cautioned that the foregoing list is not exhaustive This presentation is not being used in connection with any invitation of an offer or an offer ofsecurities and should not be used as a basis for any investment decision
Valorem Advisors Disclaimer:
Valorem Advisors is an Independent Investor Relations Management Service company. This Presentation has been prepared by Valorem Advisors based on information and data which the Company considersreliable, but Valorem Advisors and the Company makes no representation or warranty, express or implied, whatsoever, and no reliance shall be placed on, the truth, accuracy, completeness, fairness andreasonableness of the contents of this Presentation. This Presentation may not be all inclusive and may not contain all of the information that you may consider material. Any liability in respect of the contents of,or any omission from, this Presentation is expressly excluded. Valorem Advisors also hereby certifies that the directors or employees of Valorem Advisors do not own any stock in personal or company capacity ofthe Company under review.
For further details, please feel free to contact our Investor Relations Representatives:
Mr. Anuj SonpalValorem AdvisorsTel: +91-22-4903 9500Email: [email protected]
Disclaimer

15