investor update · forward looking statement 1 certain of the statements made in this presentation...
TRANSCRIPT

Investor Update
September 2016

Forward Looking Statement
1
Certain of the statements made in this Presentation may contain forward-looking statements or information within the meaning of the United States Private Securities Litigation Reform Act of 1995 and applicable Canadian securities laws. Often, but not always, forward-looking statements and forward-looking information can be identified by the use of words such as "plans", “targets”, “targeted”, "expects", "is expected", "budget", "scheduled", "estimates", "forecasts", "intends", "anticipates", or "believes" or the negatives thereof or variations of such words and phrases or statements that certain actions, events or results "may", "could", "would", "might" or "will" be taken, occur or be achieved. Forward-looking statements or information in this Presentation include, but are not limited to the proposed use of the funds anticipated from the sale of the Company’s Chinese assets, information with respect to our strategy, plans, goals and outlook for our properties, including expansions and production, our future financial and operating performance and targets, and our proposed mine development and exploration and other events.
Forward-looking statements and forward-looking information by their nature are based on assumptions and involve known and unknown risks, uncertainties and other factors which may cause the actual results, performance or achievements of the Company to be materially different from any future results, performance or achievements expressed or implied by such forward-looking statements or information. We have made certain assumptions about the forward-looking statements and information, including assumptions about closing of both Chinese sale transactions, including liability and timing of meeting the closing conditions, the political and economic environment that we operate in, the future price of commodities, anticipated costs and expenses and impact of the disposition on the business. Even though our management believes that the assumptions made and the expectations represented by such statements or information are reasonable, there can be no assurance that the forward-looking statement or information will prove to be accurate. Furthermore, should one or more of the risks, uncertainties or other factors materialize, or should underlying assumptions prove incorrect, actual results may vary materially from those described in forward-looking statements or information. These risks, uncertainties and other factors include, among others, the following: closing of the transactions not occurring or delayed, political, economic, environmental and permitting risks, gold price volatility, discrepancies between actual and estimated production, estimated mineral reserves and resources and metallurgical recoveries, mining operational and development risks, litigation risks, regulatory restrictions, including environmental and permitting regulatory restrictions and liabilities, internal and external approval risks, risks of sovereign investment, risks related to advancing the Chinese monetization process, currency fluctuations, speculative nature of gold exploration, global economic climate, dilution, share price volatility, competition, loss of key employees, additional funding requirements, and defective title to mineral claims or property, as well as those factors discussed in the sections entitled “Forward-Looking Statements” and "Risk Factors" in the Company's Annual Information Form & Form 40-F dated March 30, 2016.
There can be no assurance that forward-looking statements or information will prove to be accurate, as actual results and future events could differ materially from those anticipated in such statements. Accordingly, you should not place undue reliance on the forward-looking statements or information contained herein. Except as required by law, we do not expect to update forward-looking statements and information continually as conditions change and you are referred to the full discussion of the Company's business contained in the Company's reports filed with the securities regulatory authorities in Canada and the U.S.
All forward-looking statements and information contained in this Presentation are qualified by this cautionary statement.
Cautionary Note to U.S. Investors: Mineral Reserves and Mineral Resources - The terms "mineral reserve", "proven mineral reserve" and "probable mineral reserve" referred to in the Company's disclosure are Canadian mining terms as defined in accordance with National Instrument 43-101 - Standards of Disclosure for Mineral Projects under the guidelines set out in the Canadian Institute of Mining, Metallurgy and Petroleum (the "CIM") Standards on Mineral Resources and Mineral Reserves, adopted by the CIM Council as amended from time to time by the CIM. These definitions differ from the definitions in the United States Securities & Exchange Commission ("SEC") Guide 7. Under SEC Guide 7 standards, a “final” or “bankable” feasibility study is required to report reserves, the three-year historic average price is used in any reserve or cash flow analysis to designate reserves and the primary environmental analysis or report must be filed with the appropriate governmental authority.
The terms "mineral resource", "measured mineral resource", "indicated mineral resource", "inferred mineral resource" used in the Company's disclosure are Canadian mining terms used in accordance with National Instrument 43-101 - Standards of Disclosure for Mineral Projects under the guidelines set out in the CIM Standards. Mineral resources which are not mineral reserves do not have demonstrated economic viability.
While the terms "mineral resource", "measured mineral resource," "indicated mineral resource", and "inferred mineral resource" are recognized and required by Canadian regulations, they are not defined terms under standards in the United States and normally are not permitted to be used in reports and registration statements filed with the SEC. As such, information contained in the Company's disclosure concerning descriptions of mineralization and resources under Canadian standards may not be comparable to similar information made public by U.S companies in SEC filings. With respect to "inferred mineral resource" there is a great amount of uncertainty as to their existence and a great uncertainty as to their economic and legal feasibility. It cannot be assumed that all or any part of an "inferred mineral resource" will ever be upgraded to a higher category. Investors are cautioned not to assume that any part or all of mineral deposits in these categories will ever be converted into reserves.
Paul Skayman, Chief Operating Officer of Eldorado Gold Corporation, is the “Qualified Person” for the purposes of National Instrument 43-101 - Standards of Disclosure for Mineral Projects of the Canadian Securities Administrators who has reviewed, approved and verified the scientific and technical information in this Presentation.

Four Pillars of Our Strategy
2
• Doing business honestly
• Minimizing
environmental impacts
• Keeping our
people safe
• Investing in building
communities
• Invest in new
technologies and work
with industry groups
• Reduce risk
• Operate to guidance
• Focus on balance
sheet strength
• Consider all competing
uses of cash
• Prioritize capital for
sustaining operations
and developing
key projects
• Portfolio of long-life,
low-cost assets
• Prospective jurisdictions
Quality Assets Capital DisciplineOperational Excellence Accountability

x3 projects in evaluation/development
x2 projects in construction
x3 operating mines
Quality Assets
3
Europe South America

Robust Organic Growth Pipeline
4
2017
2020Future
Organic
Growth
0
100
200
300
400
500
600
700
800
900
1000
200 300 400 500 600 700 800 900 1,000 1,100 1,200 1,300
AIS
C (
US$
/oz)
Gold Production (Koz)
Forecast Gold Production & AISC
Gold Production+110% Gold
Production+35%
+ Olympias Phase II+ Kisladag Expansion
+ Skouries+ Tocantinzinho
+ Olympias Phase III+ Certej+ Perama Hill
◦ Kisladag◦ Efemcukuru◦ Olympias Phase II
(start-up)
0
5
10
15
20
25
30
ELD (ex China) Peer Group
# o
f Y
ea
rs o
f O
pe
rati
on
5
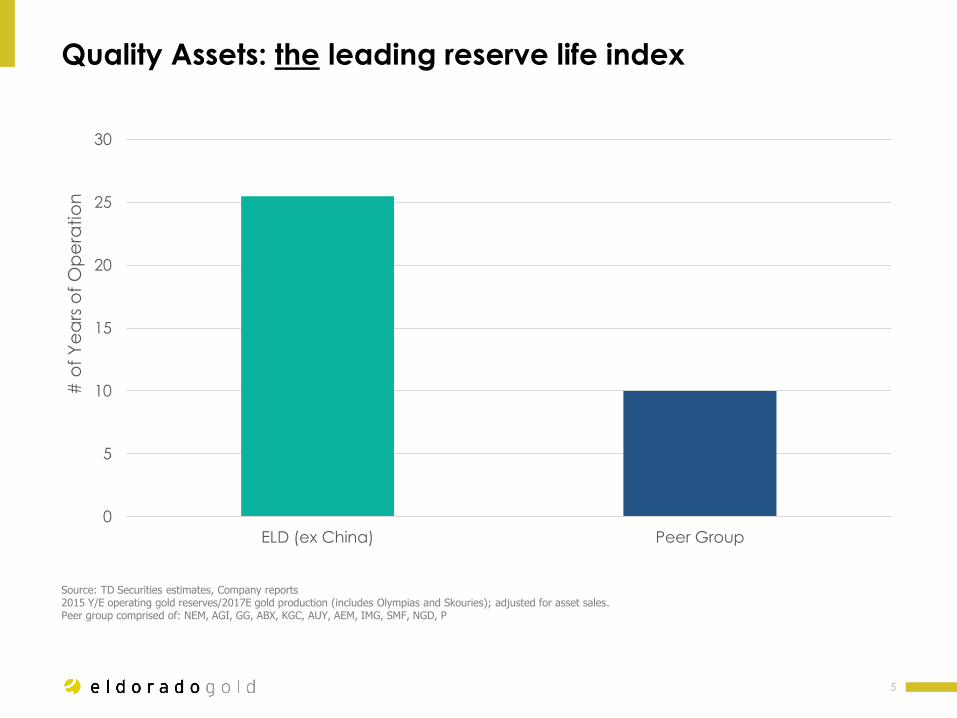
Quality Assets: the leading reserve life index
Source: TD Securities estimates, Company reports2015 Y/E operating gold reserves/2017E gold production (includes Olympias and Skouries); adjusted for asset sales.Peer group comprised of: NEM, AGI, GG, ABX, KGC, AUY, AEM, IMG, SMF, NGD, P
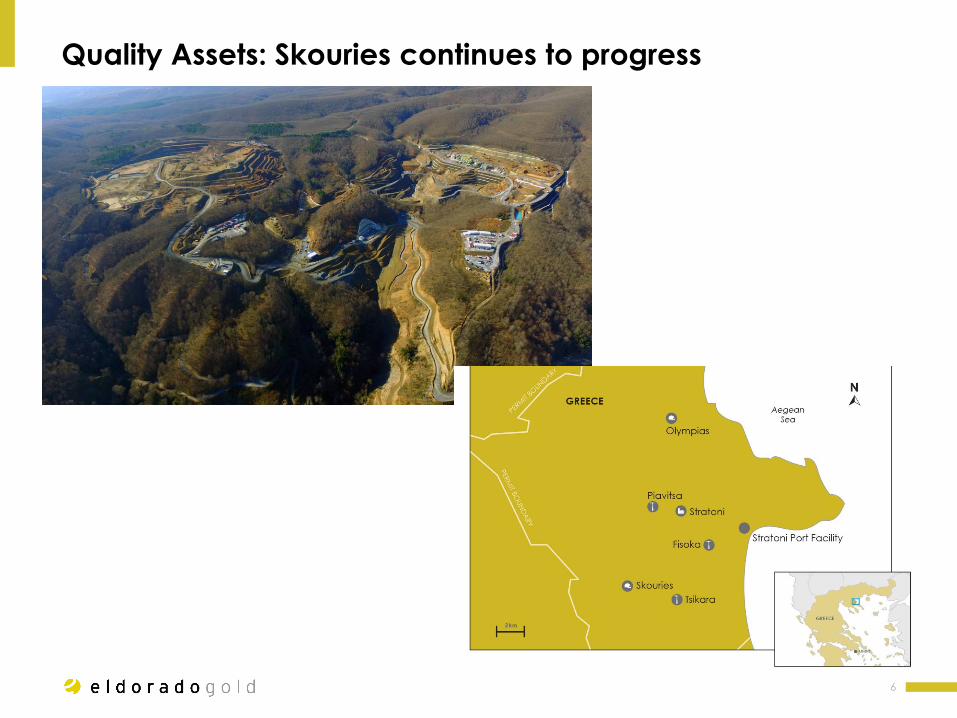
Quality Assets: Skouries continues to progress
6
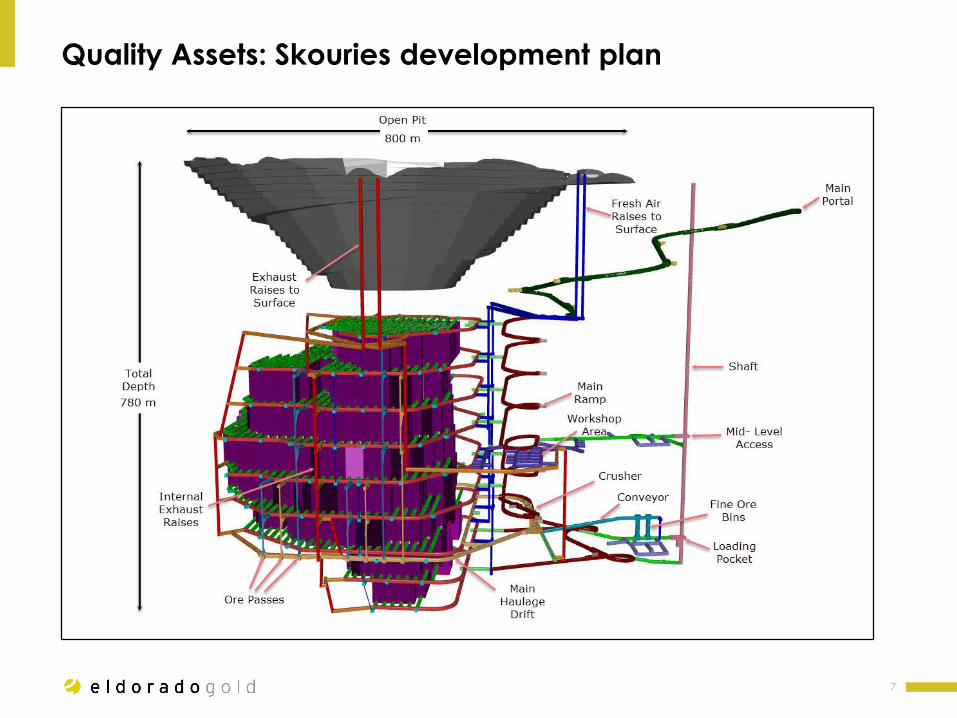
Quality Assets: Skouries development plan
7

Quality Assets: Skouries indicative LOM summary
8
*C2 + sustaining capital**Consists of $540 M cost to completion + $170 M Phase 1 UG development
Parameter Phase 1 Phase 2 LOM
Period 2019-2027 2028-2042 2019-2042
Years 9 15 24
Tonnes milled 69.5 Mt 91.3 Mt 160.8 Mt
Au grade 0.80 g/t 0.71 g/t 0.75 g/t
Cu grade 0.49% 0.50% 0.49%
AuEq grade 1.53 g/t 1.46 g/t 1.49 g/t
Gold recovery 82.0% 82.0% 82.0%
Copper recovery 87.5% 87.5% 87.5%
Gold produced 1.4 Moz 1.7 Moz 3.1 Moz
Copper produced 620 Mlbs 850 Mlbs 1,470 Mlbs
Gold equivalent produced 2.8 Moz 3.6 Moz 6.4 Moz
Operating Cost (w TC/RC) $16.40/t $25.90/t $21.80/t
C1 - Operating Cash Cost ($255/oz) $165/oz ($30/oz)
C2 - Total Cash Cost (w royalties) ($225/oz) $195/oz $0/oz
Sustaining Cash Cost* ($105/oz) $365/oz $150/oz
Total development capex $710M** $460M $1,170M
Total sustaining capex $175M $285M $460M
Net after-tax cashflow $435M $1.4B $1.8B
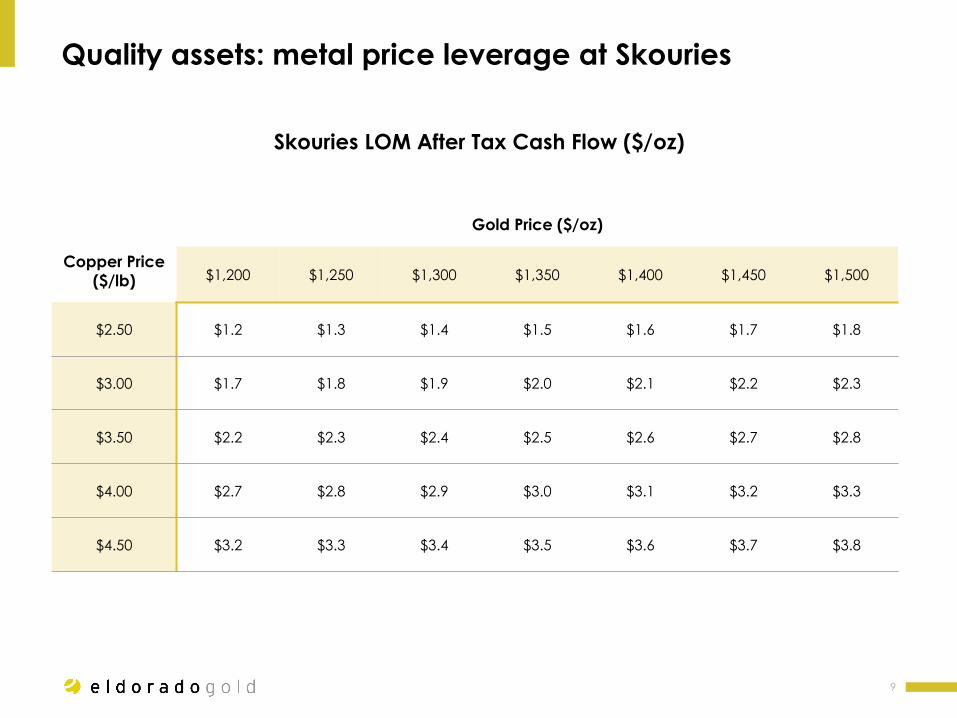
Quality assets: metal price leverage at Skouries
9
Gold Price ($/oz)
Copper Price
($/lb) $1,200 $1,250 $1,300 $1,350 $1,400 $1,450 $1,500
$2.50 $1.2 $1.3 $1.4 $1.5 $1.6 $1.7 $1.8
$3.00 $1.7 $1.8 $1.9 $2.0 $2.1 $2.2 $2.3
$3.50 $2.2 $2.3 $2.4 $2.5 $2.6 $2.7 $2.8
$4.00 $2.7 $2.8 $2.9 $3.0 $3.1 $3.2 $3.3
$4.50 $3.2 $3.3 $3.4 $3.5 $3.6 $3.7 $3.8
Skouries LOM After Tax Cash Flow ($/oz)

Olympias: Timeline
10
Phase 1
Phase 2ROM Au /
Ag / Pb / Zn
Phase 3ROM Au / Ag
/ Pb / Zn
~2022 - 2025
2017
2013 2017
Phase 1 – tails retreatment
~20,000 oz Au/yr
Develop Phase 2 above 260 level,
UG refurbishment, TMF, process
plant construction
Development for P3, mine below
260 level, process plant design &
construction
Reclaim Olympias Valley
Phase 2 production ~72,000 oz Au/yr
+ ~55,000 oz AuEqReclaim Olympias Plant Site
Phase 3 Production ~170,000
Au oz/yr + ~130,000 AuEq
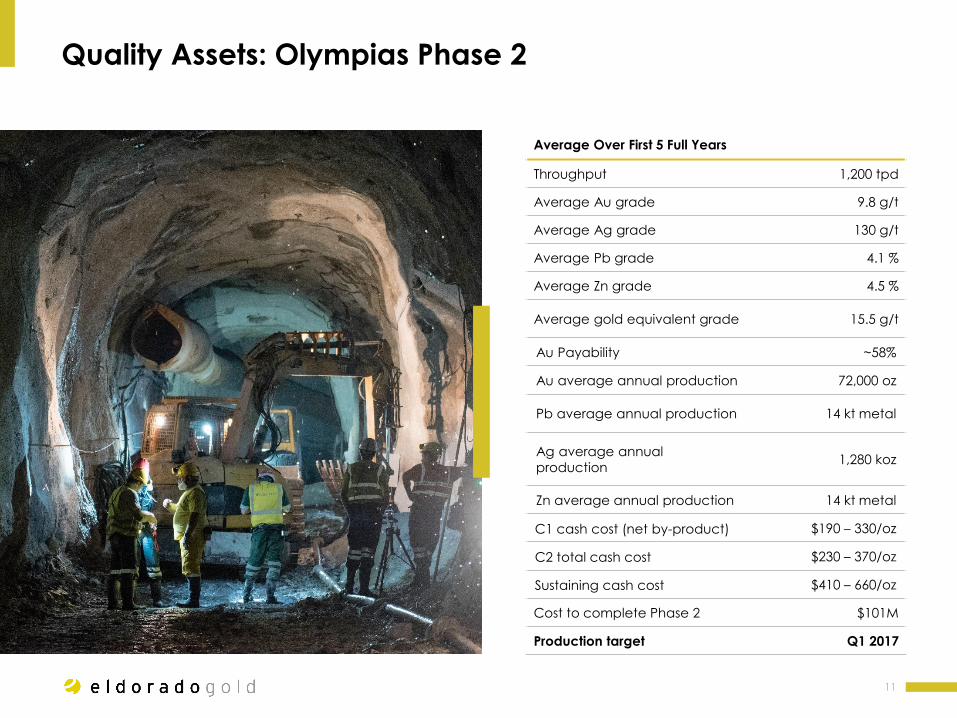
Quality Assets: Olympias Phase 2
11
Average Over First 5 Full Years
Throughput 1,200 tpd
Average Au grade 9.8 g/t
Average Ag grade 130 g/t
Average Pb grade 4.1 %
Average Zn grade 4.5 %
Average gold equivalent grade 15.5 g/t
Au Payability ~58%
Au average annual production 72,000 oz
Pb average annual production 14 kt metal
Ag average annual
production1,280 koz
Zn average annual production 14 kt metal
C1 cash cost (net by-product) $190 – 330/oz
C2 total cash cost $230 – 370/oz
Sustaining cash cost $410 – 660/oz
Cost to complete Phase 2 $101M
Production target Q1 2017
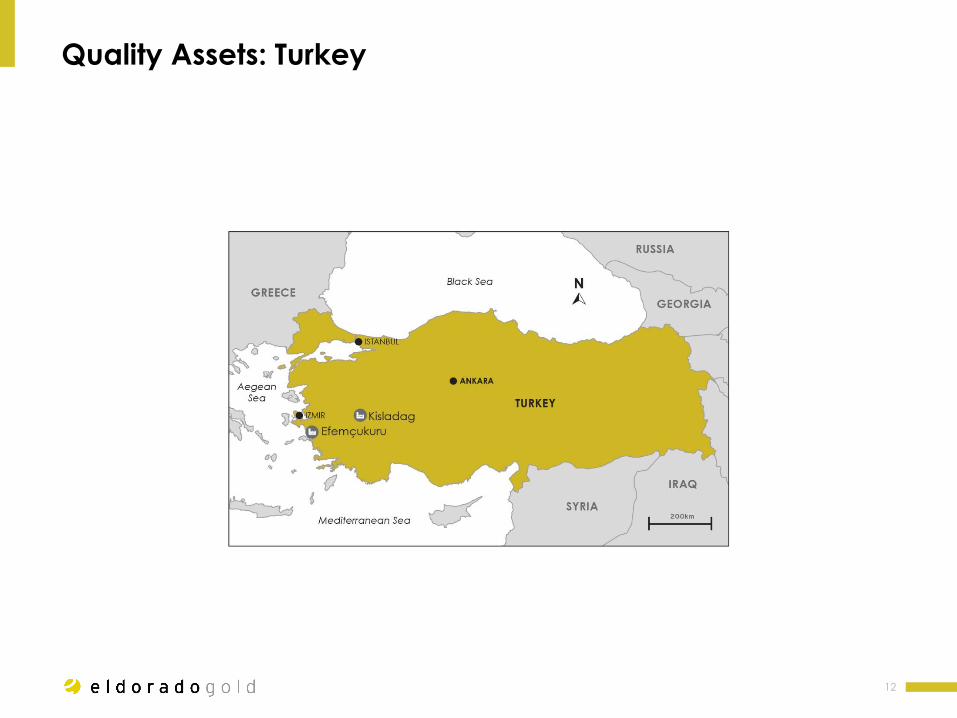
Quality Assets: Turkey
12

Quality Assets: Kişladağ expansion capital costs
13
2016 2017 2018 Total
Crushing/screening $4 M $26 M $10 M $40 M
Leach pad, conveyors & transfer station $2 M $15 M $3 M $20 M
Infrastructure, power distribution -- $1 M $2 M $3 M
Total $6 M $42 M $15 M $63 M

Kişladağ: Production Summary
14
Average 2017-2020
Mining cost $1.75/t material
$2.50/t ore
Processing cost $4.50/t ore
G&A cost $1.60/t ore
Costs
Total operating costs $8.55/t ore
Sustaining capex $75 M/year
Au Costs
C1 cash cost $490/oz
C2 total cash cost $520/oz
Sustaining cash cost $810/oz
2017 2018 2019 2020
Annual production (koz Au)
250 320 375 310
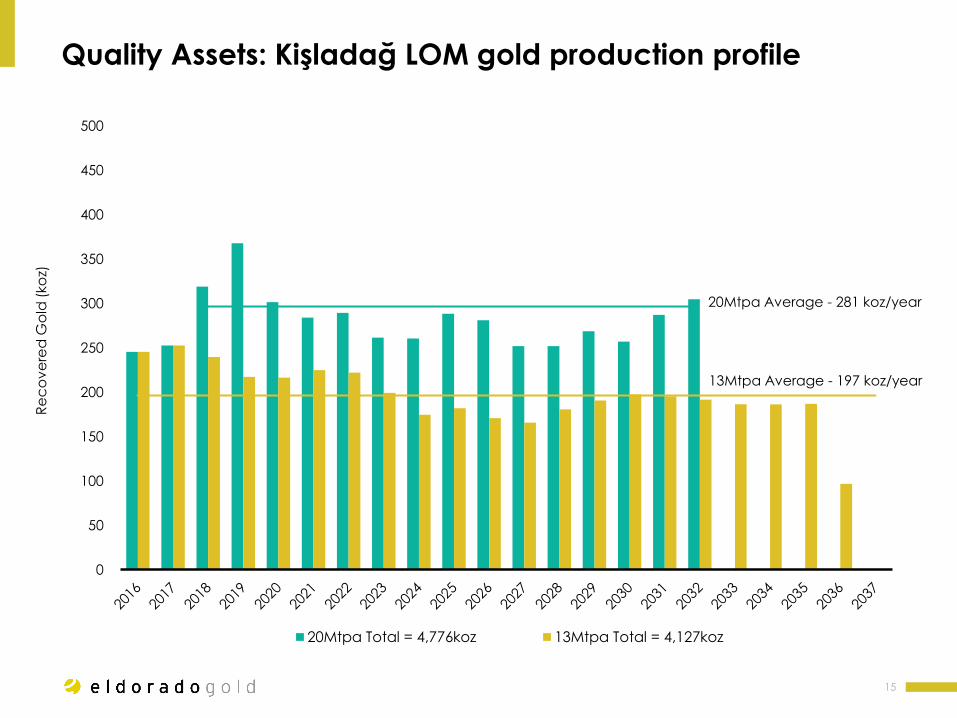
Quality Assets: Kişladağ LOM gold production profile
15
0
50
100
150
200
250
300
350
400
450
500
Re
co
ve
red
Go
ld (
ko
z)
20Mtpa Total = 4,776koz 13Mtpa Total = 4,127koz
13Mtpa Average - 197 koz/year
20Mtpa Average - 281 koz/year

Quality Assets: Efemçukuru
16
Average 2017-2020
Mining cost $35.00/t ore
Processing cost $45.00/t ore
G&A cost $20.00/t ore
Average annual Au production 94,000 oz
Costs
Total operating costs $127/t ore
Sustaining capex $19 M/year
Au Costs
C1 cash cost $550/oz
C2 total cash cost $570/oz
Sustaining cash cost* $770/oz
*C2 + sustaining capital
LocationIzmir Province,
Turkey
Deposit Epithermal vein
Ownership 100% Eldorado
Mining/processingUnderground /
Flotation
Life of mine 12+ years*
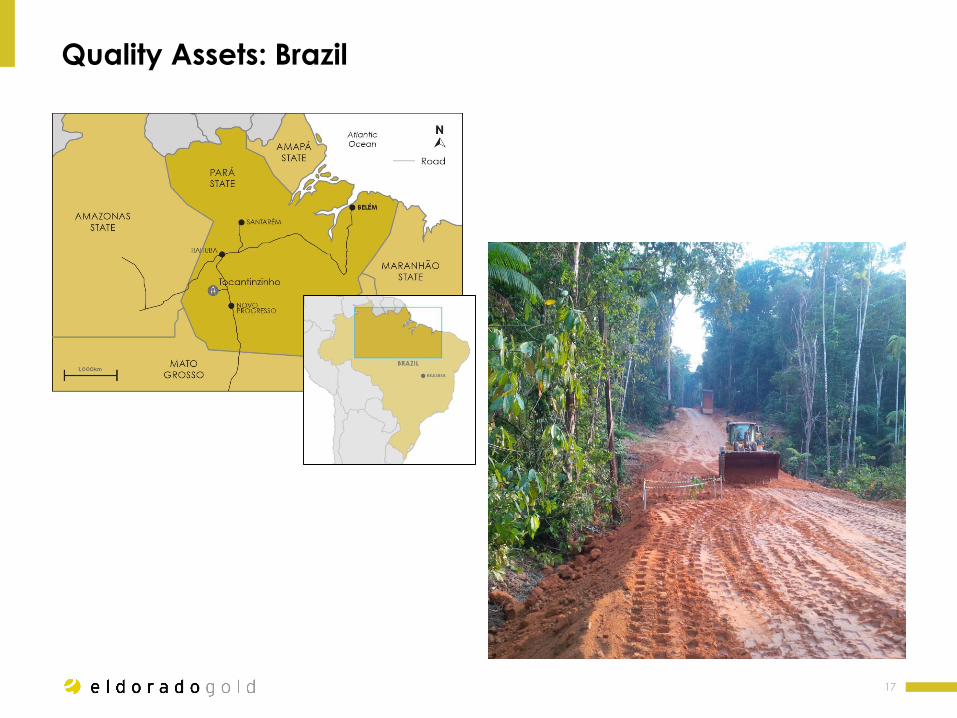
Quality Assets: Brazil
17

Quality Assets: Tocantinzhino moving forward
18
Average gold grade1.42 g/t(with reprocessed tails)
Recovered 1.7 Moz Au
Average annual production 170,000 oz
C1 cash cost $535/oz
C2 total cash cost $580/oz
Sustaining cash cost $615/oz
Net after-tax cash flow $589M
NPV (5%) $317M
IRR 17%
Capital Costs of $464M*include:
• 2 yrs preproduction mining ($57M)
• 200km power line and substations
• 70km access road
• 4.3 Mtpa process plant, tails dam and CIP pond
• On-site accommodation for 500 staff
*at BRL3.75/$ exchange rate

Quality Assets: Romania - Certej
19
Project Performance
Total ore mined 44.3 Mt
Waste mined 131.1 Mt
Gold grade 1.69 g/t
Silver grade 11.0 g/t
Processing method Pressure Ox / CIL
Annual tonnes milled 3.0 Mt
Plant recovery87.4% Au80.0% Ag
Recovered2.1 Moz Au12.4 Moz Ag
Average annual production140,000 oz Au830,000 oz Ag
Economic Analysis (@$1,300 Au, $18 Ag)
Net after-tax cash flow $632 M
NPV (5%) $305 M
IRR 15%

Operational Excellence: our track record
20
2017
1992Efemçukuru
identified
Commercial
production at La
Trinidad begins
Acquisition of
Gencor properties
(Turkey/Brazil) – July
4, 1996
1996
2000Reclamation
of La Trinidad
complete
2005
Entry into
China through
Acquisition
of Afcan
(TJS Mine)
2006
Commercial
production at
Kisladag begins
Completed
construction of
TJS Mine
2008
Begin construction
at Efemcukuru Mine
Acquisition of
Frontier Pacific
Mining Corporation
(100% interest in
Perama Hill)
Sale of Sao Bento
Mine for US$70M to
Anglogold
2009
Acquisition of Sino
Gold (82% interest
in JF/ 95% interest in
ED/95% interest in
WM and various
interests in other
mineral properties)
Listed on NYSE
2010
Began dividend
payments
2011Commercial
production at
Efemcukuru begins
2012
Acquisition
of European
Goldfields
Limited (95%
interest in
Skouries /
Olympias /
Stratoni / and
80% interest
in Certej)
2014Acquisition of
Glory Resources
(Sapes Project)
2016
Exit from
China via
asset sales
1997Discovery of
Kişladağ

Operational Excellence: value-add through exploration
21
0
2
4
6
8
10
12
14
Measured and Indicated Resources (M ounces)
Discovered Acquired
Inferred
19.4 M ounces discovered
Discovery cost $17 / ounce

Operational Excellence: concept to resource definition
22
Project Generation Drill Testing Resource Definition
Greece
Romania
Brazil
Serbia
TurkeyEpithermal / Porphyry Au W Turkey Targeting
Carbonate Replacement
Au-Cu Porphyry
Epithermal Au
Au-Cu Porphyry
Epithermal Au
Orogenic Au
Skarn Au
Epithermal / Porphyry Au
Epithermal Au
SE Europe Targeting
Tsikara
Fisoka
Borborema
Nazareno
Efemcukuru
Mavres PetresStratoni Fault Zone
KMC
Olympias
Sapes
Bolcana
Bolcana / Certej
Drilling in Q3-Q4

Operational Excellence: highly prospective areas
2
3
Skouries
5.4 Moz
Olympias
4.5 MozPerama
1.9 Moz
KMC
Tertiary
Cretaceous
Efemcukuru
2.3 Moz
Kisladag
16 Moz
Sapes
0.5 Moz
Eldorado
Asset
Piavitsa
1.9 Moz
Certej
4.1 Moz
• Eldorado is the
major player in the
Tethyan belt
• Total gold resources
in Eldorado assets
>35 Moz
• Significant
competitive
advantage for
further exploration in
the belt
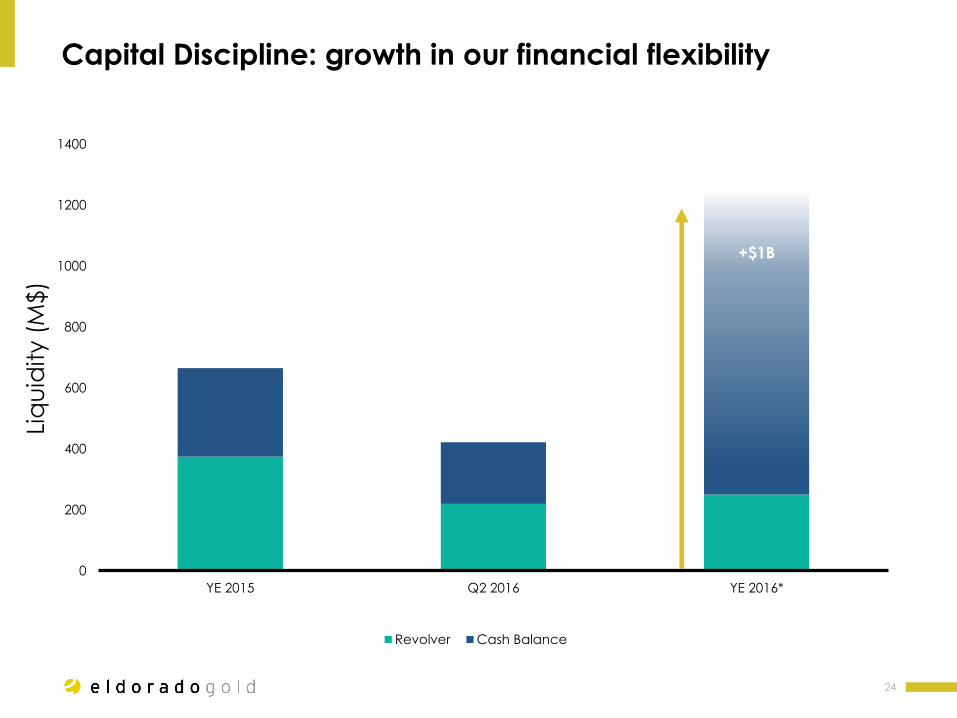
Capital Discipline: growth in our financial flexibility
24
+$1B
0
200
400
600
800
1000
1200
1400
YE 2015 Q2 2016 YE 2016*
Revolver Cash Balance
Liq
uid
ity (
M$)

Operating
cash flow
(2016-2020)
Cash
on hand
Proceeds from
China saleCapex
(2016-2020)
China
Romania
Brazil
Greece
Turkey
Fully Funded Capital Requirements
25
Fully Funded
(1) Capex and 0perating cash flow are presented 2H16-forward
(2) Cash as of June 30, 2016
~$2.15B
~$1.75B
~$0.2B
~$0.8B
(2)(1)
(1)

0
100
200
300
400
500
600
700
800
900
1000
2017 2020
AIS
C (
US$/o
z)
AISC Forecast (1)
Total Cash Cost Sustaining & ExplorationGeneral & Administrative
AISC(30%)
0
200
400
600
800
1000
1200
2017 2020
Pro
du
ctio
n (
Ko
z)
Production Forecast
Gold Ounces Gold Equivalent Ounces
Gold Production
+110%
0.00
0.10
0.20
0.30
0.40
0.50
0.60
0.70
0.80
0.90
0
100
200
300
400
500
600
700
2017 2020
Ca
sh F
low
Pe
r Sh
are
(U
S$/s
h)
Op
era
tin
g C
ash
Flo
w (
US$M
)
Operating Cash Flow Forecast
Operating Cash Flow
Cash Flow
+190%
Strong Growth and Expanding Margins
26
0.00
0.01
0.02
0.03
0.04
0.05
0.06
0.07
0.08
0.09
0.10
0
10
20
30
40
50
60
70
2017 2020
Div
ide
nd
Pe
r Sh
are
(C
$/s
h)
Div
ide
nd
(C
$M
)
Dividend Forecast
Dividend @$1,250-$1,399/ozDividend @$1,400-$1,549/ozDividend @$1,550-$1,599/oz
Dividend Linked to
Production & Price
(1) Total Cash Cost is presented net of by-product credits

Accountability: Our way of doing business
27
Health and Safety
• Focus on improving performance
• Consistent year over year reductions in LTI’s
Environmental Stewardship
• Leading environmental management practices
Creating Value for Local Communities
• Focused on local employment and procurement
• Meaningful investments for local communities and economies
31
23
16
4
0
5
10
15
20
25
30
35
Year
Annual Lost Time Injuries
2013 2014 2015 2016 YTD
111
75
46
0
20
40
60
80
100
120
Year
Annual Total Recordable Incidents*
2014 2015 2016 YTD
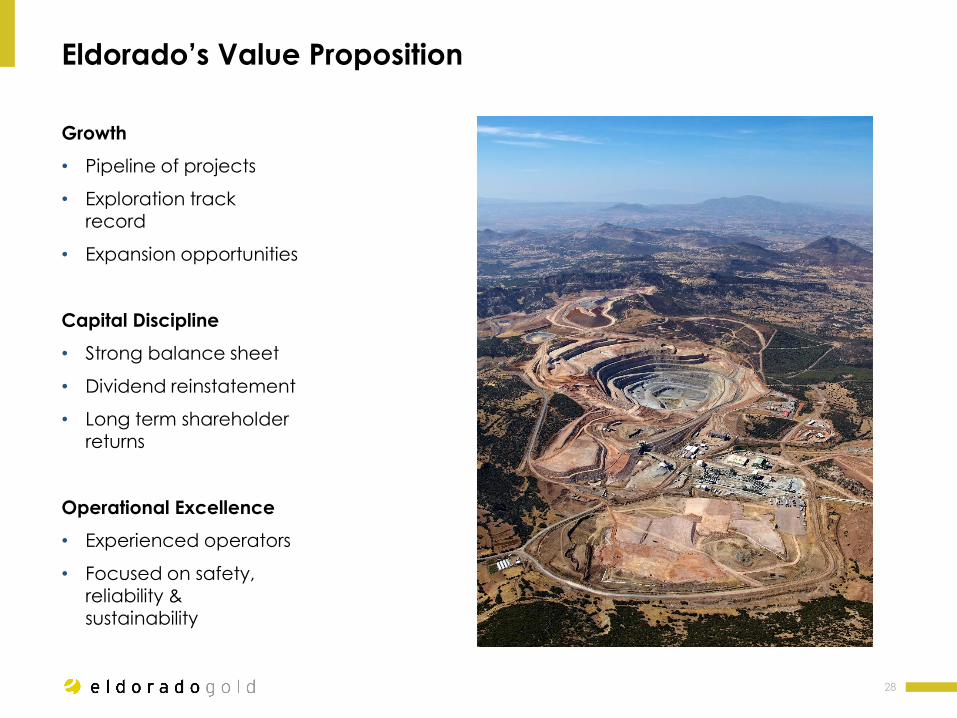
Eldorado’s Value Proposition
28
Growth
• Pipeline of projects
• Exploration track record
• Expansion opportunities
Capital Discipline
• Strong balance sheet
• Dividend reinstatement
• Long term shareholder returns
Operational Excellence
• Experienced operators
• Focused on safety, reliability & sustainability

Thank You