investor update investor relations, july 2016 · pdf filestada corporate presentation investor...
TRANSCRIPT
Investor Update Investor Relations, July 2016

Page STADA Corporate Presentation Investor Relations · July 2016
General Information
2
By making use of this document the reader acknowledges and agrees to the following: We accept no liability arising from the use of this document. STADA Arzneimittel AG, Bad Vilbel (hereinafter “STADA”), has made every effort to make sure that this document contains correct and up-to-date information. STADA accepts no responsibility for and makes no guarantee whatsoever in respect of currentness, accuracy and completeness of the information and assumes no obligation to update, complete or correct this information. The anticipated opportunities and risks to STADA’s activities have been described in detail in the Executive Board’s management reports in the annual reports. Current possible opportunities and risks are discussed in the respective interim report. STADA’s performance indicators are partly influenced by one-time special effects and/or effects not arising from the operating business. Disclosure of key figures adjusted for these effects (so called “pro forma” key figures) by STADA is only to provide a supplement to the recorded IFRS key figures for a transparent comparison to a relevant period from the previous year. All text, pictures, trademarks, and other information contained in this document are subject to the copyright of STADA or subject to rights acquired from third parties. Trademark protection may apply even for preparations not indicated as trademarks. This document may not be reproduced in whole or in part without the express written consent of STADA. Any disputes arising out of or in connection with the content of this document, insofar as they are directed against STADA, shall be subject to German law, without prejudice to mandatory provisions of foreign law. The place of jurisdiction is Frankfurt am Main to the extent legally permissible.

Page STADA Corporate Presentation Investor Relations · July 2016
Forward-Looking Statements
3
This STADA Arzneimittel AG (hereinafter "STADA") presentation contains certain statements regarding future events that are based on the current expectations, estimates and forecasts on the part of the company management of STADA as well as other currently available information. They imply various known and unknown risks and uncertainties, which may result in actual earnings, the business, financial and earnings situation, growth or performance to be materially different from the estimates expressed or implied in the forward-looking statements. Statements with respect to the future are characterized by the use of words such as “expect”, “intend”, “plan”, “anticipate”, “believe”, “estimate” and similar terms. STADA is of the opinion that the expectations reflected in forward-looking statements are appropriate; however, it cannot guarantee that these expectations will actually materialize. Risk factors include in particular: The influence of regulation of the pharmaceutical industry; the difficulty in making predictions concerning approvals by the regulatory authorities and other supervisory agencies; the regulatory environment and changes in the health-care policy and in the health care system of various countries; acceptance of and demand for new drugs and new therapies; the results of clinical studies; the influence of competitive products and prices; the availability and costs of the active ingredients used in the production of pharmaceutical products; uncertainty concerning market acceptance when innovative products are introduced, presently being sold or under development; the effect of changes in the customer structure; dependence on strategic alliances; exchange rate and interest rate fluctuations, operating results, as well as other factors detailed in the annual reports and in other Company statements. STADA does not assume any obligation to update these forward-looking statements. The Executive Board of STADA Arzneimittel AG: Dr. M. Wiedenfels (Chairman), H. Kraft

Page STADA Corporate Presentation Investor Relations · July 2016
Agenda
4
I. Moving Forward
II. STADA Today
III. Performance Update
Appendix

Page STADA Corporate Presentation Investor Relations · July 2016
Moving Forward
5

Page STADA Corporate Presentation Investor Relations · July 2016
Five Focus Points to Create Long-Term Value for Shareholders
6
1 Align Strategy with Operations
2 Optimize Operational and Reporting Structure
3 Propose Capital Allocation Strategy
4 Review Business Plan and Guidance
5 Further Improve Focus and Accountability

Page STADA Corporate Presentation Investor Relations · July 2016
STADA’s Program to Improve Performance
7
Details Will be Communicated at Capital Markets Day on 05-Oct-2016
Committed Targets 2019
Overhaul Organization • Strong Gx and Branded Products Business Units • Change incentive model Untapped
Growth Potential
Linked initiatives
Drive Organic Growth • Funds for Branded Products internationalization • Focused set-up for evaluating/implementing growth
options
Streamline Portfolio • Refocus marketing • Reduce cost and complexity in the supply chain • Appropriate R&D maintenance cost
Increase Efficiency • Optimize sourcing of finished goods and APIs • Tackle G&A cost
Cost Reduction
Sales
• Grow Group Sales to €2,600m
Net Income
• Grow adjusted Group Net Income to €250m

Page STADA Corporate Presentation Investor Relations · July 2016
Mid-Term Guidance 2019
8
Sales €2,600m CAGR 2015 - 2019: 5%
EBITDA (adj.) €510m CAGR 2015 – 2019: 7%
Net Income (adj.) €250m CAGR 2015 - 2019: 11%
Assumptions • Constant exchange rates • Before portfolio effects • Stable tax environment and current interest levels in STADA‘s markets • Assuming stable regulatory environment • Guidance range: +/- 5%

Page STADA Corporate Presentation Investor Relations · July 2016
STADA Today
9

Page STADA Corporate Presentation Investor Relations · July 2016
STADA – Clear Strategy for Continuous Growth
10
A Highly Efficient, Cash-generative Generics Business to Support Continued Branded Products Growth
• High-growth differentiated products and selected specialty areas (e.g. Apo-go, Biosimilars, Aesthetics)
• Innovative sales and marketing concepts
• Strong platforms in UK, Russia and Germany; focused expansion into growth markets
• Higher profitability
• Products with long cash cycle • Established market positions in key European
countries (#2 in Russia and Spain, #3 Germany)
• Competitive cost structure
• Robust cash flow generation
Generics (FY15 Adj.
EBITDA: €233m)
Branded Products (FY15 Adj.
EBITDA: €220m)
Growth Options
• Long-term growth opportunities
• Sales growth above market average
• Adj. EBITDA margin FY15: 25.8%
• Low single-digit growth
• Adj. EBITDA margin FY15: 19.1%

Page STADA Corporate Presentation Investor Relations · July 2016
Generics is our “Bread-and-Butter“ Business Poised for Growth
11
Ageing Population
Patent Expiration in Developed Markets ($bn)1
2015 2030
Expected Generics Market Growth in Selected Countries
Source: IMS, Euromonitor; 1) Reflects lower brand spending including biologic at constant US$bn.
Cum. 2016-20: $178bn
CAGR 2015-2020 (Based on IMS Before Discounts)
2535 37
4235
30
2015 2016 2017 2018 2019 2020
6.9%
6.9%
7.3%
8.4%
4.8%
7.9%
Russia
Belgium
Spain
Italy
Germany
World0 to 14 (26%)
15 to 39 (39%)
65+ (8%)
40-64 (27%)
0 to 14 (24%)
15 to 39 (36%)
65+ (12%)
40-64 (28%)

Page STADA Corporate Presentation Investor Relations · July 2016
Our International Generics Business is Positioned in Highly Attractive Markets
12
72%
38%
61%
47%
76%
Sales by Region Generics Penetration (Based on 2015 Volumes)
1) Excluding export sales of the market region Germany. 2) Local manufacturers/producers. 3) Reflects 2015-20 CAGR. Source: IMS
€1,218m
Market Position
#3
#4
#2
#1
#22
Industry Growth3
+5%
+8%
+7%
+7%
+7%
• Leading market positions in key Western and Eastern European Generics markets
• Benefit from attractive market growth
• Trend of increasing Generics penetration in STADA’s key markets
Generics Sales FY15
Germany (25%)¹
Italy (12%)Spain (9%)
Belgium (8%)
Other (39%)
Russia (7%)
(Based on IMS Before Discounts)

Page STADA Corporate Presentation Investor Relations · July 2016
We Benefit from our Local Market Expertise to Compete in Heterogeneous Market Environments
13
Type of Decision Maker Public Health Insurer Doctor Pharmacy Patient/Out-of-Pocket
Key
Description • Tender scheme with price-driven tender award • Doctors’ prescriptions
• Based on INN prescription pharmacists decide what to dispense
• Patients make purchasing decisions, mostly based on (1st) prescription
Example
STADA’s Go-to-Market
• Sophisticated tender management (without sales force)
• Sales force targeting doctors
• Sales force targeting pharmacies
• Sales force targeting patients indirectly via doctors
Market Specifics • Focus on supply capability
to guarantee swift product availability
• Importance of strong company brand
• Discounts at the retail level
• Supportive sales force promotion to pharmacies
STADA serves 30+ Markets with its Individual Sales and Portfolio Approach to achieve growth
Page STADA Corporate Presentation Investor Relations · July 2016
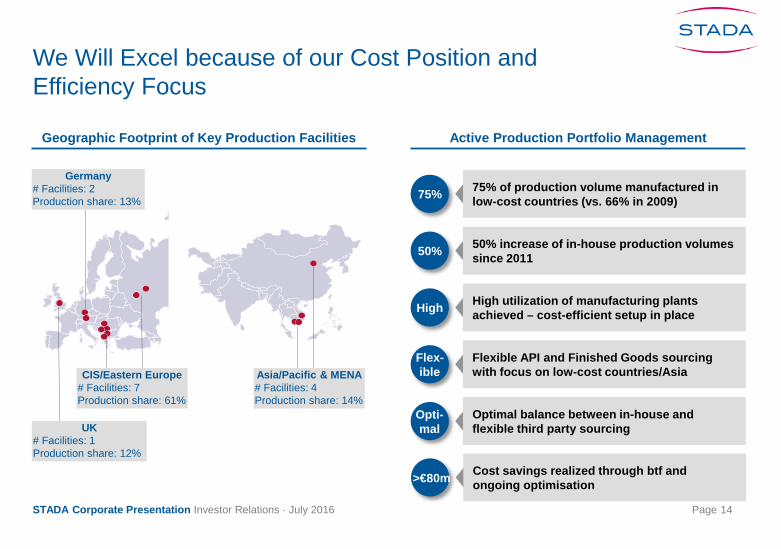
We Will Excel because of our Cost Position and Efficiency Focus
14
Geographic Footprint of Key Production Facilities
75% 75% of production volume manufactured in low-cost countries (vs. 66% in 2009)
50% 50% increase of in-house production volumes since 2011
High High utilization of manufacturing plants achieved – cost-efficient setup in place
Asia/Pacific & MENA # Facilities: 4 Production share: 14%
CIS/Eastern Europe # Facilities: 7 Production share: 61%
UK # Facilities: 1 Production share: 12%
Germany # Facilities: 2 Production share: 13%
Active Production Portfolio Management
Opti-mal
Optimal balance between in-house and flexible third party sourcing
Flex- ible
Flexible API and Finished Goods sourcing with focus on low-cost countries/Asia
>€80m Cost savings realized through btf and ongoing optimisation

Page STADA Corporate Presentation Investor Relations · July 2016
We Have Stabilized our Generics Business at a High Profitability Level Despite Headwinds
15
Historical Adj. EBITDA Performance (in €m)
Historical Sales Performance (in €m) Comments
17.4%
• Volume development compensates for price declines
• Currency effects negatively impacted growth in CIS/Eastern European countries
• Despite continuous pricing headwinds stabilized margin with continuous cost improvements
• Key profitability drivers represent
• Sourcing cost reductions
• Manufacturing focus on low-cost countries
Adjusted1
Margin 17.9% 18.8% 19.1%
CAGR: +2%
Reported
1) Adjusted for changes in the Group portfolio and currency effects.
CAGR: +0%
CAGR: +1%
1,213 1,228 1,218 1,218
2012 2013 2014 2015
217 213 229 233
2012 2013 2014 2015

Page STADA Corporate Presentation Investor Relations · July 2016
Branded Products Segment Delivers Profitable Growth with a Long Cash Cycle
16 Source: IMS. 1) Ex-manufacturer sales in local currency dollars.
Key Demand and Supply Drivers
Non-Rx Bound Product Sales in Europe (LC$bn)1
OTC Market Growth Forecasts
Ageing Population Urbanization
Health Awareness
Regulatory Support
CAGR: +5%
CAGR 2015-2020 (Based on IMS)
Internet and Digital Technology
24 26 27 28 30
2011 2012 2013 2014 2015
Increasing Self-medication/Self-pay
5.2%
5.1%
3.6%
5.2%
2.5%
9.9%
5.2%
Spain
Poland
Italy
Germany
UK
Russia
World

Page STADA Corporate Presentation Investor Relations · July 2016
We Have Established a Strong Branded Products Platform with Leading Brands
17
Strong Platforms in UK, Russia and Germany Internationalization of Leading Brands
Strong Established Platforms in Key European Countries and Access to Attractive Growth Markets
FY15 Sales/ Growth1
Leading Local Brands
• €168m (+9% vs. ’14)
• €212m (+14% vs. ’14)
• €123m2 (-1% vs. ’14)
1) Adjusted for changes in the Group portfolio and currency effects. 2) Excluding export sales of the market region Germany. Sales growth in 2015 negatively impacted by weak summer in Germany.
Aqualor Vitaprost
Apo-Go Cetraben
Ladival Grippostad
Country
Apo-go (Parkinson’s) 31 Countries
Vitaprost (Prostate Hyperplasia)
14 Countries
Hedrin (Head Lice) 43 Countries
Ladival (Sun Protection)
24 Countries
Grippostad (Cough and Cold)
29 Countries
Radian B (Muscular & Joint Pain)
34 Countries
Internationalization of Branded Products from Core Platform Markets
Full Local Platform
Snup (Rhinitis)
18 Countries
Hexicon (Antiseptic)
14 Countries
Other Countries • €351m Multiple Chondroxid
(Muscular & Joint Pain) 13 Countries

Page STADA Corporate Presentation Investor Relations · July 2016
Our Branded Products Business is Diversified with Leadership Positions in their Markets
18
Branded Products Sales by Brand Top 30 Branded Products by Market Position
Diversified Sales Base at Product-level with Top 10 Products Constituting c. 35% of FY2015 Sales
Among Top 30 Branded Products 74% of Sales is Generated from Products with Top 3 Market Positions3
Top 3 Positions: 74%
1) Umbrella brand for various indications such as a.o. skin care, cold medicine, gastrointestinal disease, pain medication. 2) Reflects 63% of Branded Products Sales of €854m in 2015. 3) Relates to market positions in each respective country.
Aqualor (5%)
Grippostad (5%)
Snup (4%)Vitaprost (3%)Fultium (2%)
Apo-go (7%)
Other (65%)
Ladival (2%)Care (2%)¹
Covonia (2%)Levomecol (2%)
Top 30 Branded Products: €540m Sales in 20152 Branded Products: €854m Sales in 2015
Top 10 Brands: 35%
#1 Position (53%)
#2 Position (19%)
#3 Position (2%)
Other Position / No Market Data
Available (26%)

Page STADA Corporate Presentation Investor Relations · July 2016
Our Strong Brands Target the Most Attractive Indications
19
Note: Market positions reflect STADA estimates based on market data provided by various international market research institutes. 1) In pharmacies.
Others Cough and Cold Skin Treatments/ Cosmetics
Vitamins, Minerals & Nutritional
Supplements Pain
Sele
cted
Pro
duct
s
Aqualor®
Levomecol®
Vitaprost®
Sele
cted
Mar
ket
Posi
tions
Zinc Deficiency #1
#1 Vitamin D3
Dietary Supplement #1
Dietary Supplement #3
Non-Narcotics & Anti-Pyretics #1
#1 Muscular & Joint Pain
Narcotics #1
Non-Narcotics & Anti-Pyretics #1
Anti-Bleeding #1
#1 Parkinson’s
Inflammation of the Veins #1
Prostate Hyperplasia #2
Cough & Cold #1
#1 Cough & Cold
Rhinitis #2 Skin Eczema & Dry Skin #5
#1 Sun Protection1
Cough & Cold #1
Foot Treatment #2
Sun Protection1 #5

Page STADA Corporate Presentation Investor Relations · July 2016
Buy-and-Build Case Study: Acquisition of Thornton & Ross (T&R)
20
53
54
81 88
132
188 107
2012 2013 2014 2015 2012-2015
• Integration of STADA’s UK business into T&R (2014)
• Bolt-on acquisitions: Flexitol (2014) and Fultium (2014)
• Total sales contribution of €54m through transfer/ acquisitions
1) Cash and debt-free basis. 2) Total incl. smaller brand sales. 3) Excluding transfer/M&A and FX-adjusted. Actual 2012-15 CAGR of c. 32%.
T&R at a Glance
Synergistic Platform Effects
(Launch: 2015)
(Launch in Italy: 2015)
Strong Organic Growth
54 Acquired/ Transferred Sales Base Organic Growth
Transaction Details Key Highlights
• #5 OTC Player in UK
• Strong OTC franchise
• Wide variety of indications (including Cough & Cold, Pain, Derma)
• Acquired in Aug-2013
• Purchase price: € 226m1
• Transaction multiple: 10.3x 2013A EV/EBITDA
STADA Brands via T&R T&R Brands via STADA
• 2015 Sales2: €28m
• Key Brands:
• 2015 Sales2: €5m
• Key Brands:
Aug-13: Acqui-sition by STADA
Leveraging Platform
(in €m)

Page STADA Corporate Presentation Investor Relations · July 2016
We Have Significantly Expanded our Branded Products Business over the Last Several Years
21
Historical Adj. EBITDA Performance (in €m)
Historical Sales Performance (in €m) Comments
32.0%
• Significant sales increase driven by strong organic growth of c. 9% p.a. in 2012-2015
• In addition targeted acquisitions focusing on high-margin OTC product portfolio and/or growth markets
• Strong performance dynamics of Thornton & Ross
• Track record of high level of profitability with adj. EBITDA margin between 30% and 32% in 2012-2014
• Lower adj. EBITDA margin in 2015 due to currency effects (largely related to CIS/Eastern Europe)
Adjusted1
Margin 31.7% 30.0% 25.8%
CAGR: +5%
Reported
1) Adjusted for changes in the Group portfolio and currency effects.
CAGR: +13%
CAGR: +9%
596 704 801 854
2012 2013 2014 2015
189 225 240 220
2012 2013 2014 2015

Page STADA Corporate Presentation Investor Relations · July 2016
The Profit Contribution from our Branded Products Business Is Set to Further Increase
22
Branded Products’ Share of Adj. Operating Earnings1
1) Relates to split of the two core segments Generics and Branded Products.
Branded Products’ earnings share has increased from 36% in 2010 to 49% in 2015 driven by
• Strong organic growth
• Growth through selected brand acquisitions (e.g. Thornton & Ross)
STADA intends to further expand its Branded Products segment through
• Internationalization of leading brands
• Targeted brand acquisitions
Comments
36% 49%
67%
64% 51%
33%
2010 2015 2019+
Generics
Branded Products
Generics
Generics
Branded Products
Branded Products

Page STADA Corporate Presentation Investor Relations · July 2016
Focus on Growth Options
23
Growth Options will add more than €200m in the next five years
Selected Specialty Areas Future Innovative
Concepts
Innovative Go-to-markets concepts
Product innovations in
attractive niche markets
Value-added concepts
Biosimilars (Risk-averse strategy of biosimilar in-licensing)
Aesthetics (Expansion in aesthetic
dermatology)
Socialites (T&R entering market for electronic vaping/
smoking cessation with acquisition of Socialites
in Dec-2015)
Daosin (Acquisition in 2015;
only product on market for Histamine
intolerance)
Apo-go (Drug/device combination
with nurse service for Parkinson’s disease)
Growth Options

Page STADA Corporate Presentation Investor Relations · July 2016
Growth Options: Product Pipeline Biosimilars
24
• Epoetin zeta (Silapo®) – since 2008 (STADA/Bioceuticals)
• Filgrastim (Grastofil®) – since 2014 (Apotex)
• Pegfilgrastim – in EMA approval process (Gedeon Richter)
• Teriparatid – in EMA approval process (Richter-Helm)
• Rituximab (Gedeon Richter)
• Adalimumab (mAbxience)
Portfolio expansion • Marketing and sales are STADA’s strengths,
therefore in-licensing of biosimilars rather than own development
• Avoidance of high R&D costs – milestone payments backloaded and performance related; risk-averse strategy
Strategic partnerships allow the possibility of benefiting from the huge market potential of biosimilars

Page STADA Corporate Presentation Investor Relations · July 2016
Growth Options: Strengthening of the Aesthetics Area
25
Cooperation with CROMA-PHARMA • Expansion of the business activities in the area of aesthetic dermatology with above-
average growth potential
• Broad product range under the premium brand Princess: hyloronic acid-based fillers, facial masks, serums and lifiting threads
• Attractive product pipeline: botulinum toxin A, currently in phase III of approval studies
• Exclusive brand licensing rights and additional distribution rights in selected European countries and Hong Kong
• Marketing via large, specialized dermatologist practices
• Purchase price for the acquisition of the existing sales companies, the exclusive brand licensing or sales rights and the access to the pipeline: single-digit million euro range; if botulinum is approved, an additional payment in this range will be due.
• Current sales in contract area: high single-digit million euro range; EBITDA margin above Group average

Page STADA Corporate Presentation Investor Relations · July 2016
Performance Update
26
Page STADA Corporate Presentation Investor Relations · July 2016
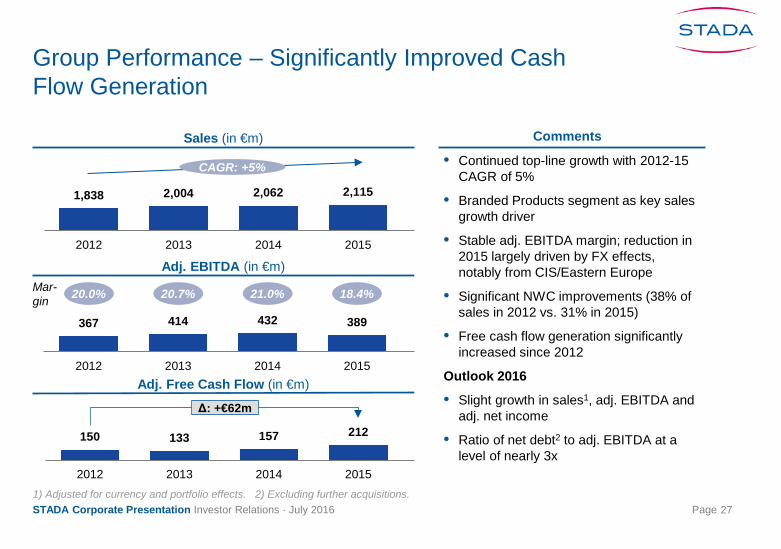
Group Performance – Significantly Improved Cash Flow Generation
27
Sales (in €m)
Adj. EBITDA (in €m)
Adj. Free Cash Flow (in €m)
CAGR: +5%
Δ: +€62m
Mar-gin 20.0% 20.7% 21.0% 18.4%
1) Adjusted for currency and portfolio effects. 2) Excluding further acquisitions.
150 133 157 212 NA
2012 2013 2014 2015 2016E
1,838 2,004 2,062 2,115
2012 2013 2014 2015 2016E
367 414 432 389
2012 2013 2014 2015 2016E
Comments
• Continued top-line growth with 2012-15 CAGR of 5%
• Branded Products segment as key sales growth driver
• Stable adj. EBITDA margin; reduction in 2015 largely driven by FX effects, notably from CIS/Eastern Europe
• Significant NWC improvements (38% of sales in 2012 vs. 31% in 2015)
• Free cash flow generation significantly increased since 2012
Outlook 2016
• Slight growth in sales1, adj. EBITDA and adj. net income
• Ratio of net debt2 to adj. EBITDA at a level of nearly 3x

Page STADA Corporate Presentation Investor Relations · July 2016
Looking Through FX Impacts
28
Sales Growth (Reported vs. Currency-adjusted) Comments
• Continued sales growth over the last 4 years
• Since 2013 sales growth negatively impacted by currency effects in the amount of 3-5% per year
• Negative impact of currency effects largely related to CIS/Eastern Europe
• E.g. Russia: 18% reported sales decrease in 2015 translates into 7% sales increase by applying the FX rate as of 2014
• GBP depreciation expected to impact operational result in low single-digit EUR million range in FY2016
7%
9%
3%
3%
7%
12%
8%
6%
2012 2013 2014 2015
Reported Sales Growth Sales Growth Excl. Currency Effects

Page STADA Corporate Presentation Investor Relations · July 2016
STADA: Continuous Focus on Cost Structure to Underpin Growth
29
• Cross-selling through shared sales force • One legal entity approach for selling Generics and Branded Products • Transformation of Generics into Branded Products
Cross-Selling
• Reduced number of manufacturing locations • Optimization of production in-housing/outsourcing mix • Central demand planning on product-level to optimize stock level
Operations
• Transfer of low-tech functions (R&D maintenance, quality control, IT) to low-cost countries (Romania, Serbia) Near Shoring
We Continue to Maintain Strong Profit Margins Through a Continued Focus on Cost Structure Improvements Along the Entire P&L
• Concentration on core activities and outsourcing of non-core activities • E.g. outsourcing of logistics services in Germany to DHL
Outsourcing Non-core
• Presence in India/China established in 2013/2014 • Streamlining of group-wide API sourcing
Sourcing
Net Sales/ SG&A
COGS/ SG&A
COGS/ R&D
SG&A
COGS
• Shared supplier base for sourcing of raw materials/finished goods • Shared production facilities and R&D development/maintenance activities • Shared service functions and back-office activities
Shared Functions
COGS/R&D/ SG&A
Cos
t Str
uctu
re O
ptim
izat
ions
O
p. S
yner
gies

Page STADA Corporate Presentation Investor Relations · July 2016
Appendix
30

Page STADA Corporate Presentation Investor Relations · July 2016
Preliminary Agenda for the AGM on 26-Aug-2016
31
1 Submission of Adopted Financial Statements and Group Financial Statements for 2015
2 Appropriation of Balance Sheet Profits
3 Approval of the Executive Board Members’ Activities for 2015
4 Approval of the Supervisory Board Members’ Activities for 2015
5 External Auditor Election for the Financial Statements and Group Financial Statements of 2016
6 Approval of the Remuneration System for the Executive Board Members¹
7 Elimination of Restrictions on the Transferability of Registered Shares in STADA Arzneimittel AG
8 New Elections to the Supervisory Board
1) Information on the external independent assessment of the remuneration system will be published jointly with the AGM invitation by 20 July 2016.

Page STADA Corporate Presentation Investor Relations · July 2016
Supervisory Board Renewal
32
Existing Supervisory Board Members Supervisory Board Candidates
Rolf Hoffmann (57) • Previously
Member of the Extended Executive Board of Amgen
• 30 years in the pharmaceutical industry
Dr. Birgit Kudlek (49) • Previously COO
at AENOVA • Broad experience
in the Generics industry (Sandoz, Ratiopharm)
Tina Müller (47) • Chief Marketing
Officer at Opel • One of the best-
known leadership personalities in marketing and sales
Dr. Gunnar Riemann (58) • Previously Various
Executive Board Positions at Bayer
• 30 years of international experience in the Life Sciences industry
Carl Ferdinand Oetker (43) • Member of the
Supervisory Board since 2009
• Previously Chief Representative of Bankhaus Lampe
• Managing Director F.O. Holding GmbH
Dr. Martin Abend (53) • Member of the
Supervisory Board since 2003
• 1st Vice President of the German Federal Bar
• Partner of the law firm Abend & Hausö Rechtsanwälte
• Comprehensive and structured selection process for the renewal of four out of six Supervisory Board members
• Process led by STADA’s special nomination committee and supported by independent human resources consulting company
Nomination Process

Page STADA Corporate Presentation Investor Relations · July 2016
Q1-2016 Performance: Sales Increase in Generics and Branded Products
33
52 63
Q1 2015 Q1 2016
56 48
Q1 2015 Q1 2016
93 92
Q1 2015 Q1 2016
290 296
Q1 2015 Q1 2016
185 190
Q1 2015 Q1 2016
486 497
Q1 2015 Q1 2016
Sales (in €m) Adj. EBITDA (in €m) Comments
+2% • Both segments, Generics and Branded Products, contributed to Group’s y-o-y sales growth of c. 2% in Q1-16
• Positive development in Asia/Pacific & MENA in Generics and Branded Products
• Currency effects negatively impacted Branded Products performance in Q1-16
• Adj. EBITDA performance in Q1-16 driven by Generics segment
• Profitability of the Branded Products segment expected to increase to FY2015 level in the course of 2016
Gen
eric
s B
rand
ed
Tota
l
+3% Mar-gin
17.8% 21.4%
30.2% 25.4%
Mar-gin
Mar-gin
19.0% 18.5% Adjusted1
Reported
1) Adjusted for changes in the Group portfolio and currency effects.
+2%
+4%

Page STADA Corporate Presentation Investor Relations · July 2016
€m 2012 2013 2014 2015 Q1-15 Q1-16Key P&L ItemsGroup Sales 1,838 2,004 2,062 2,115 486 497% Growth 7.1 % 9.1 % 2.9 % 2.6 % (4.2)% 2.2 %
t/o Generics 1,213 1,228 1,218 1,218 290 296% Growth 2.1 % 1.2 % (0.8)% (0.0)% (3.2)% 2.2 %t/o Branded Products 596 704 801 854 185 190% Growth 26.3 % 18.1 % 13.6 % 6.6 % (5.9)% 2.5 %
Adj. EBITDA 367 414 432 389 93 92% Margin 20.0 % 20.7 % 21.0 % 18.4 % 19.0 % 18.5 %
t/o Generics 217 213 229 233 52 63% Margin 17.9 % 17.4 % 18.8 % 19.1 % 17.8 % 21.4 %t/o Branded Products 189 225 240 220 56 48% Margin 31.7 % 32.0 % 30.0 % 25.8 % 30.2 % 25.4 %
Adj. EPS 2.47 2.65 3.04 2.69 0.62 0.64% Growth 1.2 % 7.3 % 14.7 % (11.5)% (27.9)% 3.2 %
Key Cash Flow ItemsCash Flow from Operating Activities 213 204 224 312Adj. Free Cash Flow 150 133 157 212
Key Historical Financials
34

Page STADA Corporate Presentation Investor Relations · July 2016 35
We look forward to seeing you on STADA‘s AGM on August 26 and the Capital Markets Day on October 5, both in Frankfurt

Page STADA Corporate Presentation Investor Relations · July 2016
Your contact
36
STADA Arzneimittel AG
Investor Relations 61118 Bad Vilbel, Germany Telephone: +49 (0) 6101 603-113 Fax: +49 (0) 6101 603-506 E-mail: [email protected] www.stada.com
Vice President Investor Relations Dr. Markus Metzger [email protected]