investor update & preliminary 2015 ... - anglo american...
TRANSCRIPT

INVESTOR UPDATE &
PRELIMINARY 2015 RESULTS16th February 2016

2
CAUTIONARY STATEMENTDisclaimer: This presentation has been prepared by Anglo American plc (“Anglo American”) and comprises the written materials/slides for a presentation concerning
Anglo American. By attending this presentation and/or reviewing the slides you agree to be bound by the following conditions.
This presentation is for information purposes only and does not constitute an offer to sell or the solicitation of an offer to buy shares in Anglo American. Further, it does not
constitute a recommendation by Anglo American or any other party to sell or buy shares in Anglo American or any other securit ies. All written or oral forward-looking statements
attributable to Anglo American or persons acting on their behalf are qualified in their entirety by these cautionary statements.
Forward-Looking Statements
This presentation includes forward-looking statements. All statements other than statements of historical facts included in this presentation, including, without limitation, those
regarding Anglo American’s financial position, business, acquisition and divestment strategy, plans and objectives of management for future operations (including development
plans and objectives relating to Anglo American’s products, production forecasts and reserve and resource positions), are forward-looking statements. By their nature, such
forward-looking statements involve known and unknown risks, uncertainties and other factors which may cause the actual results, performance or achievements of Anglo
American, or industry results, to be materially different from any future results, performance or achievements expressed or implied by such forward-looking statements.
Such forward-looking statements are based on numerous assumptions regarding Anglo American’s present and future business strateg ies and the environment in which
Anglo American will operate in the future. Important factors that could cause Anglo American’s actual results, performance or achievements to differ materially from those in the
forward-looking statements include, among others, levels of actual production during any period, levels of global demand and commodity market prices, mineral resource
exploration and development capabilities, recovery rates and other operational capabilities, the availability of mining and processing equipment, the ability to produce and
transport products profitably, the impact of foreign currency exchange rates on market prices and operating costs, the availability of sufficient credit, the effects of inflation, political
uncertainty and economic conditions in relevant areas of the world, the actions of competitors, activities by governmental authorities such as changes in taxation or safety, health,
environmental or other types of regulation in the countries where Anglo American operates, conflicts over land and resource ownership rights and such other risk factors identified
in Anglo American’s most recent Annual Report. Forward-looking statements should, therefore, be construed in light of such risk factors and undue reliance should not be placed
on forward-looking statements. These forward-looking statements speak only as of the date of this presentation. Anglo American expressly disclaims any obligation or undertaking
(except as required by applicable law, the City Code on Takeovers and Mergers (the “Takeover Code”), the UK Listing Rules, the Disclosure and Transparency Rules of the
Financial Conduct Authority, the Listings Requirements of the securities exchange of the JSE Limited in South Africa, the SWX Swiss Exchange, the Botswana Stock Exchange
and the Namibian Stock Exchange and any other applicable regulations) to release publicly any updates or revisions to any forward-looking statement contained herein to reflect
any change in Anglo American’s expectations with regard thereto or any change in events, conditions or circumstances on which any such statement is based.
Nothing in this presentation should be interpreted to mean that future earnings per share of Anglo American will necessarily match or exceed its historical published earnings
per share.
Certain statistical and other information about Anglo American included in this presentation is sourced from publicly available third party sources. As such it presents the views of
those third parties, but may not necessarily correspond to the views held by Anglo American.
No Investment Advice
This presentation has been prepared without reference to your particular investment objectives, financial situation, taxation position and particular needs. It is important that you
view this presentation in its entirety. If you are in any doubt in relation to these matters, you should consult your stockbroker, bank manager, solicitor, accountant, taxation adviser
or other independent financial adviser (where applicable, as authorised under the Financial Services and Markets Act 2000 in the UK, or in South Africa, under the Financial
Advisory and Intermediary Services Act 37 of 2002).
THE NEW
ANGLO AMERICAN
Mark Cutifani

4
THE NEW ANGLO AMERICAN
CORE PORTFOLIO of De Beers, PGMs and Copper…
Global leadership in diamonds and platinum and a high quality copper business.
World class suite of assets.
FREE cash flow POSITIVE IN 2016 at spot prices and FX…
Planned $1.9bn of cost and business improvements vs 2015.
Forecast $4.8bn Group EBITDA at spot.
NON-CORE PORTFOLIO of Bulks and other minerals managed for cash or disposal…
Targeting $3-$4bn in disposal proceeds in 2016.
Tier 1 assets will attract value.
NET DEBT target < $10bn by end 2016…
Targeting Net debt/EBITDA ratio of less than 2.5x.
Medium term net debt target ~$6bn achieved through cash flow and further disposals.

5
OUR CORE BUSINESS
Relative earnings contributions driven by scale and quality…
…and simplification supports overheads and further support cost reductions.
Platinum
De Beers
Coal - South Africa (2)
Niobium & Phosphates
Coal - Australia
Cerrejón
2015 Revenue ($bn)
CopperSamancor Kumba
Nickel
2015 EBITDA ($bn)
Cu.Eq Production 250kt
(1) Barro Alto, BVFR and Minas-Rio were commissioning and therefore capitalised during 2015
(2) Cu equivalent production shown for Export thermal coal only.
(3) Pro forma based on actual 2015 results. Excludes impact of non-equity owned diamond sales at De Beers and platinum ounces.
Core portfolioCurrent portfolio
30%
+30%
23%
23%
2015 EBITDA Margin (%)(3)
2015 EBITDA vs. Revenue ($bn)(1) QUALITY ASSETS
Long life, low cost and scalable.
Step change in EBITDA margin for core.
Sustainably free cash flow positive.
UNIQUE END MARKET EXPOSURE
Consumer exceeds infrastructure exposure.
Attractive long term end market growth potential.
SIMPLIFICATION
Accelerating overhead and support cost
reductions.
Asset concentration provides leverage for
business improvement programs.
Critical mass supports effective financing and
technical requirements.
6
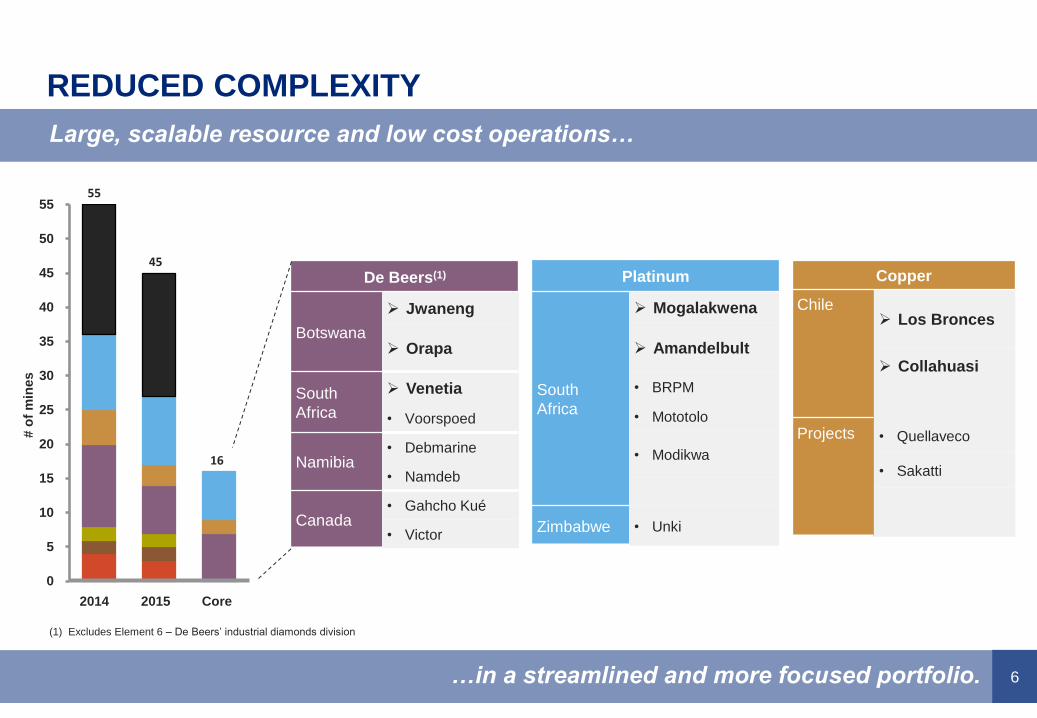
REDUCED COMPLEXITY
Large, scalable resource and low cost operations…
…in a streamlined and more focused portfolio.
0
5
10
15
20
25
30
35
40
45
50
55
20152014
55
16
45
Core
De Beers(1)
Botswana
Jwaneng
Orapa
South
Africa
Venetia
• Voorspoed
Namibia• Debmarine
• Namdeb
Canada• Gahcho Kué
• Victor
Platinum
South
Africa
Mogalakwena
Amandelbult
• BRPM
• Mototolo
• Modikwa
Zimbabwe • Unki
# o
f m
ines
Copper
Chile Los Bronces
Collahuasi
Projects • Quellaveco
• Sakatti
(1) Excludes Element 6 – De Beers’ industrial diamonds division

7
CORE BUSINESS PROFILE - PEOPLE
Focus on fewer, but larger, more productive assets…
Central and global support costs ($m) (3)
(1) Excluding associates’ and joint ventures’ employees
(2) Includes direct and indirect headcount.
(3) London and Johannesburg, before recharges to Business Units
…delivers significantly lower headcount and overhead costs.
>$250m
Core portfolio
$<250m
Current portfolio
$500m
Chief ExecutiveMark Cutifani
De BeersPhilippe Mellier
PlatinumChris Griffith
CopperDuncan Wanblad
BulksSeamus French
Bulks managed for cash or disposal.
Focus on technical and operating efficiencies.
Overheads and support functions streamlined.
Organisational structure Total headcount (‘000s) (1)(2)
128
68
50
Disposals CoreEnd 2015 Restructure
10
SUPPORT FUNCTIONS
(Streamlined and focussed on higher level capable support)
MARKETING

8
DE BEERS
Industry leadership across the pipeline…
Diamond mining industry margin curve
Global polished diamond demand (2014)
1.2
30%10% 40%
0.8
0.0
80%60% 70%
0.2
100%90%
0.6
0.4
50%
1.0
20%0%
Ratio o
f C
1 c
osts
to r
evenue
Source: De Beers (projected 2020 cost curve)
De Beers Assets
…and we will continue to improve costs and margins as the market recovers.
ROW
21%
Middle East
USA
16%
8%
China (1)
5%Japan
India
8%
42%
(1) China includes Hong Kong/Macau
UPSTREAM LEADERSHIP
Best-in-class mining assets – large, long life with
scalable production and low cost.
Strong government partnerships – Botswana
and Namibia.
Ability to respond proactively to conditions in both
the mid and downstream markets.
MID AND DOWNSTREAM POSITION
Attractive longer term supply/demand fundamentals.
Proven marketing ability and deep consumer
insights.
Strong brand recognition and premium on products.
Broad exposure to consumer markets.
Element 6 – leading industrial diamonds business.

9
PLATINUM
PLATINUM LEADERSHIP
The Tier 1 portfolio of platinum assets.
Mogalakwena lowest cost dedicated producer.
Scalable production base with long life.
BROAD BASED DEMAND
End use dominated by consumer sectors.
Benefit from increased emissions control legislation.
Largest in Chinese bridal jewellery market.
Industrial demand diversified across chemicals,
glass and electronics.
We are the leading PGM company and moving further down the cost curve…
…with a renewed focus on capital discipline, productivity and costs.
1. Pd, Rh, Au, Cu and Ni revenues netted off operating costs + SIB capital
2. Source: Anglo American Platinum
3. Excludes Pd outflow from investment of 663koz
By-product
Pt production (koz)
Net
cash
co
st
(US
$/P
t o
z)
AAP Mines/JVs for exit
Mogalakwena
Mototolo
BR
PM
Unki
Am
andelb
ult
Modikwa
26%
43%
26%5%
Autocatalyst Industrial JewelleryInvestment
23%
75%
2%
Platinum net cash cost curve – 2015 (1)
Platinum end use (2) Palladium end use (2)(3)

10
0.5
0.6
0.7
0.8
2012 2014 2016 2018 2020
COPPER
Highly competitive position in copper…
…that will continue to enhance as we improve and build off our resource positions.
Top 10 Producing Mines (2015 Cu kt) WORLD CLASS ASSETS
Attractive combination of scale, life and cost positions.
Extensive high-quality resources underpin substantial
organic growth opportunities.
Long-term growth options in Quellaveco.
Sakatti, high grade, polymetallic resource.
ATTRACTIVE MARKET FUNDAMENTALS
Copper market forecast to be in structural deficit in
medium term.
Industry capacity is at “stretch” and continues to
disappoint on the downside.
We will maintain our capital discipline to support cash
flow and returns.
Escondida
Los Pelambres
Chuquicamata
Collahuasi
Los Bronces
El Teniente
Morenci
Buenavista
Grasberg
Antamina
Source: Wood Mackenzie, Anglo American analysis.
Source: Wood
Mackenzie copper long-
term outlook Q4 2015
Declining global ore grade
28%
11%
19%
Electrical
networks
12%
Industrial
Consumer
Transport
Construction
30%
Copper demand
Av. Head Grade
%

11
CORE BUSINESS PROFILE – A UNIQUE EXPOSURE
Our core assets have a greater exposure to consumer end markets…
Core EBITDA by commodity (pro forma 2016)
…and present a more balanced commodity and geographic exposure.
31%
42%
27%
Platinum
Copper
Diamonds
Core revenue by destination (pro forma 2016) (1)
RoW
14%
North America
EU
17% China
29%
19%
Other Asia
21%
Demand drivers
Pro forma 2016 EBITDA
12%
13%
9%
46%78%
26%
13%
Current Portfolio
3%
Core Portfolio
FoodConsumerInfrastructure EnergyIndustrial
(1) End-user, not Anglo American customers

NON-CORE ASSETS
AND BALANCE SHEET
René Médori
13
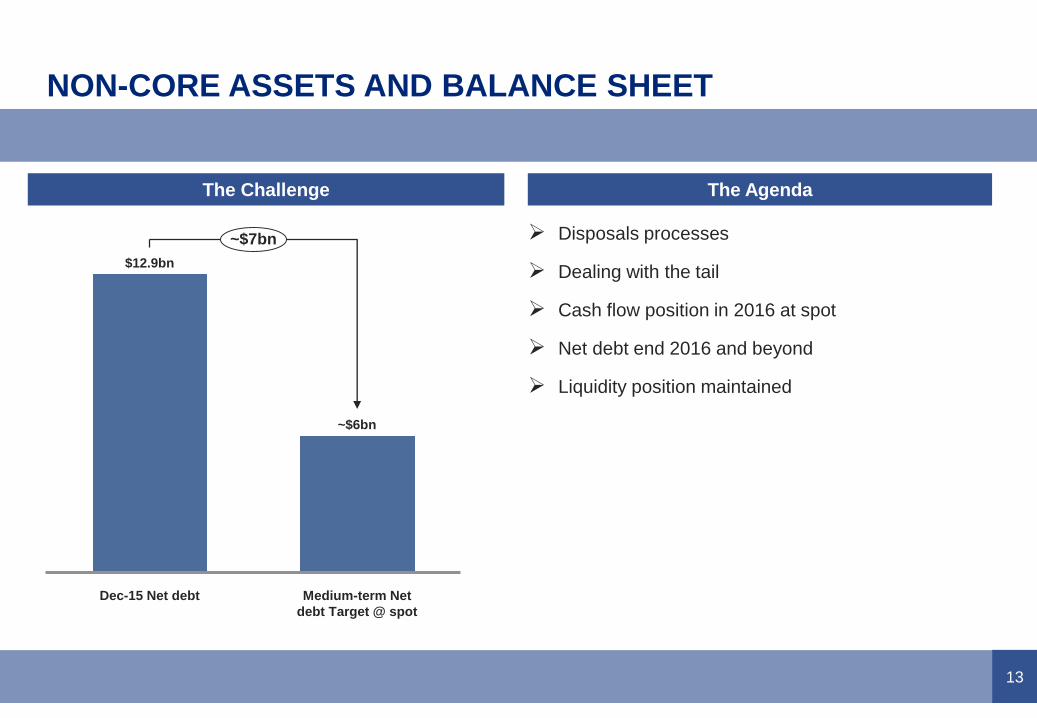
NON-CORE ASSETS AND BALANCE SHEET
Disposals processes
Dealing with the tail
Cash flow position in 2016 at spot
Net debt end 2016 and beyond
Liquidity position maintained
The Challenge The Agenda
Medium-term Net
debt Target @ spot
~$6bn
Dec-15 Net debt
$12.9bn
~$7bn
14
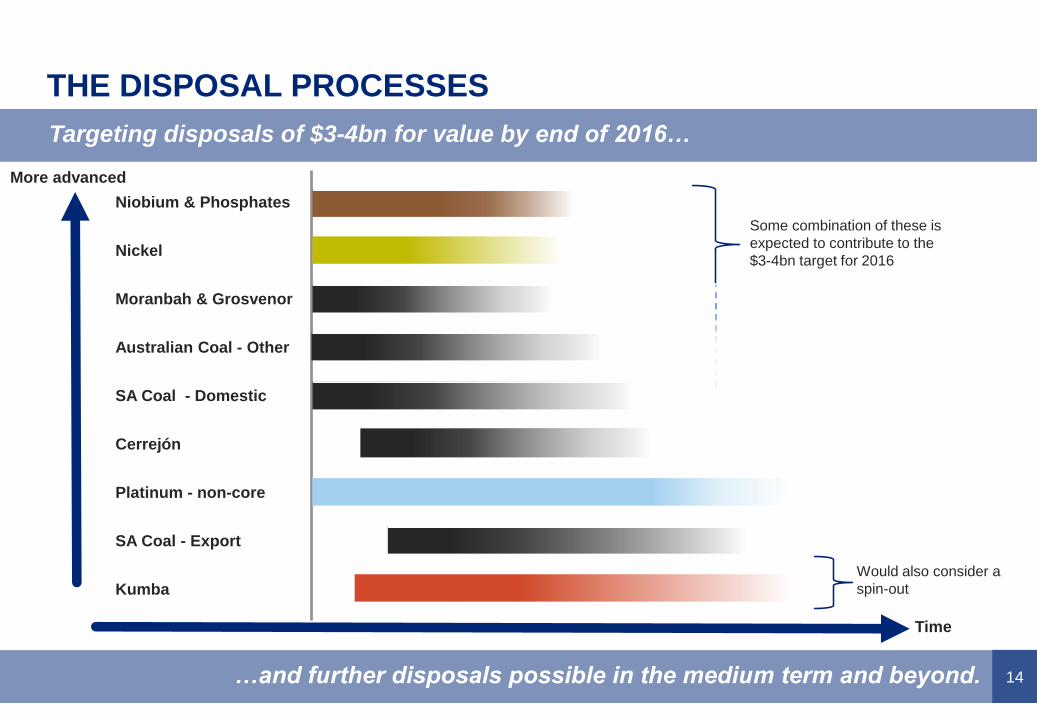
THE DISPOSAL PROCESSES
Targeting disposals of $3-4bn for value by end of 2016…
…and further disposals possible in the medium term and beyond.
Platinum - non-core
SA Coal - Domestic
Moranbah & Grosvenor
Nickel
Niobium & Phosphates
Australian Coal - Other
Cerrejón
Kumba
SA Coal - Export
More advanced
Some combination of these is
expected to contribute to the
$3-4bn target for 2016
Would also consider a
spin-out
Time

15
DEALING WITH THE TAIL
Action plans in place for negative free cash flow assets…
…either close, restructure or sell.
Sale
Callide Sale announced.
Dawson Process underway.
Foxleigh Process underway.
Closure /
C&M
PRC Placed on care and maintenance.
Thabazimbi Closure underway.
Snap Lake Placed on care and maintenance.
Twickenham Plans initiated for care and maintenance.
Restructure
CapCoal Restructuring with view of sale.
El Soldado Revised mine plan and headcount reductions.
Ramp-up Minas-Rio Project ramp-up underway.
Core
Non Core
Close / C&M / Sale
(1) Based on 10 February spot pricing, where operating free cash flow = EBITDA less SIB Capex & Capital Stripping
Assets – operating free cash flow 2016F (1)

16
0.4
0.0
(1.0)
0.3
2016: Latest view
0.2
Further capex
reduction
0.2
Working capital
improvement
Taxes
$1.0bn
Cash flow post
improvements
EBIT improvement
0.8
2016: As at Investor
Day
Price and FX at spot
INCREMENTAL CASH FLOW IMPROVEMENT IN 2016
$1bn additional cash flow identified…
…and we expect to be cash flow positive in 2016.
2016 free cash flow ($bn)
Cash flow improvement initiatives
$0.8bn EBIT benefit:
0.3
Costs
0.5
Volume
$0.6bn
$0.5bnNon-core
Core
Note: differences are due to rounding to nearest $0.1bn.
17
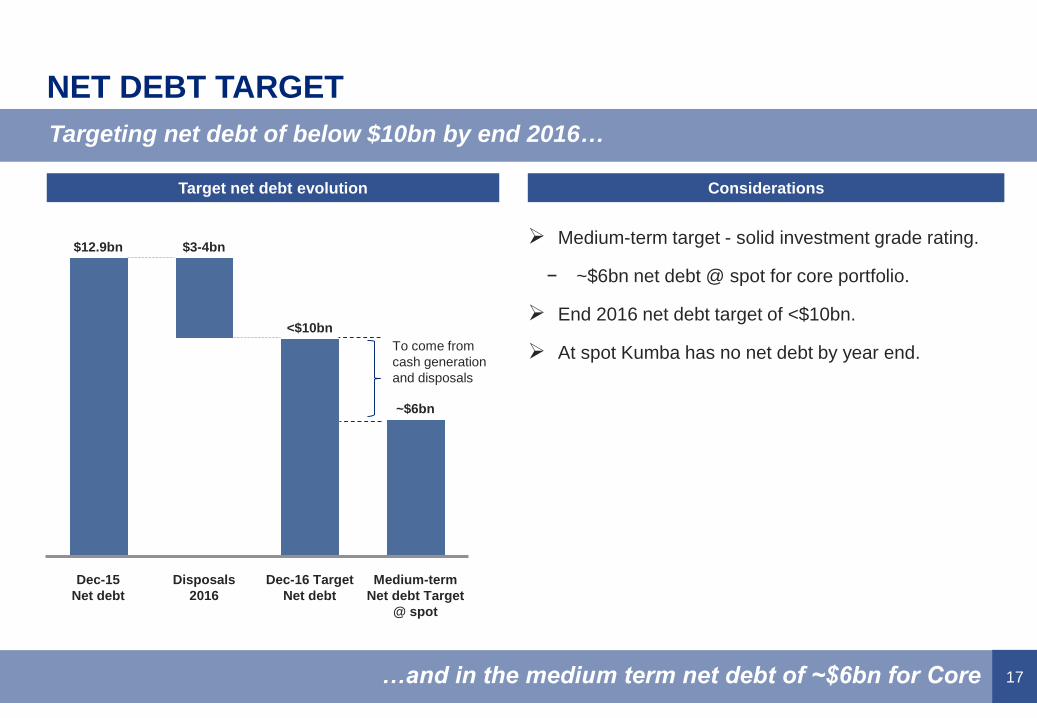
NET DEBT TARGET
Targeting net debt of below $10bn by end 2016…
…and in the medium term net debt of ~$6bn for Core
Target net debt evolution Considerations
Medium-term target - solid investment grade rating.
− ~$6bn net debt @ spot for core portfolio.
End 2016 net debt target of <$10bn.
At spot Kumba has no net debt by year end.
Disposals
2016
~$6bn
Dec-16 Target
Net debt
<$10bn
Medium-term
Net debt Target
@ spot
$3-4bn
Dec-15
Net debt
$12.9bn
To come from
cash generation
and disposals
18
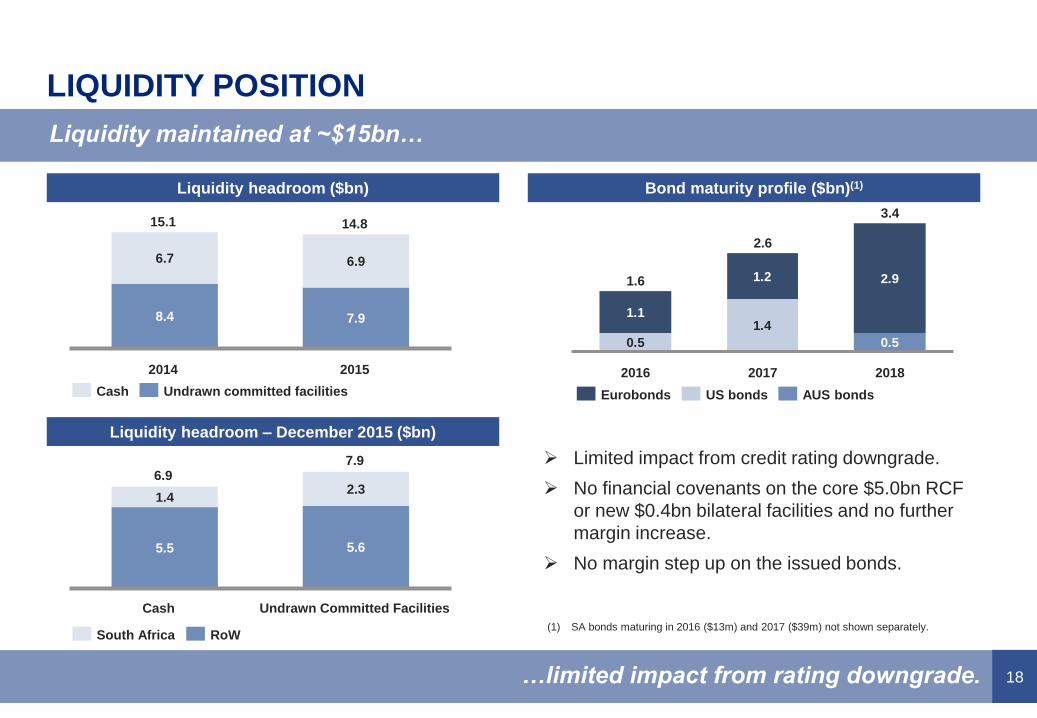
LIQUIDITY POSITION
Liquidity maintained at ~$15bn…
…limited impact from rating downgrade.
Liquidity headroom ($bn) Bond maturity profile ($bn)(1)
8.4 7.9
6.7 6.9
20152014
15.1 14.8
Cash Undrawn committed facilities
0.5
1.4
2.9
0.5
1.2
1.1
2018
3.4
2.6
2017
1.6
2016
Eurobonds US bonds AUS bonds
5.5 5.6
1.42.3
Cash
6.9
Undrawn Committed Facilities
7.9
RoWSouth Africa
Liquidity headroom – December 2015 ($bn)
Limited impact from credit rating downgrade.
No financial covenants on the core $5.0bn RCF
or new $0.4bn bilateral facilities and no further
margin increase.
No margin step up on the issued bonds.
(1) SA bonds maturing in 2016 ($13m) and 2017 ($39m) not shown separately.
FULL YEAR RESULTS
2015 – OPERATING
PERFORMANCE
Mark Cutifani
20
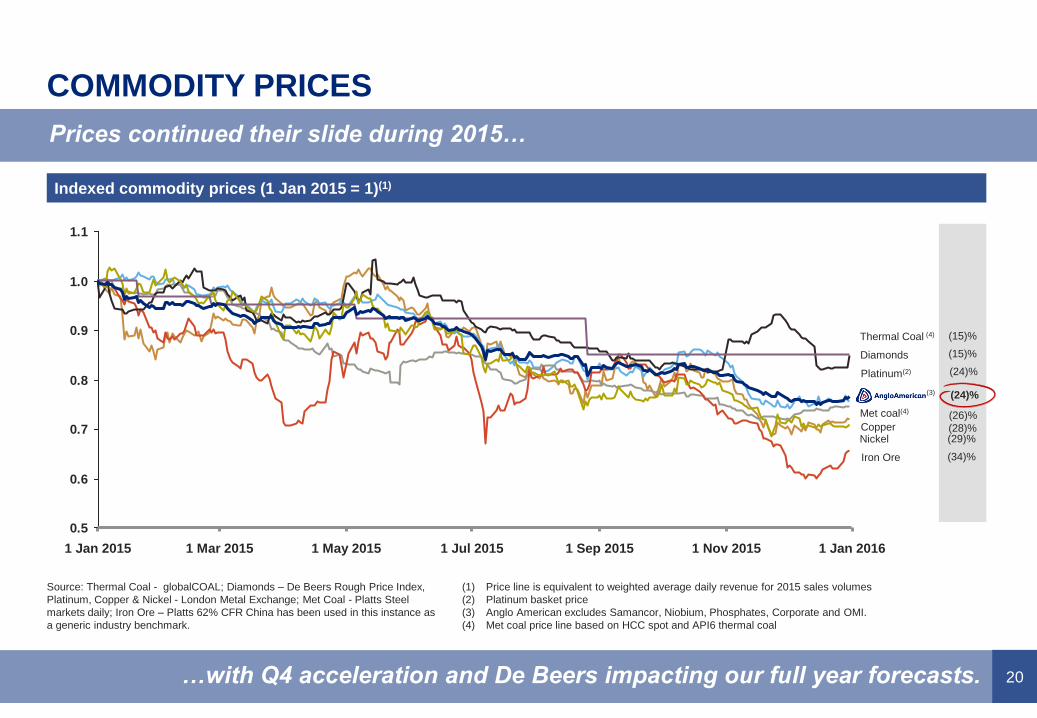
COMMODITY PRICES
Prices continued their slide during 2015…
…with Q4 acceleration and De Beers impacting our full year forecasts.
Indexed commodity prices (1 Jan 2015 = 1)(1)
0.5
0.6
0.7
0.8
0.9
1.0
1.1
1 Jul 2015 1 Sep 2015 1 Jan 20161 May 20151 Jan 2015 1 Nov 20151 Mar 2015
Diamonds
Nickel
Platinum(2)
Met coal(4)
Iron Ore
Thermal Coal (4)
Copper
(15)%
(15)%
(28)%(29)%
(34)%
(26)%
(24)%
Source: Thermal Coal - globalCOAL; Diamonds – De Beers Rough Price Index,
Platinum, Copper & Nickel - London Metal Exchange; Met Coal - Platts Steel
markets daily; Iron Ore – Platts 62% CFR China has been used in this instance as
a generic industry benchmark.
(1) Price line is equivalent to weighted average daily revenue for 2015 sales volumes
(2) Platinum basket price
(3) Anglo American excludes Samancor, Niobium, Phosphates, Corporate and OMI.
(4) Met coal price line based on HCC spot and API6 thermal coal
(3) (24)%
21
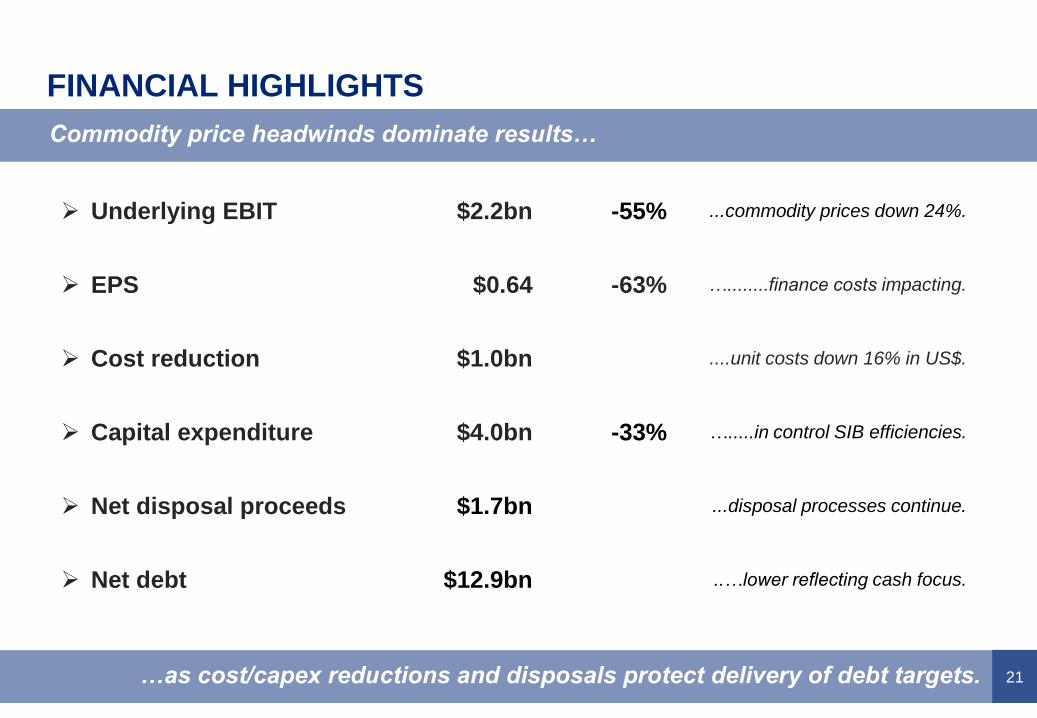
FINANCIAL HIGHLIGHTS
Commodity price headwinds dominate results…
…as cost/capex reductions and disposals protect delivery of debt targets.
Underlying EBIT $2.2bn -55% ...commodity prices down 24%.
EPS $0.64 -63% …........finance costs impacting.
Cost reduction $1.0bn ....unit costs down 16% in US$.
Capital expenditure $4.0bn -33% ….....in control SIB efficiencies.
Net disposal proceeds $1.7bn ...disposal processes continue.
Net debt $12.9bn ..…lower reflecting cash focus.

22
SAFETY AND ENVIRONMENT
SAFETY
Best safety performance in a full production year.
Q4 fatality free – 1 fatal incident in H2.
Modernisation strategy will support ongoing broad-
based safety improvement.
Focus on workforce engagement through major
restructuring remains key risk to manage.
ENVIRONMENT
Improvements reflect operations planning and
associated attention to detail.
Water management becoming a key challenge
across most jurisdictions.
We have rigorous JV safety, technical and social
controls and approaches.
Our performance improvement is led by people…for people…
…delivering on our commitment to employees and community.
6
2014
15
2013
30
2012 2015
22
2011
27
Copper IOB
NNP KIOCoal
Platinum
De BeersOMI
Exploration
Environmental incidents (levels 3 to 5)(1)
(1) Environmental incidents are classified in terms of a 5-level severity rating. Incidents with medium,
high and major impacts, as defined by standard internal definitions, are reported as level 3-5 incidents.
127 6 3
13
17
2011 2015
2
6
2014
6
2013
15
2012
Loss of life (by business)

23
OPERATING PERFORMANCE – PRODUCTION
Modest increase despite continuing cost focus and asset level restructuring…
…as downsizing supports underlying efficiency improvements.
De Beers
(19)%
(12)%
Nickel
(3)%
25%
Met CoalSA export coal &
Cerrejón
1%
5%
Platinum(3) Group TotalIron Ore (2)
9%
(1)%
Copper (1)
FY 2015 versus FY 2014 (% change)
(1) Copper normalised for Anglo American Norte disposal.
(2) Includes Kumba and Minas-Rio (dry basis).
(3) (3)% if adjusted for 2014 strike
24
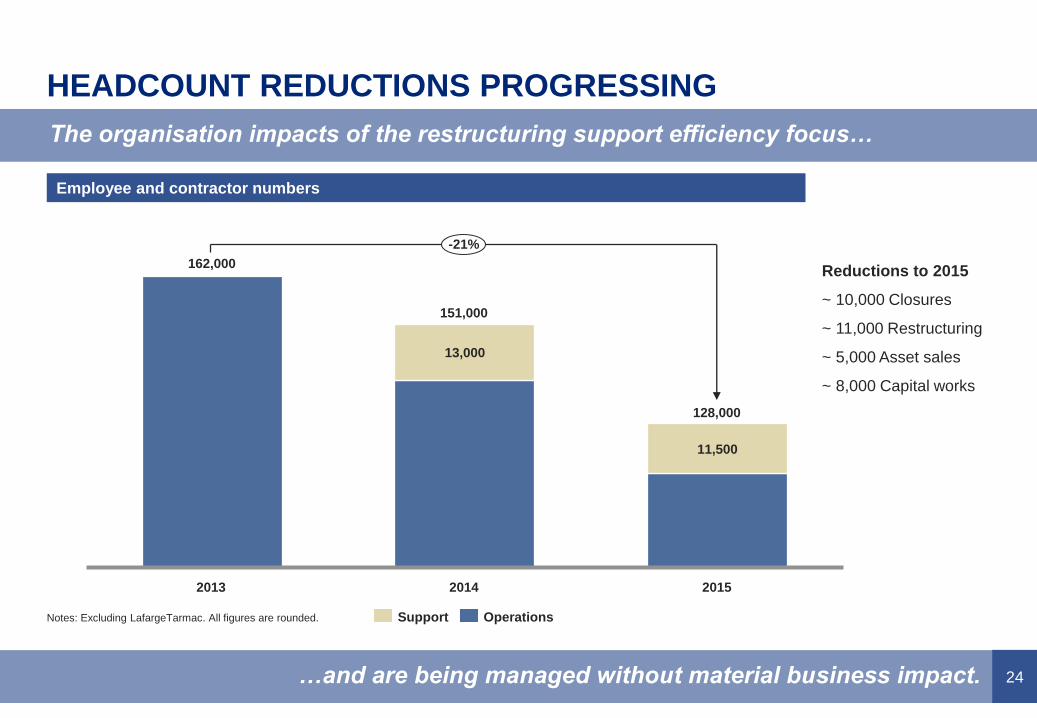
HEADCOUNT REDUCTIONS PROGRESSING
The organisation impacts of the restructuring support efficiency focus…
…and are being managed without material business impact.
Employee and contractor numbers
Notes: Excluding LafargeTarmac. All figures are rounded.
162,000
13,000
11,500
151,000
-21%
128,000
20152013 2014
OperationsSupport
Reductions to 2015
~ 10,000 Closures
~ 11,000 Restructuring
~ 5,000 Asset sales
~ 8,000 Capital works

25
De BeersKumbaAustralia
Coal
(Export)
-23%
CopperSA Coal
(Export)
-13%
Platinum(3)
-28%
-9%
-6%
-9%
UNIT COSTS – SUPPORTED BY PRODUCTIVITY IMPROVEMENTS
Significant productivity improvements support cost reductions…
…with the forecast productivity improvements accelerating in 2016 and 2017.
(16%) average Cu equiv.
(US$)
(3) (10)% if adjusted for 2014 Platinum strike
73
120
40
60
80
100
120
140
2013 201520142012
Cu Equiv Unit Cost (USD) Index(2)
Cu Equiv Production Index(1)
Cu Equiv Productivity Index (t/FTE)
(1) Calculated using long-term consensus parameters. Excludes domestic / cost-plus
production. Pro forma production shown adjusted for Anglo American Norte
(2) Unit cost includes only AA’s equity share of De Beers and Platinum. Excludes associates
and assets not in commercial production. Calculated using long-term consensus prices.
2015 vs 2014 Unit cost varianceCu Equivalent production, unit cost & productivity
127 in Q4 2015
26
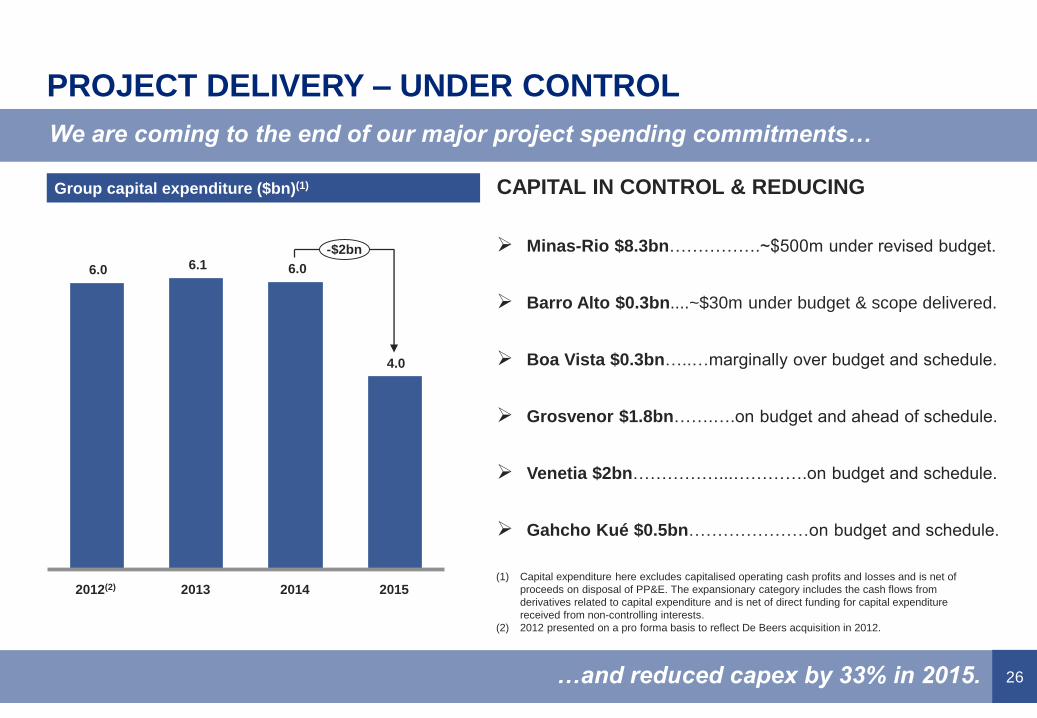
PROJECT DELIVERY – UNDER CONTROL
CAPITAL IN CONTROL & REDUCING
Minas-Rio $8.3bn…………….~$500m under revised budget.
Barro Alto $0.3bn....~$30m under budget & scope delivered.
Boa Vista $0.3bn…..…marginally over budget and schedule.
Grosvenor $1.8bn…….….on budget and ahead of schedule.
Venetia $2bn……………...………….on budget and schedule.
Gahcho Kué $0.5bn…………………on budget and schedule.
We are coming to the end of our major project spending commitments…
…and reduced capex by 33% in 2015.
Group capital expenditure ($bn)(1)
(1) Capital expenditure here excludes capitalised operating cash profits and losses and is net of
proceeds on disposal of PP&E. The expansionary category includes the cash flows from
derivatives related to capital expenditure and is net of direct funding for capital expenditure
received from non-controlling interests.
(2) 2012 presented on a pro forma basis to reflect De Beers acquisition in 2012.
6.0 6.1 6.0
4.0
-$2bn
2012(2) 201520142013

27
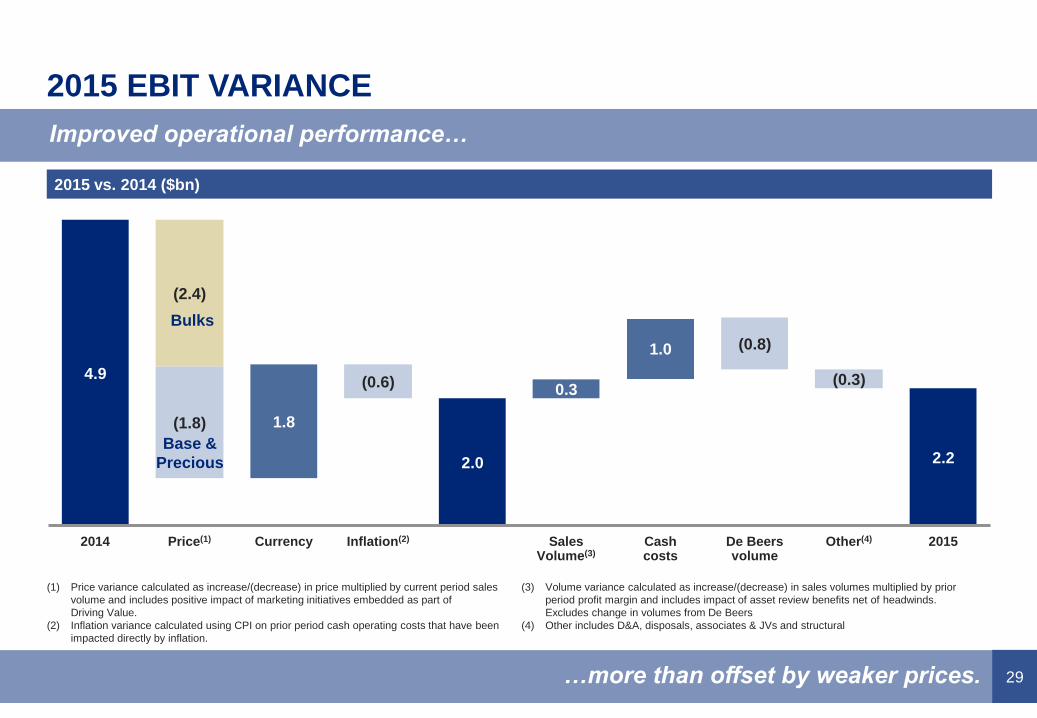
EBIT IMPROVEMENT IN 2015 AND BEYOND
We are now targeting $1.9bn of EBIT improvement in 2016…
…and maintain our 2017 target of $1bn in improvements.
Incremental EBIT improvement ($bn)
Note: any apparent differences are due to rounding to nearest $0.1bn.
0.7
3.4
0.3
1.0
0.8
1.2
1.0
De Beers 2015 volume2015 Improvements
Volume
1.3
Costs
2016 Improvement Target 2017 Improvement Target
1.9

FULL YEAR RESULTS
2015 – FINANCIALS
René Médori
29
(0.8)
2014 Cashcosts
Inflation(2)
(0.6)4.9
2015
2.2
Sales Volume(3)
Other(4)
(0.3)
1.0
0.3
Currency
1.8
Price(1)
(1.8)
(2.4)
De Beersvolume
2.0
2015 EBIT VARIANCE
Improved operational performance…
…more than offset by weaker prices.
Bulks
Base &
Precious
2015 vs. 2014 ($bn)
(1) Price variance calculated as increase/(decrease) in price multiplied by current period sales
volume and includes positive impact of marketing initiatives embedded as part of
Driving Value.
(2) Inflation variance calculated using CPI on prior period cash operating costs that have been
impacted directly by inflation.
(3) Volume variance calculated as increase/(decrease) in sales volumes multiplied by prior
period profit margin and includes impact of asset review benefits net of headwinds.
Excludes change in volumes from De Beers
(4) Other includes D&A, disposals, associates & JVs and structural
30
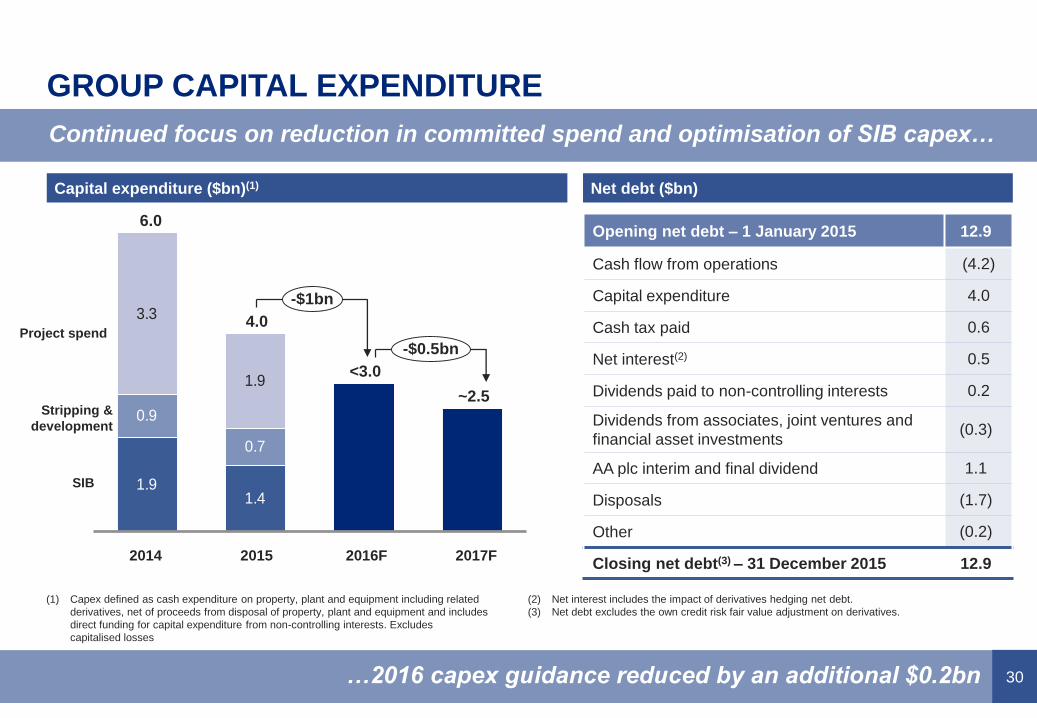
GROUP CAPITAL EXPENDITURE
Continued focus on reduction in committed spend and optimisation of SIB capex…
…2016 capex guidance reduced by an additional $0.2bn
Capital expenditure ($bn)(1)
Stripping &
development
Project spend
1.91.4
0.9
0.7
3.3
1.9
2015
-$1bn
-$0.5bn
~2.5
2017F
4.0
2016F2014
6.0
<3.0
SIB
Opening net debt – 1 January 2015 12.9
Cash flow from operations (4.2)
Capital expenditure 4.0
Cash tax paid 0.6
Net interest(2) 0.5
Dividends paid to non-controlling interests 0.2
Dividends from associates, joint ventures and
financial asset investments(0.3)
AA plc interim and final dividend 1.1
Disposals (1.7)
Other (0.2)
Closing net debt(3) – 31 December 2015 12.9
Net debt ($bn)
(1) Capex defined as cash expenditure on property, plant and equipment including related
derivatives, net of proceeds from disposal of property, plant and equipment and includes
direct funding for capital expenditure from non-controlling interests. Excludes
capitalised losses
(2) Net interest includes the impact of derivatives hedging net debt.
(3) Net debt excludes the own credit risk fair value adjustment on derivatives.
SUMMARY

32
DRIVING CHANGE…DEFINING OUR FUTURE
CORE PORTFOLIO of De Beers, PGMs and Copper…
Global leadership in diamonds and platinum and a high quality copper business.
World class suite of assets.
FREE cash flow POSITIVE IN 2016 at spot prices and FX…
Planned $1.9bn of cost and business improvements vs 2015.
Forecast $4.8bn Group EBITDA at spot.
NON-CORE PORTFOLIO of Bulks and other minerals managed for cash or disposal…
Targeting $3-$4bn in disposal proceeds in 2016.
Tier 1 assets will attract value
NET DEBT target < $10bn by end 2016…
Targeting Net debt/EBITDA ratio of less than 2.5x.
Medium term net debt target ~$6bn achieved through cash flow and further disposals.

APPENDIX
34
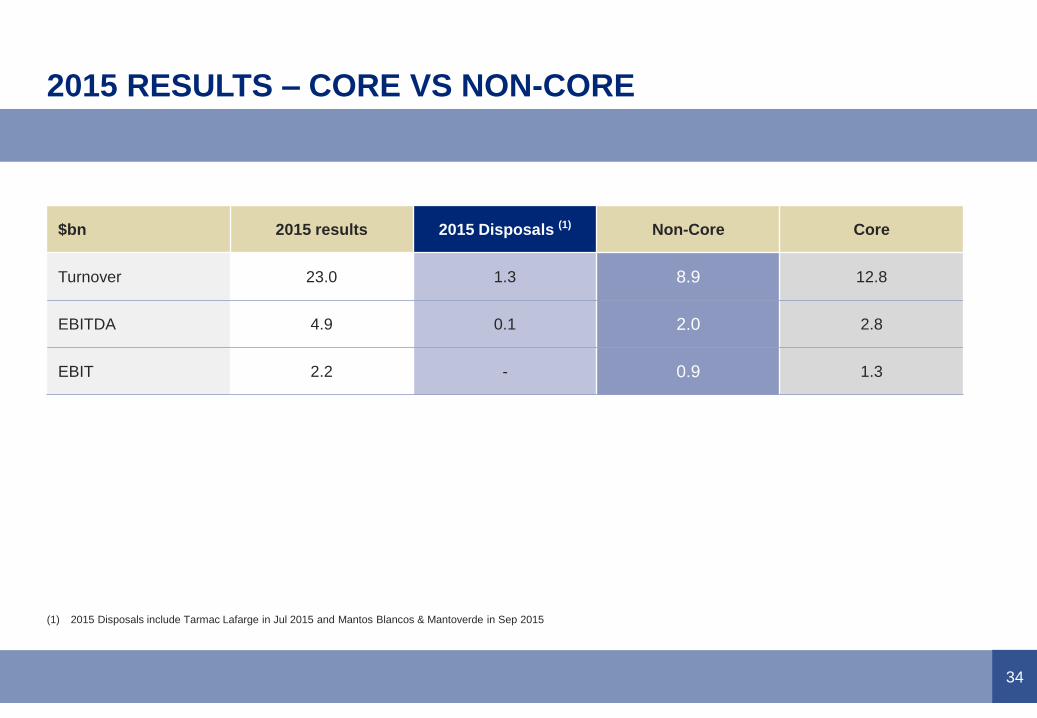
2015 RESULTS – CORE VS NON-CORE
$bn 2015 results 2015 Disposals (1) Non-Core Core
Turnover 23.0 1.3 8.9 12.8
EBITDA 4.9 0.1 2.0 2.8
EBIT 2.2 - 0.9 1.3
(1) 2015 Disposals include Tarmac Lafarge in Jul 2015 and Mantos Blancos & Mantoverde in Sep 2015
35
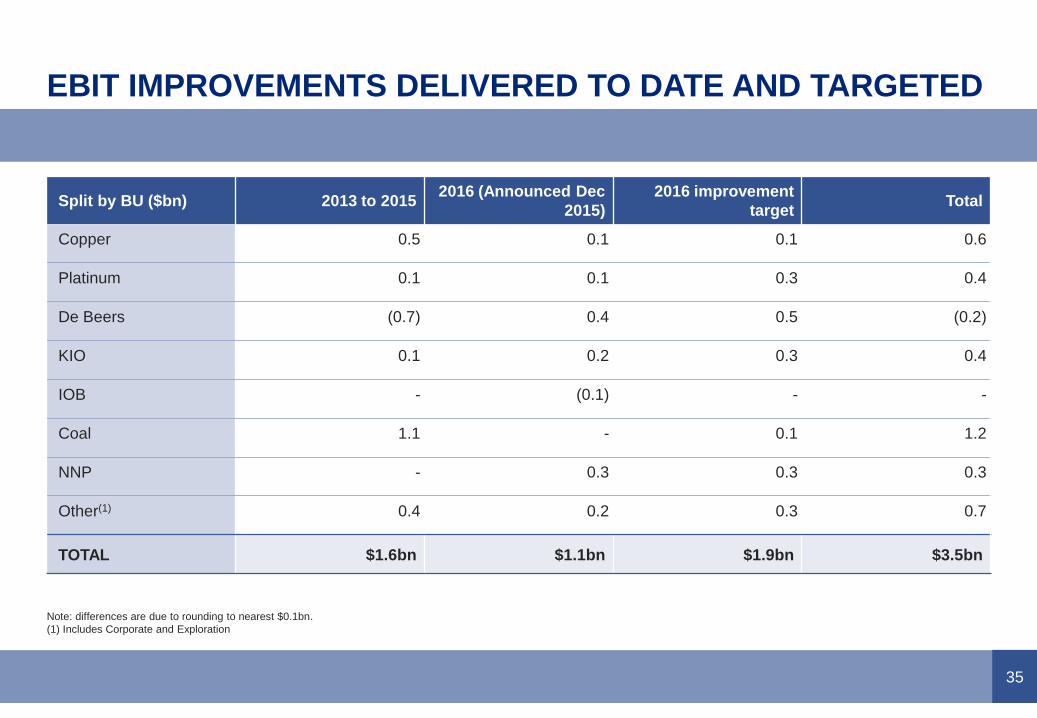
EBIT IMPROVEMENTS DELIVERED TO DATE AND TARGETED
Split by BU ($bn) 2013 to 20152016 (Announced Dec
2015)
2016 improvement
targetTotal
Copper 0.5 0.1 0.1 0.6
Platinum 0.1 0.1 0.3 0.4
De Beers (0.7) 0.4 0.5 (0.2)
KIO 0.1 0.2 0.3 0.4
IOB - (0.1) - -
Coal 1.1 - 0.1 1.2
NNP - 0.3 0.3 0.3
Other(1) 0.4 0.2 0.3 0.7
TOTAL $1.6bn $1.1bn $1.9bn $3.5bn
Note: differences are due to rounding to nearest $0.1bn.
(1) Includes Corporate and Exploration

36
OUR CORE ASSETS
COLLAHUASI (C1 USc/lb)
AMANDELBULT (US$/Pt oz)
JWANENG (US$/ct) ORAPA (US$/ct)
VENETIA (US$/ct) DBMN (US$/ct)
1,369 1,261
1,955
-8%
2016F20152012
149 158145
+6%
2016F20152012
142 128
190
2012
-10%
2016F2015
1,3821,219
1,894
20152012
-12%
2016F
33 30
46
2012
-9%
2016F2015
34
50
39
+47%
2016F20152012
80 7590
-6%
2016F20152012
235 230
289
2016F2015
-2%
2012
Notes: 2016 unit cost are shown on a nominal basis. Increase at Orapa reflects lower production to meet market demand. Increase in unit cost at Los Bronces (2015 to 2016) due to 20% reduction in grade and 8% increase in mine movement
LOS BRONCES (C1 USc/lb)
MOGALAKWENA
(US$/Pt oz)

37
PRODUCTION OUTLOOK(1)
2014 2015 2016F 2017F 2018F
Copper (2) 748kt 709kt 600-630kt 590-620kt 630-680kt
Nickel 37kt 30kt 45-47kt 42-45kt 45-47kt
Iron ore (Kumba)(3) 48Mt 45Mt ~39Mt ~40Mt ~40Mt
Iron ore (Minas-Rio) 0.7Mt 9Mt 15-18MtPreviously 18-21Mt
19-21MtPreviously 21-23Mt
22-24MtPreviously 26.5Mt
Metallurgical coal 21Mt 21Mt 21-22Mt 24-25Mt 23-24Mt
Thermal coal(4) 29Mt 28Mt 28-30Mt 28-30Mt 28-30Mt
Platinum(5) 1.9Moz 2.3Moz 2.3-2.4Moz 2.4-2.5Moz 2.5-2.6Moz
Diamonds(6) 33Mct 29Mct 26-28Mct
(1) All numbers are stated before impact of potential disposals.
(2) Copper business unit only. On a contained metal basis. Reflects impact of Anglo American Norte
disposal and closure of Collahuasi oxides (combined 40kt impact in 2015 and 120ktpa thereafter).
(3) Excluding Thabazimbi in 2014 and 2015.
(4) Export South Africa and Colombia.
(5) Produced ounces. Includes production from JOs and third parties.
(6) Includes 100% of volumes from JOs

38
HIGH QUALITY ASSETS WITH LONG LIFE
Note: For the detailed breakdown of Ore Reserve and Mineral Resource estimates (as at 31
December 2015) classification categories, please refer to the slide 39 & 40.
Mineral Resources are reported as additional to Ore Reserves. Diamond Resources are reported
as additional to Diamond Reserves.
LOM = Life of Mine (years) is based on scheduled Probable Reserves including some Inferred
Resources considered for Life of Mine planning.
Reserve Life = The scheduled extraction period in years for the total Ore Reserves in the
approved Life of Mine Plan.
Mogalakwena Reserve Life is truncated to the last year of current Mining Right.
De Beers Carats (Mc)
PGMs(4E Moz)
Copper(Mt – Tonnes)
#Life of Mine (Diamonds)
Reserve Life (PGMs & Copper)
1,598
3,123
1,332
4,213
6,855
1,523
CollahuasiLos Bronces Quellaveco
116
165
Mogalakwena
149 151
101
208
365
63
VenetiaOrapaJwaneng
20 14 31 25 70+25 29
Mineral Resource
estimates
Ore Reserve
estimates
39
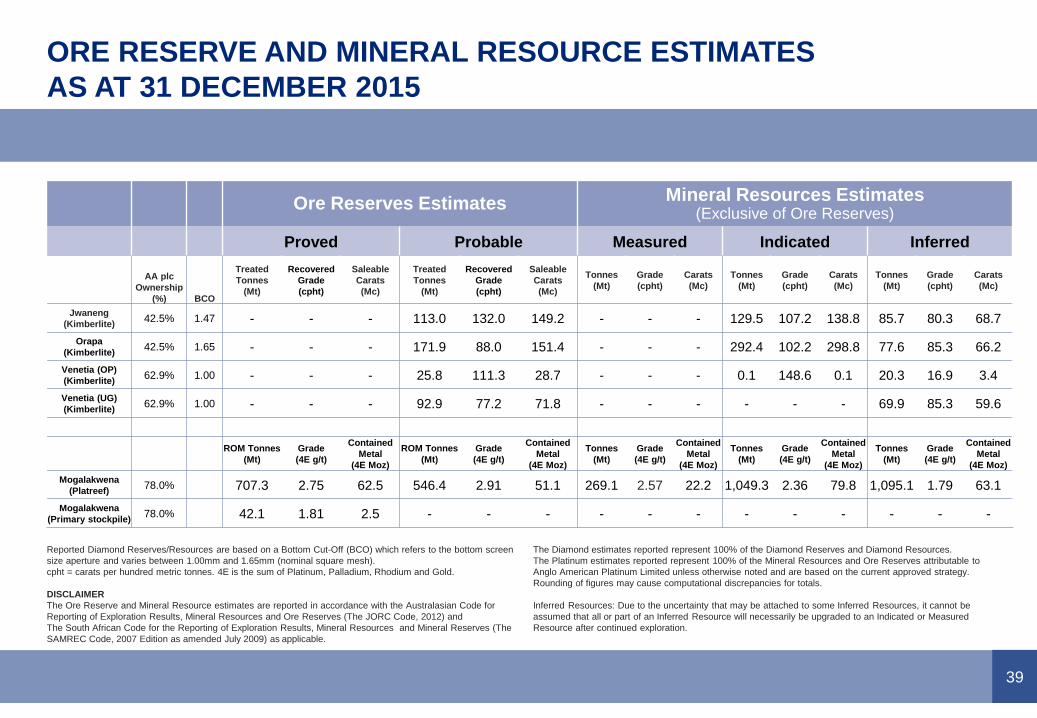
ORE RESERVE AND MINERAL RESOURCE ESTIMATES
AS AT 31 DECEMBER 2015
Reported Diamond Reserves/Resources are based on a Bottom Cut-Off (BCO) which refers to the bottom screen
size aperture and varies between 1.00mm and 1.65mm (nominal square mesh).
cpht = carats per hundred metric tonnes. 4E is the sum of Platinum, Palladium, Rhodium and Gold.
DISCLAIMER
The Ore Reserve and Mineral Resource estimates are reported in accordance with the Australasian Code for
Reporting of Exploration Results, Mineral Resources and Ore Reserves (The JORC Code, 2012) and
The South African Code for the Reporting of Exploration Results, Mineral Resources and Mineral Reserves (The
SAMREC Code, 2007 Edition as amended July 2009) as applicable.
The Diamond estimates reported represent 100% of the Diamond Reserves and Diamond Resources.
The Platinum estimates reported represent 100% of the Mineral Resources and Ore Reserves attributable to
Anglo American Platinum Limited unless otherwise noted and are based on the current approved strategy.
Rounding of figures may cause computational discrepancies for totals.
Inferred Resources: Due to the uncertainty that may be attached to some Inferred Resources, it cannot be
assumed that all or part of an Inferred Resource will necessarily be upgraded to an Indicated or Measured
Resource after continued exploration.
Ore Reserves Estimates Mineral Resources Estimates(Exclusive of Ore Reserves)
Proved Probable Measured Indicated Inferred
AA plc
Ownership
(%) BCO
Treated
Tonnes
(Mt)
Recovered
Grade
(cpht)
Saleable
Carats
(Mc)
Treated
Tonnes
(Mt)
Recovered
Grade
(cpht)
Saleable
Carats
(Mc)
Tonnes
(Mt)
Grade
(cpht)
Carats
(Mc)
Tonnes
(Mt)
Grade
(cpht)
Carats
(Mc)
Tonnes
(Mt)
Grade
(cpht)
Carats
(Mc)
Jwaneng
(Kimberlite)42.5% 1.47 - - - 113.0 132.0 149.2 - - - 129.5 107.2 138.8 85.7 80.3 68.7
Orapa
(Kimberlite)42.5% 1.65 - - - 171.9 88.0 151.4 - - - 292.4 102.2 298.8 77.6 85.3 66.2
Venetia (OP)
(Kimberlite)62.9% 1.00 - - - 25.8 111.3 28.7 - - - 0.1 148.6 0.1 20.3 16.9 3.4
Venetia (UG)
(Kimberlite)62.9% 1.00 - - - 92.9 77.2 71.8 - - - - - - 69.9 85.3 59.6
ROM Tonnes
(Mt)
Grade
(4E g/t)
Contained
Metal
(4E Moz)
ROM Tonnes
(Mt)
Grade
(4E g/t)
Contained
Metal
(4E Moz)
Tonnes
(Mt)
Grade
(4E g/t)
Contained
Metal
(4E Moz)
Tonnes
(Mt)
Grade
(4E g/t)
Contained
Metal
(4E Moz)
Tonnes
(Mt)
Grade
(4E g/t)
Contained
Metal
(4E Moz)
Mogalakwena
(Platreef)78.0% 707.3 2.75 62.5 546.4 2.91 51.1 269.1 2.57 22.2 1,049.3 2.36 79.8 1,095.1 1.79 63.1
Mogalakwena
(Primary stockpile)78.0% 42.1 1.81 2.5 - - - - - - - - - - - -

40
ORE RESERVE AND MINERAL RESOURCE ESTIMATES
AS AT 31 DECEMBER 2015
TCu = Total Copper.
DISCLAIMER
The Ore Reserve and Mineral Resource estimates are reported in accordance with the Australasian Code for
Reporting of Exploration Results, Mineral Resources and Ore Reserves (The JORC Code, 2012)
The Copper estimates reported represent 100% of the Ore Reserves and Mineral Resources.
Rounding of figures may cause computational discrepancies for totals
Inferred Resources: Due to the uncertainty that may be attached to some Inferred Resources, it cannot be
assumed that all or part of an Inferred Resource will necessarily be upgraded to an Indicated or Measured
Resource after continued exploration.
Ore Reserves Estimates Mineral Resources Estimates(Exclusive of Ore Reserves)
Proved Probable Measured Indicated Inferred
AA plc
Ownership
(%)
ROM Tonnes
(Mt)
Grade
(%TCu)
Contained
Copper
(kt)
ROM Tonnes
(Mt)
Grade
(%TCu)
Contained
Copper
(kt)
Tonnes
(Mt)
Grade
(%TCu)
Contained
Copper
(kt)
Tonnes
(Mt)
Grade
(%TCu)
Contained
Copper
(kt)
Tonnes
(Mt)
Grade
(%TCu)
Contained
Copper
(kt)
Los Bronces
(Flotation)50.1% 673.7 0.61 4,109 536.4 0.54 2,897 500.8 0.40 2,003 2,026.7 0.43 8,715 1,639.3 0.39 6,350
Los Bronces
(Dump Leach)50.1% 310.8 0.34 1,057 76.8 0.28 215 - - - - - - 46.1 0.28 129
Collahuasi
(Heap Leach)44.0% 15.0 0.63 95 15.0 0.73 110 17.8 0.70 124 35.6 0.66 235 25.2 0.54 136
Collahuasi
(Flotation)44.0% 374.3 1.16 4,341 1,591.0 1.02 16,228 114.3 0.57 651 1,349.7 0.92 12,417 3,397.2 0.96 32,502
Collahuasi
(Flotation-
Stockpile)44.0% 126.8 0.52 660 1,000.8 0.49 4,904 72.9 0.33 241 389.1 0.41 1,595 1,453.5 0.45 6,568
Quellaveco
(Sulphide)81.9% 951.4 0.58 5,518 380.6 0.57 2,169 135.0 0.32 432 641.0 0.39 2,500 747.2 0.33 2,435
41
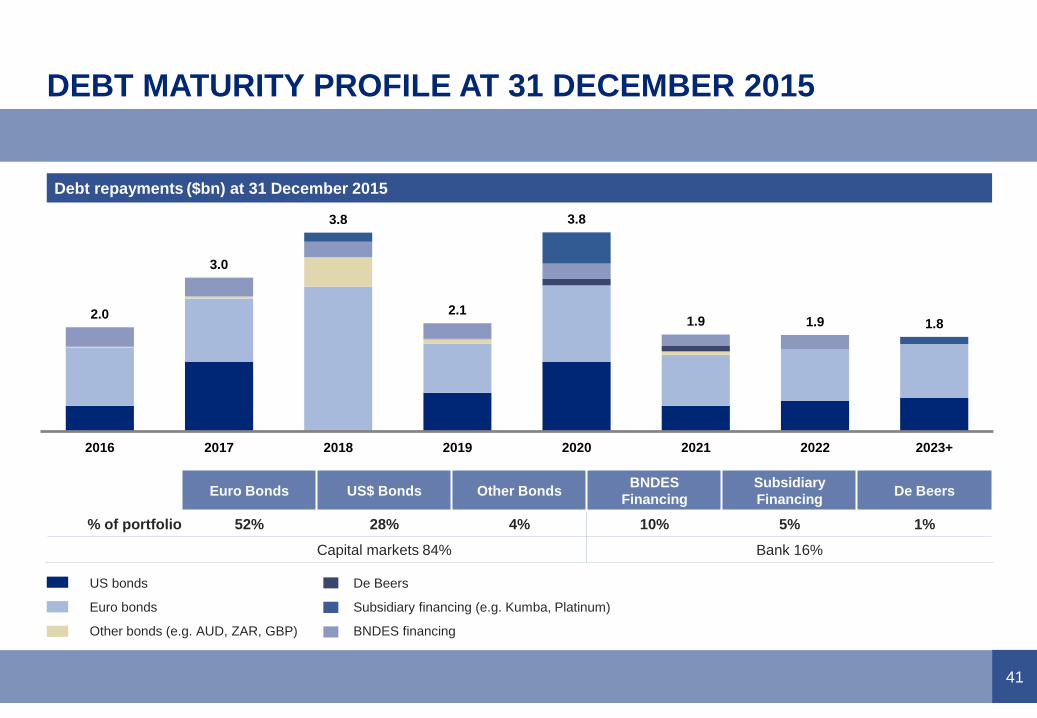
2.0
3.0
3.8
2.1
3.8
1.9 1.9 1.8
2016 2017 2018 2019 2020 2021 2022 2023+
DEBT MATURITY PROFILE AT 31 DECEMBER 2015
Euro Bonds US$ Bonds Other BondsBNDES
Financing
Subsidiary
FinancingDe Beers
% of portfolio 52% 28% 4% 10% 5% 1%
Capital markets 84% Bank 16%
Debt repayments ($bn) at 31 December 2015
US bonds
Euro bonds
Other bonds (e.g. AUD, ZAR, GBP)
De Beers
Subsidiary financing (e.g. Kumba, Platinum)
BNDES financing

42
PORTFOLIO CHANGES DELIVERED TO END 2015
Portfolio restructuring has progressed in a tough market…
…with 2015 disposals of ~$2.1bn - ahead of our original ~$1.5bn forecast.
Khomanani 1 - Rustenburg
Khomanani 2 - Rustenburg
Khuseleka 2 - Rustenburg
Twickenham shaft
Aquila
Union declines
Peace River Coal
Thabazimbi
Snap Lake
Damtshaa
Collahuasi oxides
Employees impacted ~13,000
Tarmac Building products
Tarmac Middle East
Lafarge-Tarmac JV
Mantoverde
Mantos Blancos
Kimberley mines
Dartbrook
Callide
Bathopele - Rustenburg
Siphumelele - Rustenburg
Thembelani - Rustenburg
Khuseleka - Rustenburg
Deals completed or announced
$2.1bn
Niobium & Phosphates
Dawson
Foxleigh
New Largo
New Vaal
New Denmark
Kriel
Isibonelo
Bokoni JV
Pandora JV
*Tarmac Building Products, Tarmac Middle East and Lafarge-Tarmac JV deals were signed in 2014
CLOSURES/C&M DISPOSALS -
COMPLETED/ANNOUNCED
DISPOSALS – ANNOUNCED
IN 2015
43
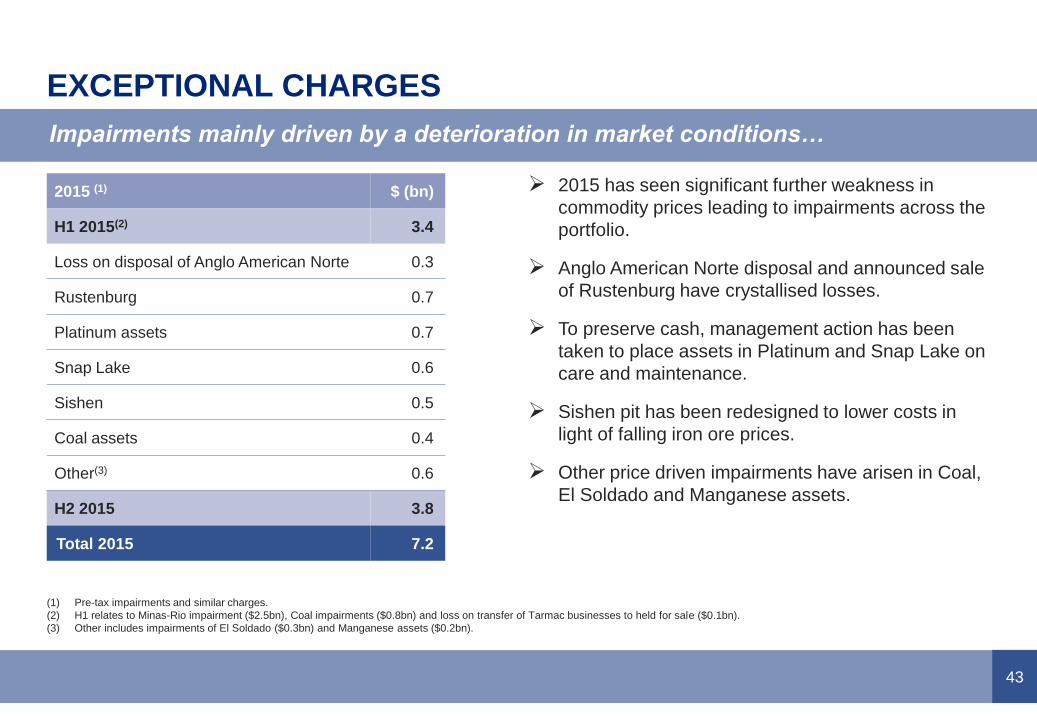
EXCEPTIONAL CHARGES
2015 has seen significant further weakness in
commodity prices leading to impairments across the
portfolio.
Anglo American Norte disposal and announced sale
of Rustenburg have crystallised losses.
To preserve cash, management action has been
taken to place assets in Platinum and Snap Lake on
care and maintenance.
Sishen pit has been redesigned to lower costs in
light of falling iron ore prices.
Other price driven impairments have arisen in Coal,
El Soldado and Manganese assets.
Impairments mainly driven by a deterioration in market conditions…
(1) Pre-tax impairments and similar charges.
(2) H1 relates to Minas-Rio impairment ($2.5bn), Coal impairments ($0.8bn) and loss on transfer of Tarmac businesses to held for sale ($0.1bn).
(3) Other includes impairments of El Soldado ($0.3bn) and Manganese assets ($0.2bn).
2015 (1) $ (bn)
H1 2015(2) 3.4
Loss on disposal of Anglo American Norte 0.3
Rustenburg 0.7
Platinum assets 0.7
Snap Lake 0.6
Sishen 0.5
Coal assets 0.4
Other(3) 0.6
H2 2015 3.8
Total 2015 7.2

44
2015 RESULTS
$bn 2015 2014 Change
Underlying EBITDA 4.9 7.8 ↓(38)%
Underlying EBIT 2.2 4.9 ↓(55)%
Effective tax rate (1) 31.0% 29.8% -
Underlying earnings 0.8 2.2 ↓(63)%
Earnings per share ($) 0.64 1.73 ↓(63)%
Capital expenditure(2) 4.0 6.0 ↓(33)%
Net debt 12.9 12.9 -
ROCE(3) 5% 9% -
Key financials Price variance 1 Jan to 31 Dec 2015(4)
(24)%
(1) Effective tax rate before special items and remeasurements including attributable share of
associates’ and joint ventures’ tax
(2) Excludes capitalised losses
(3) The new attributable ROCE measure allows a clearer link to the financial statements.
The comparative has been restated to align to the current period presentation
(4) Price line is equivalent to weighted average daily revenue for 2015 sales volumes
Iron
Ore
(28)%
Copper
(15)% (15)%
Thermal
Coal
Diamonds Nickel
(29)%
(34)%
(26)%
Met
Coal
Platinum
(24)%

45
EBIT BY BUSINESS UNIT
EBIT ($bn) 2015 2014 % var.
Platinum 263 32 722% Recovery post 2014 strike, lower overheads, offset by price.
De Beers 571 1,363 (58)% Lower sales volumes in response to market conditions.
Copper 228 1,193 (81)% Lower copper price, more than offset lower costs.
Nickel(1) (22) 21 (105)% Furnaces rebuilt during year.
Niobium & Phosphates(1) 119 124 (4)% Niobium plant expansion being ramped-up.
Kumba 739 1,911 (61)% Lower price, partly offset by increased export sales volume.
IOB(1) (21) (34) 38% Project in ramp-up.
Coal 457 458 - FX, cost reduction and sales volumes, offset by lower prices.
Corporate & other (111) (135) 18% Lower exploration expenditure and overhead reduction.
TOTAL 2,223 4,933 (55)%
(1) Barro Alto, BVFR and Minas-Rio were commissioning and therefore capitalised during 2015
46
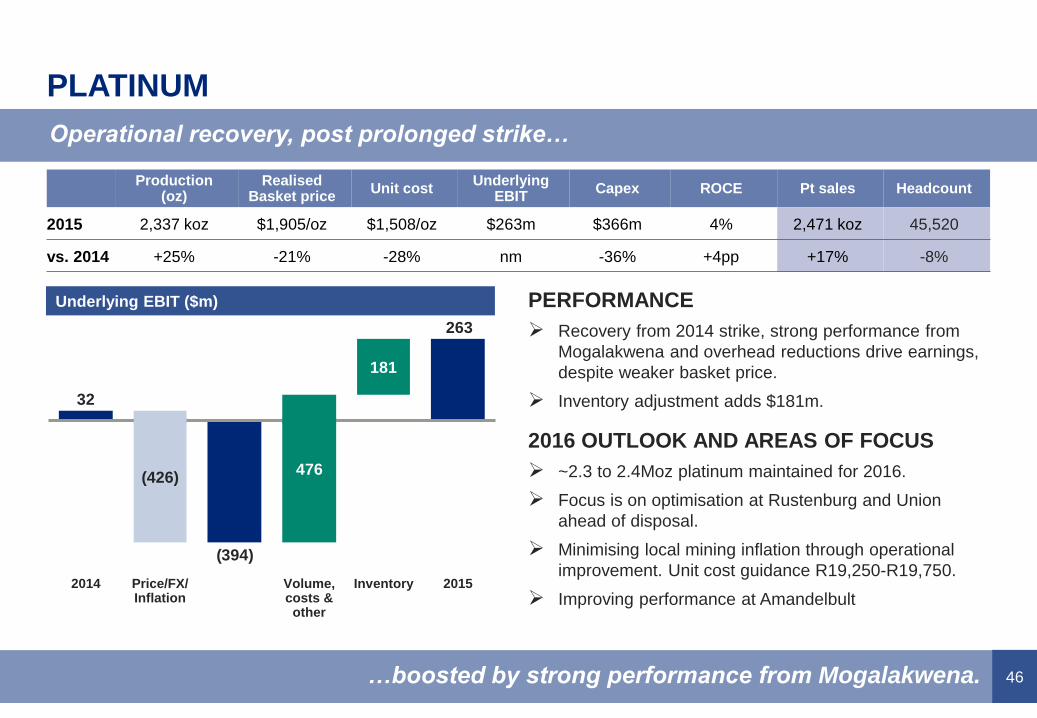
PLATINUM
PERFORMANCE
Recovery from 2014 strike, strong performance from
Mogalakwena and overhead reductions drive earnings,
despite weaker basket price.
Inventory adjustment adds $181m.
2016 OUTLOOK AND AREAS OF FOCUS
~2.3 to 2.4Moz platinum maintained for 2016.
Focus is on optimisation at Rustenburg and Union
ahead of disposal.
Minimising local mining inflation through operational
improvement. Unit cost guidance R19,250-R19,750.
Improving performance at Amandelbult
Operational recovery, post prolonged strike…
…boosted by strong performance from Mogalakwena.
263
(394)
32
181
476
2015Volume, costs & other
Price/FX/Inflation
(426)
2014 Inventory
Underlying EBIT ($m)
Production (oz)
Realised Basket price
Unit cost Underlying
EBITCapex ROCE Pt sales Headcount
2015 2,337 koz $1,905/oz $1,508/oz $263m $366m 4% 2,471 koz 45,520
vs. 2014 +25% -21% -28% nm -36% +4pp +17% -8%

47
DE BEERS
PERFORMANCE
Lower rough diamond sales volume and weaker price
index, partly offset by richer product mix.
Production reduced in response to weak trading
conditions.
2016 OUTLOOK AND PRIORITIES
Production guidance revised to 26-28Mct subject to
trading conditions.
$200m cash savings target.
Focus on Gahcho Kué completion / ramp-up and progress
on Venetia Underground and Jwaneng Cut-8 projects.
Solid operating and cost performance…
…against backdrop of difficult market conditions.
175
571
1,538
1,363
2015Volume &
other
2014
(967)
Price/FX/
Inflation
Underlying EBIT ($m)
Production(1) Realised price Unit cost(2)Underlying
EBITCapex ROCE Sales (Cons.)
Average price
index
2015 28.7Mct $207/ct $104/ct $571m $697m 6% 19.9Mct 135
vs. 2014 -12% +5% -6% -58% +1% -7pp -39% -8%
(1) Shown on a 100% basis.
(2) Total cost per carat recovered, calculated including 19.2% of Debswana
and 50% of Namdeb Holdings volumes.
48
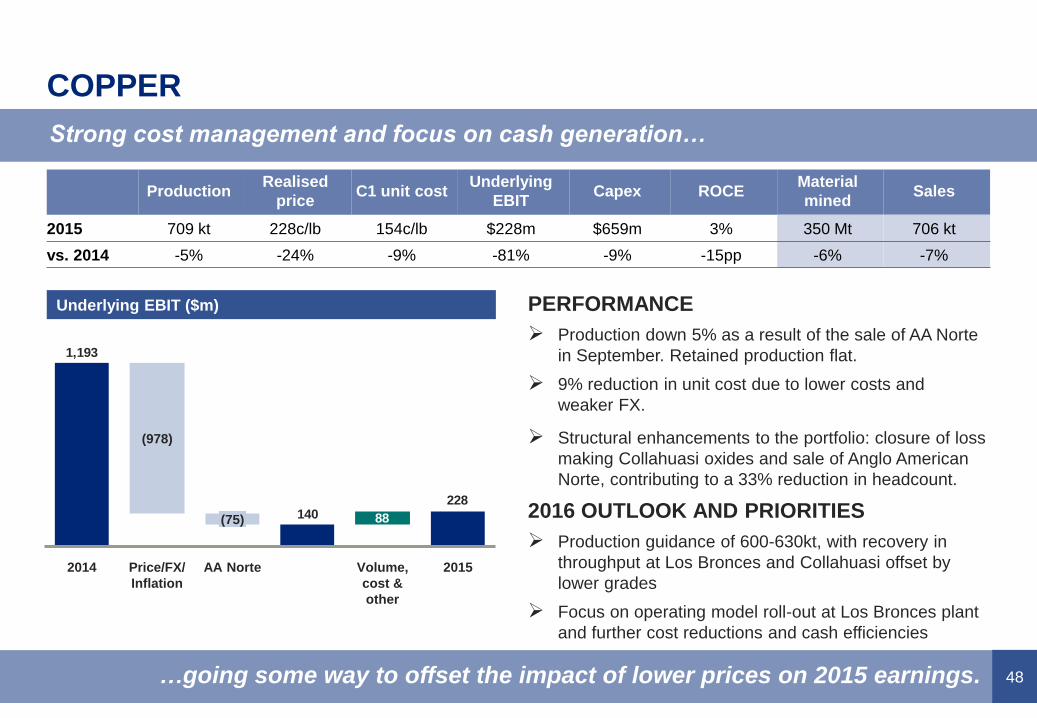
COPPER
PERFORMANCE
Production down 5% as a result of the sale of AA Norte
in September. Retained production flat.
9% reduction in unit cost due to lower costs and
weaker FX.
Structural enhancements to the portfolio: closure of loss
making Collahuasi oxides and sale of Anglo American
Norte, contributing to a 33% reduction in headcount.
2016 OUTLOOK AND PRIORITIES
Production guidance of 600-630kt, with recovery in
throughput at Los Bronces and Collahuasi offset by
lower grades
Focus on operating model roll-out at Los Bronces plant
and further cost reductions and cash efficiencies
Strong cost management and focus on cash generation…
…going some way to offset the impact of lower prices on 2015 earnings.
228
88140
1,193
2015Volume,
cost &
other
AA Norte
(75)
Price/FX/
Inflation
(978)
2014
ProductionRealised
priceC1 unit cost
Underlying
EBITCapex ROCE
Material
minedSales
2015 709 kt 228c/lb 154c/lb $228m $659m 3% 350 Mt 706 kt
vs. 2014 -5% -24% -9% -81% -9% -15pp -6% -7%
Underlying EBIT ($m)
49
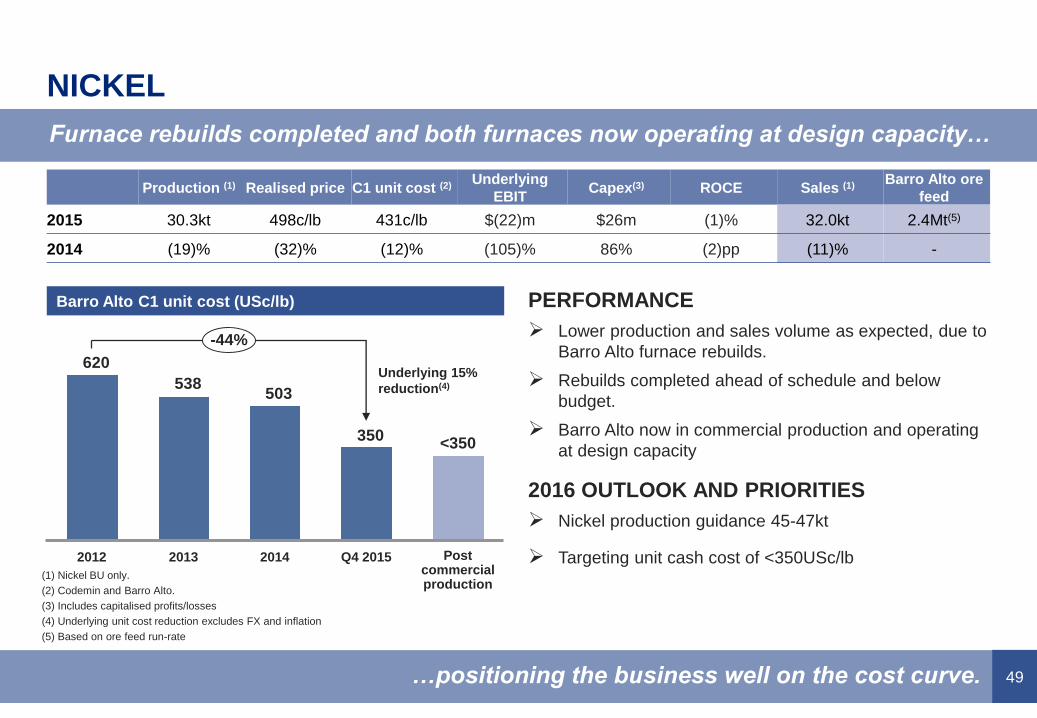
NICKEL
PERFORMANCE
Lower production and sales volume as expected, due to
Barro Alto furnace rebuilds.
Rebuilds completed ahead of schedule and below
budget.
Barro Alto now in commercial production and operating
at design capacity
2016 OUTLOOK AND PRIORITIES
Nickel production guidance 45-47kt
Targeting unit cash cost of <350USc/lb
Furnace rebuilds completed and both furnaces now operating at design capacity…
…positioning the business well on the cost curve.
Production (1) Realised price C1 unit cost (2)Underlying
EBITCapex(3) ROCE Sales (1)
Barro Alto ore
feed
2015 30.3kt 498c/lb 431c/lb $(22)m $26m (1)% 32.0kt 2.4Mt(5)
2014 (19)% (32)% (12)% (105)% 86% (2)pp (11)% -
350
503538
620
-44%
Post commercial production
2013
<350
Q4 20152012 2014
Barro Alto C1 unit cost (USc/lb)
(1) Nickel BU only.
(2) Codemin and Barro Alto.
(3) Includes capitalised profits/losses
(4) Underlying unit cost reduction excludes FX and inflation
(5) Based on ore feed run-rate
Underlying 15%
reduction(4)
50
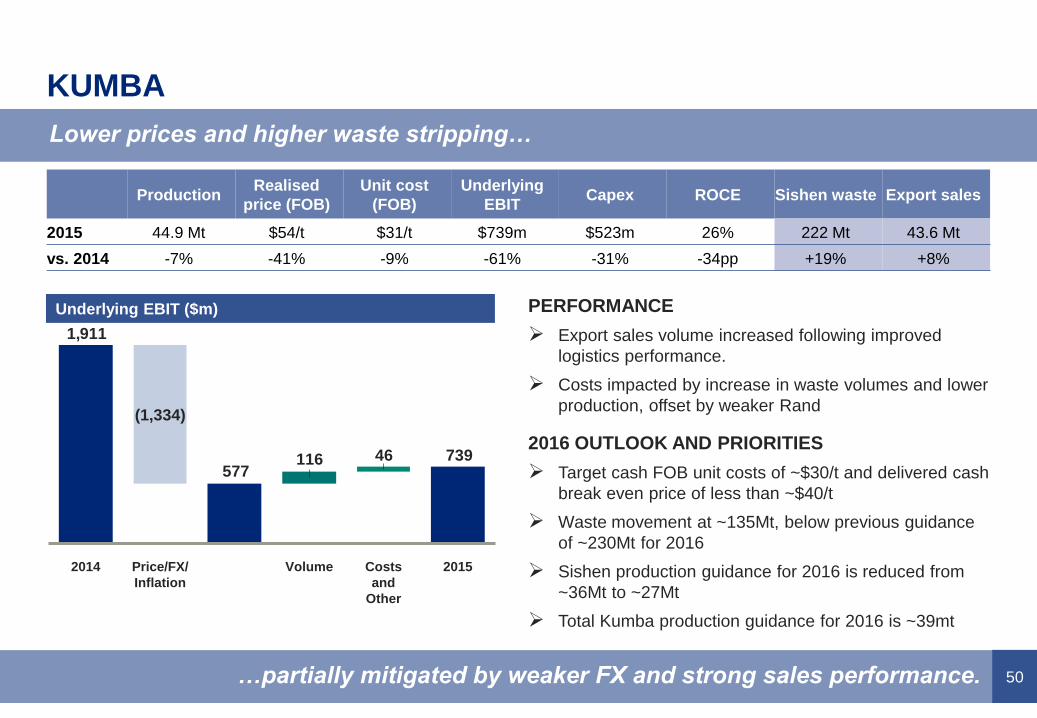
KUMBA
PERFORMANCE
Export sales volume increased following improved
logistics performance.
Costs impacted by increase in waste volumes and lower
production, offset by weaker Rand
2016 OUTLOOK AND PRIORITIES
Target cash FOB unit costs of ~$30/t and delivered cash
break even price of less than ~$40/t
Waste movement at ~135Mt, below previous guidance
of ~230Mt for 2016
Sishen production guidance for 2016 is reduced from
~36Mt to ~27Mt
Total Kumba production guidance for 2016 is ~39mt
Lower prices and higher waste stripping…
…partially mitigated by weaker FX and strong sales performance.
73946116577
1,911
(1,334)
2014 Costs
and
Other
Price/FX/
Inflation
2015Volume
Underlying EBIT ($m)
ProductionRealised
price (FOB)
Unit cost
(FOB)
Underlying
EBITCapex ROCE Sishen waste Export sales
2015 44.9 Mt $54/t $31/t $739m $523m 26% 222 Mt 43.6 Mt
vs. 2014 -7% -41% -9% -61% -31% -34pp +19% +8%
51
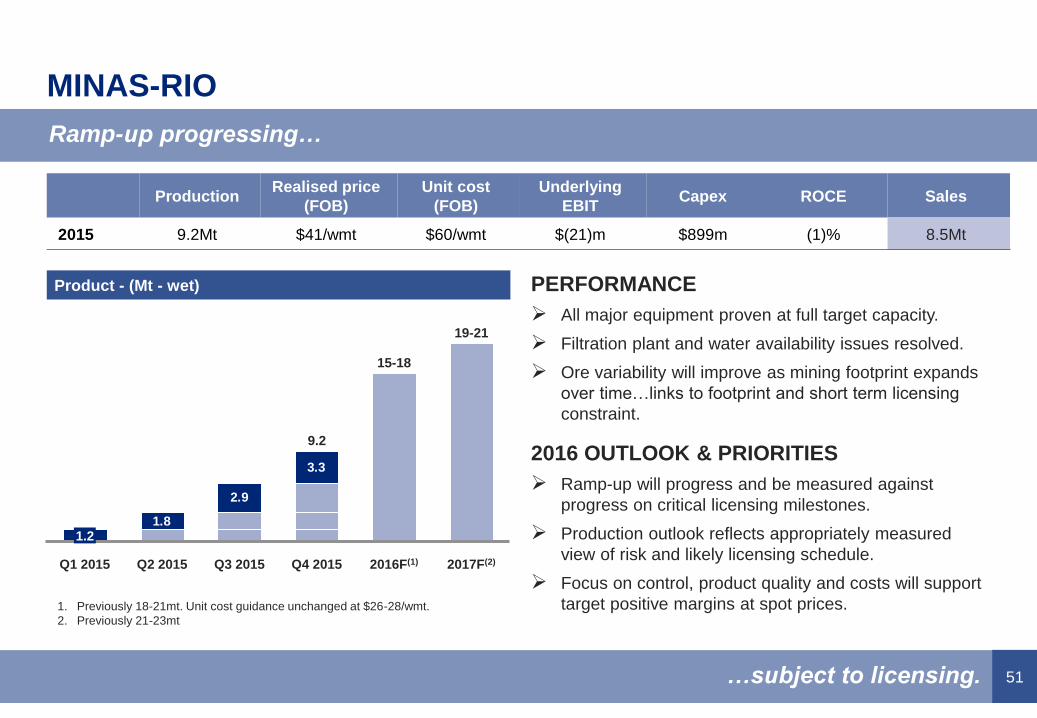
MINAS-RIO
PERFORMANCE
All major equipment proven at full target capacity.
Filtration plant and water availability issues resolved.
Ore variability will improve as mining footprint expands
over time…links to footprint and short term licensing
constraint.
2016 OUTLOOK & PRIORITIES
Ramp-up will progress and be measured against
progress on critical licensing milestones.
Production outlook reflects appropriately measured
view of risk and likely licensing schedule.
Focus on control, product quality and costs will support
target positive margins at spot prices.
…subject to licensing.
Product - (Mt - wet)
Ramp-up progressing…
ProductionRealised price
(FOB)
Unit cost
(FOB)
Underlying
EBITCapex ROCE Sales
2015 9.2Mt $41/wmt $60/wmt $(21)m $899m (1)% 8.5Mt
1.8
2.9
3.3
1.2
2016F(1)
19-21
15-18
2017F(2)Q1 2015 Q3 2015 Q4 2015Q2 2015
9.2
1. Previously 18-21mt. Unit cost guidance unchanged at $26-28/wmt.
2. Previously 21-23mt

52
COAL
PERFORMANCE
33% production increase from underground longwall
metallurgical coal operations
23% unit cost reductions at Australian operations
13% unit cost reduction at South African export mines
2016 OUTLOOK AND PRIORITIES
Targeting metallurgical coal 21-22 Mt and export
thermal coal 28-30 Mt in 2016
Conditional sales agreed for the Dartbrook and
Callide mines in Australia
Despite lower metallurgical and thermal coal pricing…
…productivity and cost improvements have offset earnings impact.
315
457
142
458
20152014
(316)
Price/FX/
Inflation
Volume, Cost
& Other
Underlying EBIT ($m)
Export prod.
met / thermal
FOB price
met / thermal
Unit cost
met / thermal(1)
Underlying
EBITCapex ROCE
SA UG – OEE(2)
benchmark
Grasstree
LW cutting rate
201521.2Mt /
33.8Mt$90/t / $55/t $55/t & $39/t $457m $941m 9% 61% 214kt/wk
vs. 2014 +1% / -2% -19% / -20% -23% & -13% 0% -10% +1pp +9% +14%
(1) FOB unit costs excluding royalties
(2) Operating Equipment Effectiveness
53
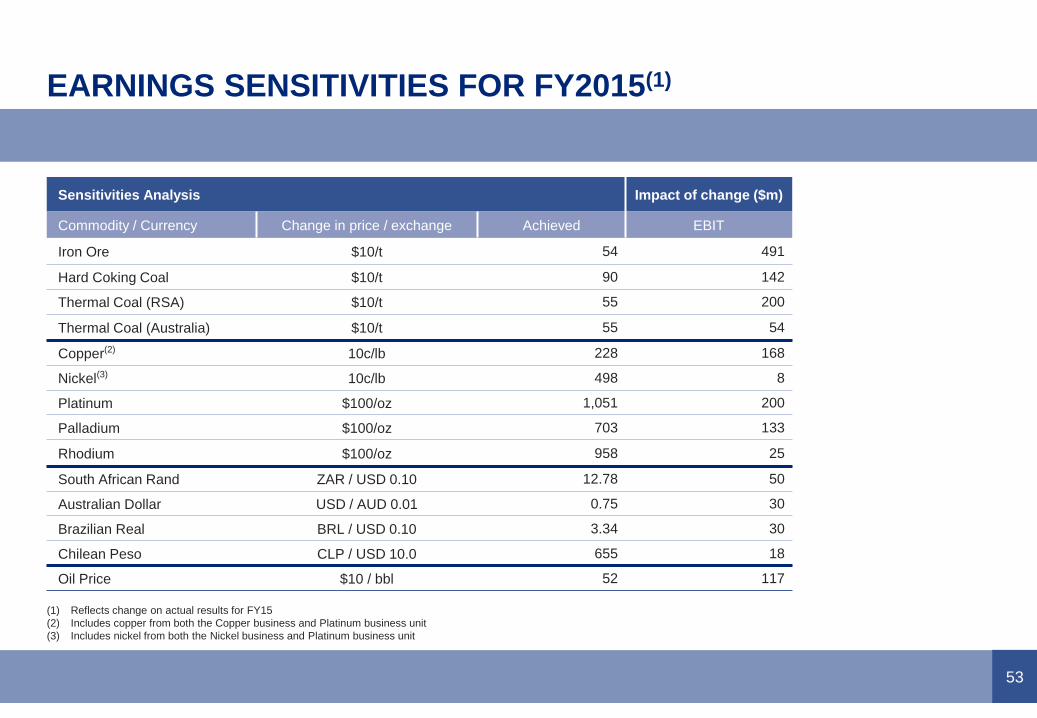
EARNINGS SENSITIVITIES FOR FY2015(1)
(1) Reflects change on actual results for FY15
(2) Includes copper from both the Copper business and Platinum business unit
(3) Includes nickel from both the Nickel business and Platinum business unit
Sensitivities Analysis Impact of change ($m)
Commodity / Currency Change in price / exchange Achieved EBIT
Iron Ore $10/t 54 491
Hard Coking Coal $10/t 90 142
Thermal Coal (RSA) $10/t 55 200
Thermal Coal (Australia) $10/t 55 54
Copper(2) 10c/lb 228 168
Nickel(3) 10c/lb 498 8
Platinum $100/oz 1,051 200
Palladium $100/oz 703 133
Rhodium $100/oz 958 25
South African Rand ZAR / USD 0.10 12.78 50
Australian Dollar USD / AUD 0.01 0.75 30
Brazilian Real BRL / USD 0.10 3.34 30
Chilean Peso CLP / USD 10.0 655 18
Oil Price $10 / bbl 52 117
54
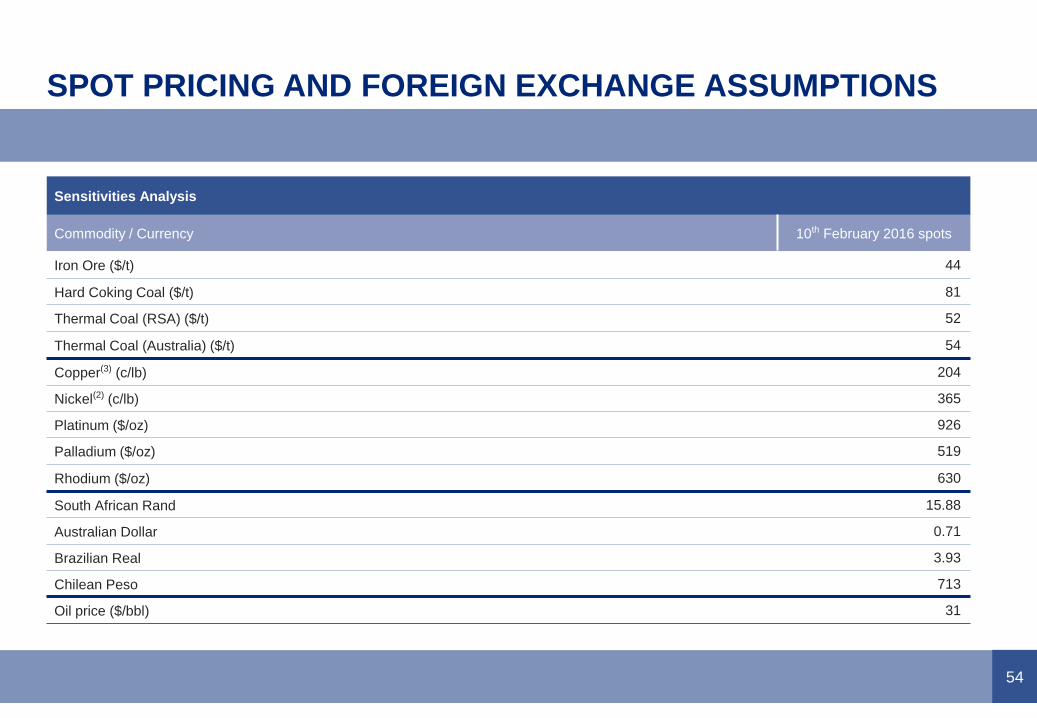
SPOT PRICING AND FOREIGN EXCHANGE ASSUMPTIONS
Sensitivities Analysis
Commodity / Currency 10th February 2016 spots
Iron Ore ($/t) 44
Hard Coking Coal ($/t) 81
Thermal Coal (RSA) ($/t) 52
Thermal Coal (Australia) ($/t) 54
Copper(3) (c/lb) 204
Nickel(2) (c/lb) 365
Platinum ($/oz) 926
Palladium ($/oz) 519
Rhodium ($/oz) 630
South African Rand 15.88
Australian Dollar 0.71
Brazilian Real 3.93
Chilean Peso 713
Oil price ($/bbl) 31