investor update - roche3c96267c-0ac9-4f4c-a9e0-b3fa18a934… · investor update f. hoffmann-la...
TRANSCRIPT
Investor Update
F. Hoffmann-La Roche Ltd 4070 Basel
Switzerland
Investor Relations
email:
Tel. +41 61 68-88880
Fax +41 61 69-10014
www.roche.com
1/19
Basel, 20 October 2016
Roche delivers good sales growth in the first nine months of 2016
● Group sales increase 4%1 at constant exchange rates, 6% in Swiss francs
● Pharmaceuticals Division sales up 4%, driven by oncology and immunology medicines
● Diagnostics Division sales grow 7%, primarily due to immunodiagnostic products
● US FDA approves Tecentriq, the first anti-PD-L1 cancer immunotherapy for metastatic non-small
cell lung cancer
● Successful launch of cobas e 801, high-throughput immunodiagnostic module
● For the eighth year running, Roche ranked as the most sustainable healthcare company in the Dow
Jones Sustainability Index (DJSI)
● Outlook for 2016 confirmed
Key figures CHFm As % of sales % change
January - September 2016 2015 2016 2015 At CER In CHF
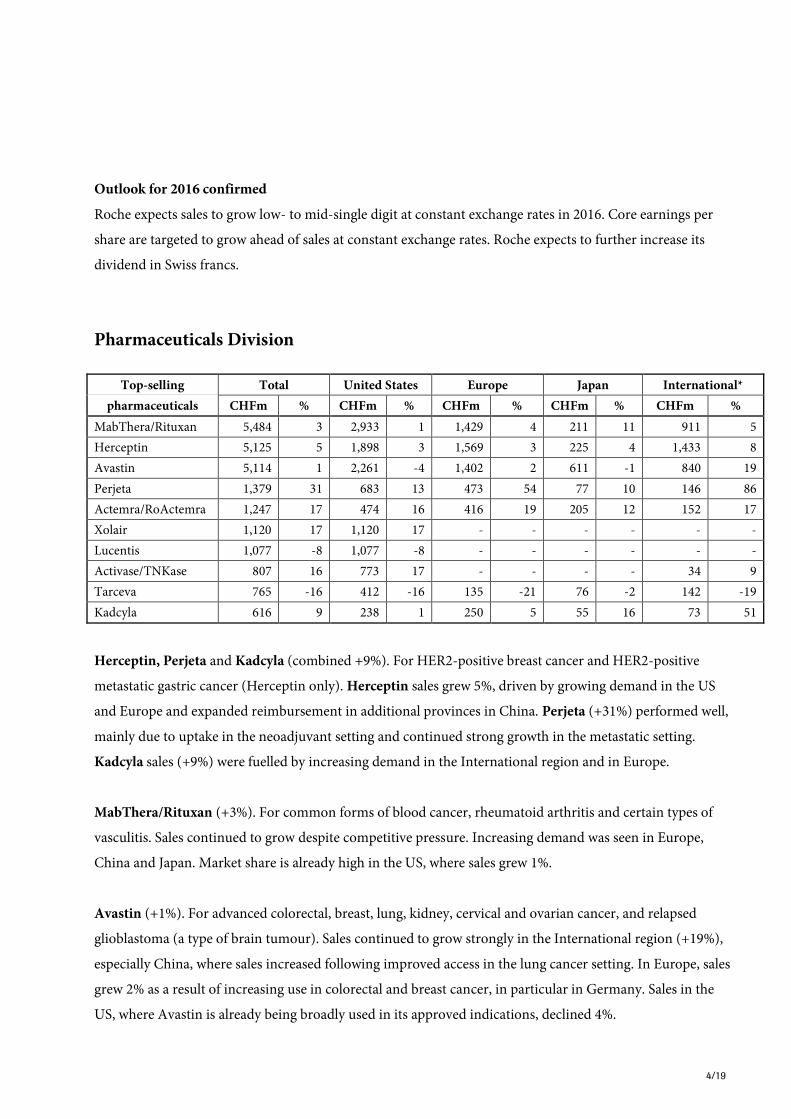
Group sales 37,505 35,525 100 100 +4 +6
Pharmaceuticals Division 29,140 27,690 78 78 +4 +5
United States 13,850 13,047 37 37 +3 +6
Europe 6,916 6,476 18 18 +5 +7
Japan 2,690 2,341 7 7 +0 +15
International* 5,684 5,826 16 16 +4 -2
Diagnostics Division 8,365 7,835 22 22 +7 +7 *Asia–Pacific, EEMEA (Eastern Europe, Middle East and Africa), Latin America, Canada,
Others
1 Unless otherwise stated, all growth rates in this document are at constant exchange rates (CER: average 2015).

2/19
Commenting on the Group’s first nine months, Roche CEO Severin Schwan said: “We had continued good
sales growth in both Pharmaceuticals and Diagnostics driven by our newly launched products, and our
product pipeline is developing very well. Our cancer immunotherapy medicine Tecentriq has been
performing strongly since May, when it was first approved in the US for people with advanced bladder
cancer, and it has just received US FDA approval for previously treated metastatic non-small cell lung cancer.
Based on our performance so far, I am confident that we will meet our full-year targets for 2016.”
Group
Both divisions showed continued growth
Group sales increased 4% to CHF 37.5 billion. Sales in the Pharmaceuticals Division were up 4% to CHF 29.1
billion, driven by demand for breast cancer medicines Perjeta and Herceptin as well as for
Actemra/RoActemra for rheumatoid arthritis. Sales in the US rose 3%, led by three immunology treatments
Xolair, Esbriet and Actemra/RoActemra, as well as Activase/TNKase, and Perjeta and Herceptin for HER2-
positive breast cancer. The recently launched medicines Tecentriq in bladder cancer and Alecensa in lung
cancer have had a strong uptake. US growth was partly offset by a decline in sales of Tamiflu, Lucentis,
Avastin and Tarceva. In Europe, sales increased 5% with Perjeta, Actemra/RoActemra and
MabThera/Rituxan recording strong growth, especially in Germany and France. In the International region,
the 4% growth was driven by the strategic cancer medicines portfolio. In Japan, sales were stable; mandated
price cuts for reimbursed products were compensated by strong growth from Alecensa, HER2 cancer
medicines and Actemra/RoActemra.
Sales in the Diagnostics Division grew strongly (+7%) to CHF 8.4 billion. All regions contributed to this
growth, particularly Asia-Pacific (+17%). Professional, Molecular and Tissue Diagnostics experienced
continued good sales development. Diabetes Care sales continue to be impacted by challenging market
conditions, especially in North America.
Confirming data for key investigational Roche medicines
Two Roche medicines were granted breakthrough therapy designations (BTD) by the US FDA in October.
BTD was granted to Actemra/RoActemra for giant cell arteritis (GCA), a chronic, potentially life-threatening
autoimmune condition. In addition, Alecensa received BTD for the treatment of adult patients with
advanced ALK-positive non-small cell lung cancer (NSCLC) who have not received prior treatment with an
ALK inhibitor. Also in October, the FDA approved the Lucentis prefilled syringe as a new method of

3/19
administering the medicine to people with wet age-related macular degeneration and to people with macular
edema after retinal vein occlusion.
In September, Roche presented new post-hoc analyses from three pivotal Ocrevus (ocrelizumab) studies at
the annual congress of the European Committee for Treatment and Research in Multiple Sclerosis
(ECTRIMS). The new data showed that Ocrevus consistently increased disease control both in patients with
the relapsing form of multiple sclerosis and in those with the primary progressive form.
At the European Society for Medical Oncology (ESMO) annual meeting in October, Roche presented results
from the phase III OAK trial with Tecentriq in metastatic NSCLC. The study met its primary endpoint,
having established a survival benefit over chemotherapy, even in people with low or no observed levels of
PD-L1 expression. These results add to the growing body of evidence that supported the FDA approval of
Tecentriq as a new treatment for specific types of advanced NSCLC. In addition to OAK, Roche has seven
phase III lung studies underway evaluating Tecentriq alone or in combination with other treatments in
patients with early and advanced stages of lung cancer.
Portfolio progress in Diagnostics
In August, the FDA granted a premarket clearance and CLIA (Clinical Laboratory Improvement
Amendments) waiver for the cobas Influenza A/B & RSV test for use on the cobas Liat System. This test also
identifies the Respiratory Syncytial Virus (RSV), which causes more than 80% of acute lower respiratory tract
infections in infants under one year old. The FDA also issued an Emergency Use Authorization for the
LightMix Zika rRT-PCR test for use in patients meeting clinical and/or epidemiological criteria developed by
the Center for Disease Control. These tests further expand the rich menu of Roche products.
Also in August, the Accu-Chek Guide was launched in the EU. This next-generation blood glucose
monitoring system is designed to make everyday blood glucose monitoring easier for people with diabetes.
The Accu-Chek Guide system also provides advanced accuracy, which enables reliable diabetes management.
Roche the most sustainable healthcare company
The Dow Jones Sustainability Index (DJSI) recognised Roche as the most sustainable company in the
healthcare industry for the eighth consecutive year. This year’s DJSI assessment emphasised that by focusing
on access to healthcare, compliance and transparency, a diverse work culture and collaboration with a variety
of partners, Roche is committed to creating value for all its stakeholders.
4/19
Outlook for 2016 confirmed
Roche expects sales to grow low- to mid-single digit at constant exchange rates in 2016. Core earnings per
share are targeted to grow ahead of sales at constant exchange rates. Roche expects to further increase its
dividend in Swiss francs.
Pharmaceuticals Division
Top-selling Total United States Europe Japan International*
pharmaceuticals CHFm % CHFm % CHFm % CHFm % CHFm %
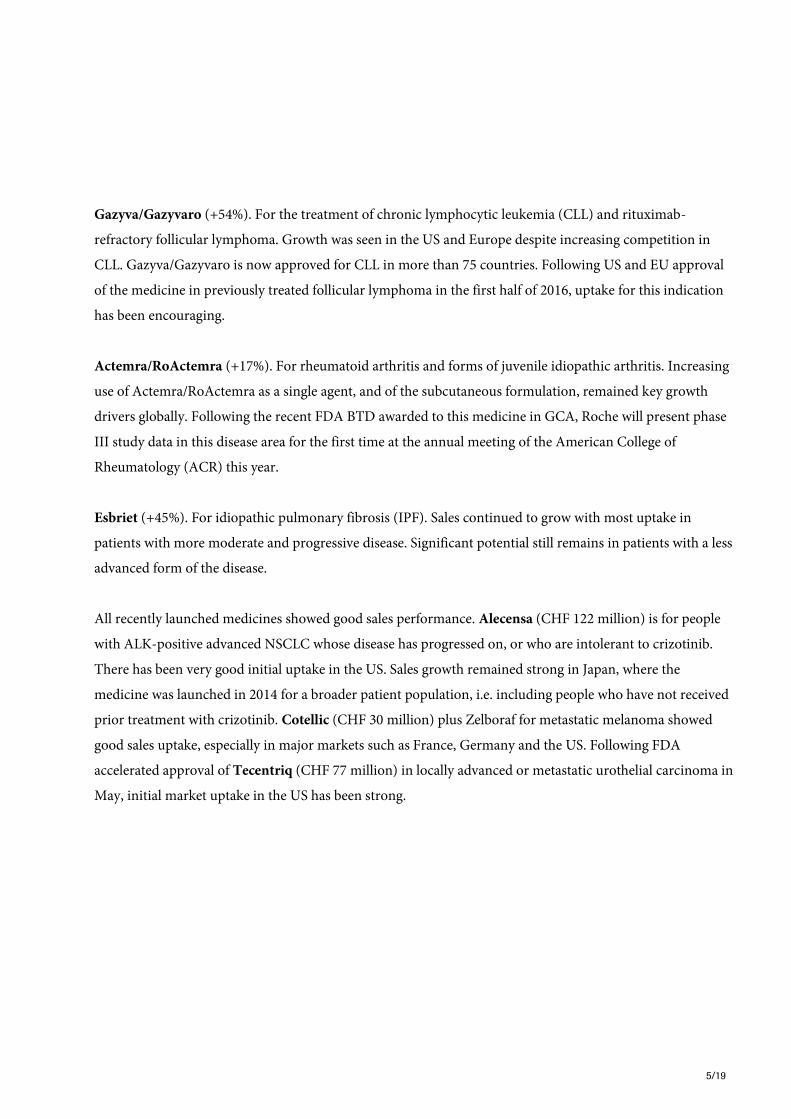
MabThera/Rituxan 5,484 3 2,933 1 1,429 4 211 11 911 5
Herceptin 5,125 5 1,898 3 1,569 3 225 4 1,433 8
Avastin 5,114 1 2,261 -4 1,402 2 611 -1 840 19
Perjeta 1,379 31 683 13 473 54 77 10 146 86
Actemra/RoActemra 1,247 17 474 16 416 19 205 12 152 17
Xolair 1,120 17 1,120 17 - - - - - -
Lucentis 1,077 -8 1,077 -8 - - - - - -
Activase/TNKase 807 16 773 17 - - - - 34 9
Tarceva 765 -16 412 -16 135 -21 76 -2 142 -19
Kadcyla 616 9 238 1 250 5 55 16 73 51
Herceptin, Perjeta and Kadcyla (combined +9%). For HER2-positive breast cancer and HER2-positive
metastatic gastric cancer (Herceptin only). Herceptin sales grew 5%, driven by growing demand in the US
and Europe and expanded reimbursement in additional provinces in China. Perjeta (+31%) performed well,
mainly due to uptake in the neoadjuvant setting and continued strong growth in the metastatic setting.
Kadcyla sales (+9%) were fuelled by increasing demand in the International region and in Europe.
MabThera/Rituxan (+3%). For common forms of blood cancer, rheumatoid arthritis and certain types of
vasculitis. Sales continued to grow despite competitive pressure. Increasing demand was seen in Europe,
China and Japan. Market share is already high in the US, where sales grew 1%.
Avastin (+1%). For advanced colorectal, breast, lung, kidney, cervical and ovarian cancer, and relapsed
glioblastoma (a type of brain tumour). Sales continued to grow strongly in the International region (+19%),
especially China, where sales increased following improved access in the lung cancer setting. In Europe, sales
grew 2% as a result of increasing use in colorectal and breast cancer, in particular in Germany. Sales in the
US, where Avastin is already being broadly used in its approved indications, declined 4%.
5/19
Gazyva/Gazyvaro (+54%). For the treatment of chronic lymphocytic leukemia (CLL) and rituximab-
refractory follicular lymphoma. Growth was seen in the US and Europe despite increasing competition in
CLL. Gazyva/Gazyvaro is now approved for CLL in more than 75 countries. Following US and EU approval
of the medicine in previously treated follicular lymphoma in the first half of 2016, uptake for this indication
has been encouraging.
Actemra/RoActemra (+17%). For rheumatoid arthritis and forms of juvenile idiopathic arthritis. Increasing
use of Actemra/RoActemra as a single agent, and of the subcutaneous formulation, remained key growth
drivers globally. Following the recent FDA BTD awarded to this medicine in GCA, Roche will present phase
III study data in this disease area for the first time at the annual meeting of the American College of
Rheumatology (ACR) this year.
Esbriet (+45%). For idiopathic pulmonary fibrosis (IPF). Sales continued to grow with most uptake in
patients with more moderate and progressive disease. Significant potential still remains in patients with a less
advanced form of the disease.
All recently launched medicines showed good sales performance. Alecensa (CHF 122 million) is for people
with ALK-positive advanced NSCLC whose disease has progressed on, or who are intolerant to crizotinib.
There has been very good initial uptake in the US. Sales growth remained strong in Japan, where the
medicine was launched in 2014 for a broader patient population, i.e. including people who have not received
prior treatment with crizotinib. Cotellic (CHF 30 million) plus Zelboraf for metastatic melanoma showed
good sales uptake, especially in major markets such as France, Germany and the US. Following FDA
accelerated approval of Tecentriq (CHF 77 million) in locally advanced or metastatic urothelial carcinoma in
May, initial market uptake in the US has been strong.

6/19
Diagnostics Division
Sales CHFm
% change As % of sales
January - September At CER In CHF
Sales - Diagnostics Division 8,365 +7 +7 100
Business
Areas
Professional Diagnostics 4,884 +9 +9 58
Diabetes Care 1,484 -2 -3 18
Molecular Diagnostics 1,345 +7 +8 16
Tissue Diagnostics 652 +13 +15 8
Regions
Europe, Middle East, Africa 3,406 +2 +2 41
North America 2,211 +4 +7 26
Asia–Pacific 1,847 +17 +15 22
Latin America 567 +21 +4 7
Japan 334 +2 +17 4
Professional Diagnostics (+9%) was the largest contributor to the division’s sales growth, led by the Asia-
Pacific region, with continued strong growth in China (+24%). The immunodiagnostics business saw strong
growth (+14%) and clinical chemistry sales increased 6%.
The new cobas e 801 high-throughput immunodiagnostic module had very good market uptake; it was
launched in June 2016 in countries accepting the CE Mark. As part of the cobas 8000 analyser, this module
provides increased immunochemistry testing capacity and an extensive test menu. The continued strong
performance of the immunodiagnostics business reflects the wide range of solutions Roche offers to the core
laboratories.
Molecular Diagnostics sales increased 7%, led by the Asia-Pacific region. The main growth contributors
were the sequencing and molecular businesses. The molecular business growth was driven by virology
(+11%), including the diagnosis and monitoring of hepatitis and HIV viral load as well as HPV screening
(+13%).
7/19
The strong sales performance was based on the comprehensive portfolio of modern instrumentation
combined with the very broad test portfolio which Roche offers. The addition of the cobas Influenza A/B &
RSV on the cobas Liat System and the LightMix Zika rRT-PCR tests further expanded this base.
Tissue Diagnostics sales increased 13%, driven by sales in North America. Sales in the advanced staining
portfolio grew 9% and sales in primary staining increased 18%. Revenue from external personalised
healthcare partnerships also showed continued strong growth (+39%).
Diabetes Care sales decreased 2%, predominantly due to continued price pressure in the US. Increasing sales
were recorded in Latin America, while EMEA and Asia-Pacific regional sales were slightly down.
Nine Months Sales 2016 Conference Call
There will be a conference call for investors and analysts today, Thursday, 20 October at 2:00 pm CEST.
Please dial in to the conference call 10-15 min. prior to the scheduled start, using the following numbers:
+41 (0) 58 310 5000 (Europe and ROW)
+44 (0) 203 059 5862 (UK)
+1 (1) 631 570 5613 (USA)
Alternatively a live audio webcast can be accessed via http://ir.roche.com.
About Roche
Roche is a global pioneer in pharmaceuticals and diagnostics focused on advancing science to improve
people’s lives.
Roche is the world’s largest biotech company, with truly differentiated medicines in oncology, immunology,
infectious diseases, ophthalmology and diseases of the central nervous system. Roche is also the world leader
in in vitro diagnostics and tissue-based cancer diagnostics, and a frontrunner in diabetes management. The
combined strengths of pharmaceuticals and diagnostics under one roof have made Roche the leader in
personalised healthcare – a strategy that aims to fit the right treatment to each patient in the best way
possible.
Founded in 1896, Roche continues to search for better ways to prevent, diagnose and treat diseases and make
a sustainable contribution to society. Twenty-nine medicines developed by Roche are included in the World
Health Organization Model Lists of Essential Medicines, among them life-saving antibiotics, antimalarials
and cancer medicines. Roche has been recognised as the Group Leader in sustainability within the

8/19
Pharmaceuticals, Biotechnology & Life Sciences Industry eight years in a row by the Dow Jones Sustainability
Index.
The Roche Group, headquartered in Basel, Switzerland, is active in over 100 countries and in 2015 employed
more than 91,700 people worldwide. In 2015, Roche invested CHF 9.3 billion in R&D and posted sales of
CHF 48.1 billion. Genentech, in the United States, is a wholly owned member of the Roche Group. Roche is
the majority shareholder in Chugai Pharmaceutical, Japan. For more information, please visit
www.roche.com.
All trademarks used or mentioned in this release are protected by law.
Additional information
– Nine Months 2016 Sales Presentation with appendix: http://www.roche.com/irp161020.pdf
– Nine Months 2016 Sales Presentation: http://www.roche.com/irp161020-a.pdf
Pharmaceuticals: major clinical and regulatory news-flow in 2016:
http://www.roche.com/pharma3q16e.pdf
Diagnostics: key diagnostics product launches in 2016: http://www.roche.com/dia3q16e.pdf
Finance Report Half Year 2016: www.roche.com/annual_reports
Roche Annual Report 2015 (includes corporate responsibility report):
www.roche.com/annual_reports
Dow Jones Sustainability Indices: http://www.sustainability-indices.com
Roche Investor Relations
Dr. Karl Mahler Dr. Sabine Borngräber
Phone: +41 61 68-78503 Phone: +41 61 68-88027
e-mail: [email protected] e-mail: [email protected]
Dr. Bruno Eschli Dr. Tamer Farhan
Phone: +41 61 68-75284 Phone: +41 61 68-82552
e-mail: [email protected] e-mail: [email protected]
Dr. Birgit Masjost
Phone: +41 61 68-84814
e-mail: [email protected]
9/19
Investor Relations North America
Neera Dahiya Ravindran, MD Loren Kalm
Phone: +1 650 491 5281 Phone: +1 650 225 3217
e-mail: [email protected] e-mail: [email protected]
Disclaimer: Cautionary statement regarding forward-looking statements This document contains certain forward-looking statements. These forward-looking statements may be identified by words such as
‘believes’, ‘expects’, ‘anticipates’, ‘projects’, ‘intends’, ‘should’, ‘seeks’, ‘estimates’, ‘future’ or similar expressions or by discussion of,
among other things, strategy, goals, plans or intentions. Various factors may cause actual results to differ materially in the future from
those reflected in forward-looking statements contained in this document, among others: (1) pricing and product initiatives of
competitors; (2) legislative and regulatory developments and economic conditions; (3) delay or inability in obtaining regulatory
approvals or bringing products to market; (4) fluctuations in currency exchange rates and general financial market conditions; (5)
uncertainties in the discovery, development or marketing of new products or new uses of existing products, including without
limitation negative results of clinical trials or research projects, unexpected side effects of pipeline or marketed products; (6)
increased government pricing pressures; (7) interruptions in production; (8) loss of or inability to obtain adequate protection for
intellectual property rights; (9) litigation; (10) loss of key executives or other employees; and (11) adverse publicity and news
coverage. The statement regarding earnings per share growth is not a profit forecast and should not be interpreted to mean that
Roche’s earnings or earnings per share for 2015 or any subsequent period will necessarily match or exceed the historical published
earnings or earnings per share of Roche.
10/19
Appendix: Tables
1. Sales January to September 2016 and 2015 ...............................................................................................................................................................................................11
2. Quarterly sales and constant exchange rate sales growth by Division in 2016 and 2015 ...................................................................................................................12
3. Pharmaceuticals Division ............................................................................................................................................................................................................................13
4. Top 20 Pharmaceuticals Division product sales and constant exchange rate growth YTD September 2016 vs. YTD September 2015......................................14
5. Top 20 Pharmaceuticals Division quarterly product sales and quarterly constant exchange rate sales growth .............................................................................15
6. Top 20 Pharmaceuticals Division quarterly product sales and quarterly constant exchange rate sales growth United States .....................................................16
7. Top 20 Pharmaceuticals Division quarterly product sales and quarterly constant exchange rate sales growth Europe ................................................................17
8. Top 20 Pharmaceuticals Division quarterly product sales and quarterly constant exchange rate sales growth Japan...................................................................18
9. Top 20 Pharmaceuticals Division quarterly product sales and quarterly constant exchange rate sales growth International* ....................................................19
11/19
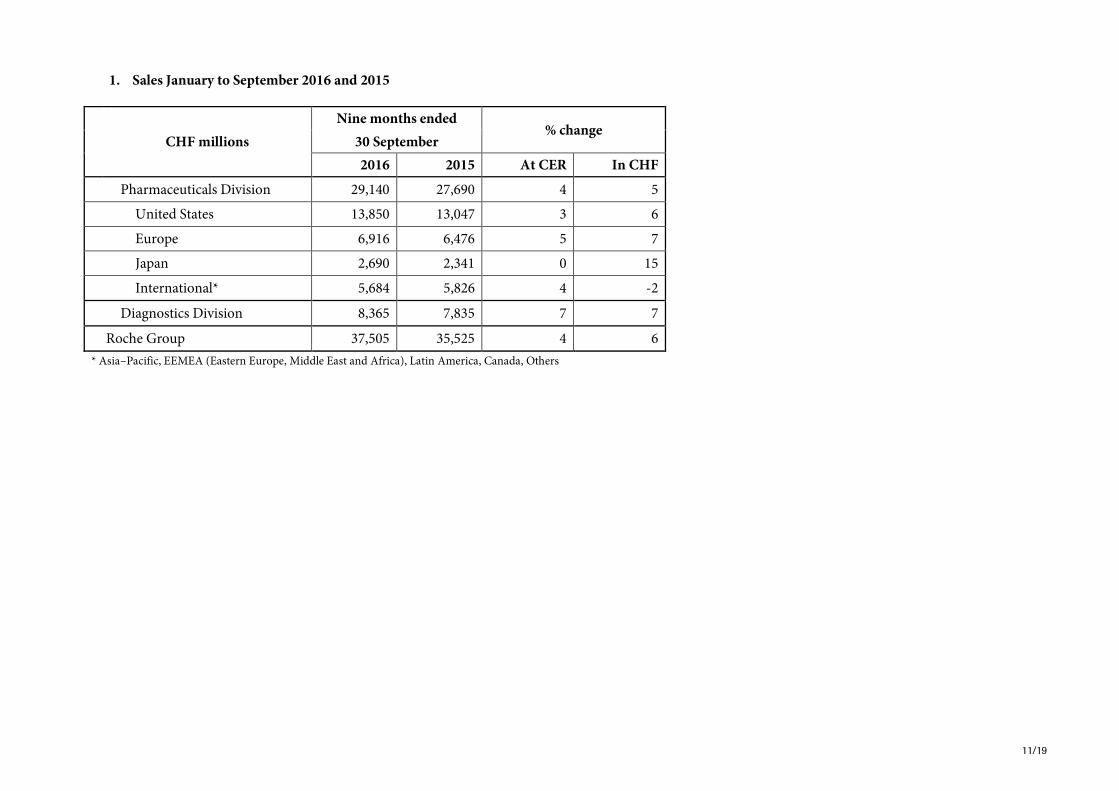
1. Sales January to September 2016 and 2015
Nine months ended % change
CHF millions 30 September
2016 2015 At CER In CHF
Pharmaceuticals Division 29,140 27,690 4 5
United States 13,850 13,047 3 6
Europe 6,916 6,476 5 7
Japan 2,690 2,341 0 15
International* 5,684 5,826 4 -2
Diagnostics Division 8,365 7,835 7 7
Roche Group 37,505 35,525 4 6
* Asia–Pacific, EEMEA (Eastern Europe, Middle East and Africa), Latin America, Canada, Others
12/19
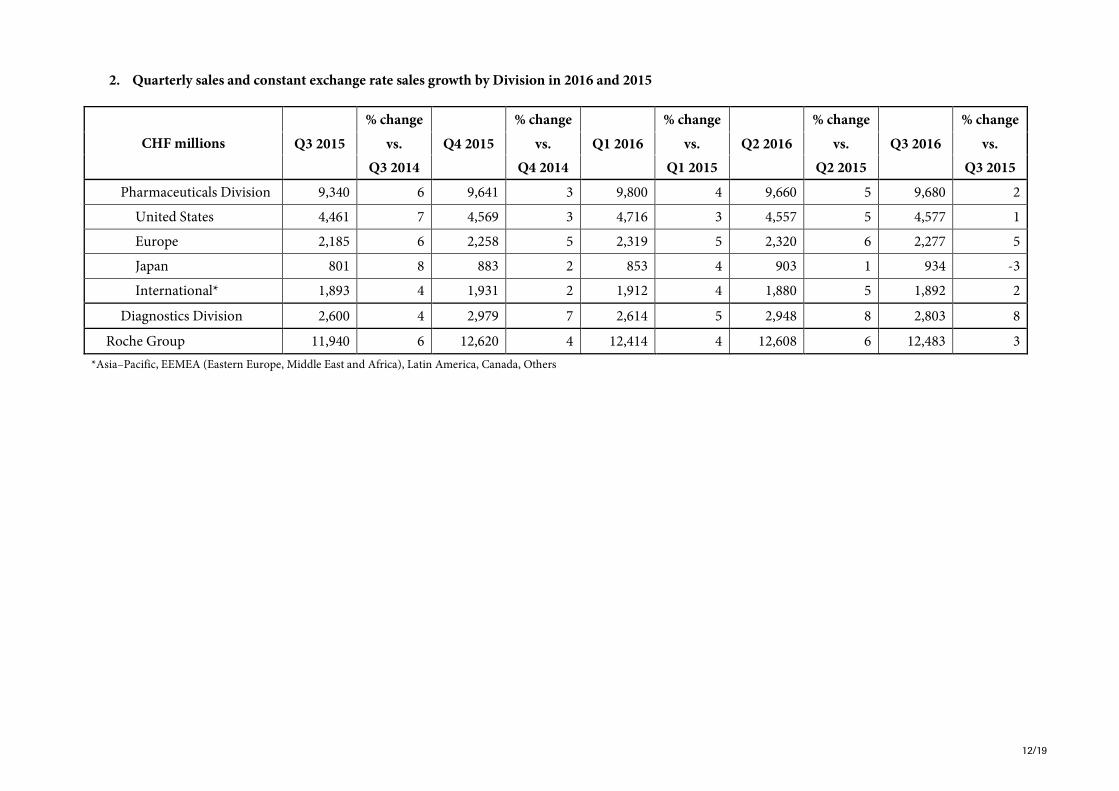
2. Quarterly sales and constant exchange rate sales growth by Division in 2016 and 2015
CHF millions
% change % change % change % change % change
Q3 2015 vs. Q4 2015 vs. Q1 2016 vs. Q2 2016 vs. Q3 2016 vs.
Q3 2014 Q4 2014 Q1 2015 Q2 2015 Q3 2015
Pharmaceuticals Division 9,340 6 9,641 3 9,800 4 9,660 5 9,680 2
United States 4,461 7 4,569 3 4,716 3 4,557 5 4,577 1
Europe 2,185 6 2,258 5 2,319 5 2,320 6 2,277 5
Japan 801 8 883 2 853 4 903 1 934 -3
International* 1,893 4 1,931 2 1,912 4 1,880 5 1,892 2
Diagnostics Division 2,600 4 2,979 7 2,614 5 2,948 8 2,803 8
Roche Group 11,940 6 12,620 4 12,414 4 12,608 6 12,483 3
*Asia–Pacific, EEMEA (Eastern Europe, Middle East and Africa), Latin America, Canada, Others
13/19
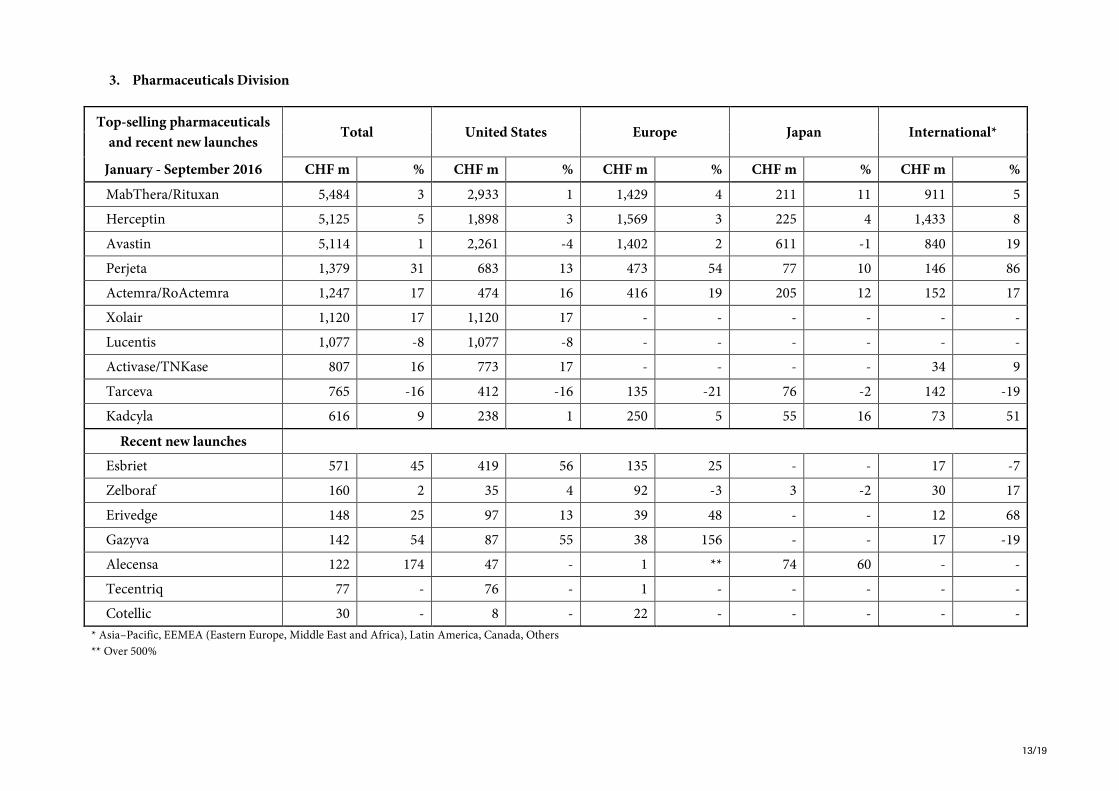
3. Pharmaceuticals Division
Top-selling pharmaceuticals
and recent new launches Total United States Europe Japan International*
January - September 2016 CHF m % CHF m % CHF m % CHF m % CHF m %
MabThera/Rituxan 5,484 3 2,933 1 1,429 4 211 11 911 5
Herceptin 5,125 5 1,898 3 1,569 3 225 4 1,433 8
Avastin 5,114 1 2,261 -4 1,402 2 611 -1 840 19
Perjeta 1,379 31 683 13 473 54 77 10 146 86
Actemra/RoActemra 1,247 17 474 16 416 19 205 12 152 17
Xolair 1,120 17 1,120 17 - - - - - -
Lucentis 1,077 -8 1,077 -8 - - - - - -
Activase/TNKase 807 16 773 17 - - - - 34 9
Tarceva 765 -16 412 -16 135 -21 76 -2 142 -19
Kadcyla 616 9 238 1 250 5 55 16 73 51
Recent new launches
Esbriet 571 45 419 56 135 25 - - 17 -7
Zelboraf 160 2 35 4 92 -3 3 -2 30 17
Erivedge 148 25 97 13 39 48 - - 12 68
Gazyva 142 54 87 55 38 156 - - 17 -19
Alecensa 122 174 47 - 1 ** 74 60 - -
Tecentriq 77 - 76 - 1 - - - - -
Cotellic 30 - 8 - 22 - - - - -
* Asia–Pacific, EEMEA (Eastern Europe, Middle East and Africa), Latin America, Canada, Others
** Over 500%

14/19
4. Top 20 Pharmaceuticals Division product sales and constant exchange rate growth YTD September 2016 vs. YTD September 2015
CHF millions Total United States Europe Japan International*
CHF m % CHF m % CHF m % CHF m % CHF m %
MabThera/Rituxan 5,484 3 2,933 1 1,429 4 211 11 911 5
Herceptin 5,125 5 1,898 3 1,569 3 225 4 1,433 8
Avastin 5,114 1 2,261 -4 1,402 2 611 -1 840 19
Perjeta 1,379 31 683 13 473 54 77 10 146 86
Actemra/RoActemra 1,247 17 474 16 416 19 205 12 152 17
Xolair 1,120 17 1,120 17 - - - - - -
Lucentis 1,077 -8 1,077 -8 - - - - - -
Activase/TNKase 807 16 773 17 - - - - 34 9
Tarceva 765 -16 412 -16 135 -21 76 -2 142 -19
Kadcyla 616 9 238 1 250 5 55 16 73 51
Esbriet 571 45 419 56 135 25 - - 17 -7
CellCept 559 -5 134 -11 132 -1 51 13 242 -6
Pulmozyme 504 6 349 4 91 7 - - 64 15
Tamiflu 503 -9 326 -23 38 211 76 25 63 13
Mircera 375 -4 - - 65 -3 156 1 154 -9
Xeloda 350 -10 27 -40 25 -24 82 12 216 -8
NeoRecormon/Epogin 244 -10 - - 107 -9 34 -13 103 -10
Rocephin 232 13 1 - 26 -10 21 -13 184 20
Valcyte/Cymevene 227 -15 52 -9 90 -23 - - 85 -10
Madopar 214 6 - - 74 1 12 -5 128 10
* Asia–Pacific, EEMEA (Eastern Europe, Middle East and Africa), Latin America, Canada, Others
15/19
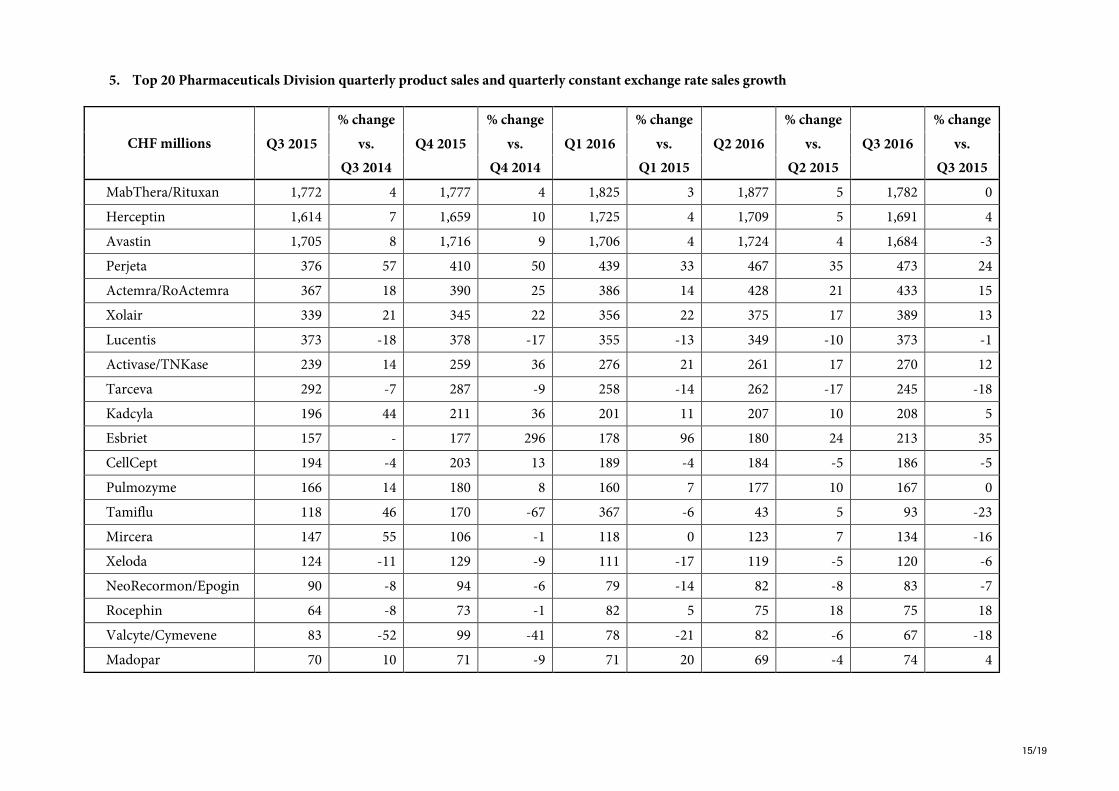
5. Top 20 Pharmaceuticals Division quarterly product sales and quarterly constant exchange rate sales growth
CHF millions
% change % change % change % change % change
Q3 2015 vs. Q4 2015 vs. Q1 2016 vs. Q2 2016 vs. Q3 2016 vs.
Q3 2014 Q4 2014 Q1 2015 Q2 2015 Q3 2015
MabThera/Rituxan 1,772 4 1,777 4 1,825 3 1,877 5 1,782 0
Herceptin 1,614 7 1,659 10 1,725 4 1,709 5 1,691 4
Avastin 1,705 8 1,716 9 1,706 4 1,724 4 1,684 -3
Perjeta 376 57 410 50 439 33 467 35 473 24
Actemra/RoActemra 367 18 390 25 386 14 428 21 433 15
Xolair 339 21 345 22 356 22 375 17 389 13
Lucentis 373 -18 378 -17 355 -13 349 -10 373 -1
Activase/TNKase 239 14 259 36 276 21 261 17 270 12
Tarceva 292 -7 287 -9 258 -14 262 -17 245 -18
Kadcyla 196 44 211 36 201 11 207 10 208 5
Esbriet 157 - 177 296 178 96 180 24 213 35
CellCept 194 -4 203 13 189 -4 184 -5 186 -5
Pulmozyme 166 14 180 8 160 7 177 10 167 0
Tamiflu 118 46 170 -67 367 -6 43 5 93 -23
Mircera 147 55 106 -1 118 0 123 7 134 -16
Xeloda 124 -11 129 -9 111 -17 119 -5 120 -6
NeoRecormon/Epogin 90 -8 94 -6 79 -14 82 -8 83 -7
Rocephin 64 -8 73 -1 82 5 75 18 75 18
Valcyte/Cymevene 83 -52 99 -41 78 -21 82 -6 67 -18
Madopar 70 10 71 -9 71 20 69 -4 74 4

16/19
6. Top 20 Pharmaceuticals Division quarterly product sales and quarterly constant exchange rate sales growth United States
CHF millions
% change % change % change % change % change
Q3 2015 vs. Q4 2015 vs. Q1 2016 vs. Q2 2016 vs. Q3 2016 vs.
Q3 2014 Q4 2014 Q1 2015 Q2 2015 Q3 2015
MabThera/Rituxan 947 4 938 7 978 0 1,023 6 932 -3
Herceptin 609 12 599 13 651 4 630 6 617 0
Avastin 784 6 772 11 775 -2 763 0 723 -9
Perjeta 208 37 217 31 224 15 230 16 229 8
Actemra/RoActemra 144 21 153 32 145 12 164 23 165 13
Xolair 339 21 345 22 356 22 375 17 389 13
Lucentis 373 -18 378 -17 355 -13 349 -10 373 -1
Activase/TNKase 228 15 246 36 265 21 250 18 258 12
Tarceva 159 -7 160 1 136 -15 141 -17 135 -16
Kadcyla 79 6 79 12 79 -2 80 7 79 -1
Esbriet 114 - 124 ** 127 145 134 32 158 38
CellCept 53 -14 54 29 45 0 43 -18 46 -13
Pulmozyme 115 9 128 19 112 6 121 7 116 0
Tamiflu 104 54 121 -74 251 -15 12 -45 63 -39
Mircera - - - - - - - - - -
Xeloda 12 3 13 13 5 -71 12 -24 10 -21
NeoRecormon/Epogin - - - - - - - - - -
Rocephin - - - - - - - - 1 -
Valcyte/Cymevene 16 -86 33 -64 19 -25 19 15 14 -10
Madopar - - - - - - - - - -
** Over 500%
17/19
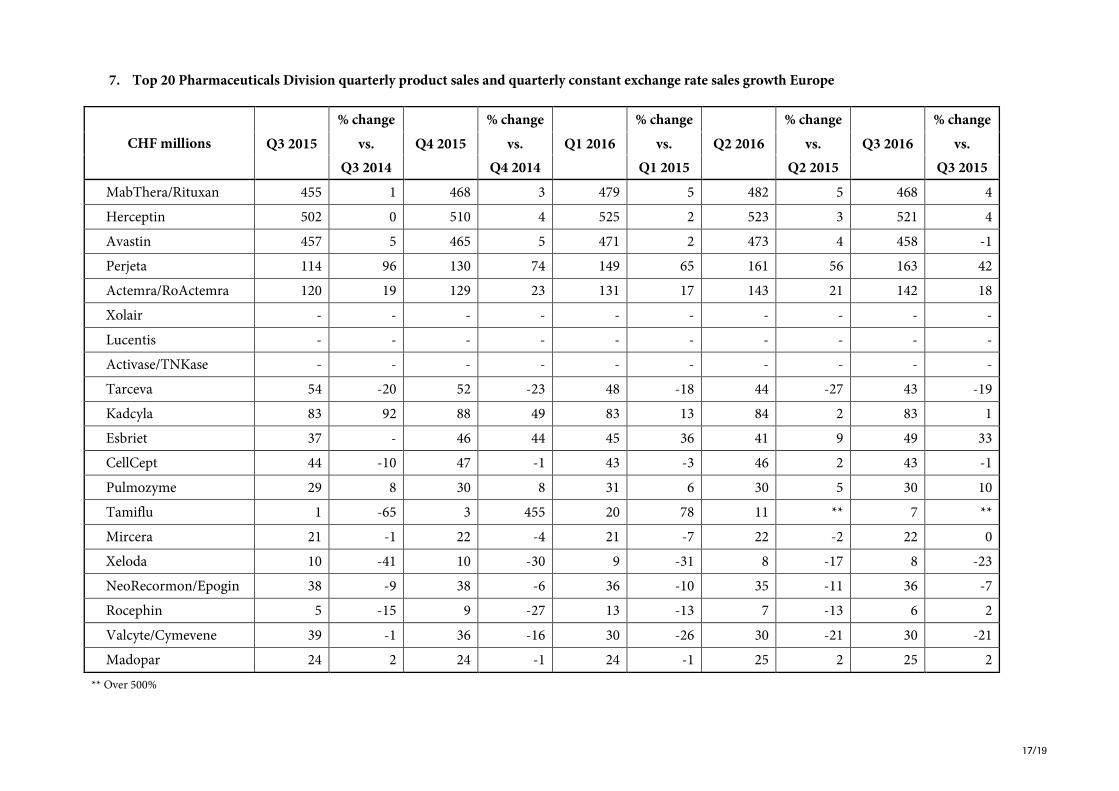
7. Top 20 Pharmaceuticals Division quarterly product sales and quarterly constant exchange rate sales growth Europe
CHF millions
% change % change % change % change % change
Q3 2015 vs. Q4 2015 vs. Q1 2016 vs. Q2 2016 vs. Q3 2016 vs.
Q3 2014 Q4 2014 Q1 2015 Q2 2015 Q3 2015
MabThera/Rituxan 455 1 468 3 479 5 482 5 468 4
Herceptin 502 0 510 4 525 2 523 3 521 4
Avastin 457 5 465 5 471 2 473 4 458 -1
Perjeta 114 96 130 74 149 65 161 56 163 42
Actemra/RoActemra 120 19 129 23 131 17 143 21 142 18
Xolair - - - - - - - - - -
Lucentis - - - - - - - - - -
Activase/TNKase - - - - - - - - - -
Tarceva 54 -20 52 -23 48 -18 44 -27 43 -19
Kadcyla 83 92 88 49 83 13 84 2 83 1
Esbriet 37 - 46 44 45 36 41 9 49 33
CellCept 44 -10 47 -1 43 -3 46 2 43 -1
Pulmozyme 29 8 30 8 31 6 30 5 30 10
Tamiflu 1 -65 3 455 20 78 11 ** 7 **
Mircera 21 -1 22 -4 21 -7 22 -2 22 0
Xeloda 10 -41 10 -30 9 -31 8 -17 8 -23
NeoRecormon/Epogin 38 -9 38 -6 36 -10 35 -11 36 -7
Rocephin 5 -15 9 -27 13 -13 7 -13 6 2
Valcyte/Cymevene 39 -1 36 -16 30 -26 30 -21 30 -21
Madopar 24 2 24 -1 24 -1 25 2 25 2
** Over 500%
18/19
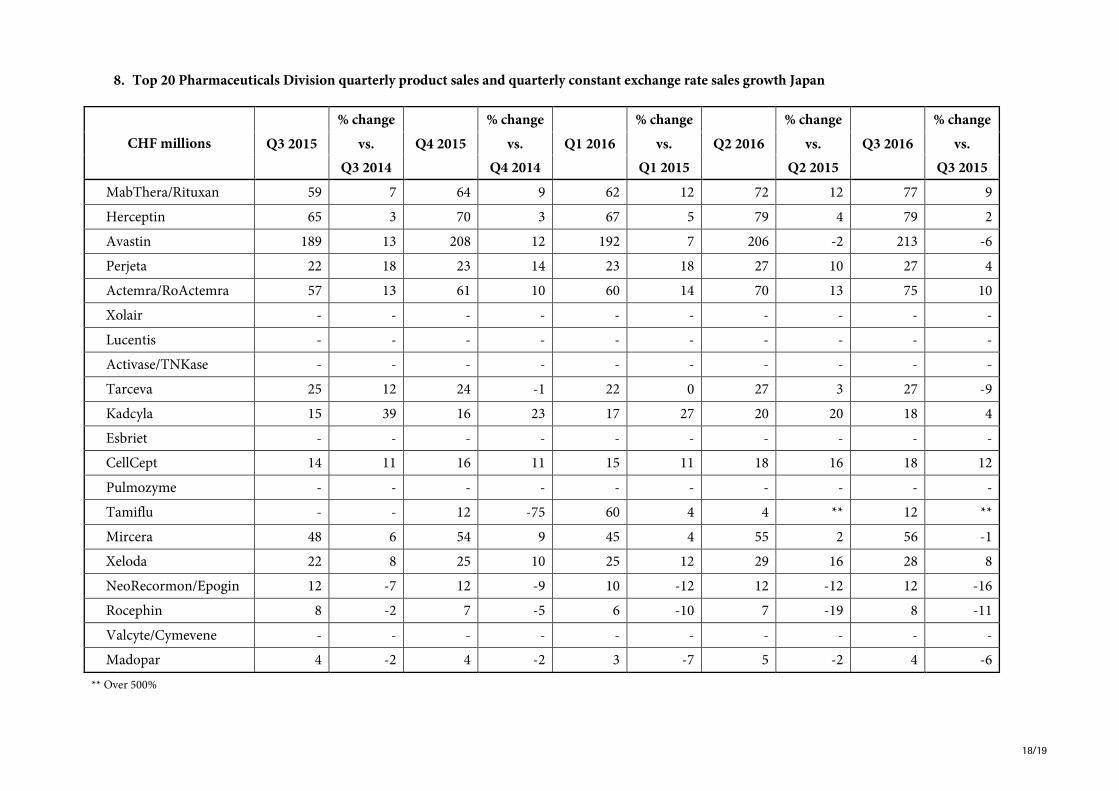
8. Top 20 Pharmaceuticals Division quarterly product sales and quarterly constant exchange rate sales growth Japan
CHF millions
% change % change % change % change % change
Q3 2015 vs. Q4 2015 vs. Q1 2016 vs. Q2 2016 vs. Q3 2016 vs.
Q3 2014 Q4 2014 Q1 2015 Q2 2015 Q3 2015
MabThera/Rituxan 59 7 64 9 62 12 72 12 77 9
Herceptin 65 3 70 3 67 5 79 4 79 2
Avastin 189 13 208 12 192 7 206 -2 213 -6
Perjeta 22 18 23 14 23 18 27 10 27 4
Actemra/RoActemra 57 13 61 10 60 14 70 13 75 10
Xolair - - - - - - - - - -
Lucentis - - - - - - - - - -
Activase/TNKase - - - - - - - - - -
Tarceva 25 12 24 -1 22 0 27 3 27 -9
Kadcyla 15 39 16 23 17 27 20 20 18 4
Esbriet - - - - - - - - - -
CellCept 14 11 16 11 15 11 18 16 18 12
Pulmozyme - - - - - - - - - -
Tamiflu - - 12 -75 60 4 4 ** 12 **
Mircera 48 6 54 9 45 4 55 2 56 -1
Xeloda 22 8 25 10 25 12 29 16 28 8
NeoRecormon/Epogin 12 -7 12 -9 10 -12 12 -12 12 -16
Rocephin 8 -2 7 -5 6 -10 7 -19 8 -11
Valcyte/Cymevene - - - - - - - - - -
Madopar 4 -2 4 -2 3 -7 5 -2 4 -6
** Over 500%
19/19
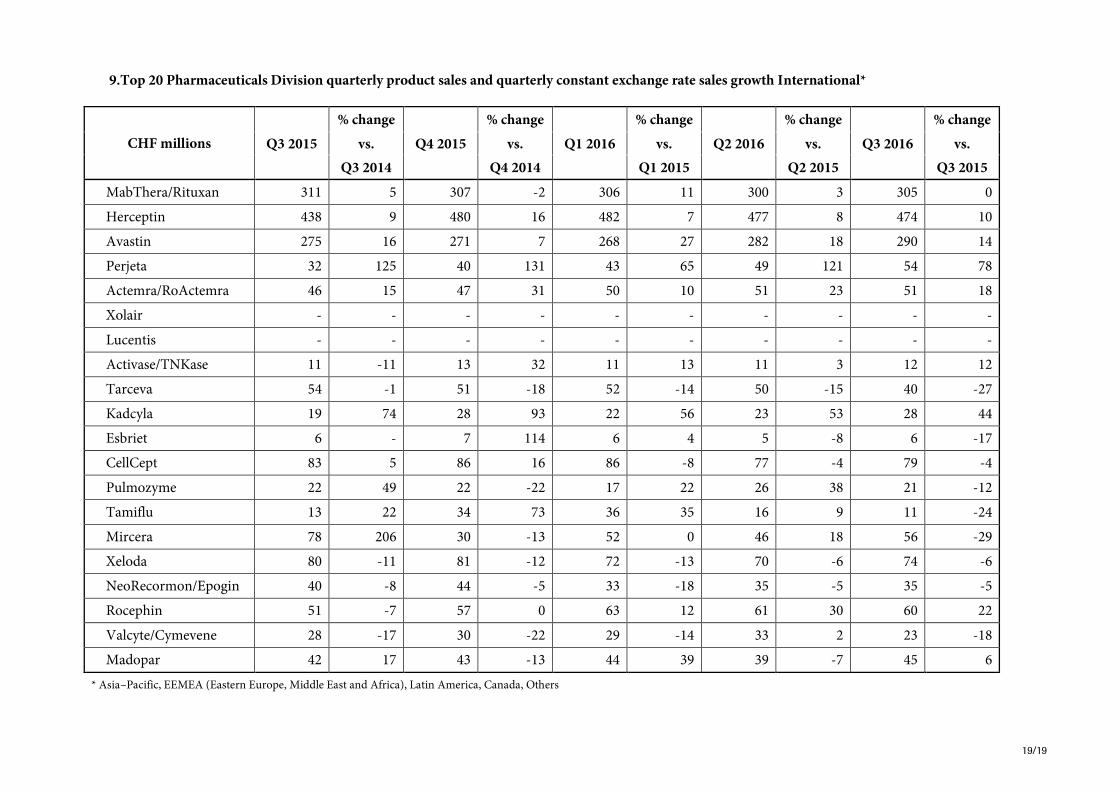
9.Top 20 Pharmaceuticals Division quarterly product sales and quarterly constant exchange rate sales growth International*
CHF millions
% change % change % change % change % change
Q3 2015 vs. Q4 2015 vs. Q1 2016 vs. Q2 2016 vs. Q3 2016 vs.
Q3 2014 Q4 2014 Q1 2015 Q2 2015 Q3 2015
MabThera/Rituxan 311 5 307 -2 306 11 300 3 305 0
Herceptin 438 9 480 16 482 7 477 8 474 10
Avastin 275 16 271 7 268 27 282 18 290 14
Perjeta 32 125 40 131 43 65 49 121 54 78
Actemra/RoActemra 46 15 47 31 50 10 51 23 51 18
Xolair - - - - - - - - - -
Lucentis - - - - - - - - - -
Activase/TNKase 11 -11 13 32 11 13 11 3 12 12
Tarceva 54 -1 51 -18 52 -14 50 -15 40 -27
Kadcyla 19 74 28 93 22 56 23 53 28 44
Esbriet 6 - 7 114 6 4 5 -8 6 -17
CellCept 83 5 86 16 86 -8 77 -4 79 -4
Pulmozyme 22 49 22 -22 17 22 26 38 21 -12
Tamiflu 13 22 34 73 36 35 16 9 11 -24
Mircera 78 206 30 -13 52 0 46 18 56 -29
Xeloda 80 -11 81 -12 72 -13 70 -6 74 -6
NeoRecormon/Epogin 40 -8 44 -5 33 -18 35 -5 35 -5
Rocephin 51 -7 57 0 63 12 61 30 60 22
Valcyte/Cymevene 28 -17 30 -22 29 -14 33 2 23 -18
Madopar 42 17 43 -13 44 39 39 -7 45 6
* Asia–Pacific, EEMEA (Eastern Europe, Middle East and Africa), Latin America, Canada, Others