investors’ meeting -...
TRANSCRIPT
© 2006 Express Scripts, Inc.All Rights Reserved
INVESTORS’ MEETINGTempe, AZ
April 7, 2006
Our Pathways to Patients: Alignment in Action
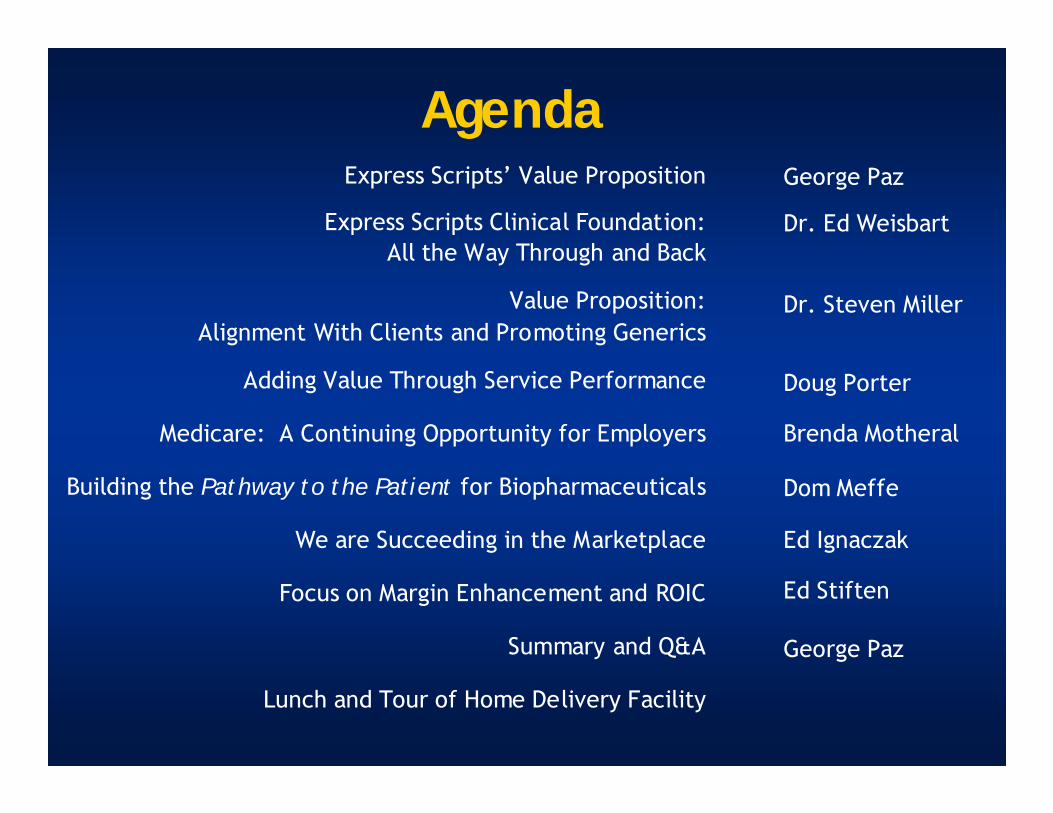
AgendaExpress Scripts’ Value Proposition
Express Scripts Clinical Foundation:All the Way Through and Back
Value Proposition:Alignment With Clients and Promoting Generics
Adding Value Through Service Performance
Medicare: A Continuing Opportunity for Employers
Building the Pathway to the Patient for Biopharmaceuticals
We are Succeeding in the Marketplace
Focus on Margin Enhancement and ROIC
Summary and Q&A
Lunch and Tour of Home Delivery Facility
George Paz
Dr. Ed Weisbart
Dr. Steven Miller
Doug Porter
Brenda Motheral
Dom Meffe
Ed Ignaczak
Ed Stiften
George Paz
© 2006 Express Scripts, Inc.All Rights Reserved 3
Statements included in this presentation or in the oral comments made as part of this presentation may contain forward-looking statements, including but not limited to statements of the Company’s plans, objectives, expectations or intentions, that involve risk and uncertainties.
The Company’s actual results may differ significantly from those projected or suggested in any forward-looking statement due to a variety of factors, which are discussed in detail in the Company’s filings with the Securities and Exchange Commission.
Forward-Looking Statements
© 2006 Express Scripts, Inc.All Rights Reserved
George PazPresident and CEO
Express Scripts’Value Proposition
© 2006 Express Scripts, Inc.All Rights Reserved 5
2005 Was An Outstanding Year
• Record earnings per share• Record cash flow• Record profits per adjusted Rx• 3rd highest total return of S&P 500• Industry-leading ROIC
But more importantly, we are well-positioned for the future.

© 2006 Express Scripts, Inc.All Rights Reserved 6
Why Express Scripts?• Differentiation Through Alignment
– A proud legacy of alignment, transparency and disclosure
• Strategic Execution– Growth by reducing drug costs, without compromising
health outcomes, while maximizing patient satisfaction
• Room to Run– Generics, home delivery and specialty pharmacy:
Platforms for long-term growth
Superior Growth, ROIC and Shareholder Value

© 2006 Express Scripts, Inc.All Rights Reserved 7
Why Our Model Works?Alignment
Retail Non-Preferred Brand
Retail Preferred
Brand
GenericsHome Delivery
Increased SavingsOpportunities:
Client
Member
Increased
Profit
Opportunities:
Express Scripts
Moving to preferred brands, mail and generics
Moving to preferred brands, mail and generics
Moving to preferred brands, mail and generics
As We Save Our Clients Money, Our Performance Improves

© 2006 Express Scripts, Inc.All Rights Reserved 8
First and Foremost: Execution
• Record sales and retention
• Record patient and client satisfaction
• Record industry-leading generic use
• Industry-leading specialty platform
• Superior trend management
© 2006 Express Scripts, Inc.All Rights Reserved 9
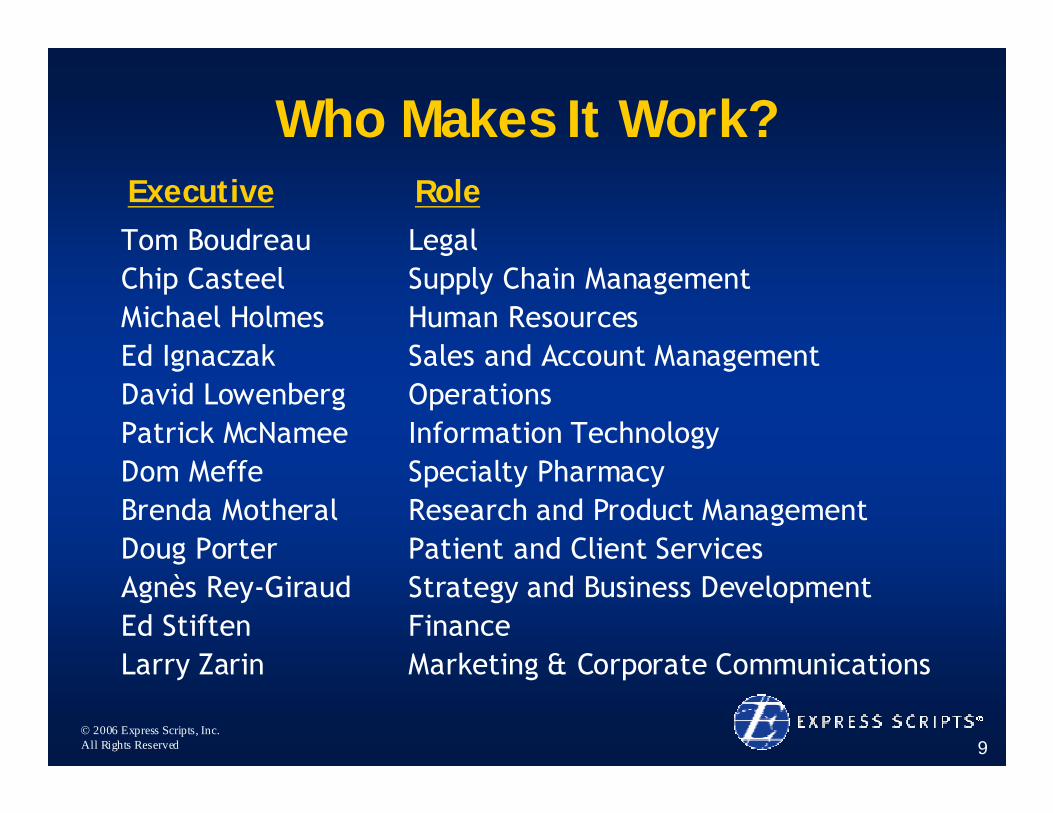
Tom BoudreauChip CasteelMichael HolmesEd IgnaczakDavid LowenbergPatrick McNameeDom MeffeBrenda MotheralDoug PorterAgnès Rey-GiraudEd StiftenLarry Zarin
LegalSupply Chain ManagementHuman ResourcesSales and Account ManagementOperationsInformation TechnologySpecialty PharmacyResearch and Product ManagementPatient and Client ServicesStrategy and Business DevelopmentFinanceMarketing & Corporate Communications
Executive Role
Who Makes It Work?

© 2006 Express Scripts, Inc.All Rights Reserved 10
Today’s Discussion Topics
• Formulary management strategy
• Excellence in client and patient services
• Preparing for emerging markets
• Building the Pathway to the Patient for
biopharmaceuticals
• Sales and marketing success
• Enhancing margins and delivering superior ROIC andshareholder value
© 2006 Express Scripts, Inc.All Rights Reserved
Express Scripts Clinical Foundation: All The Way Through And Back
Ed Weisbart, MDChief Medical Officer
© 2006 Express Scripts, Inc.All Rights Reserved 12
0%
20%
40%
60%
80%
100%
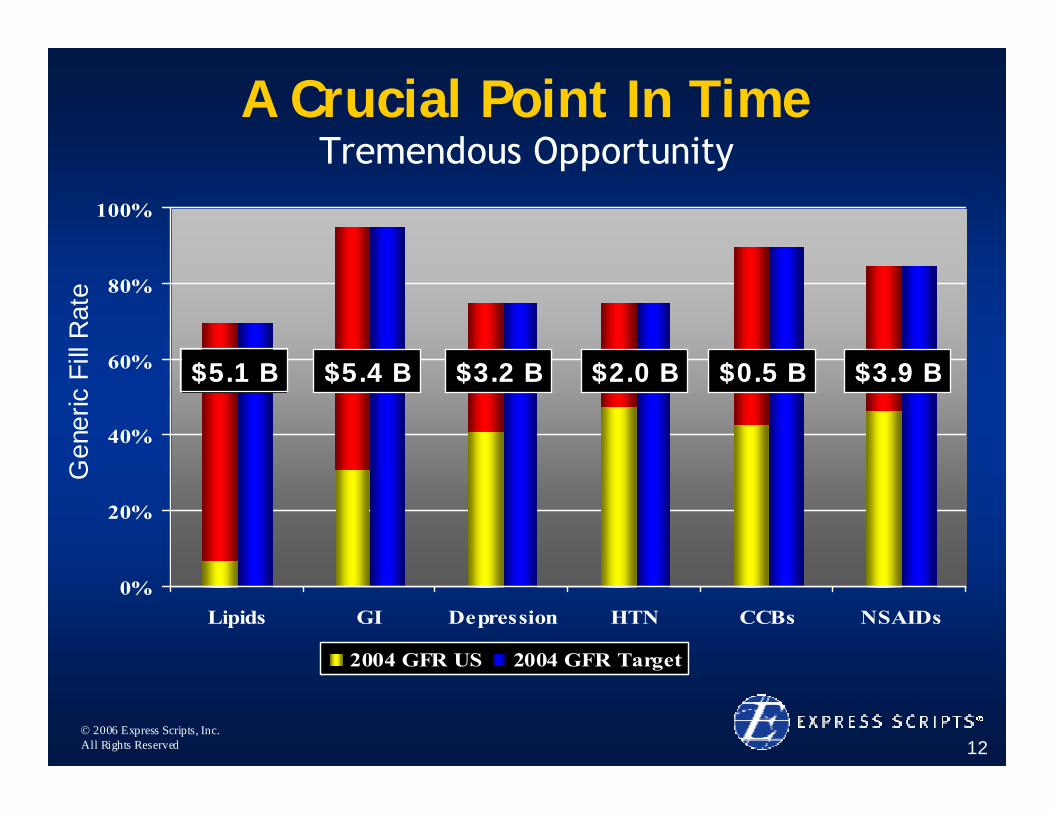
Lipids GI Depression HTN CCBs NSAIDs
2004 GFR US 2004 GFR Target
Gen
eric
Fill
Rat
eA Crucial Point In Time
Tremendous Opportunity
$5.1 B$5.1 B $5.4 B$5.4 B $3.2 B$3.2 B $2.0 B$2.0 B $0.5 B$0.5 B $3.9 B$3.9 B
© 2006 Express Scripts, Inc.All Rights Reserved 13
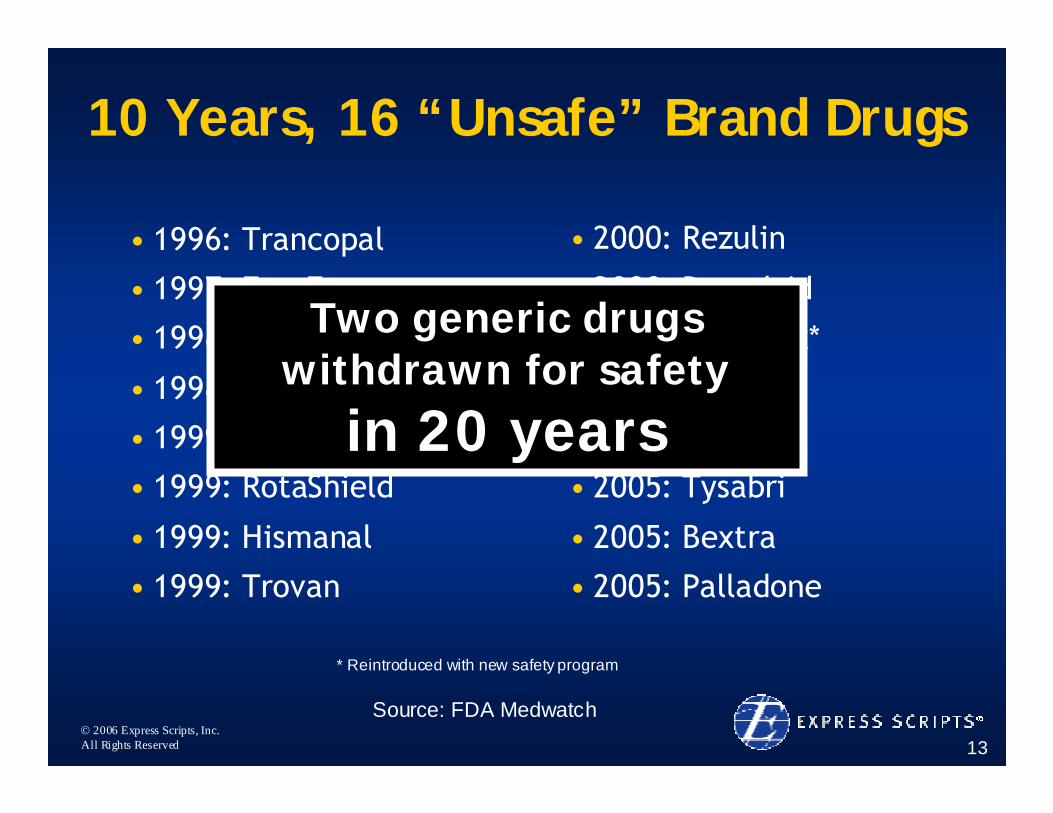
10 Years, 16 “Unsafe” Brand Drugs
• 1996: Trancopal
• 1997: Fen-Fen
• 1998: Duract
• 1998: Posicor
• 1999: Raxar
• 1999: RotaShield
• 1999: Hismanal
• 1999: Trovan
• 2000: Rezulin
• 2000: Propulsid
• 2000: Lotronex*
• 2001: Baycol
• 2004: Vioxx
• 2005: Tysabri
• 2005: Bextra
• 2005: Palladone
* Reintroduced with new safety program
Two generic drugs withdrawn for safety
in 20 years
Source: FDA Medwatch
© 2006 Express Scripts, Inc.All Rights Reserved 14
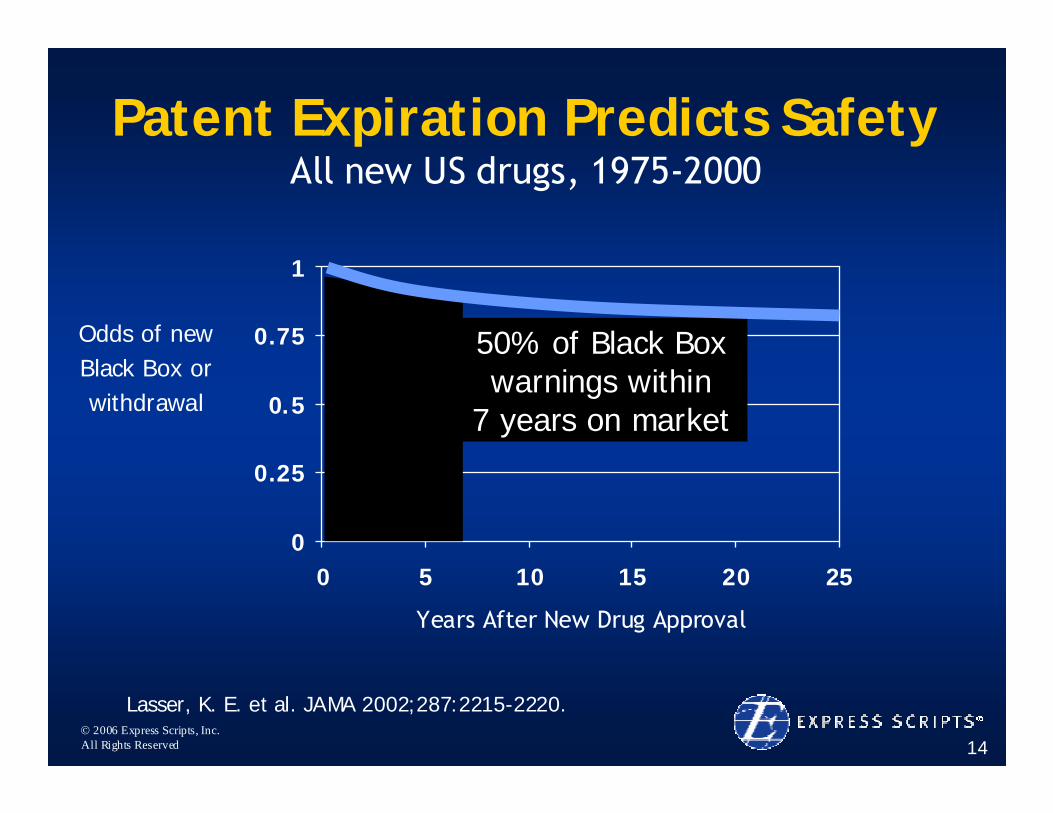
Patent Expiration Predicts Safety
Lasser, K. E. et al. JAMA 2002;287:2215-2220.
All new US drugs, 1975-2000
Odds of new Black Box or withdrawal
0
0.25
0.5
0.75
1
0 5 10 15 20 25
Years After New Drug Approval
50% of Black Box warnings within
7 years on market
© 2006 Express Scripts, Inc.All Rights Reserved 15
0
0.25
0.5
0.75
1
0 5 10 15 20 25
Years After New Drug Approval
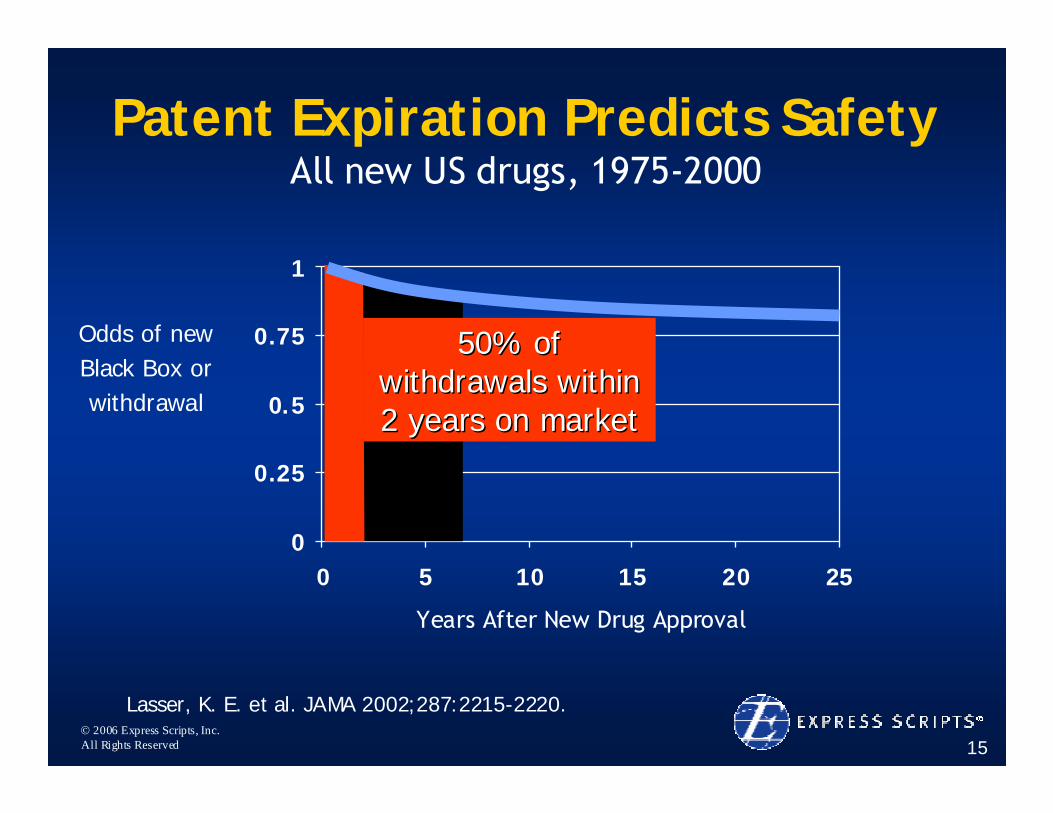
50% of 50% of withdrawals within withdrawals within 2 years on market2 years on market
Lasser, K. E. et al. JAMA 2002;287:2215-2220.
Odds of new Black Box or withdrawal
All new US drugs, 1975-2000Patent Expiration Predicts Safety
© 2006 Express Scripts, Inc.All Rights Reserved 16
0
0.25
0.5
0.75
1
0 5 10 15 20 25
Years After New Drug Approval
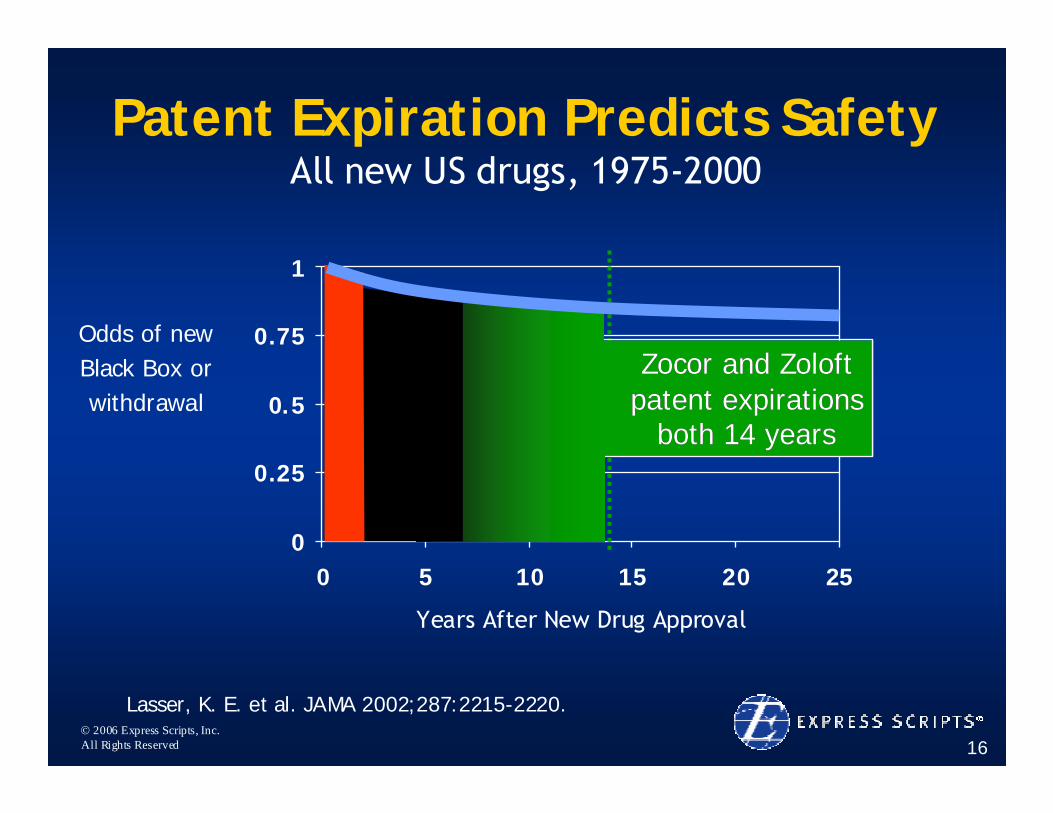
Zocor and Zoloft Zocor and Zoloft patent expirations patent expirations
both 14 yearsboth 14 years
Lasser, K. E. et al. JAMA 2002;287:2215-2220.
Odds of new Black Box or withdrawal
All new US drugs, 1975-2000Patent Expiration Predicts Safety
© 2006 Express Scripts, Inc.All Rights Reserved 17
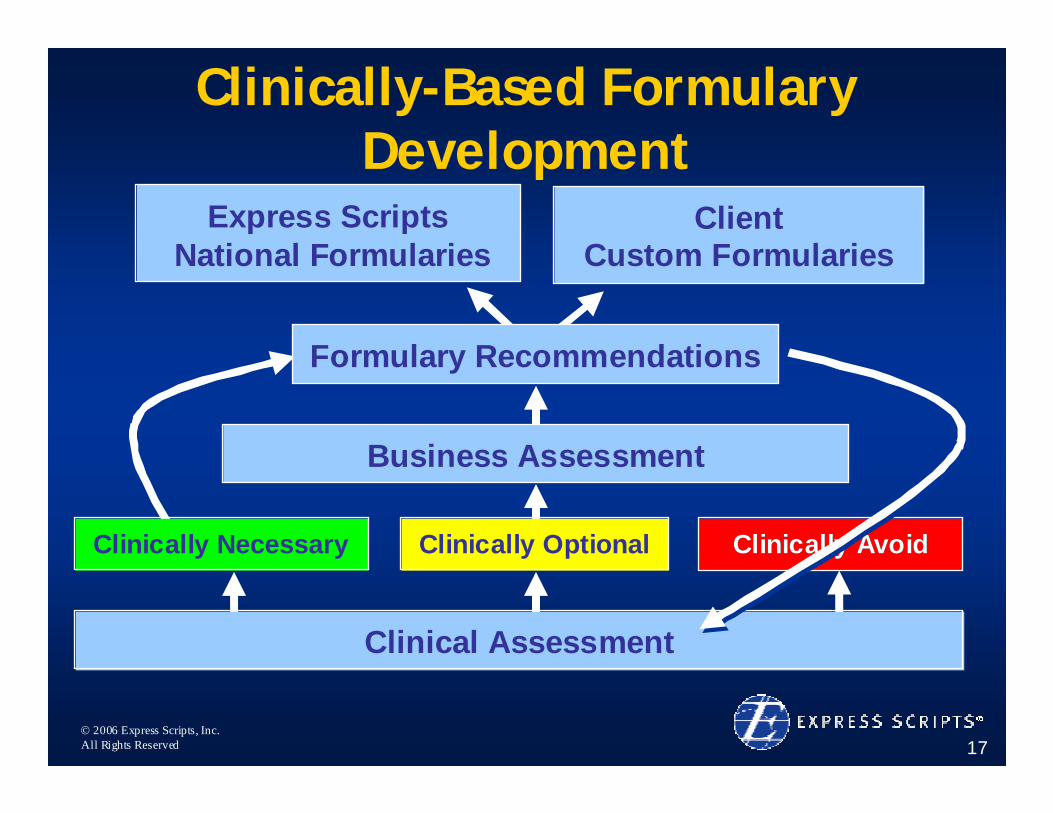
Client Custom Formularies
Express ScriptsNational Formularies
Business Assessment
Clinically-Based Formulary Development
Clinically AvoidClinically AvoidClinically Necessary Clinically Optional
Clinical Assessment
Formulary Recommendations
© 2006 Express Scripts, Inc.All Rights Reserved 18
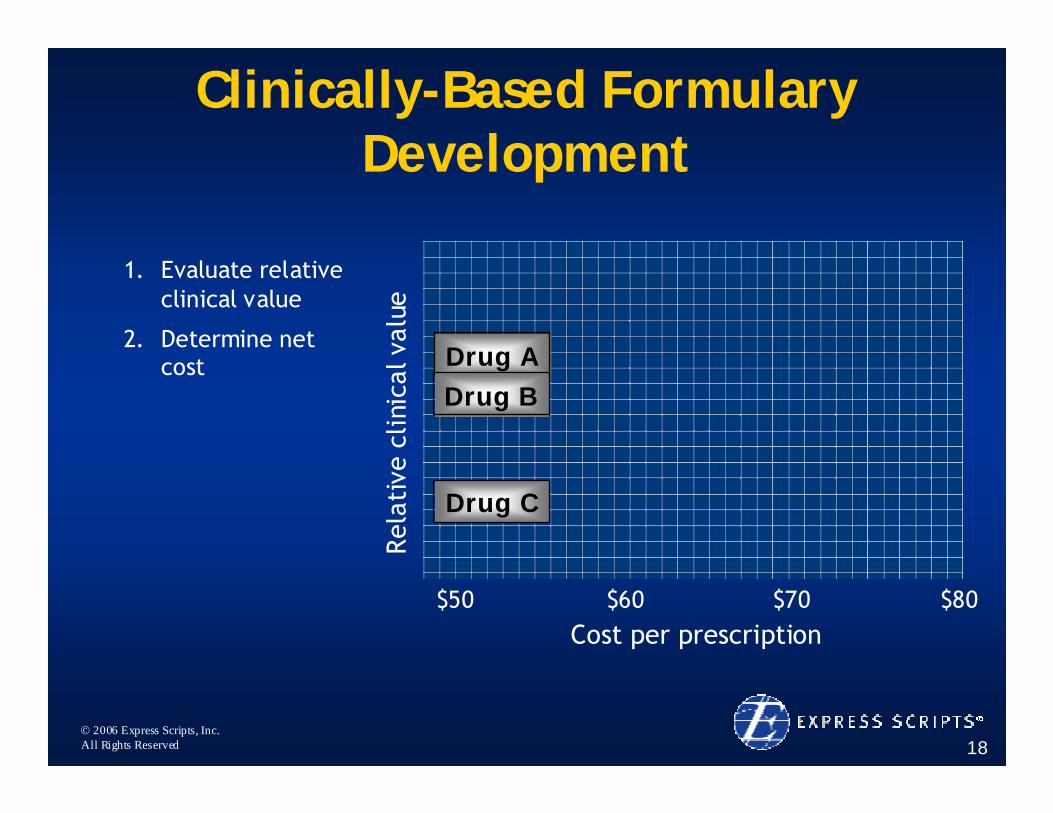
1. Evaluate relative clinical value
2. Determine net cost
Cost per prescription
Clinically-Based Formulary Development
Drug ADrug ADrug BDrug B
Drug CDrug C
$60$50 $70 $80
Rela
tive
clin
ical
val
ue
© 2006 Express Scripts, Inc.All Rights Reserved 19
Cost per prescription
Drug A
Drug B
Drug C
Most cost effective
Rela
tive
clin
ical
val
ue
$50 $60 $70 $80
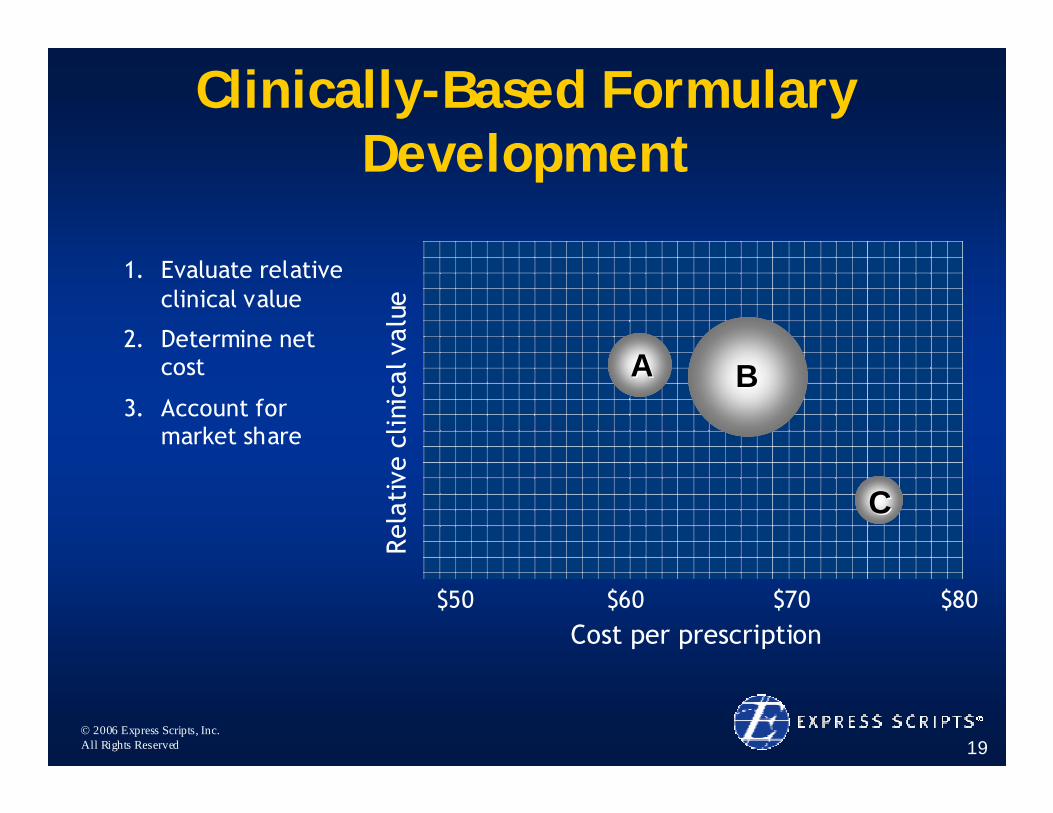
1. Evaluate relative clinical value
2. Determine net cost
3. Account for market share
AA BB
CC
Clinically-Based Formulary Development
© 2006 Express Scripts, Inc.All Rights Reserved 20
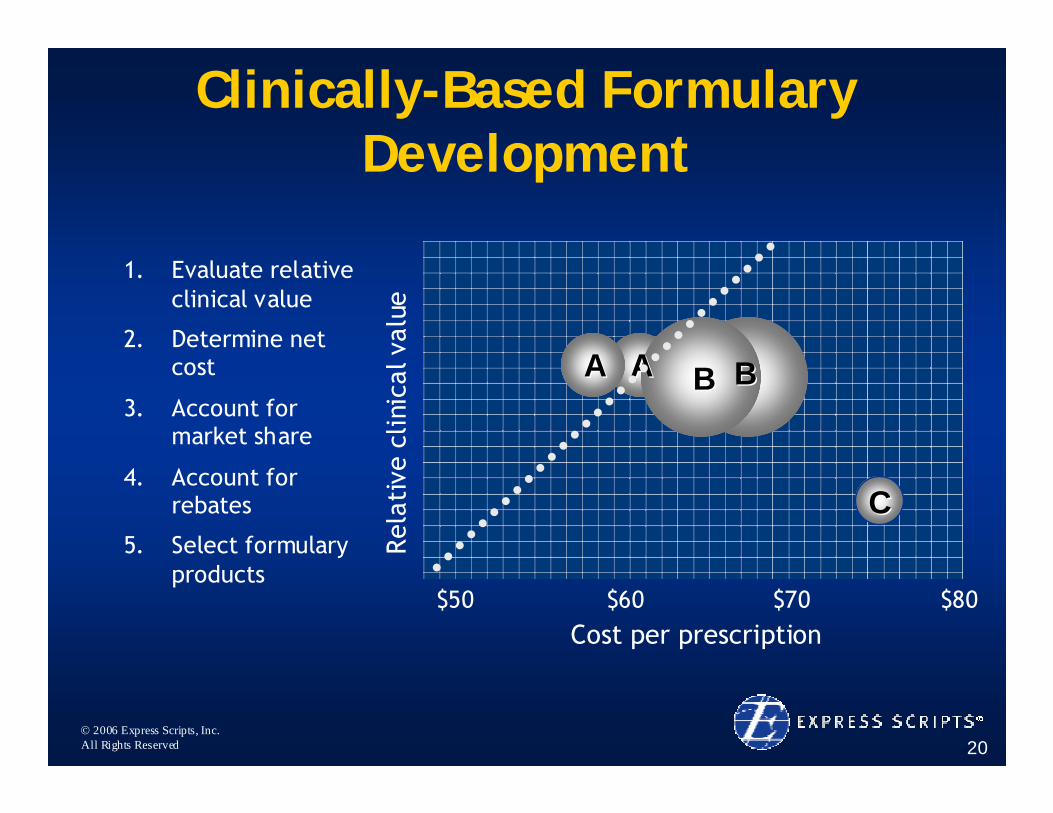
1. Evaluate relative clinical value
2. Determine net cost
3. Account for market share
4. Account for rebates
5. Select formulary products
Cost per prescription
Rela
tive
clin
ical
val
ue
$50 $60 $70 $80
Drug A
Drug B
Drug C
Most cost effective
AA BB
CC
AA BB
Clinically-Based Formulary Development
© 2006 Express Scripts, Inc.All Rights Reserved 21
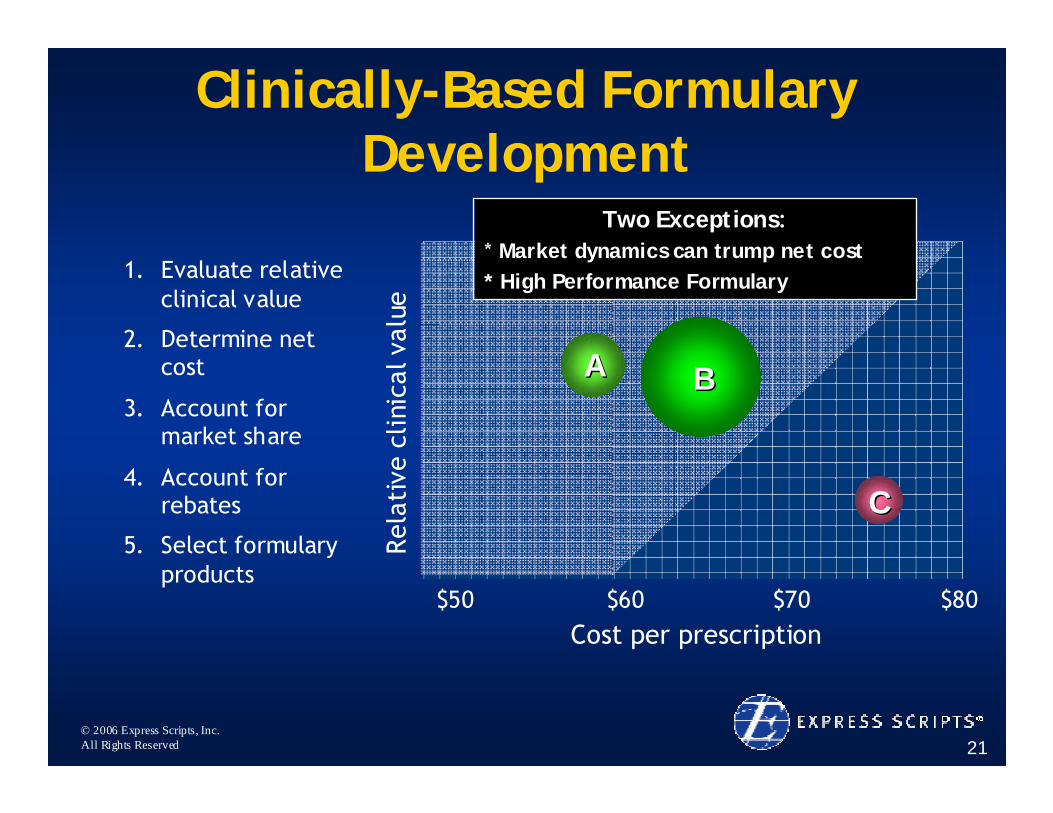
1. Evaluate relative clinical value
2. Determine net cost
3. Account for market share
4. Account for rebates
5. Select formulary products
Cost per prescription
Rela
tive
clin
ical
val
ue
$50 $60 $70 $80
Drug A
Drug B
Drug C
Most cost effective
Two Exceptions: * Market dynamics can trump net cost* High Performance Formulary
AA BB
CC
Clinically-Based Formulary Development
© 2006 Express Scripts, Inc.All Rights Reserved 22
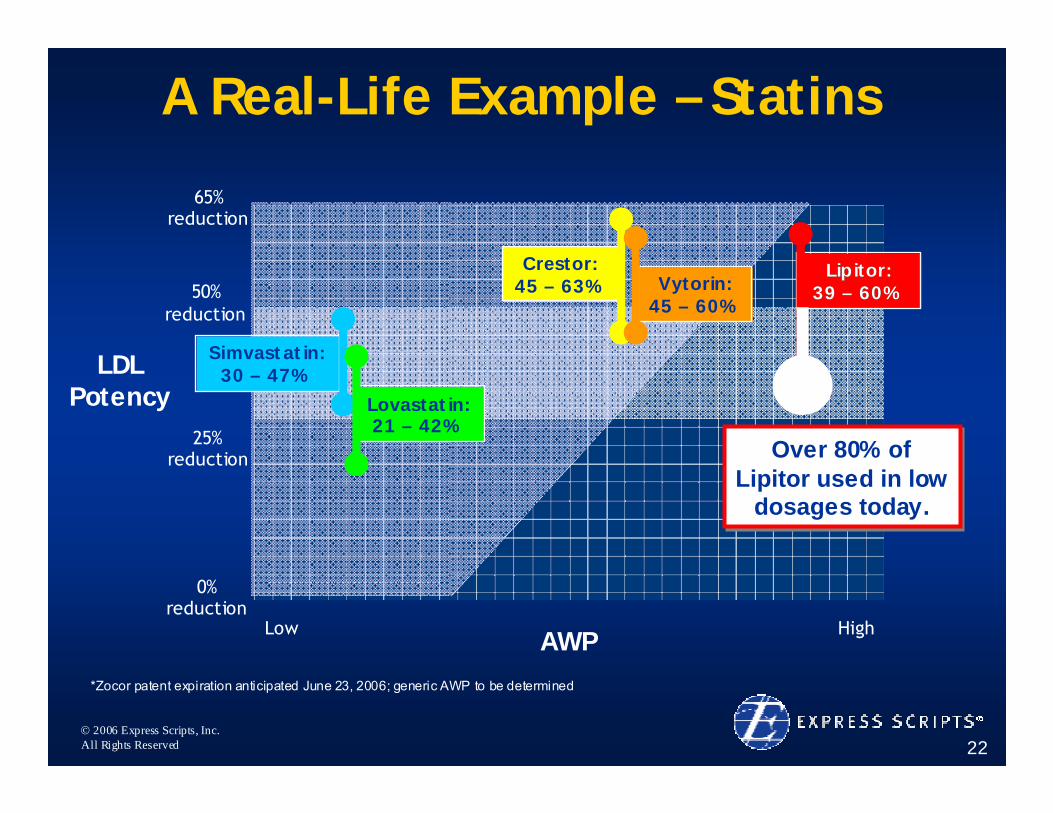
LDL Potency
AWP
A Real-Life Example – Statins
Low High
*Zocor patent expiration anticipated June 23, 2006; generic AWP to be determined
50% reduction
65% reduction
25% reduction
0% reduction
Crestor:45 – 63%
Lipitor:Lipitor:39 39 –– 60%60%Vytorin:
45 – 60%
Simvastatin:30 – 47%
Lovastatin: 21 – 42%
Over 80% of Lipitor used in low
dosages today.
Over 80% of Lipitor used in low
dosages today.
© 2006 Express Scripts, Inc.All Rights Reserved 23
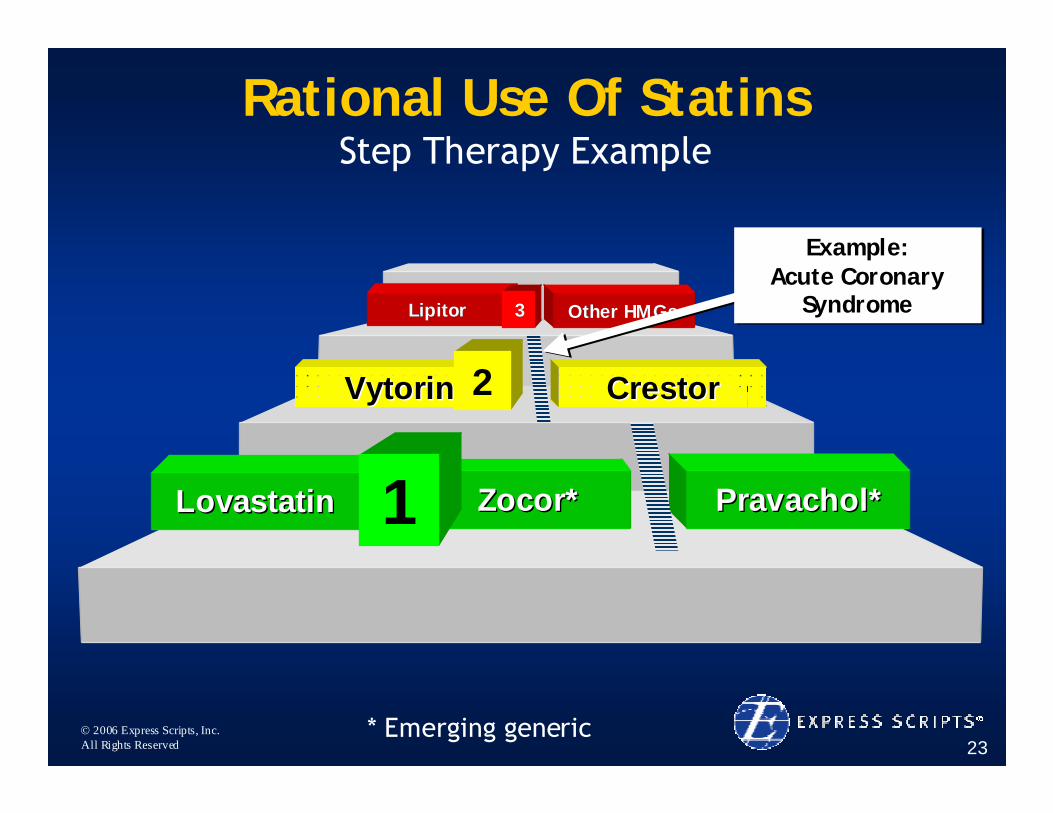
Rational Use Of StatinsStep Therapy Example
Zocor*Zocor*LovastatinLovastatin Pravachol*Pravachol*
LipitorLipitor Other HMGs Other HMGs
VytorinVytorin CrestorCrestor
1
2
33
* Emerging generic
Example: Acute Coronary
Syndrome
Example: Acute Coronary
Syndrome
© 2006 Express Scripts, Inc.All Rights Reserved 24
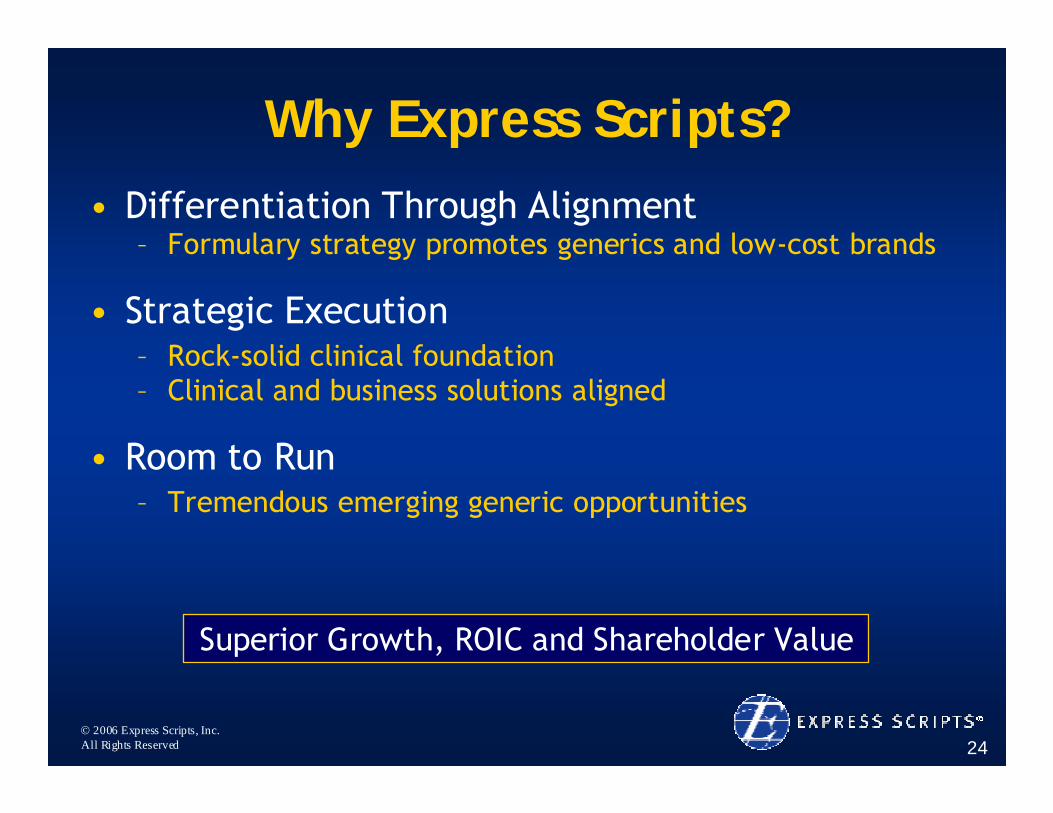
Why Express Scripts?• Differentiation Through Alignment
– Formulary strategy promotes generics and low-cost brands
• Strategic Execution– Rock-solid clinical foundation– Clinical and business solutions aligned
• Room to Run– Tremendous emerging generic opportunities
Superior Growth, ROIC and Shareholder Value
© 2006 Express Scripts, Inc.All Rights Reserved
The Express Scripts Business Model:Alignment With Clients And
Promoting Generics
Steve Miller, MDVice President, Research and Clinical
Development

© 2006 Express Scripts, Inc.All Rights Reserved 26
What’s Driving Drug Trend?2003 : 2004
3%
27%
70%
0%
20%
40%
60%
80%
New Drugs Utilization Cost/Rx
DTR 2004 : ESI clients with funded integrated benefits
© 2006 Express Scripts, Inc.All Rights Reserved 27
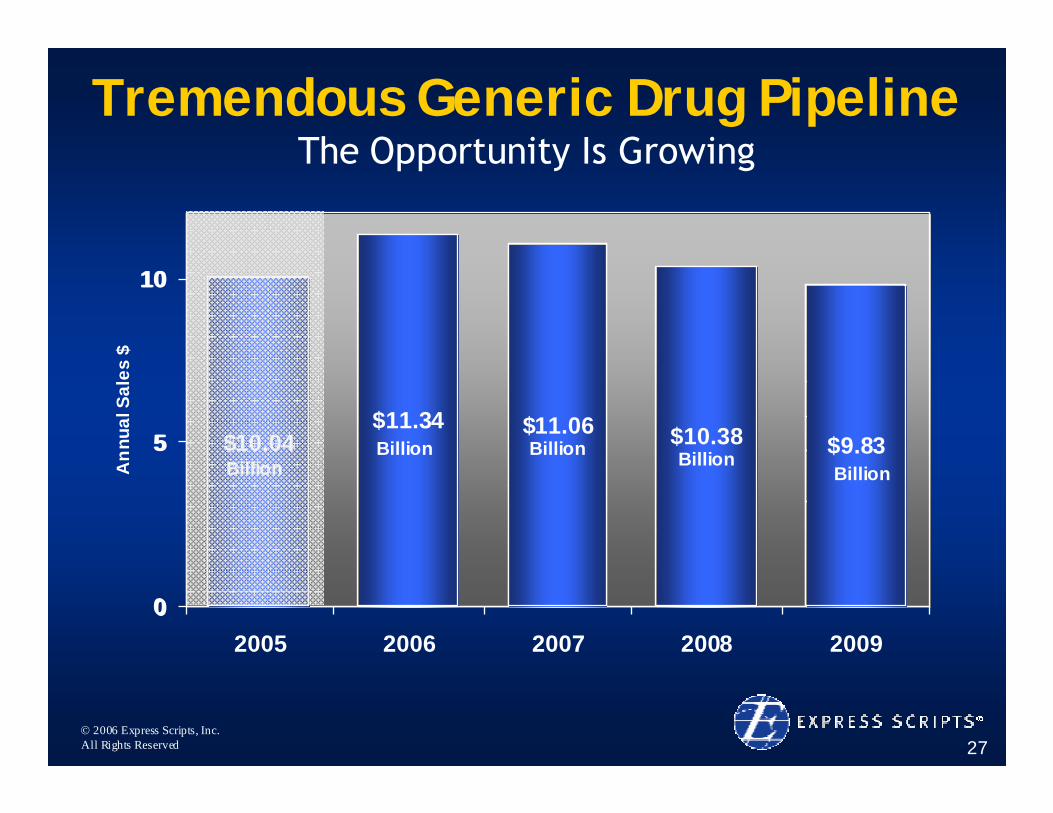
Tremendous Generic Drug PipelineThe Opportunity Is Growing
0
5
10
2005 2006 2007 2008 2009
Ann
ual S
ales
$
Oxycontin
Duragesic
Zithromax
Other
Zocor
Zoloft
Allegra
Pravachol
Other
Norvasc
Ambien
Zyrtec
Other
Advair
Effexor/XR
Fosamax
Risperdal
Other
Prevacid
Lexapro
Avandia
Topamax
Other
$10.04$11.34 $11.06 $10.38 $9.83
0
5
10
BillionBillion
Billion BillionBillion
© 2006 Express Scripts, Inc.All Rights Reserved 28
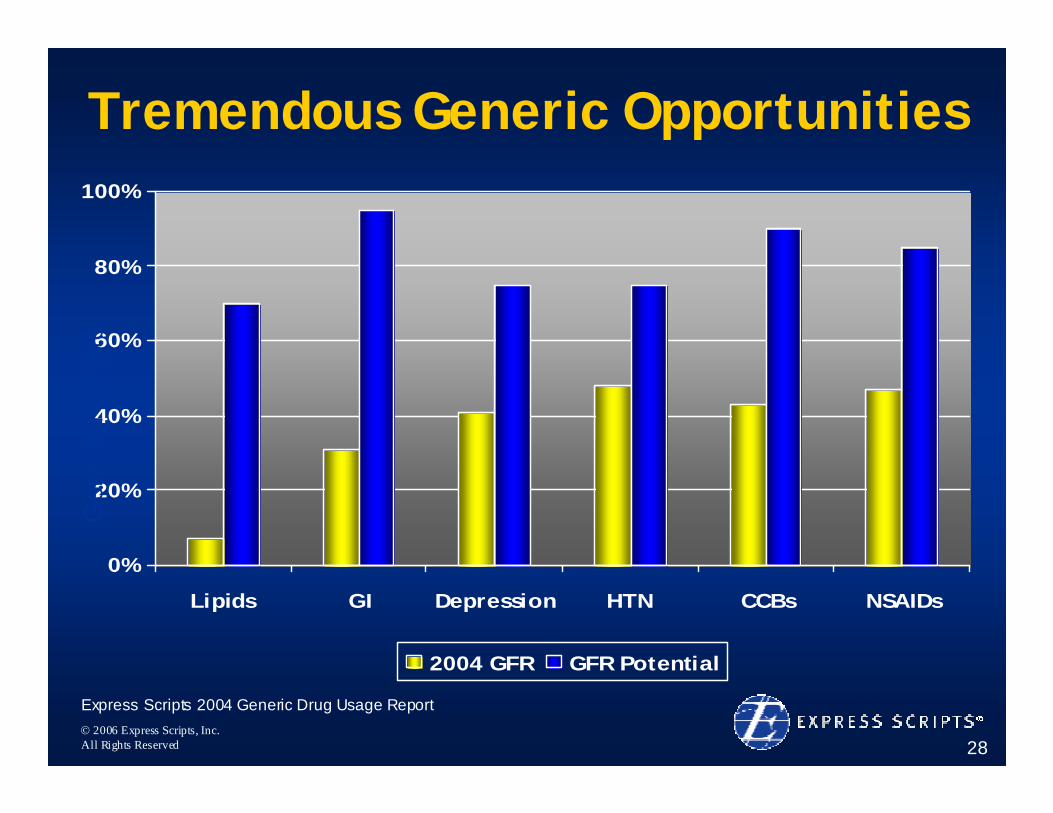
Tremendous Generic Opportunities
0%
20%
40%
60%
80%
100%
Lipids GI Depression HTN CCBs NSAIDs
2004 GFR GFR Potential
Gen
eric
Fill
Rat
e
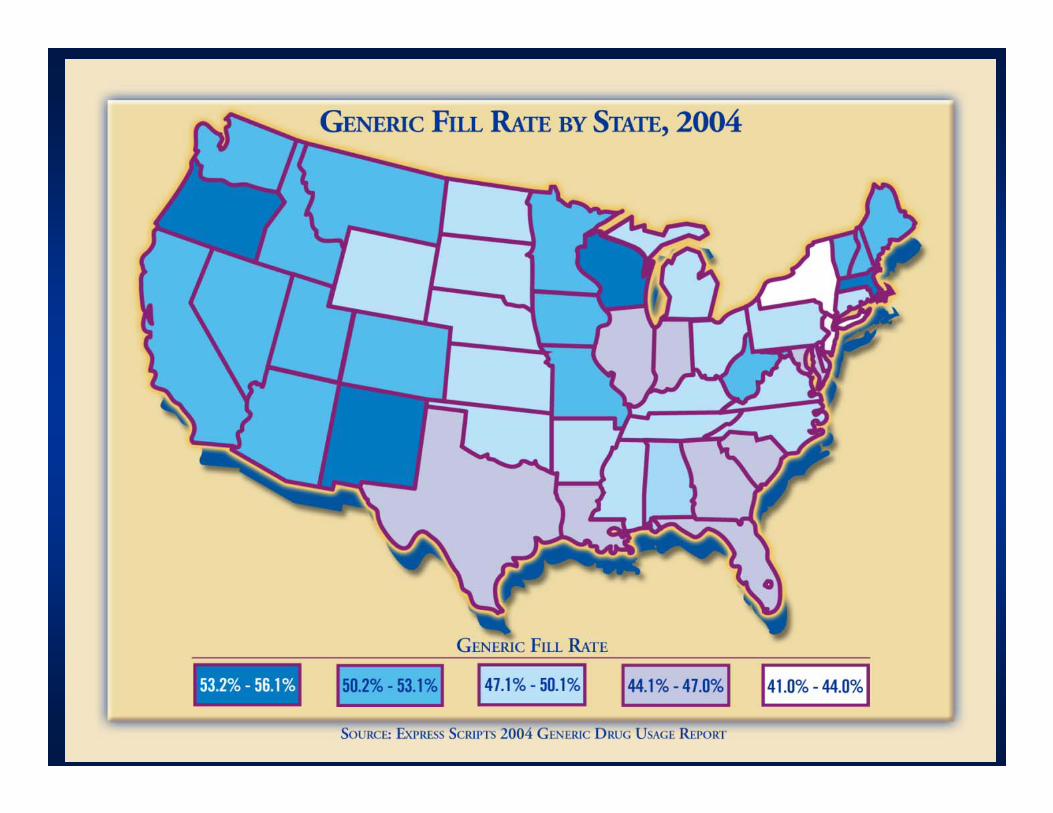
Express Scripts 2004 Generic Drug Usage Report
© 2006 Express Scripts, Inc.All Rights Reserved 29
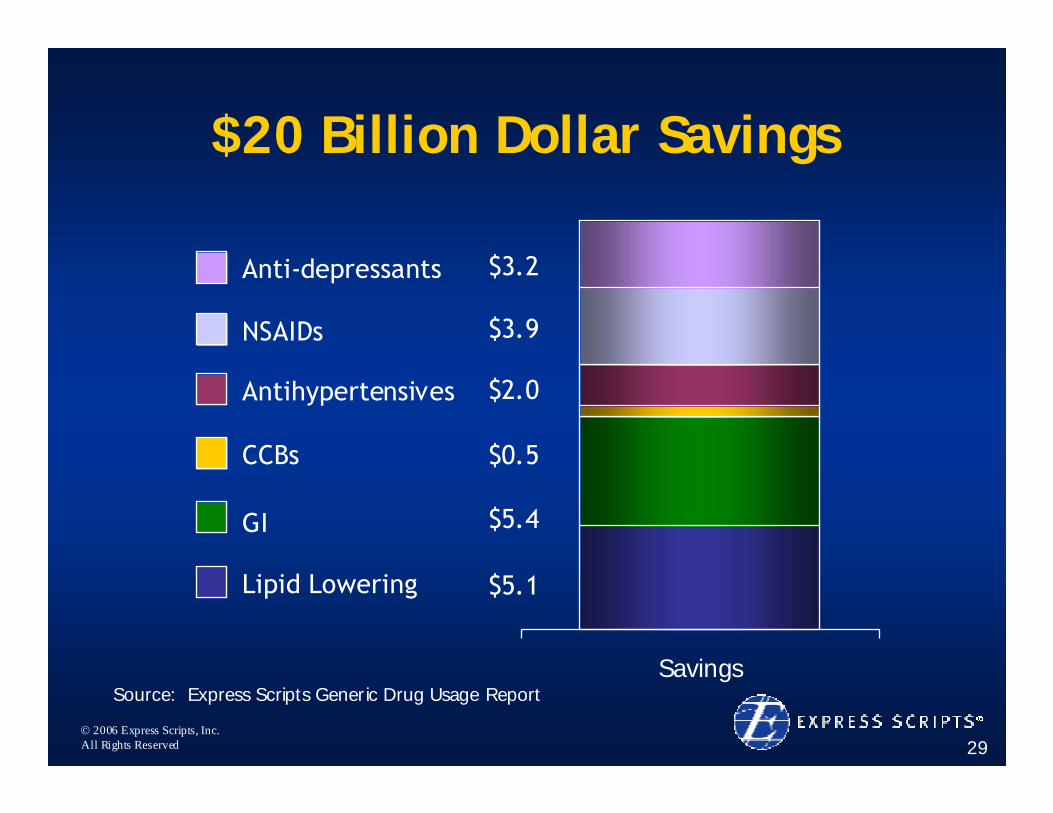
$20 Billion Dollar Savings
SavingsSource: Express Scripts Generic Drug Usage Report
$5.1
$5.4
$0.5
$2.0
$3.9
$3.2Anti-depressants
NSAIDs
Antihypertensives
CCBs
GI
Lipid Lowering
© 2006 Express Scripts, Inc.All Rights Reserved 30
© 2006 Express Scripts, Inc.All Rights Reserved 31
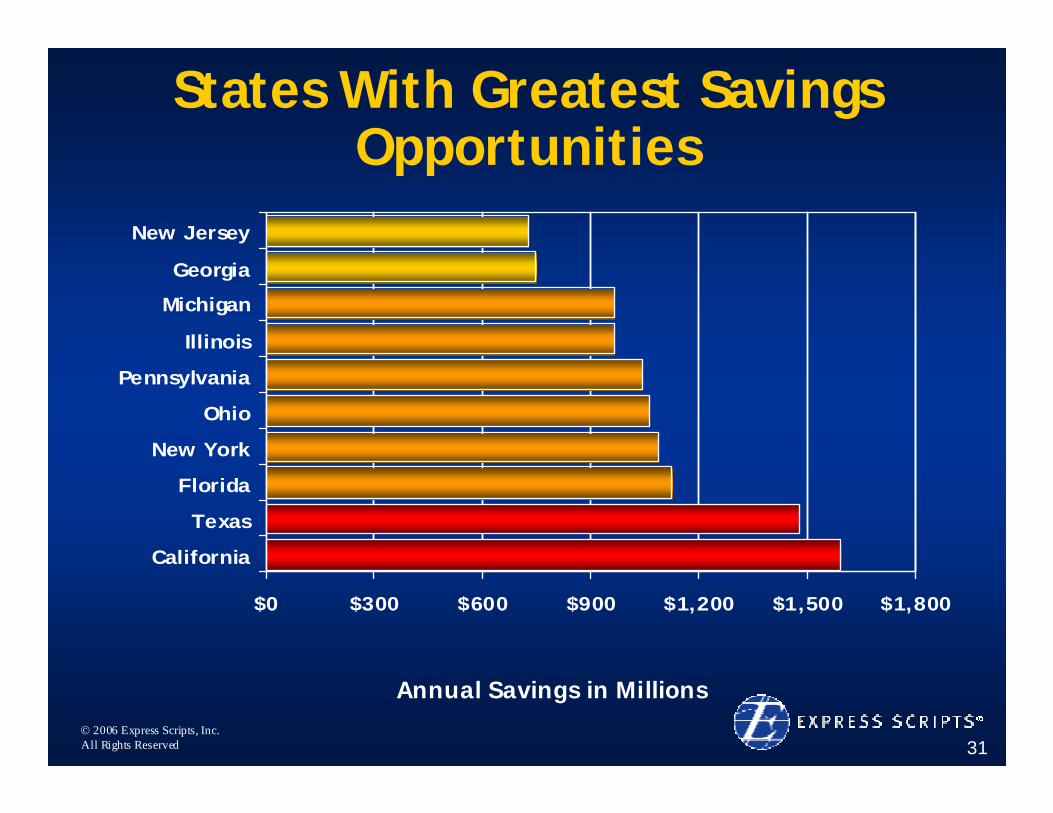
States With Greatest Savings Opportunities
$0 $300 $600 $900 $1,200 $1,500 $1,800
California
Texas
Florida
New York
Ohio
Pennsylvania
Illinois
Michigan
Georgia
New Jersey
Annual Savings in Millions
© 2006 Express Scripts, Inc.All Rights Reserved 32
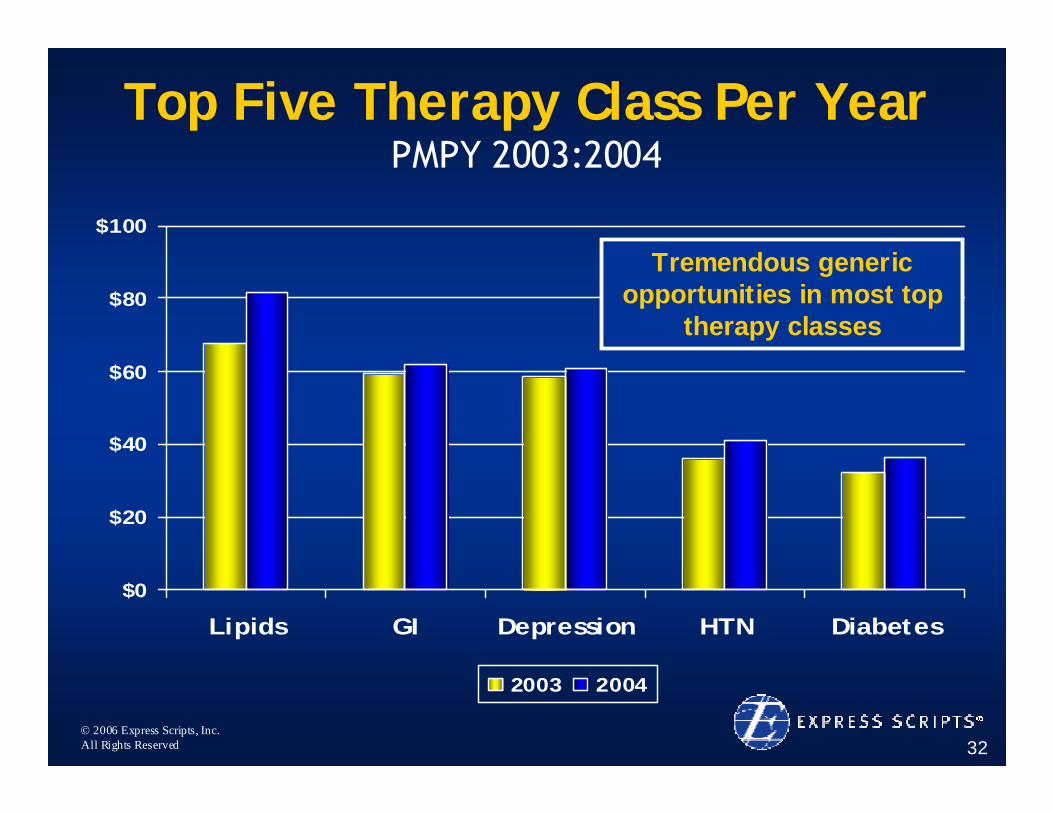
Top Five Therapy Class Per YearPMPY 2003:2004
$0
$20
$40
$60
$80
$100
Lipids GI Depression HTN Diabetes
2003 2004
PMPY
Tremendous generic opportunities in most top
therapy classes
© 2006 Express Scripts, Inc.All Rights Reserved 33
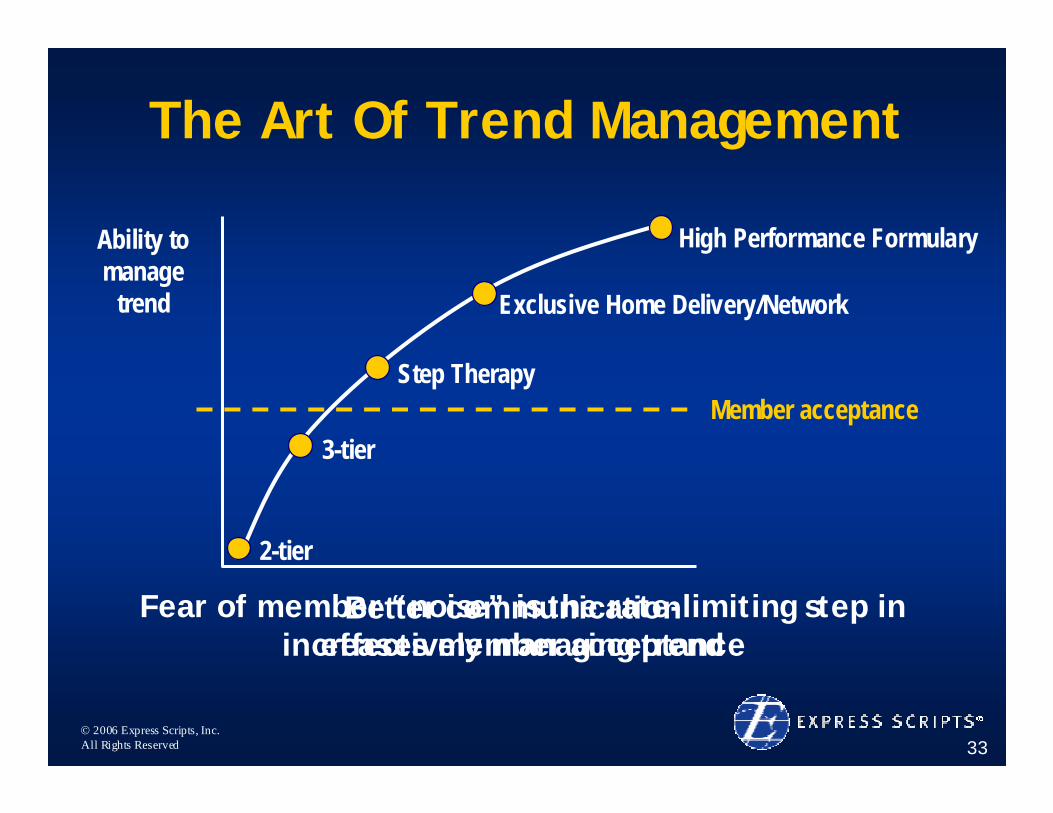
Ability to manage
trend
2-tier
3-tier
Step Therapy
Exclusive Home Delivery/Network
The Art Of Trend Management
Member acceptance
High Performance Formulary
Fear of member “noise” is the rate-limiting step in effectively managing trend
Better communication increases member acceptance
© 2006 Express Scripts, Inc.All Rights Reserved 34
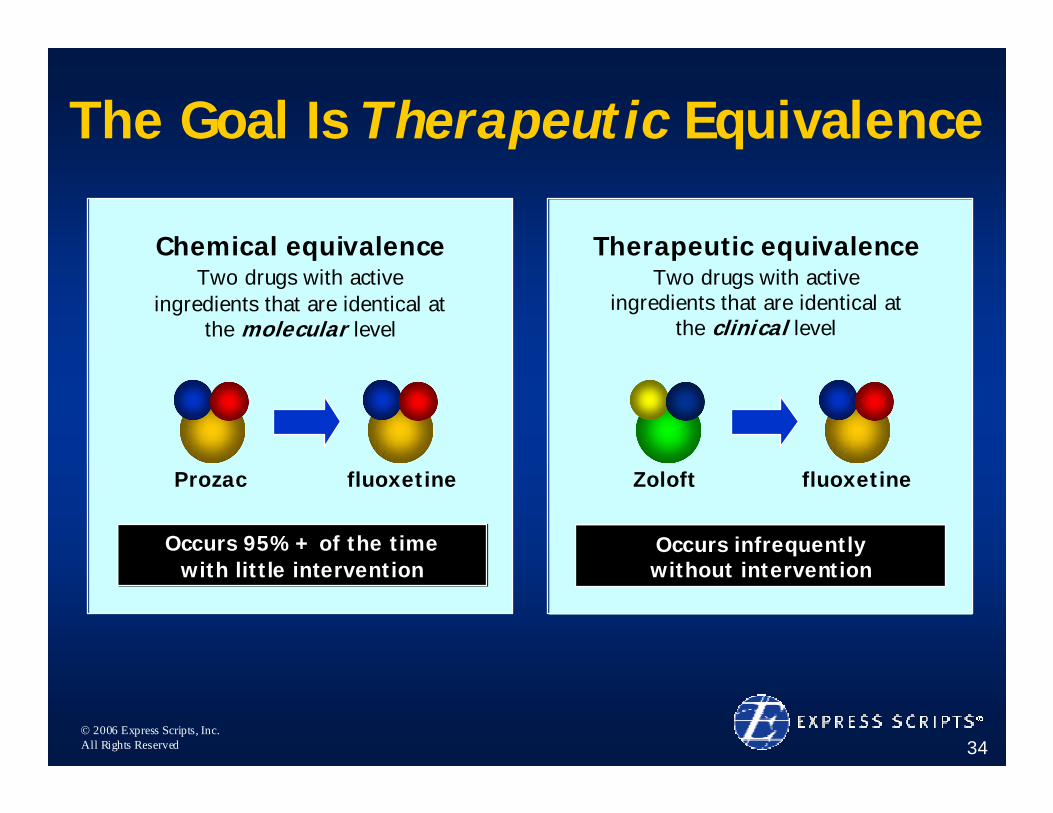
The Goal Is Therapeutic Equivalence
Chemical equivalenceTwo drugs with active
ingredients that are identical at the molecular level
Prozac fluoxetine
Occurs 95%+ of the time with little intervention
Therapeutic equivalenceTwo drugs with active
ingredients that are identical at the clinical level
Zoloft fluoxetine
Occurs infrequently without intervention
© 2006 Express Scripts, Inc.All Rights Reserved 35
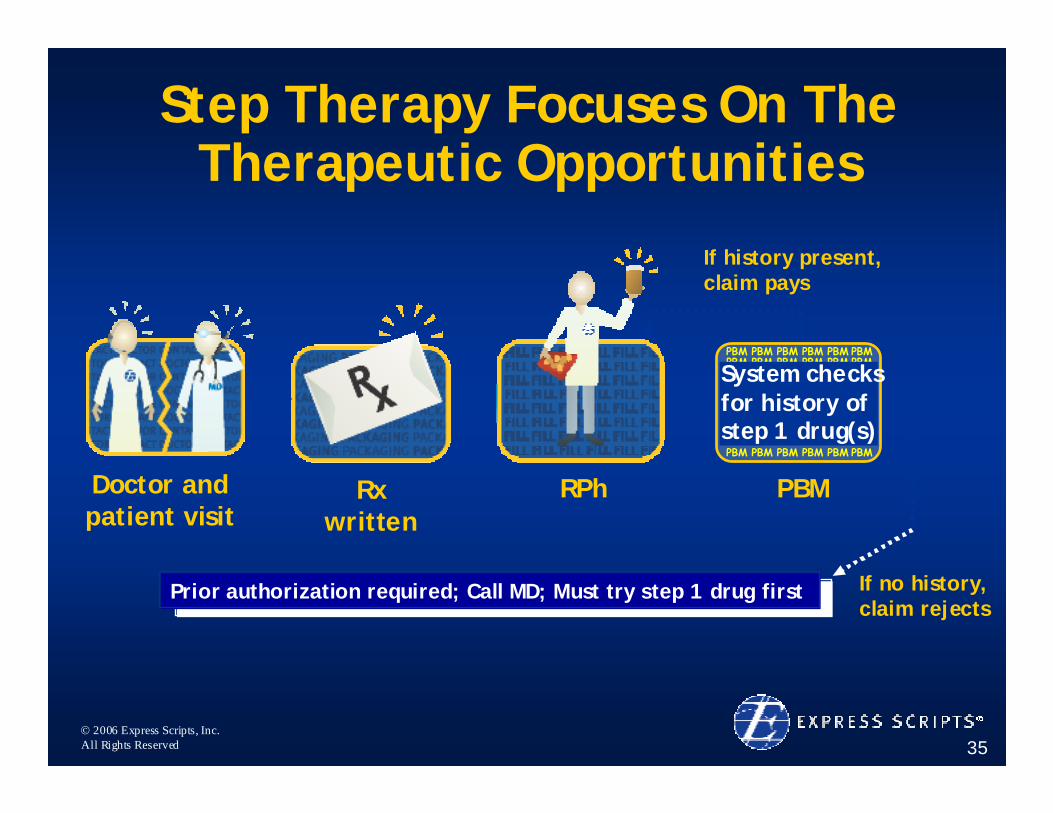
Step Therapy Focuses On The Therapeutic Opportunities
PBM
Prior authorization required; Call MD; Must try step 1 drug first
If history present, claim pays
If no history, claim rejects
Doctor and patient visit
Rx written
PBM PBM PBM PBM PBM PBMPBM PBM PBM PBM PBM PBMPBM PBM PBM PBM PBM PBMPBM PBM PBM PBM PBM PBMPBM PBM PBM PBM PBM PBMPBM PBM PBM PBM PBM PBMPBM PBM PBM PBM PBM PBMPBM PBM PBM PBM PBM PBMPBM PBM PBM PBM PBM PBM
System checks for history of step 1 drug(s)
RPh
© 2006 Express Scripts, Inc.All Rights Reserved 36
$2.00
$3.00
$4.00
$5.00
$6.00
$7.00
$8.00
$9.00
Mar-02 Jul-02 Nov-02 Mar-03
Step Therapy Client All Non-Step Clients
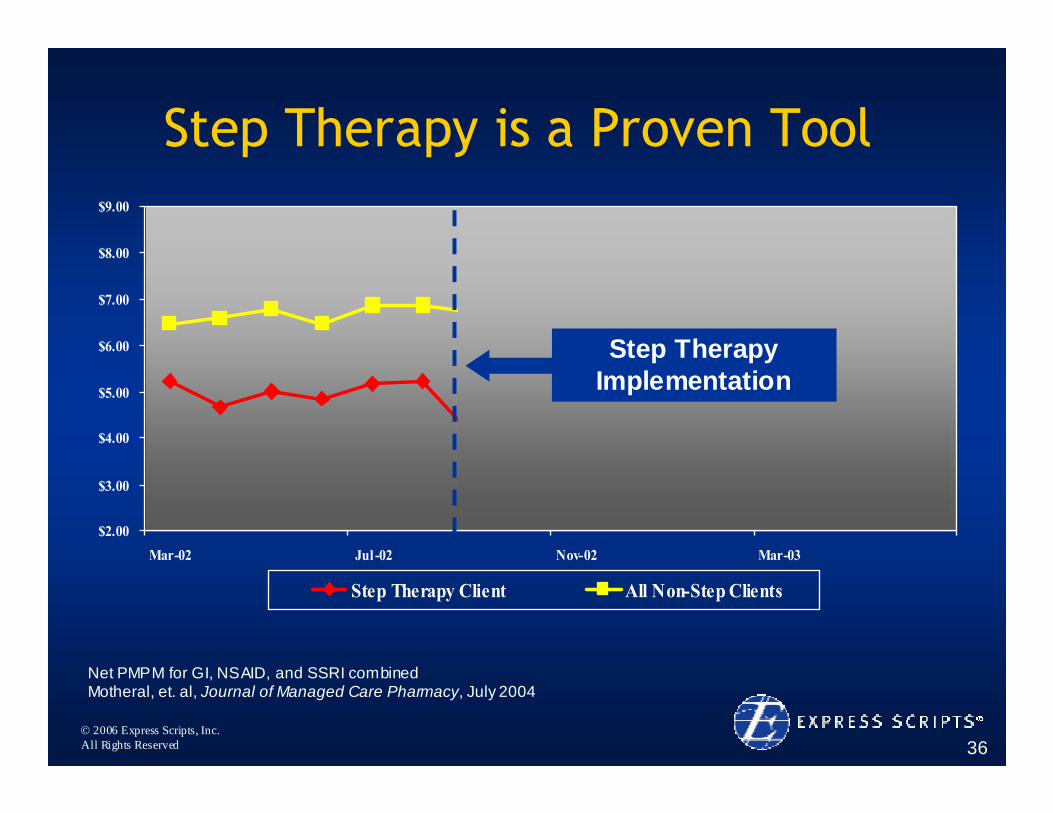
Step Therapy is a Proven Tool
Net PMPM for GI, NSAID, and SSRI combinedMotheral, et. al, Journal of Managed Care Pharmacy, July 2004
Step Therapy Implementation
© 2006 Express Scripts, Inc.All Rights Reserved 37
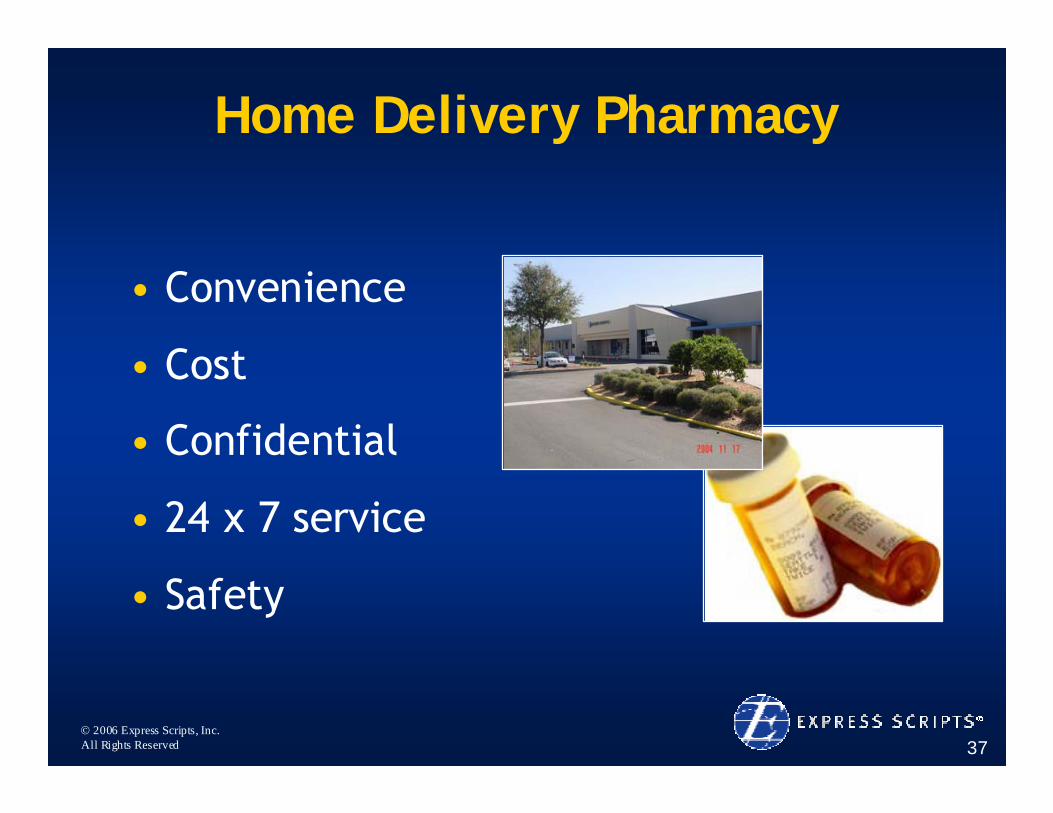
Home Delivery Pharmacy
• Convenience
• Cost
• Confidential
• 24 x 7 service
• Safety
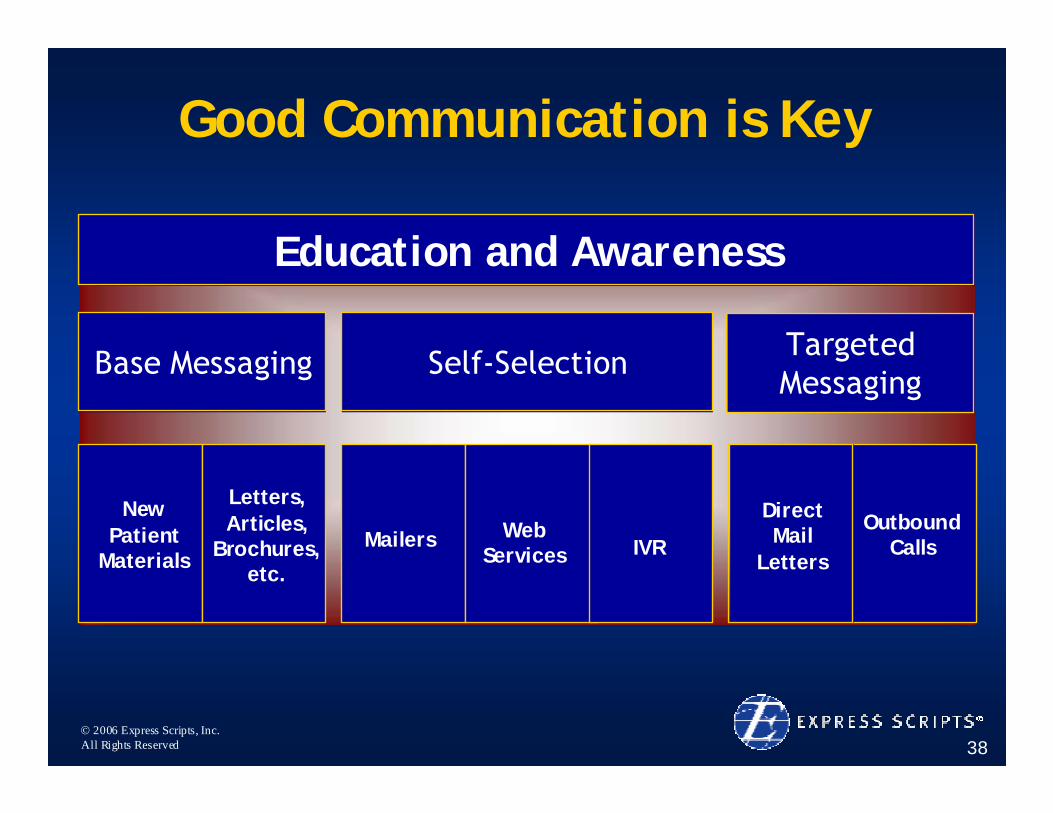
© 2006 Express Scripts, Inc.All Rights Reserved 38
New Patient
Materials
Letters, Articles,
Brochures, etc.
Mailers Web Services IVR
Direct Mail
Letters
Outbound Calls
Base Messaging Self-Selection TargetedMessaging
Education and Awareness
Good Communication is Key
© 2006 Express Scripts, Inc.All Rights Reserved 39
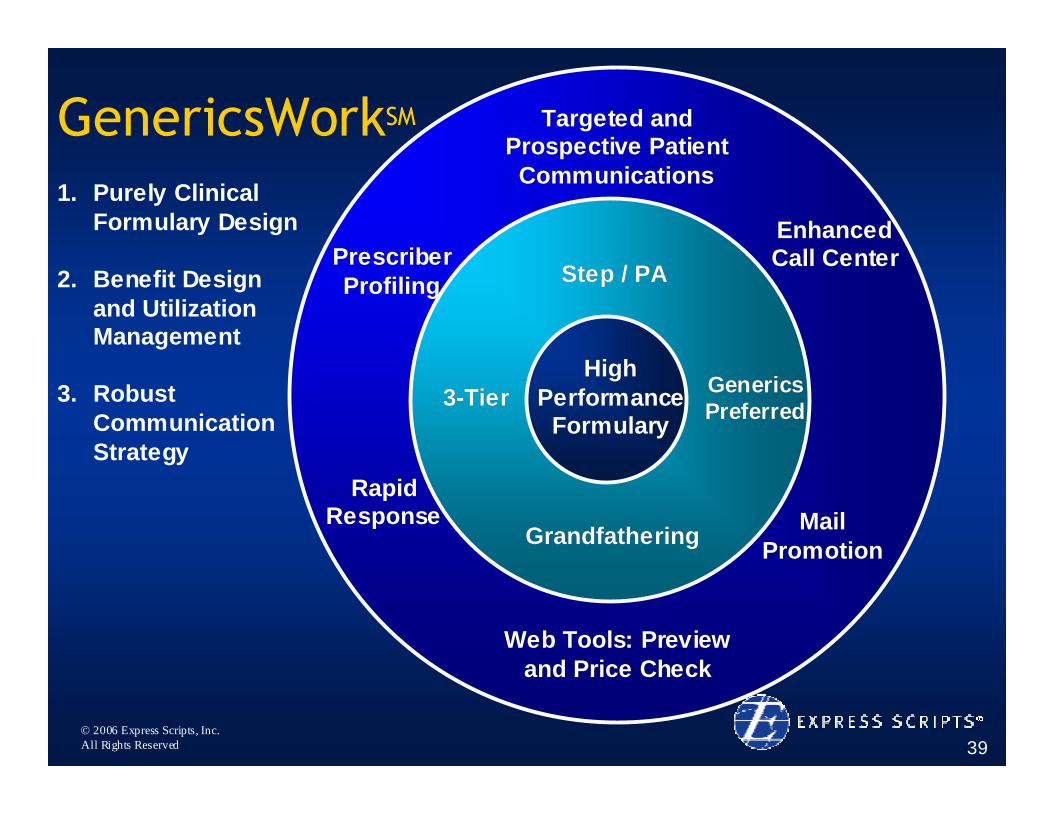
GenericsWorkSM Targeted and Targeted and Prospective Patient Prospective Patient CommunicationsCommunications
Web Tools: Preview Web Tools: Preview and Price Checkand Price Check
Prescriber Prescriber ProfilingProfiling
Enhanced Enhanced Call CenterCall Center
Mail Mail PromotionPromotion
Rapid Rapid ResponseResponse
GrandfatheringGrandfathering
Step / PAStep / PA
33--TierTier Generics Generics PreferredPreferred
High High Performance Performance
FormularyFormulary
1. Purely Clinical Formulary Design
2. Benefit Design and Utilization Management
3. Robust Communication Strategy
© 2006 Express Scripts, Inc.All Rights Reserved 40
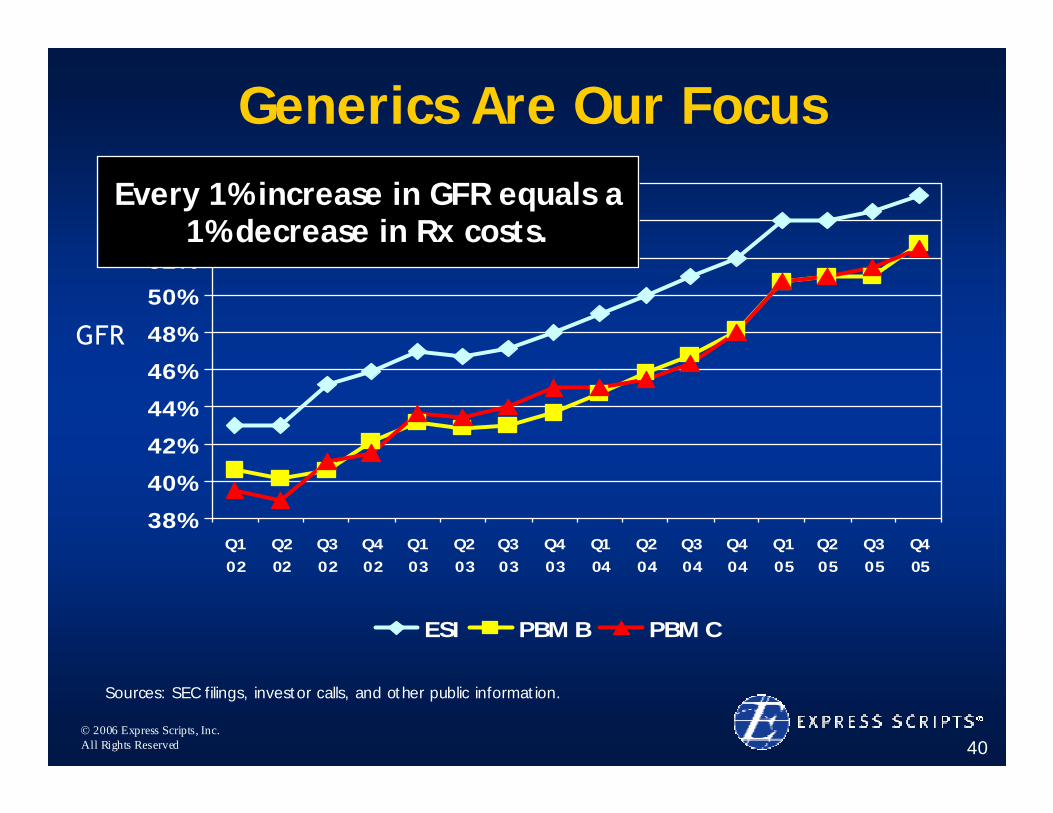
Generics Are Our Focus
Sources: SEC filings, investor calls, and other public information.
38%
40%
42%
44%
46%
48%
50%
52%
54%
56%
Q102
Q202
Q302
Q402
Q103
Q203
Q303
Q403
Q104
Q204
Q304
Q404
Q105
Q205
Q305
Q405
ESI PBM B PBM C
GFR
Every 1% increase in GFR equals a 1% decrease in Rx costs.
© 2006 Express Scripts, Inc.All Rights Reserved 41
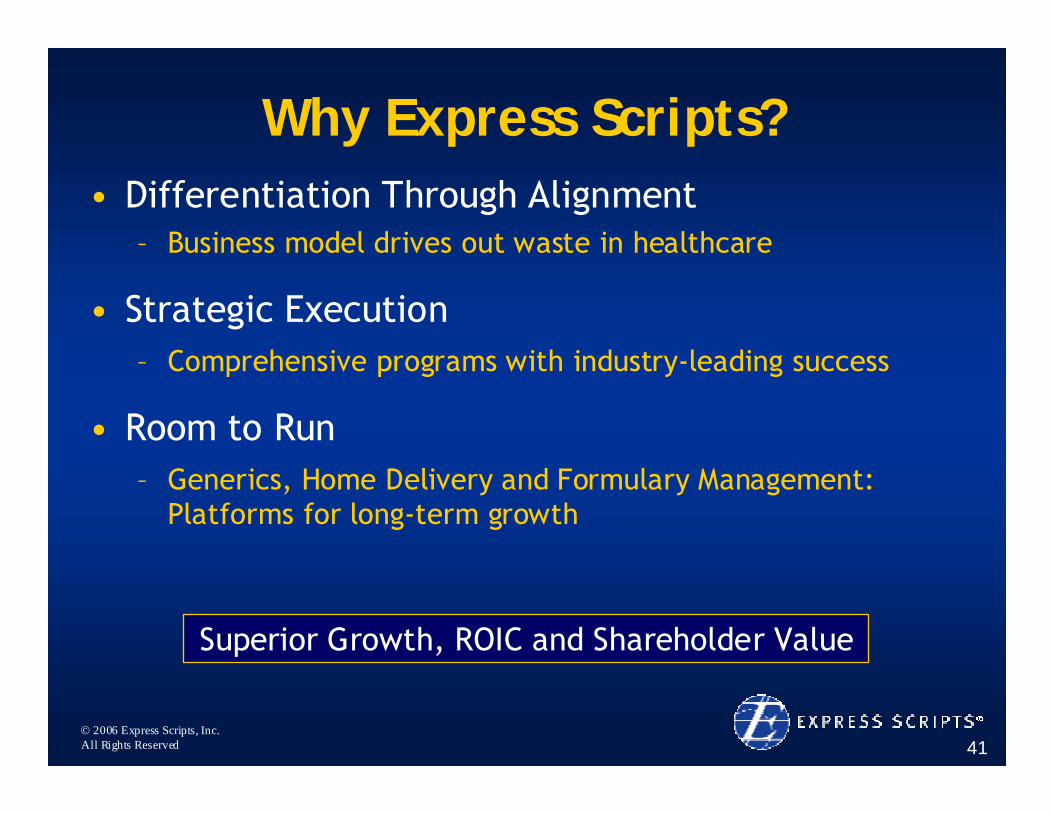
Why Express Scripts?• Differentiation Through Alignment
– Business model drives out waste in healthcare
• Strategic Execution– Comprehensive programs with industry-leading success
• Room to Run– Generics, Home Delivery and Formulary Management:
Platforms for long-term growth
Superior Growth, ROIC and Shareholder Value
© 2006 Express Scripts, Inc.All Rights Reserved
Adding Value Through Service Performance
Doug PorterSenior Vice President
Client and Patient Services
© 2006 Express Scripts, Inc.All Rights Reserved 43
The Heart of Service Means…
Service & Savings… Safety… Satisfaction
© 2006 Express Scripts, Inc.All Rights Reserved 44
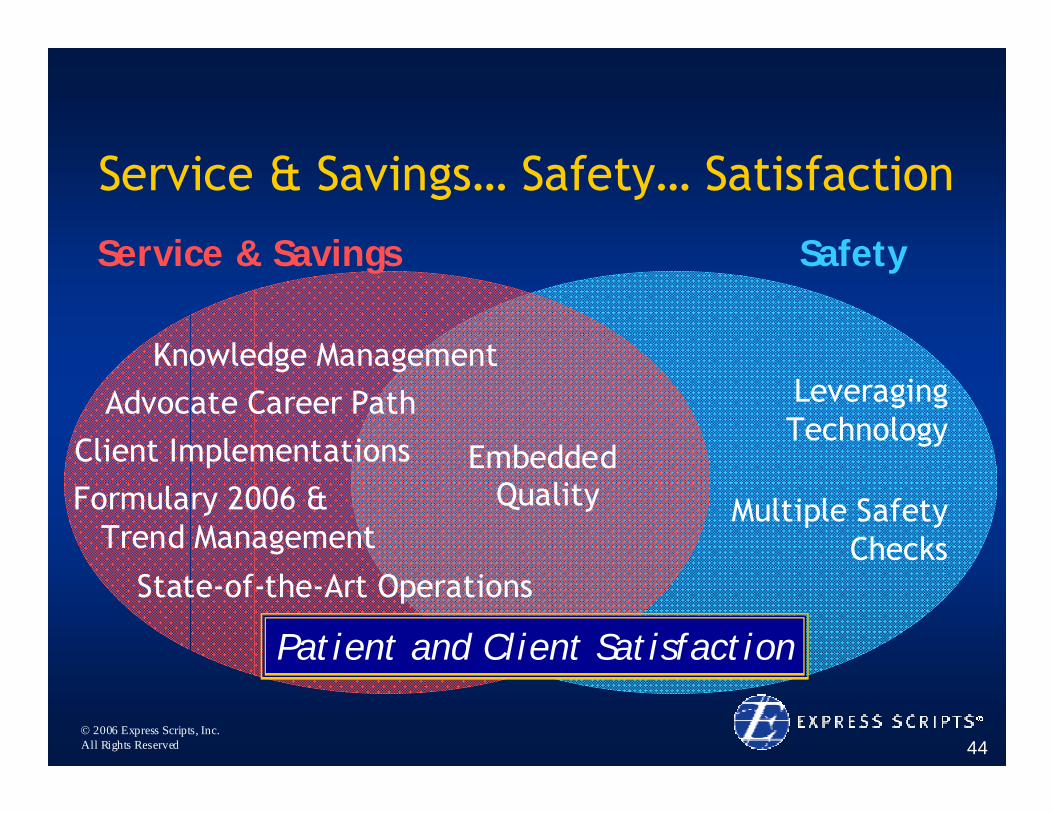
Service & Savings… Safety… Satisfaction
Service & Savings Safety
Knowledge ManagementAdvocate Career Path
Client ImplementationsFormulary 2006 &
Trend Management
State-of-the-Art Operations
Leveraging Technology
Multiple Safety Checks
Embedded Quality
Patient and Client Satisfaction
© 2006 Express Scripts, Inc.All Rights Reserved 45
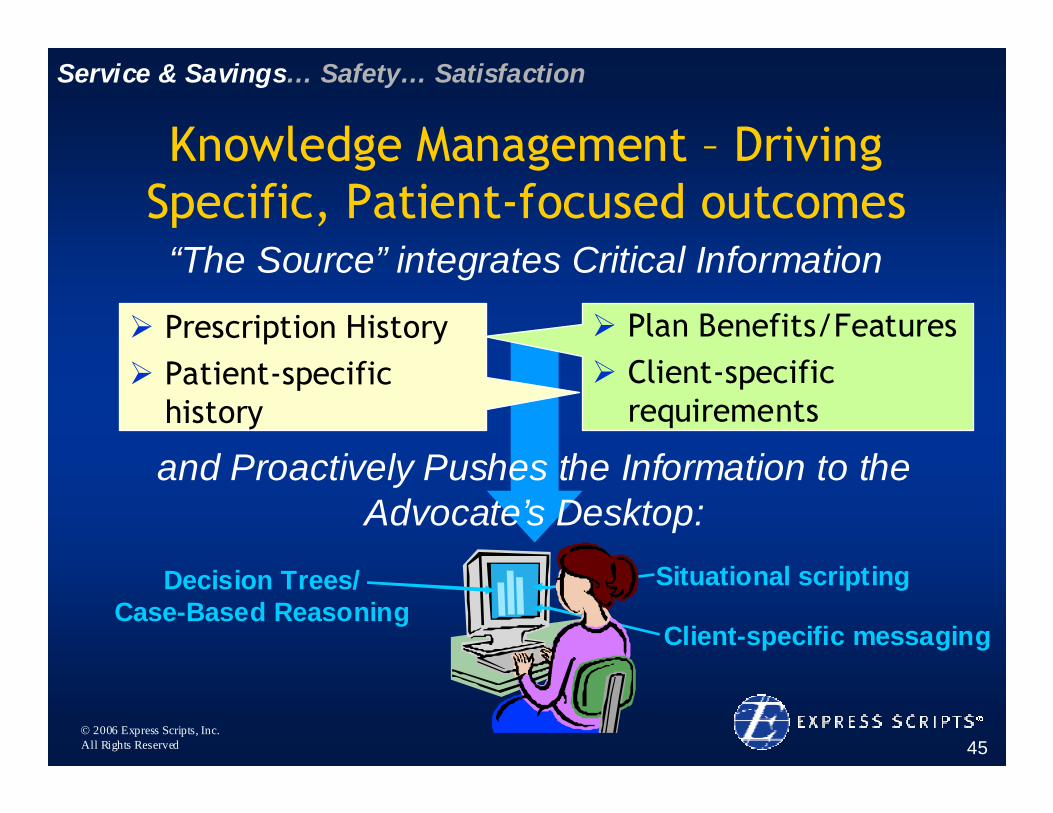
and Proactively Pushes the Information to the Advocate’s Desktop:
Situational scriptingDecision Trees/Case-Based Reasoning
Client-specific messaging
Knowledge Management – Driving Specific, Patient-focused outcomes
“The Source” integrates Critical Information
Prescription HistoryPatient-specific history
Plan Benefits/FeaturesClient-specific requirements
Service & Savings… Safety… Satisfaction
© 2006 Express Scripts, Inc.All Rights Reserved 46
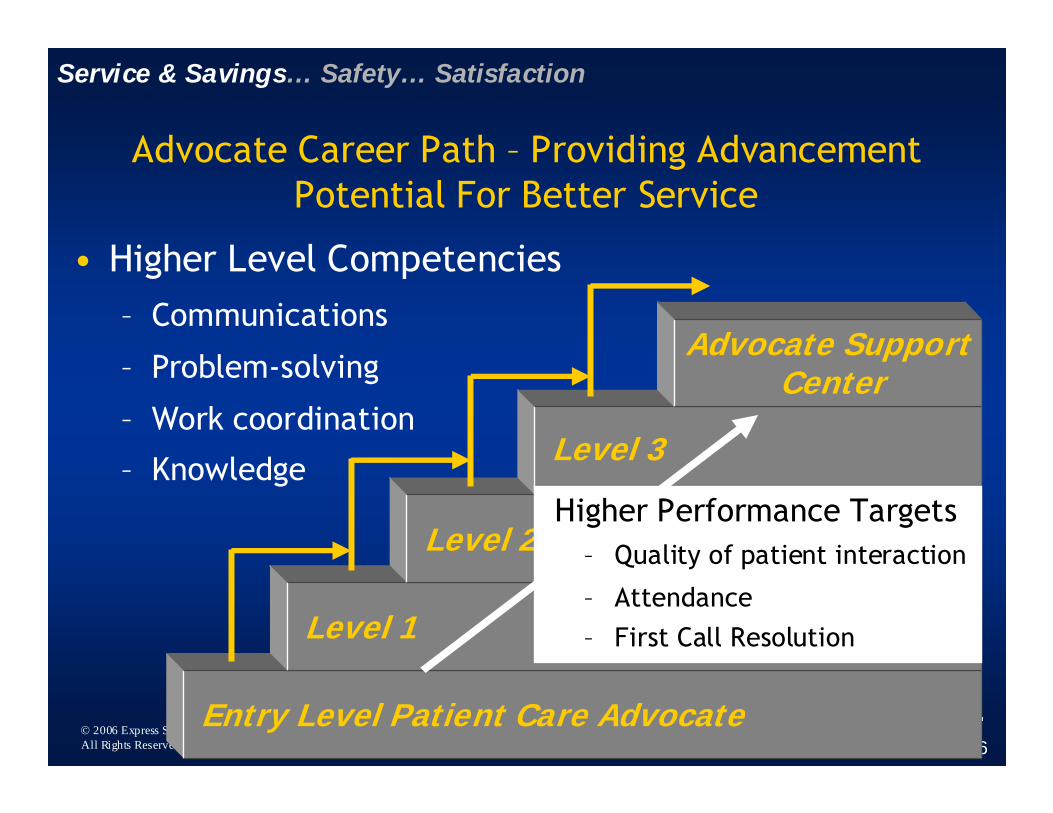
Advocate Career Path – Providing Advancement Potential For Better Service
Entry Level Patient Care Advocate
Level 1
Level 2
Level 3
Advocate Support Center
• Higher Level Competencies– Communications
– Problem-solving
– Work coordination
– KnowledgeHigher Performance Targets
– Quality of patient interaction
– Attendance– First Call Resolution
Service & Savings… Safety… Satisfaction

© 2006 Express Scripts, Inc.All Rights Reserved 47
The Next Level: “Embedded Quality”
• Approach: Lean + Six Sigma
LEAN• Reduce Waste• Increase Speed• Bias for Action
SIX SIGMA• Voice of the Customer• Eliminate Variation• Rigorous Approach
LEAN SIX SIGMA
Service & Savings… Safety… Satisfaction
© 2006 Express Scripts, Inc.All Rights Reserved 48
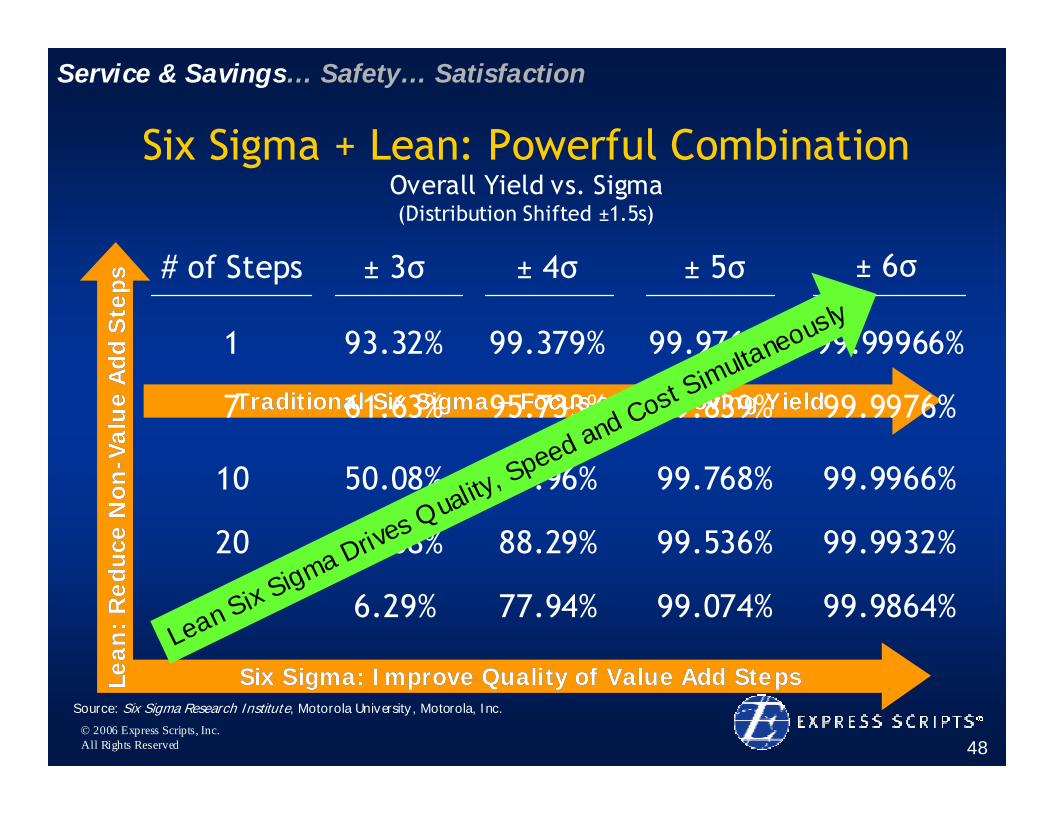
Six Sigma + Lean: Powerful CombinationOverall Yield vs. Sigma(Distribution Shifted ±1.5s)
Service & Savings… Safety… Satisfaction
Six Sigma: Improve Quality of Value Add StepsSix Sigma: Improve Quality of Value Add StepsSource: Six Sigma Research Institute, Motorola University, Motorola, Inc.
Lean
: R
educ
e N
onLe
an:
Red
uce
Non
--Val
ue
Add
Ste
psVa
lue
Add
Ste
ps
# of Steps ± 3σ ± 4σ ± 5σ ± 6σ
1 93.32% 99.379% 99.9767% 99.99966%
Traditional Six Sigma Traditional Six Sigma –– Focus on Improving YieldFocus on Improving Yield7 61.63%
10 50.08%
20 25.08%
40 6.29%
95.733% 99.839% 99.9976%
93.96% 99.768% 99.9966%
88.29% 99.536% 99.9932%
77.94% 99.074% 99.9864%Lean Six S
igma Drives Quality, Speed and Cost Simultaneously
© 2006 Express Scripts, Inc.All Rights Reserved 49
56%
83%
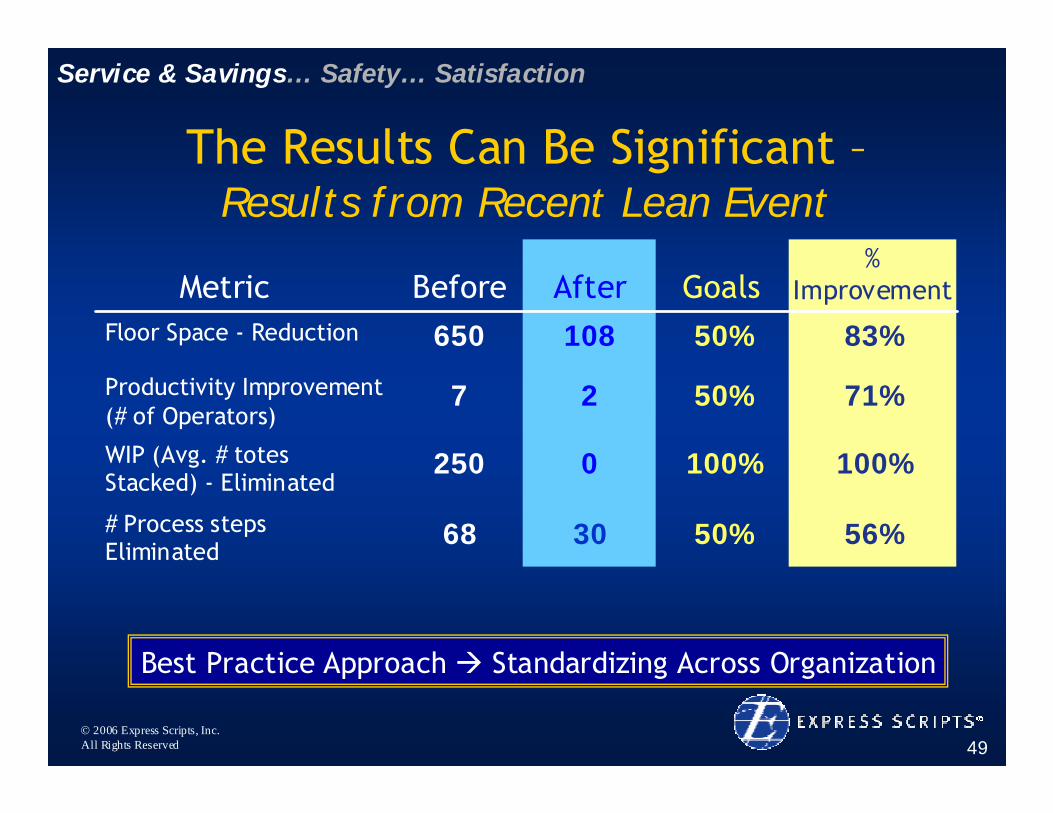
The Results Can Be Significant –Results from Recent Lean Event
50%3068# Process steps Eliminated
100%0250WIP (Avg. # totes Stacked) - Eliminated
50%27Productivity Improvement(# of Operators)
50%108650Floor Space - Reduction
GoalsAfter BeforeMetric
100%
71%
% Improvement
Service & Savings… Safety… Satisfaction
Best Practice Approach Standardizing Across Organization
© 2006 Express Scripts, Inc.All Rights Reserved 50
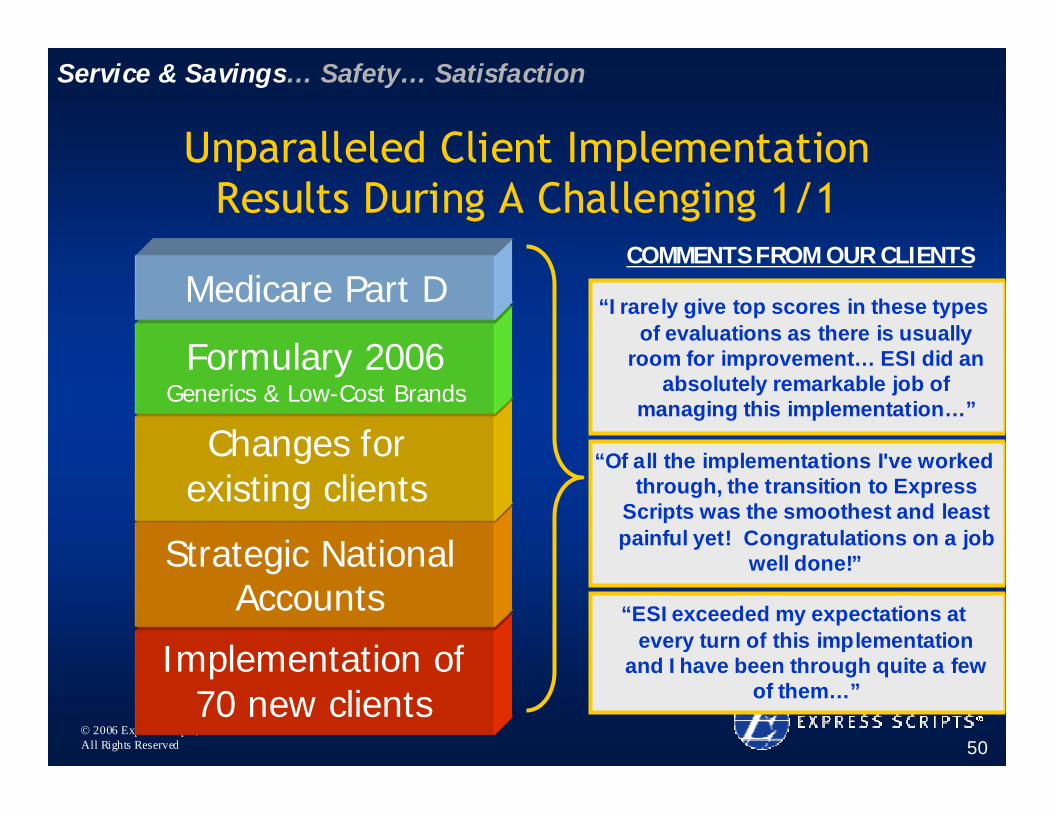
Unparalleled Client Implementation Results During A Challenging 1/1
“I rarely give top scores in these types of evaluations as there is usually
room for improvement… ESI did an absolutely remarkable job of
managing this implementation…”
“Of all the implementations I've worked through, the transition to Express
Scripts was the smoothest and least painful yet! Congratulations on a job
well done!”
“ESI exceeded my expectations at every turn of this implementation
and I have been through quite a few of them…”
COMMENTS FROM OUR CLIENTS
Implementation of 70 new clients
Strategic National Accounts
Changes for existing clients
Formulary 2006Generics & Low-Cost Brands
Medicare Part D
Service & Savings… Safety… Satisfaction
© 2006 Express Scripts, Inc.All Rights Reserved 51
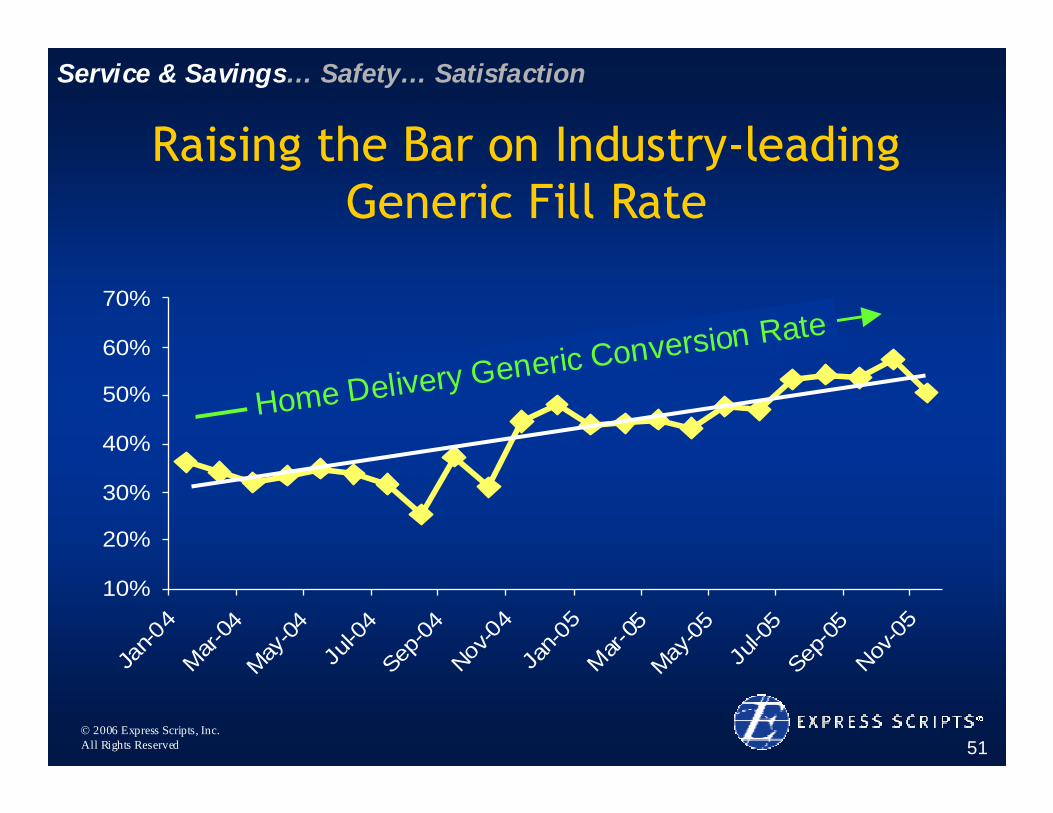
Raising the Bar on Industry-leading Generic Fill Rate
Service & Savings… Safety… Satisfaction
10%
20%
30%
40%
50%
60%
70%
Jan-0
4M
ar-04
May-0
4Ju
l-04
Sep-0
4Nov-0
4Ja
n-05
Mar-
05May
-05
Jul-0
5Sep
-05
Nov-0
5
Home Delivery Generic Conversion Rate
© 2006 Express Scripts, Inc.All Rights Reserved 52
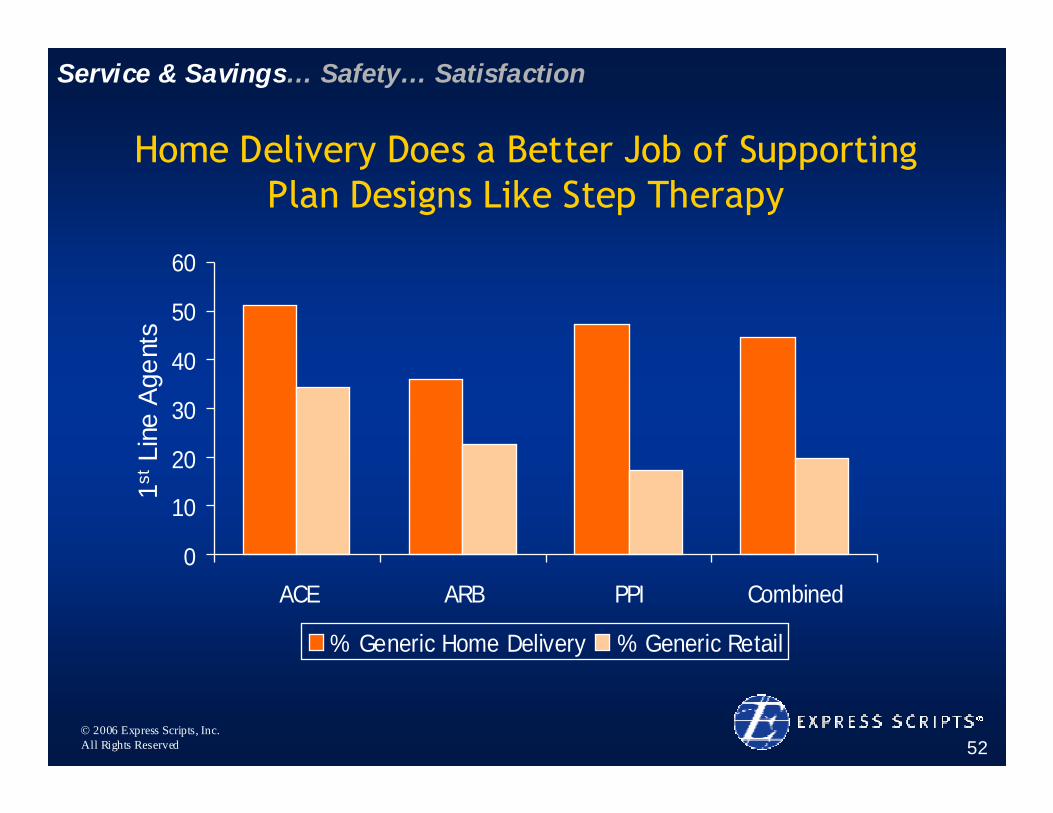
Home Delivery Does a Better Job of Supporting Plan Designs Like Step Therapy
0
10
20
30
40
50
60
ACE ARB PPI Combined
% Generic Home Delivery % Generic Retail
1stLi
ne A
gent
s
Service & Savings… Safety… Satisfaction
© 2006 Express Scripts, Inc.All Rights Reserved 53
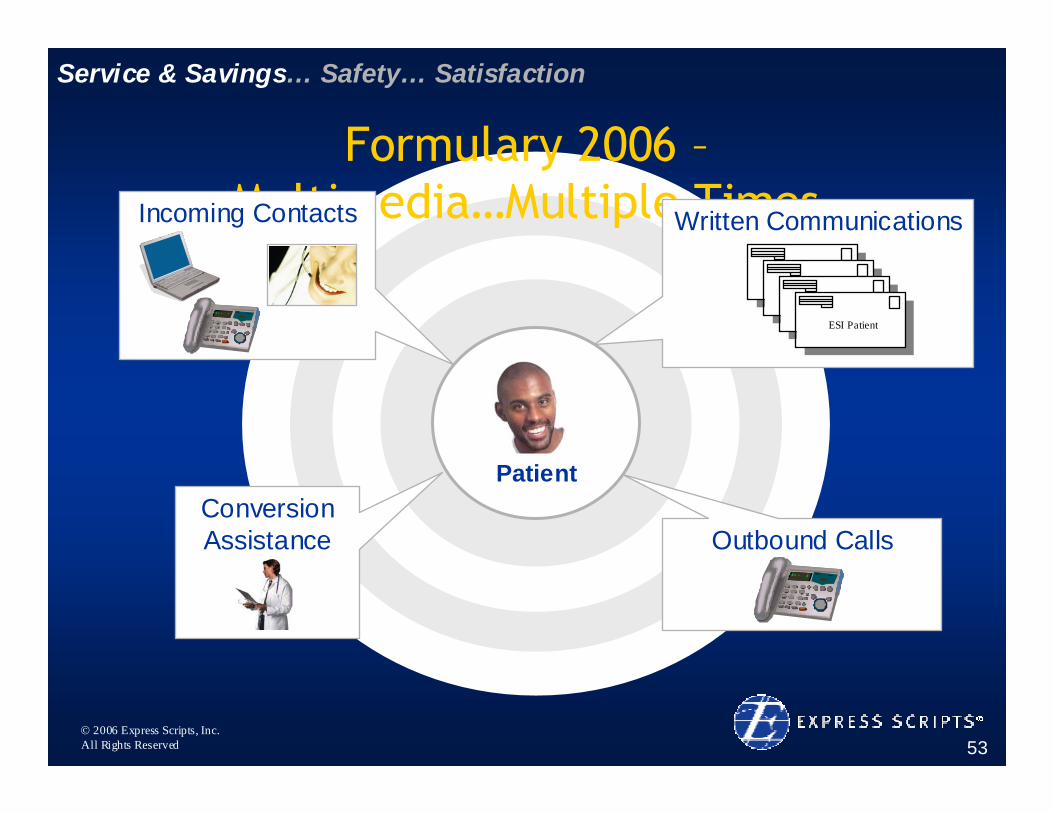
Service & Savings… Safety… Satisfaction
Patient
Formulary 2006 –Multimedia…Multiple TimesWritten CommunicationsIncoming Contacts
Conversion Assistance Outbound Calls
ESI Patient
© 2006 Express Scripts, Inc.All Rights Reserved 54
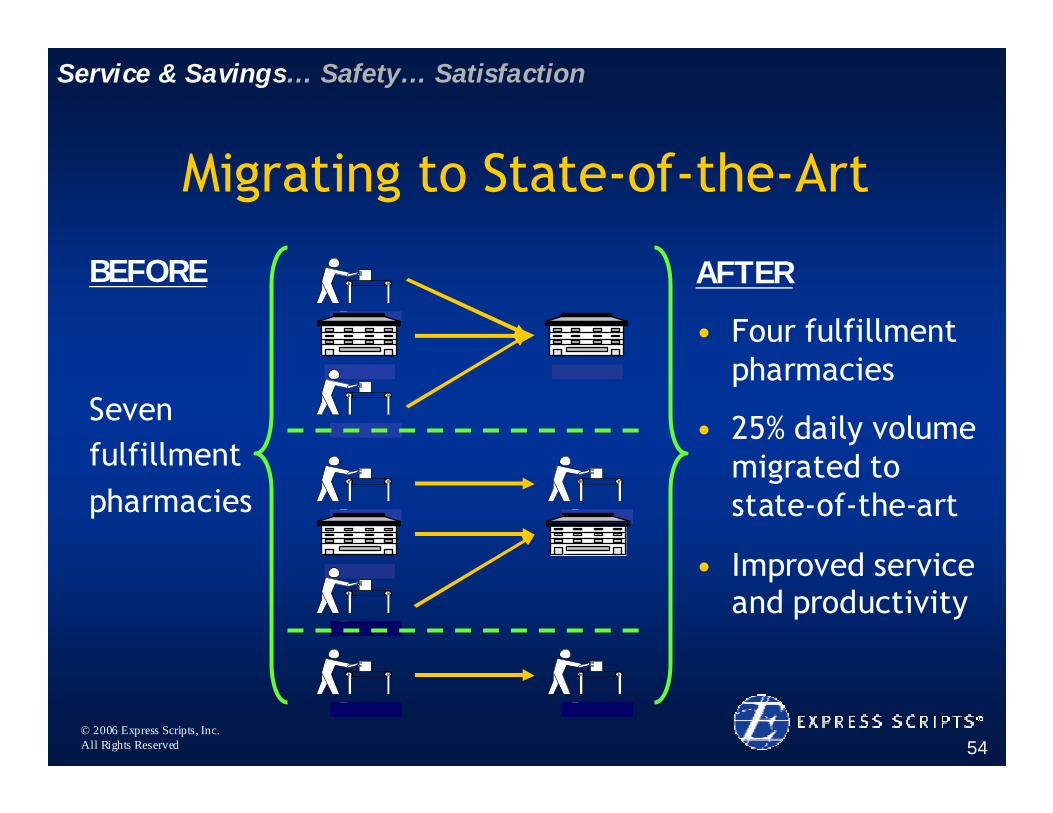
Migrating to State-of-the-Art
Service & Savings… Safety… Satisfaction
BEFORE
Seven fulfillment pharmacies
AFTER
• Four fulfillment pharmacies
• 25% daily volume migrated to state-of-the-art
• Improved service and productivity
© 2006 Express Scripts, Inc.All Rights Reserved 55
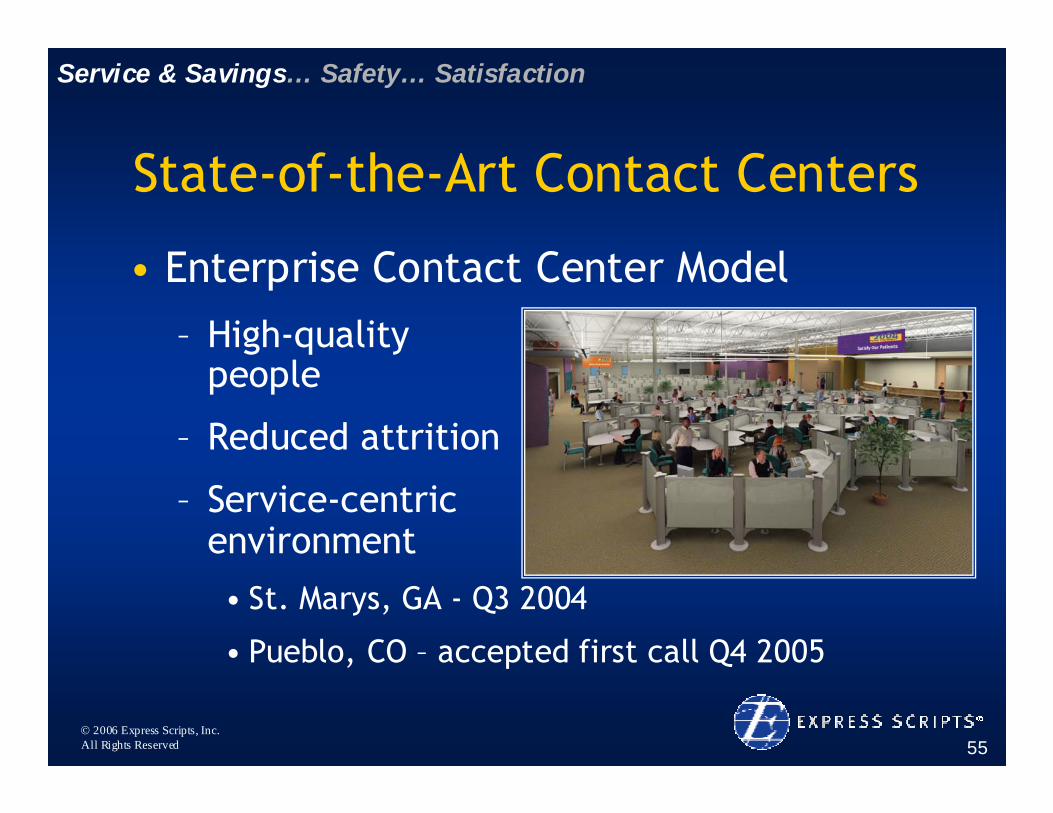
State-of-the-Art Contact Centers
• Enterprise Contact Center Model
– High-quality people
– Reduced attrition
– Service-centric environment • St. Marys, GA - Q3 2004
• Pueblo, CO – accepted first call Q4 2005
Service & Savings… Safety… Satisfaction
© 2006 Express Scripts, Inc.All Rights Reserved 56
Safety: Value Proposition Exceeds Retail
• Leveraging technology– Home Delivery quality 60 times better
than retail1
– Auto-Pack Technology
• Multiple safety checks inherent in process– Integrated on-line DUR– Sound-alike drugs
Service & Savings… Safety… Satisfaction
1 Dispensing Error Rate in a Highly Automated Mail-Service Pharmacy Practice, Pharmacotherapy 2005, 25(11): 1629-1635

© 2006 Express Scripts, Inc.All Rights Reserved 57
Satisfaction – Core To Our Mission
Service & Savings… Safety… Satisfaction
Pharmacies & Contact Centers Combined2005 Trends
60.0%
62.0%
64.0%
66.0%
68.0%
70.0%
72.0%
74.0%
Q1 2005 Q2 2005 Q3 2005 Q4 2005
Pat
ient
Sat
isfa
ctio
n
2.450
2.500
2.550
2.600
2.650
2.700
2.750
2.800
Uni
t Cos
t
Patient Satisfaction
Unit Cost
© 2006 Express Scripts, Inc.All Rights Reserved 58
Why Express Scripts?• Differentiation Through Alignment
– Service + Safety + Quality = Satisfaction
• Strategic Execution– Investments in people, infrastructure,
quality
• Room to Run– Generics and home delivery: Platforms for
long-term growth
Superior Growth, ROIC and Shareholder Value
© 2006 Express Scripts, Inc.All Rights Reserved
Medicare: A Continuing Opportunity For Employers
Brenda MotheralSenior Vice President
Research and Product Management
© 2006 Express Scripts, Inc.All Rights Reserved 60
• Grow with our clients by becoming the most trusted Part D advisor for both employers and health plans
― Full suite of services
― Best-in-class modeling and consulting
― Flawless execution
Medicare Part D 2006 Strategy
© 2006 Express Scripts, Inc.All Rights Reserved 61
• Managed care: 32 MA-PDs and 14 PDPs, representing more than 600,000 lives
• Two direct PDPs
• More than 300 subsidy clients, representing more than 1 million lives
• Excellent execution in all operational areas
Our Approach Worked
© 2006 Express Scripts, Inc.All Rights Reserved 62
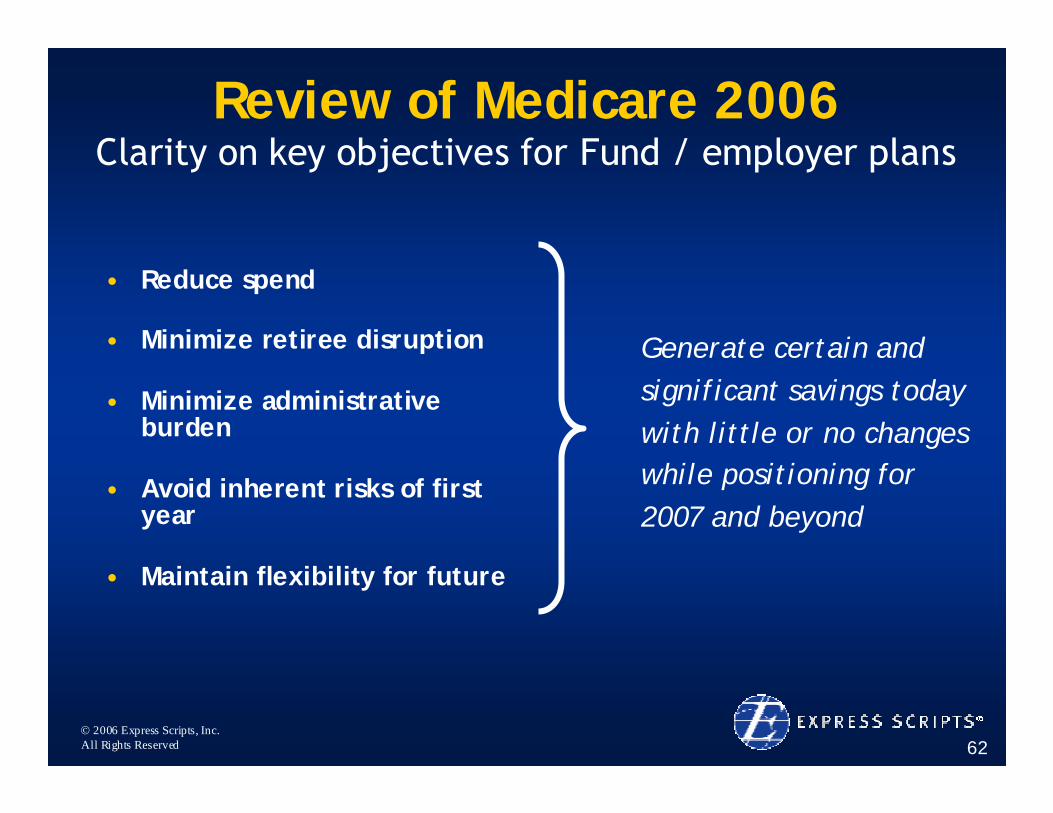
Generate certain and significant savings today with little or no changes while positioning for 2007 and beyond
Review of Medicare 2006Clarity on key objectives for Fund / employer plans
• Reduce spend
• Minimize retiree disruption
• Minimize administrative burden
• Avoid inherent risks of first year
• Maintain flexibility for future

© 2006 Express Scripts, Inc.All Rights Reserved 63
Select option that balances savings and retiree impact subject to administrative resources
Looking to Medicare 2007Clarity on key objectives for Fund / employer plans
• Reduce spend
• Minimize retiree disruption
• Minimize administrative burden
© 2006 Express Scripts, Inc.All Rights Reserved 64
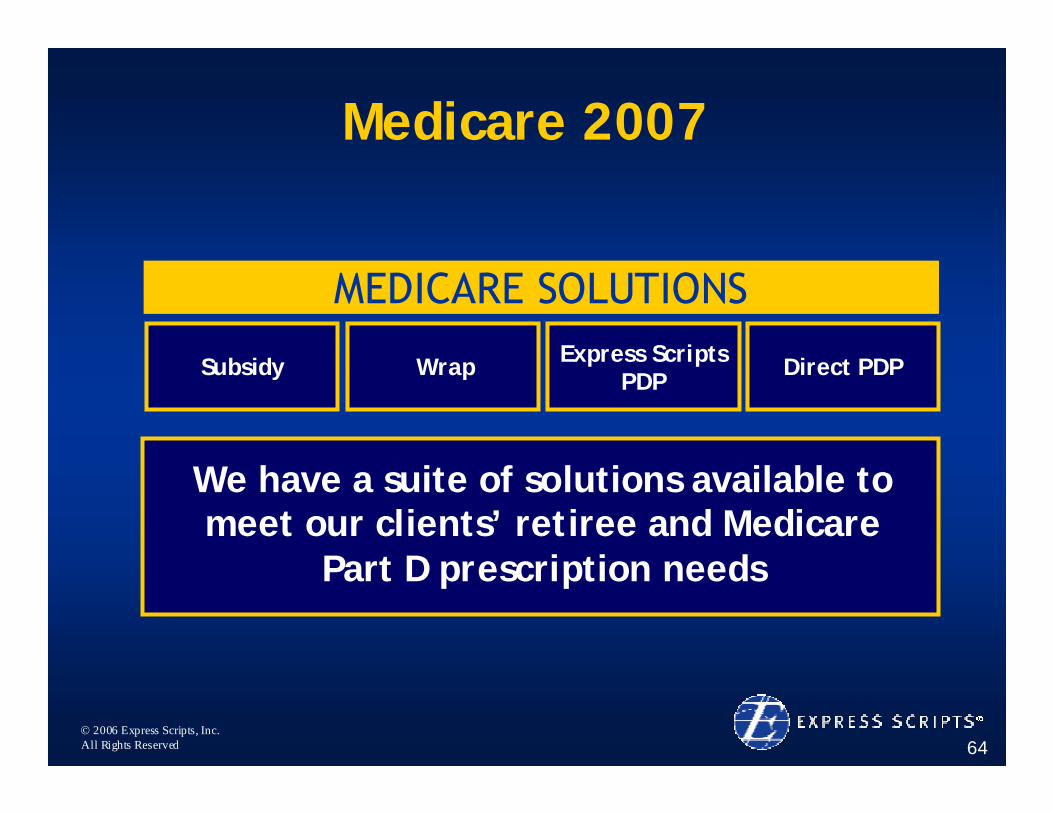
Medicare 2007
MEDICARE SOLUTIONS
WrapSubsidy Express Scripts PDP Direct PDP
We have a suite of solutions available to meet our clients’ retiree and Medicare
Part D prescription needs

© 2006 Express Scripts, Inc.All Rights Reserved 65
Medicare 2007
Express Scripts PDP
MEDICARE SOLUTIONS
Wrap Direct PDPSubsidy
• Designed to support employers will not market to consumers• Plan sponsor contracts with Express Scripts to provide a Part D
benefit unique to their own retirees• Provides the sponsor an opportunity for additional savings• Waives the sponsor from some Part D requirements• Will support existing benefit design• Will have Medicare compliant formularies that mimic Commercial
© 2006 Express Scripts, Inc.All Rights Reserved 66
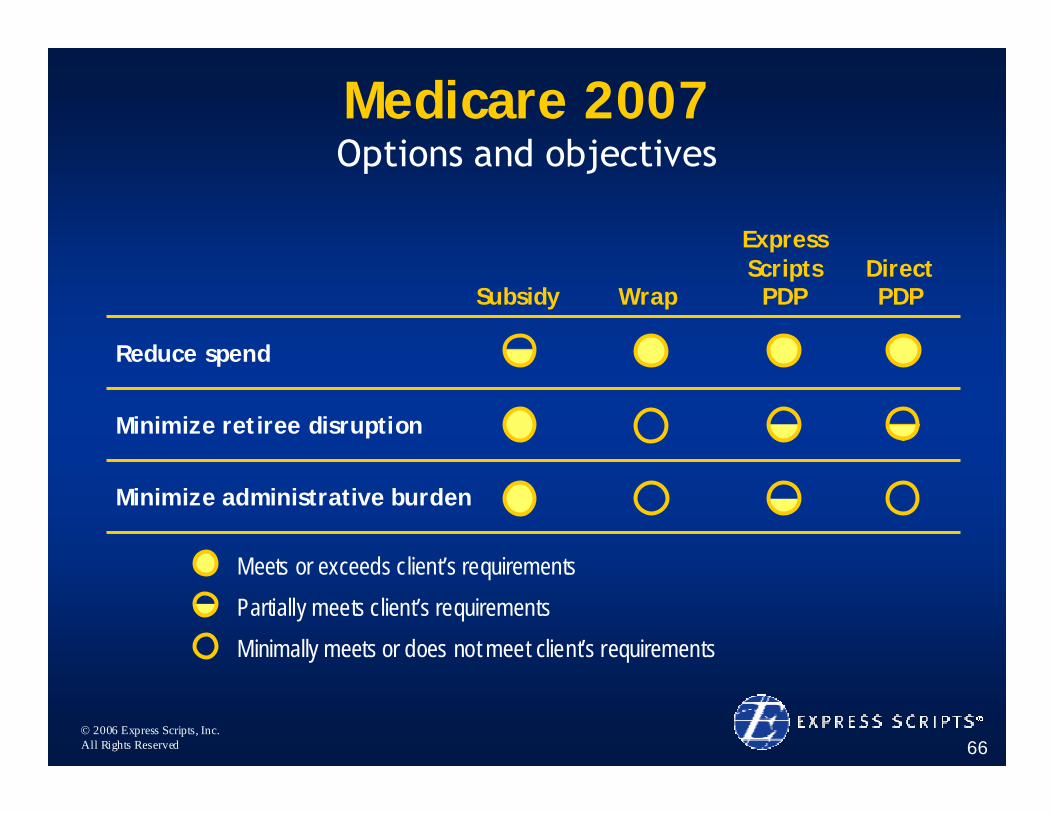
Medicare 2007Options and objectives
Minimize administrative burden
Minimize retiree disruption
Reduce spend
WrapSubsidy
Express Scripts
PDPDirect PDP
Meets or exceeds client’s requirementsPartially meets client’s requirementsMinimally meets or does not meet client’s requirements
© 2006 Express Scripts, Inc.All Rights Reserved 67
• Ongoing changes to meet new CMS requirements for our Part D and subsidy clients
• PDP application and bid
• New capabilities for enrollment and premium collection for the PDP
Preparing For 2007
© 2006 Express Scripts, Inc.All Rights Reserved 68
Why Express Scripts?
• Differentiation Through Alignment– Will not compete with our health plan clients for Medicare
Part D
• Strategic Execution– Best-in-class Medicare operational delivery on 1/1/06
• Room to Run– Offering a PDP to support our employer and labor clients in
2007
Superior Growth, ROIC and Shareholder Value
© 2006 Express Scripts, Inc.All Rights Reserved
BREAK
© 2006 Express Scripts, Inc.All Rights Reserved
Building thePathway to the Patientfor Biopharmaceuticals
Dom MeffeSenior Vice President, Specialty Pharmacy
© 2006 Express Scripts, Inc.All Rights Reserved 71
Strategic Drivers
• We’re playing in a high growth market• ESI is aggressively investing in this segment• We bought Priority Healthcare to
– achieve scale and realize synergies– broaden our delivery platform– leverage our upselling success
• All built on a foundation of extraordinary patient care, which no one does better
© 2006 Express Scripts, Inc.All Rights Reserved 72
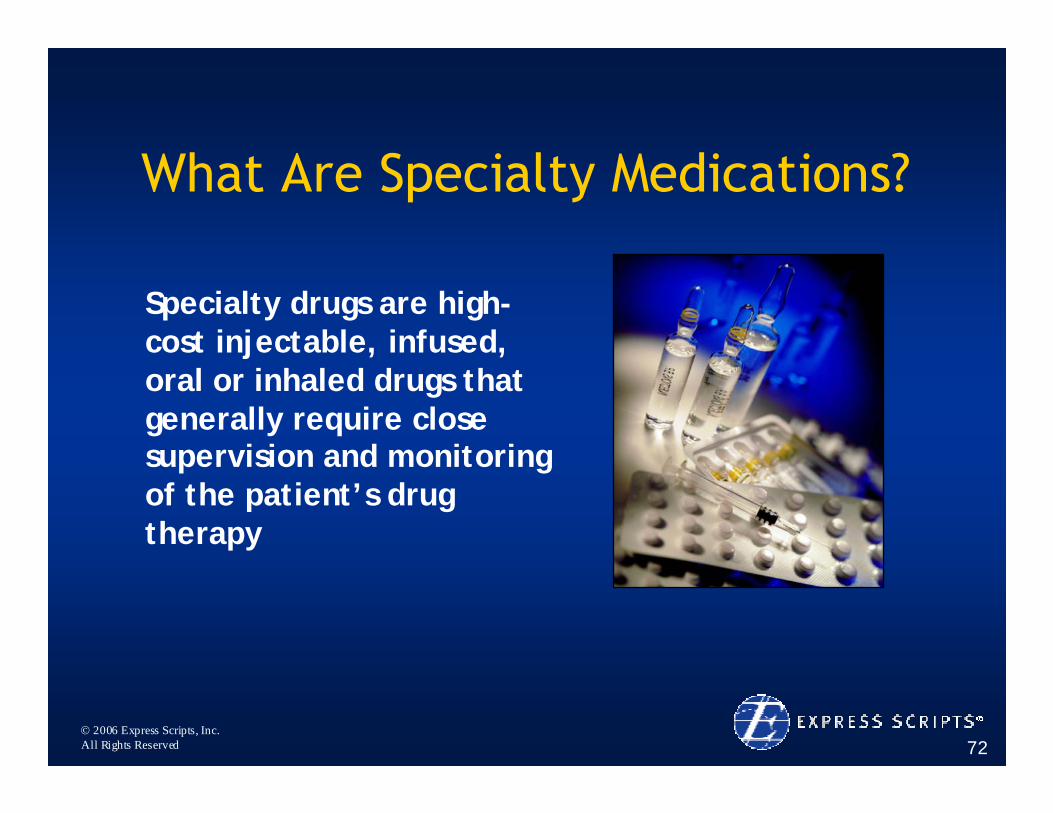
What Are Specialty Medications?
Specialty drugs are high-cost injectable, infused, oral or inhaled drugs that generally require close supervision and monitoring of the patient’s drug therapy
© 2006 Express Scripts, Inc.All Rights Reserved 73
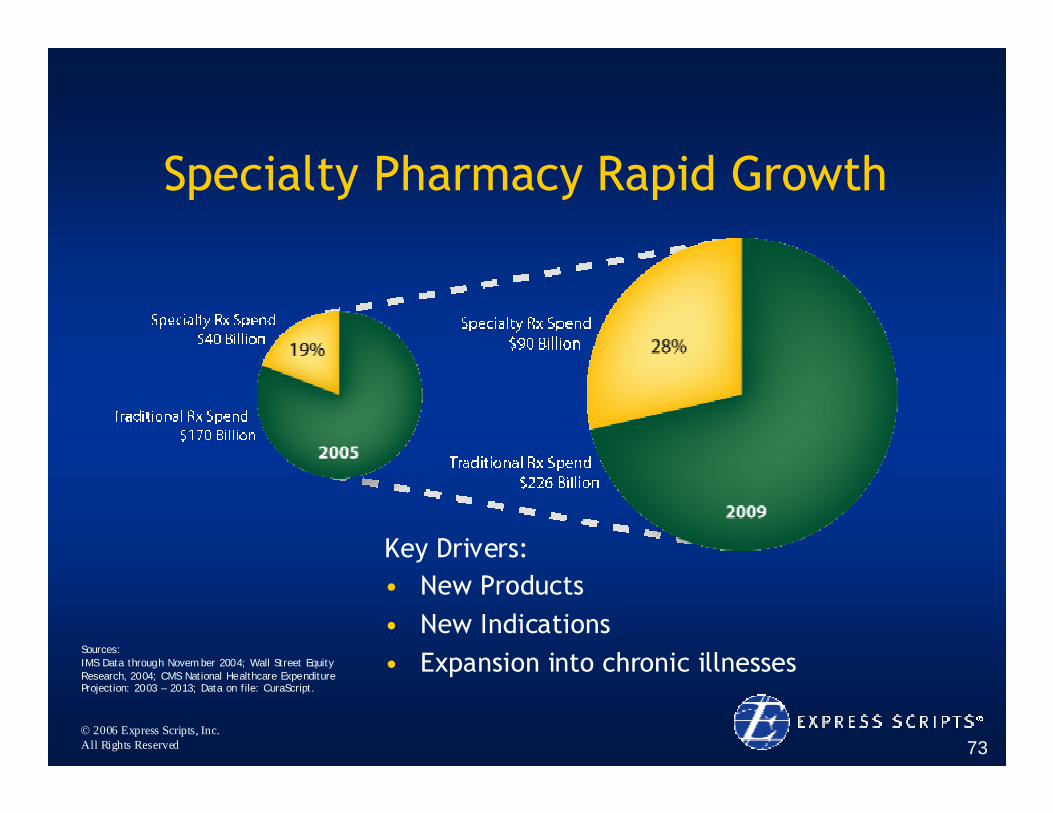
Specialty Pharmacy Rapid Growth
Key Drivers:• New Products• New Indications• Expansion into chronic illnesses
Sources:IMS Data through Novem ber 2004; Wall Street Equity Research, 2004; CMS National Healthcare Expenditure Projection: 2003 – 2013; Data on file: CuraScript.
© 2006 Express Scripts, Inc.All Rights Reserved 74
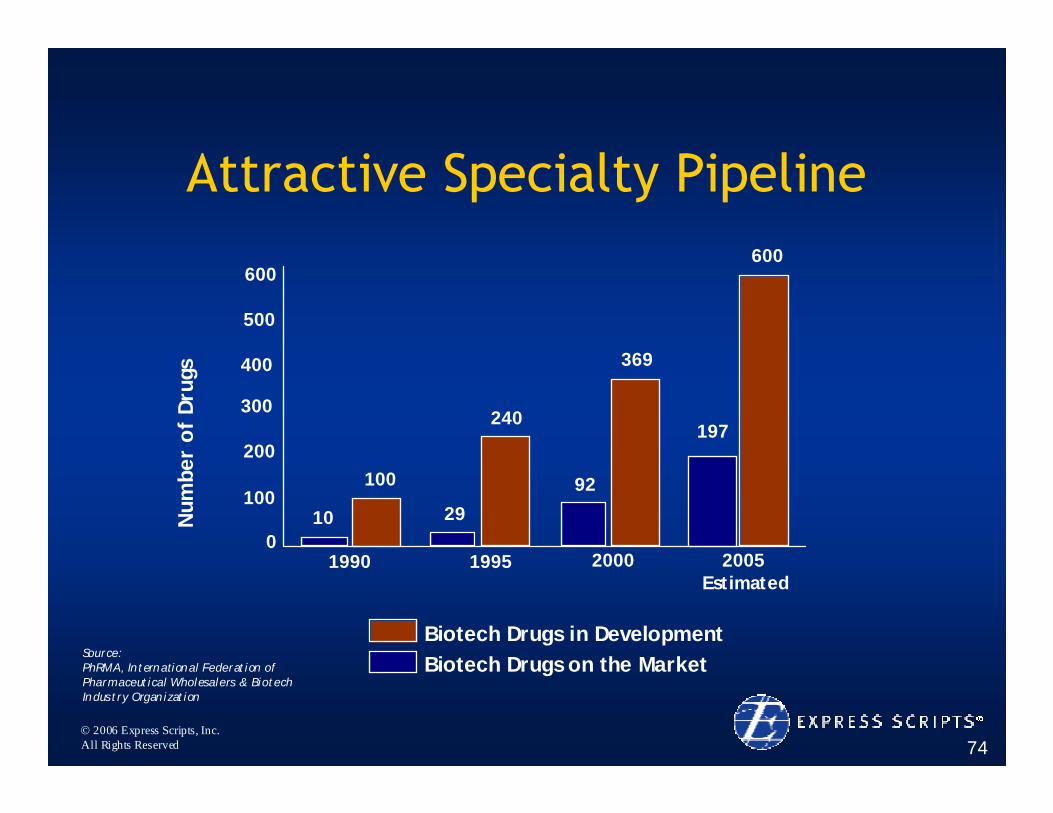
Attractive Specialty Pipeline
Source:PhRMA, International Federation of Pharmaceutical Wholesalers & Biotech Indus try Organization
Biotech Drugs in DevelopmentBiotech Drugs on the Market
2005Estimated
200019951990
600
500
400
300
200
100
0
600
197
369
92
240
29
100
10Num
ber
of
Dru
gs
© 2006 Express Scripts, Inc.All Rights Reserved 75
Why Acquire Priority Healthcare?
• Scale and Synergies
• Breadth of Distribution Platform
• Leverage Proven Upsell Capabilities

© 2006 Express Scripts, Inc.All Rights Reserved 76
Scale and Synergies
© 2006 Express Scripts, Inc.All Rights Reserved 77
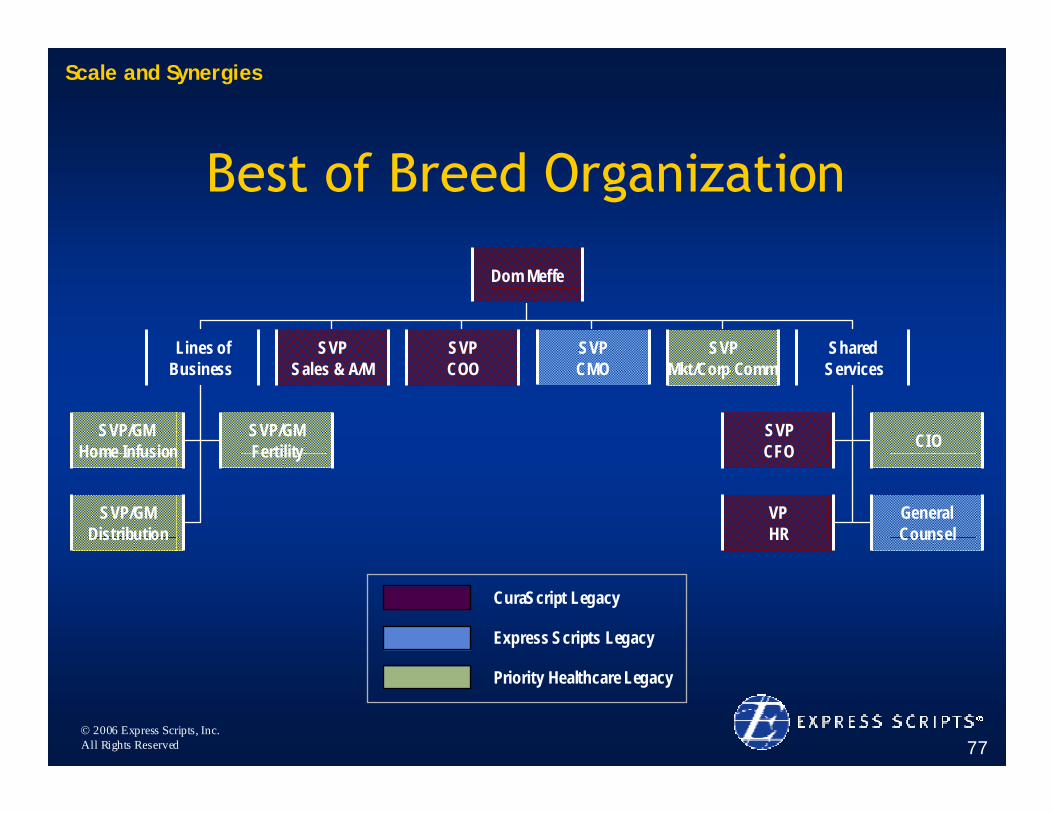
Best of Breed Organization
Dom Meffe
Lines ofBusiness
GeneralCounsel
SVPSales & A/M
SVPCOO
SVPCMO
SVPMkt/Corp Comm
SVPCFO CIO
VPHR
SharedServices
SVP/GM Home Infusion
SVP/GMFertility
SVP/GMDistribution
CuraScript Legacy
Express Scripts Legacy
Priority Healthcare Legacy
Scale and Synergies
© 2006 Express Scripts, Inc.All Rights Reserved 78
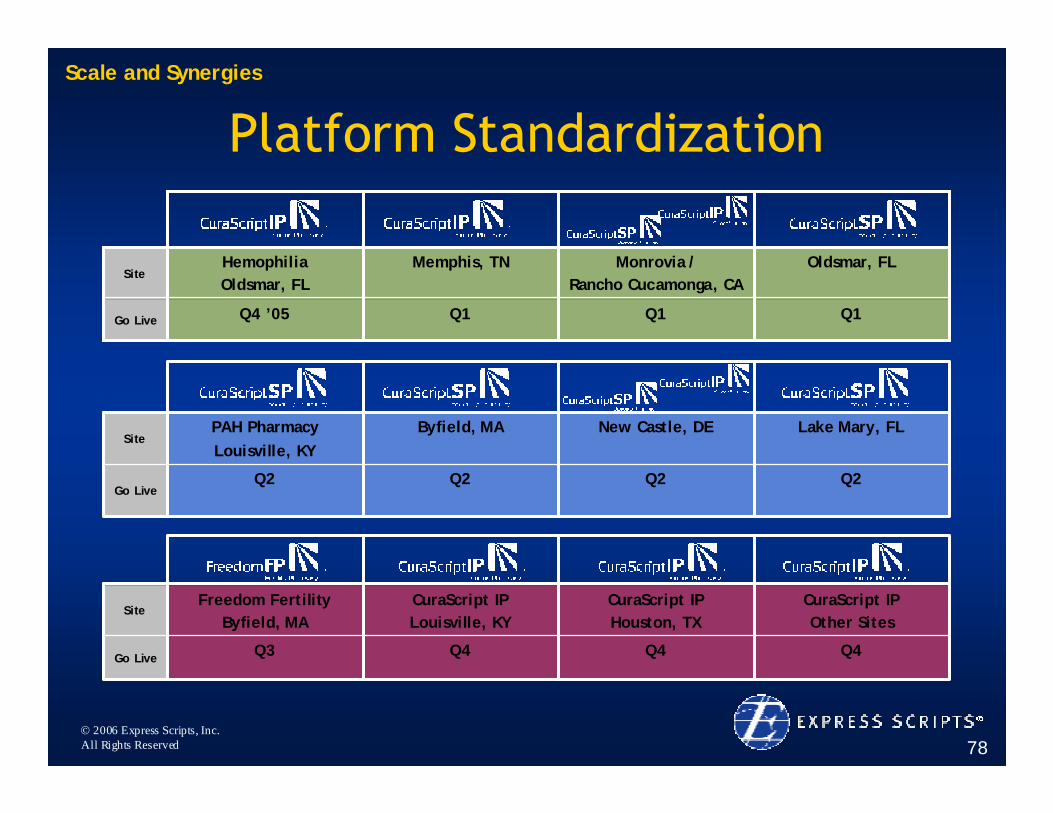
Platform Standardization
Q1
Monrovia / Rancho Cucamonga, CA
Q1
Memphis, TN
Q4 ’05
HemophiliaOldsmar, FL
Q1
Oldsmar, FL
Go Live
Site
Q2Q2Q2Q2Go Live
Lake Mary, FLNew Castle, DEByfield, MAPAH PharmacyLouisville, KY
Site
Q4Q4Q4Q3Go Live
CuraScript IPOther Sites
CuraScript IPHouston, TX
CuraScript IPLouisville, KY
Freedom FertilityByfield, MA
Site
Scale and Synergies
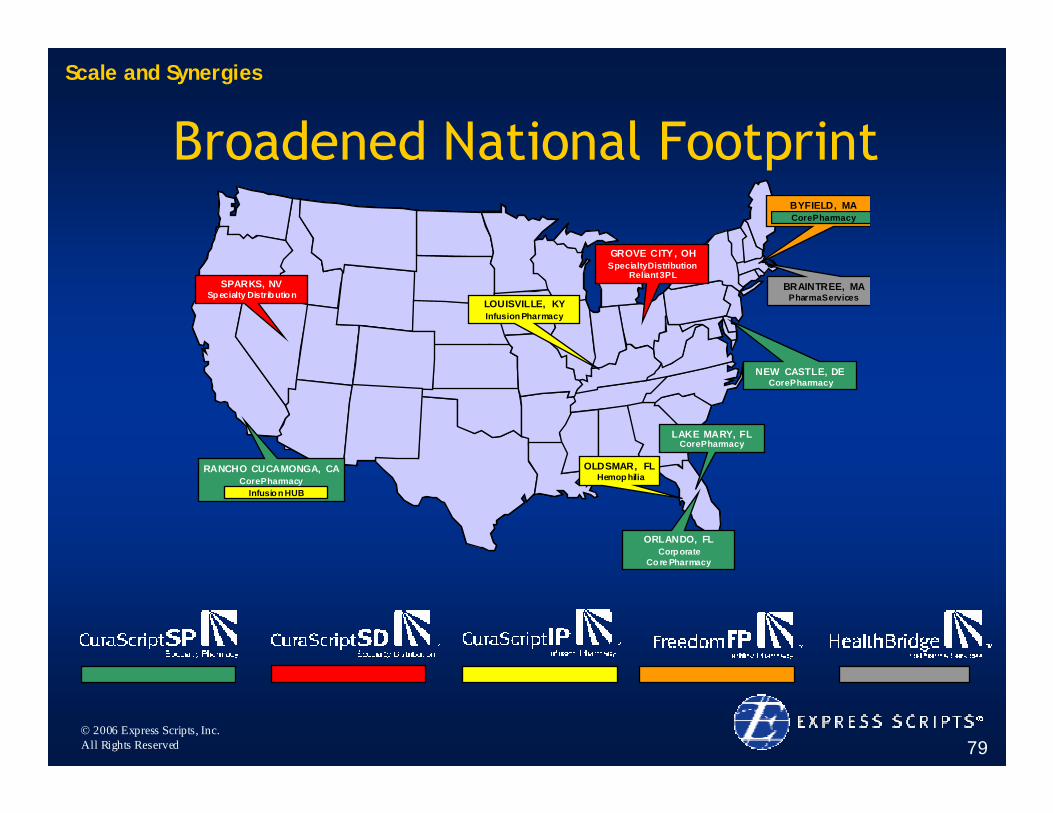
© 2006 Express Scripts, Inc.All Rights Reserved 79
EASTERN
REG ION
CENTRAL
REG ION
W ESTERN
REGION
LOUISVILLE, KYInfusion Pharmacy
LAKE MARY, FLCore Pharmacy
GROVE CITY , OHSpecialty Distribution
Reliant 3PL
OLDSMAR, FLHemop hilia
SPARKS, NVSp ecialty Distrib utio n
BYFIELD, MACore Pharmacy
NEW CASTLE, DECore Pharmacy
RANCHO CUCAMONGA, CACore Pharmacy
Infusio n HUB
ORLANDO, FLCorp orate
Co re Pharmacy
BRAINTREE, MAPharma Services
Broadened National FootprintScale and Synergies
© 2006 Express Scripts, Inc.All Rights Reserved 80
Enhanced Purchasing Power
Scale and Synergies
© 2006 Express Scripts, Inc.All Rights Reserved 81
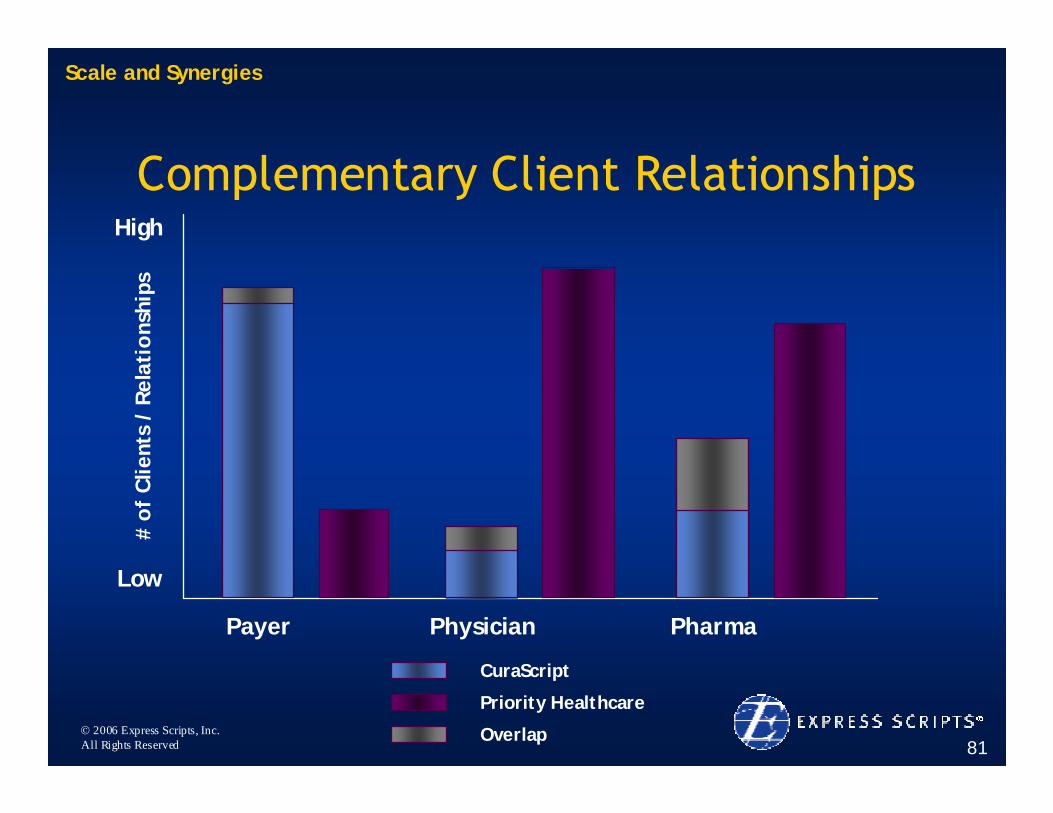
Complementary Client Relationships
Scale and Synergies
CuraScript
Priority Healthcare
Overlap
Payer Physician Pharma
Low
High
# o
f C
lient
s /
Rela
tio
nshi
ps
© 2006 Express Scripts, Inc.All Rights Reserved 82
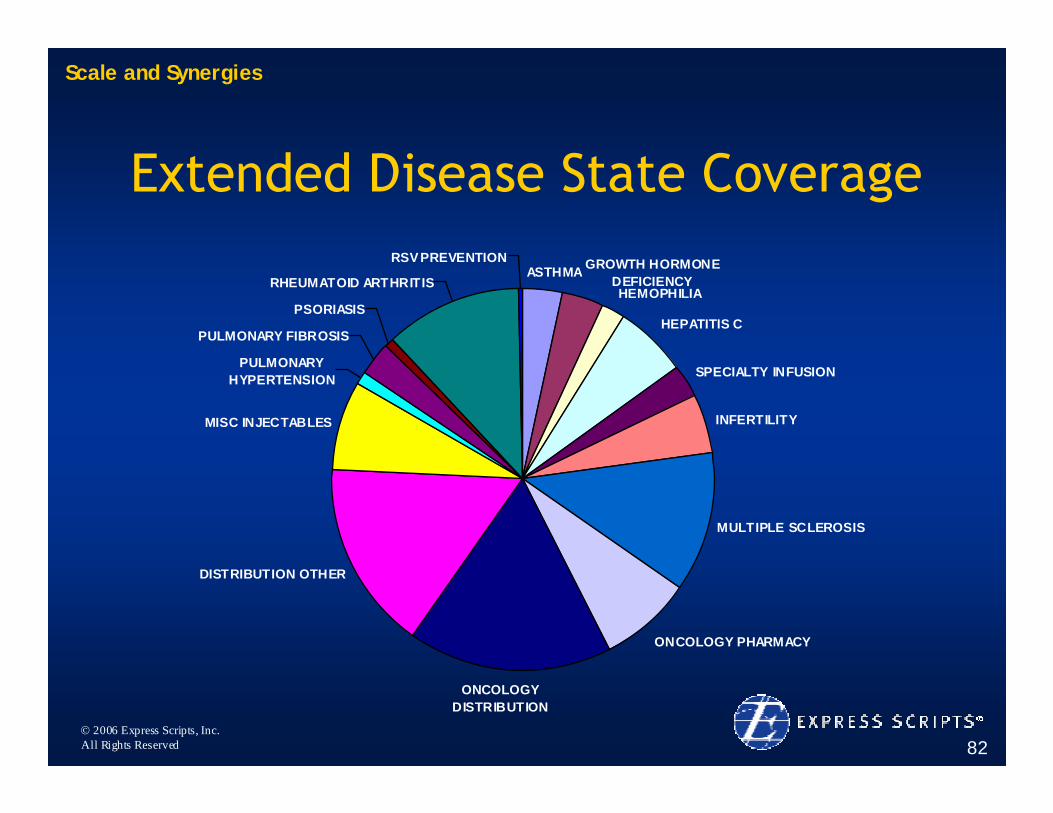
Extended Disease State Coverage
ASTHMA GROWTH HORMONE DEFICIENCYHEMOPHILIA
HEPATITIS C
SPECIALTY INFUSION
INFERTILITY
MULTIPLE SCLEROSIS
ONCOLOGY PHARMACY
ONCOLOGY DISTRIBUTION
DISTRIBUTION OTHER
MISC INJECTABLES
PULMONARY HYPERTENSION
PULMONARY FIBROSIS
PSORIASIS
RHEUMATOID ARTHRITIS
RSV PREVENTION
Scale and Synergies
© 2006 Express Scripts, Inc.All Rights Reserved 83
Breadth of Distribution Platform
© 2006 Express Scripts, Inc.All Rights Reserved 84
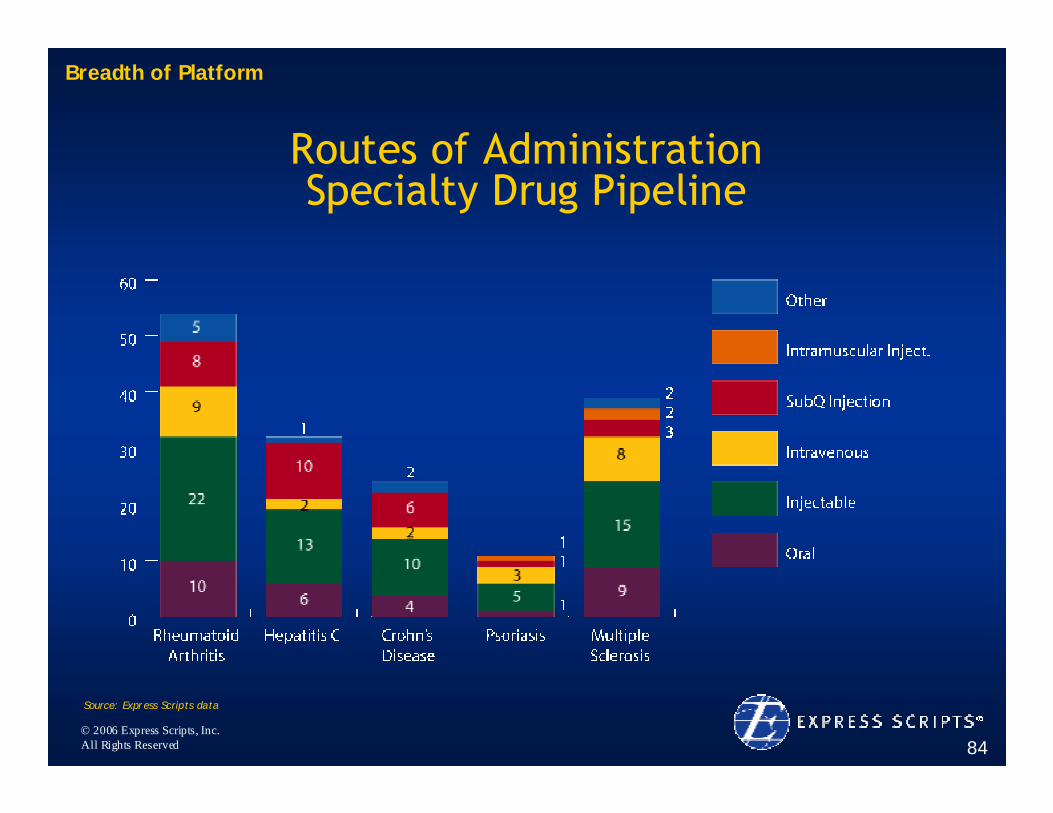
Routes of AdministrationSpecialty Drug Pipeline
Source: Express Scripts data
Breadth of Platform
© 2006 Express Scripts, Inc.All Rights Reserved 85
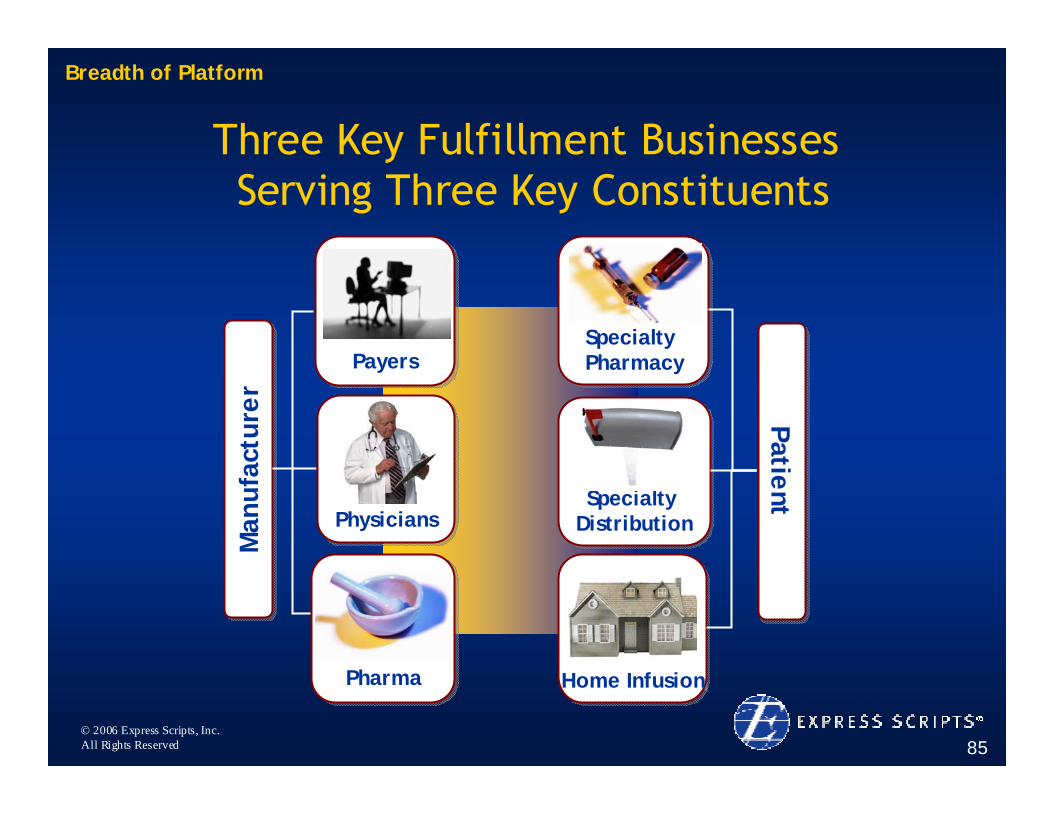
Three Key Fulfillment BusinessesServing Three Key Constituents
Man
ufac
ture
rM
anuf
actu
rer
PhysiciansPhysicians
PharmaPharma
PayersPayers
Home InfusionHome Infusion
Specialty DistributionSpecialty
Distribution
Specialty PharmacySpecialty Pharmacy
PatientPatient
Breadth of Platform
© 2006 Express Scripts, Inc.All Rights Reserved 86
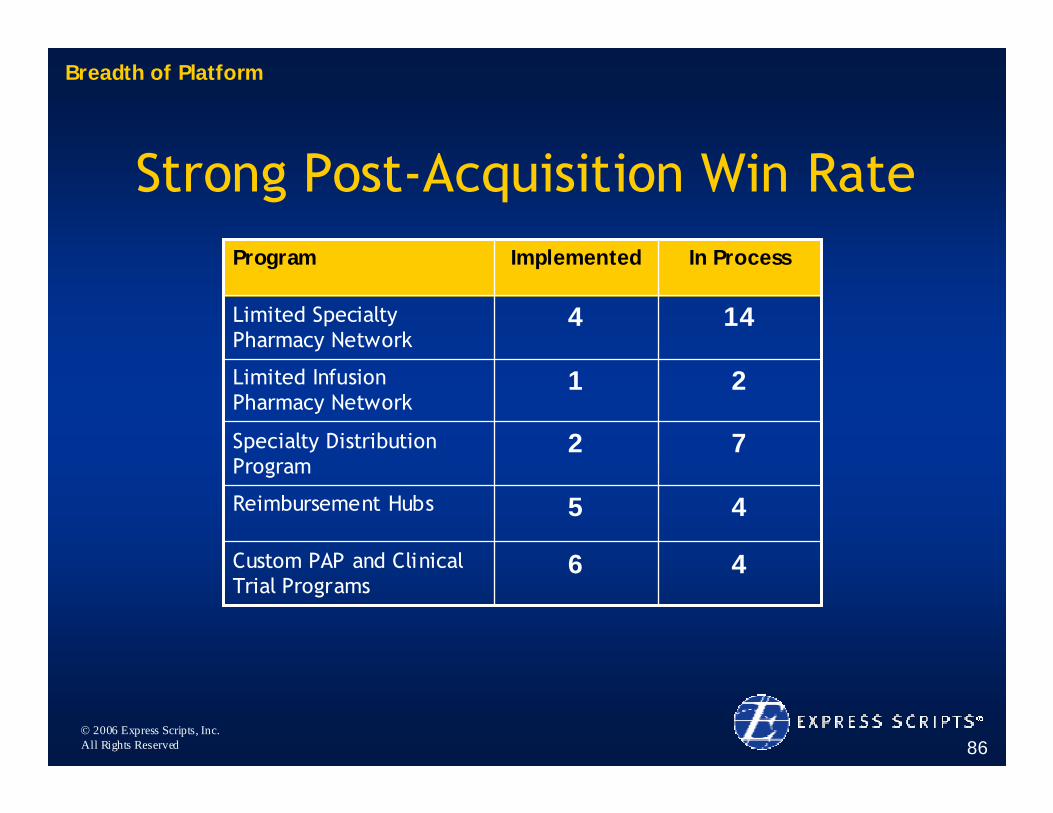
Strong Post-Acquisition Win Rate
46Custom PAP and Clinical Trial Programs
45Reimbursement Hubs
72Specialty Distribution Program
21Limited Infusion Pharmacy Network
144Limited Specialty Pharmacy Network
In ProcessImplementedProgram
Breadth of Platform
© 2006 Express Scripts, Inc.All Rights Reserved 87
Significant Upsell Opportunity
© 2006 Express Scripts, Inc.All Rights Reserved 88
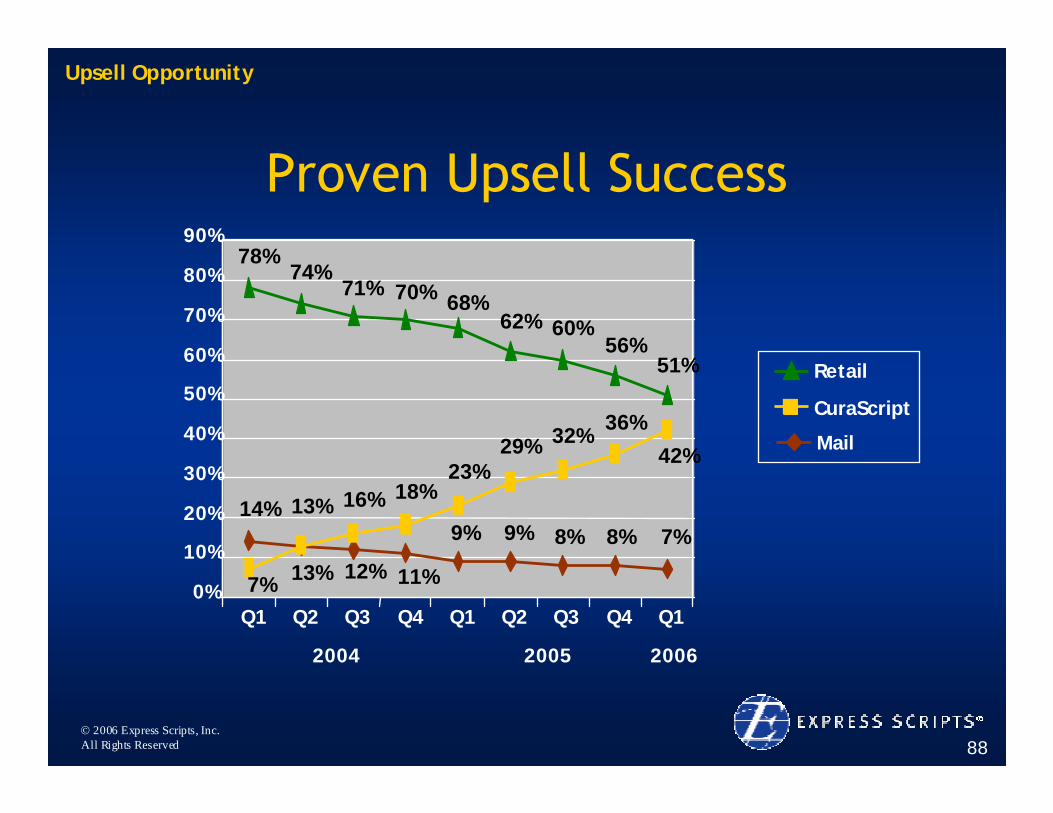
Proven Upsell Success
Upsell Opportunity
7%8%8%9%9%
12%13% 11%
14%
42%36%32%29%
23%18%
13% 16%
7%
71%78%
74%70% 68%
62% 60%56%
51%
0%
10%
20%
30%
40%
50%
60%
70%
80%
90%
Q1 Q2
2004
Q3 Q4 Q1
2005
Q2 Q3 Q4 Q1
2006
CuraScript
Retail

© 2006 Express Scripts, Inc.All Rights Reserved 89
Impressive New Client Growth
• 813 new clients in 24 months since acquisition
• Exclusive mix growing
Upsell Opportunity
34%Exclusive
66%Preferred
© 2006 Express Scripts, Inc.All Rights Reserved 90
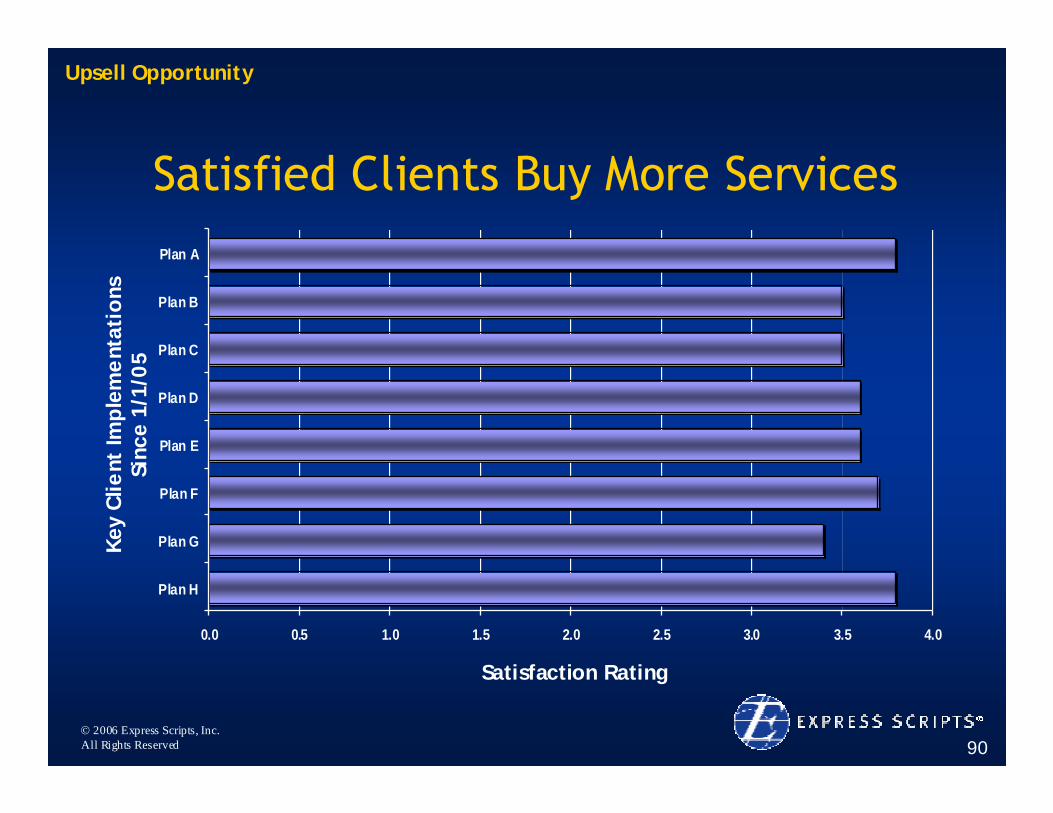
Satisfied Clients Buy More Services
Upsell Opportunity
0.0 0.5 1.0 1.5 2.0 2.5 3.0 3.5 4.0
Plan H
Plan G
Plan F
Plan E
Plan D
Plan C
Plan B
Plan A
Satisfaction Rating
Key
Clie
nt Im
ple
me
ntat
ions
Sinc
e 1/
1/0
5
© 2006 Express Scripts, Inc.All Rights Reserved 91
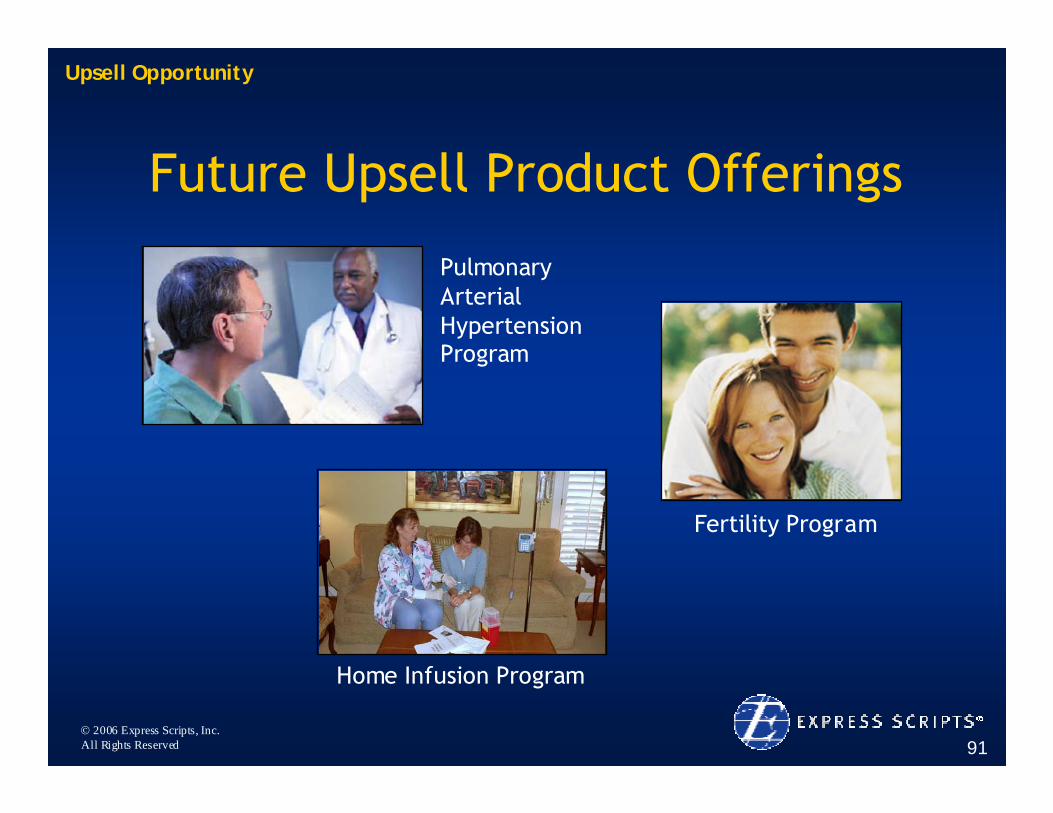
Future Upsell Product Offerings
PulmonaryArterialHypertensionProgram
Fertility Program
Home Infusion Program
Upsell Opportunity
© 2006 Express Scripts, Inc.All Rights Reserved 92
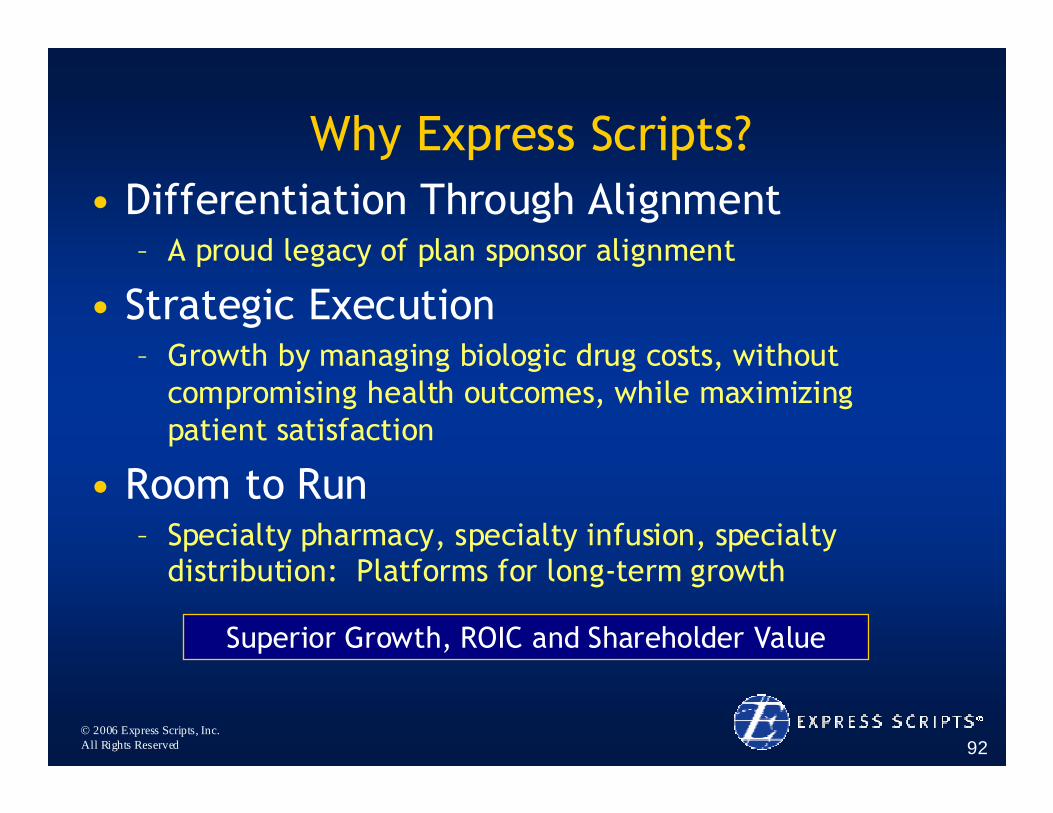
Why Express Scripts?• Differentiation Through Alignment
– A proud legacy of plan sponsor alignment
• Strategic Execution– Growth by managing biologic drug costs, without
compromising health outcomes, while maximizing patient satisfaction
• Room to Run– Specialty pharmacy, specialty infusion, specialty
distribution: Platforms for long-term growth
Superior Growth, ROIC and Shareholder Value
© 2006 Express Scripts, Inc.All Rights Reserved
We Are Succeeding In The Marketplace
Ed IgnaczakSenior Vice President
Sales and Account Management

© 2006 Express Scripts, Inc.All Rights Reserved 94
Multiple Factors Being Leveraged To Drive Client/Shareholder Value
We can move the market…….
$ Value to ESI / $ Value to Clients
Satisfaction Satisfaction
Home Delivery
Satisfaction
Home Delivery
Generics
Satisfaction
Home Delivery
Generics
Specialty
Satisfaction
Home Delivery
Generics
Specialty
Pipeline
Satisfaction
Home Delivery
Generics
Specialty
Pipeline
New Sales
# of Leveraged Factors
ESI and Client Values are Aligned
© 2006 Express Scripts, Inc.All Rights Reserved 95
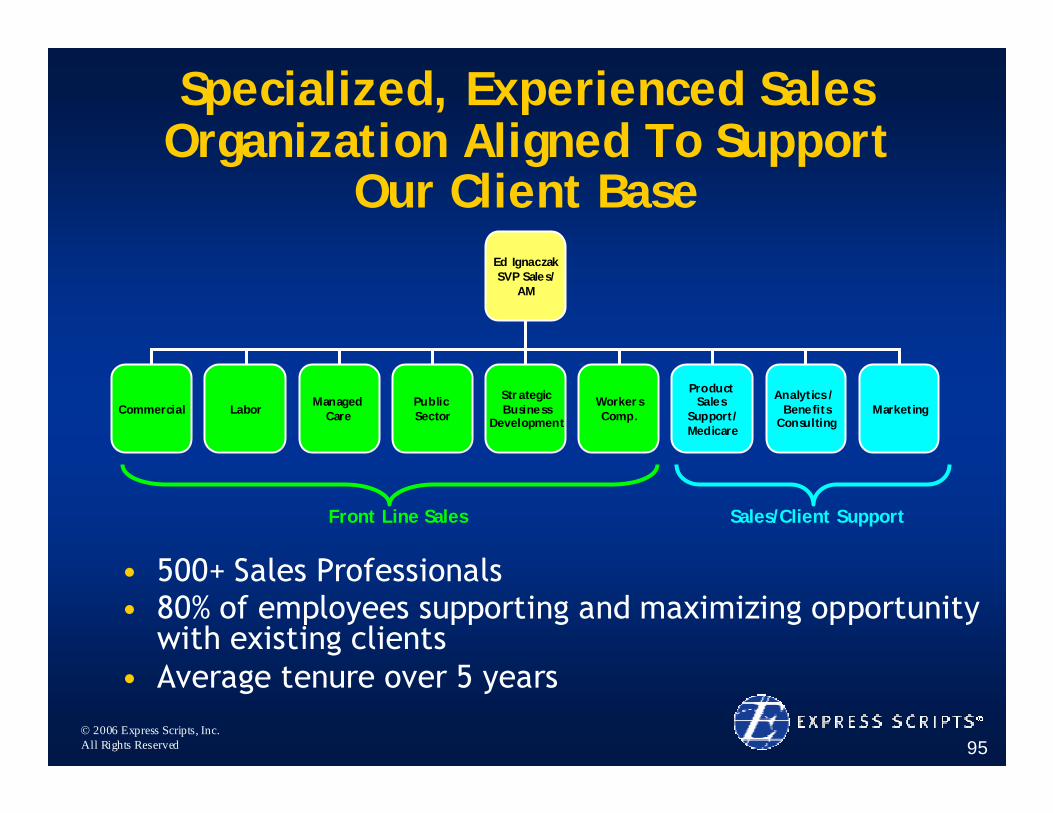
Specialized, Experienced Sales Organization Aligned To Support
Our Client Base
• 500+ Sales Professionals• 80% of employees supporting and maximizing opportunity
with existing clients • Average tenure over 5 years
Ed IgnaczakSVP Sales/
AM
Commercial LaborManaged
CarePublic Sector
Product Sales
Support/Medicare
Analytics / Benefits
ConsultingMarketing
StrategicBusiness
Development
WorkersComp.
Front Line Sales Sales/Client Support
© 2006 Express Scripts, Inc.All Rights Reserved 96
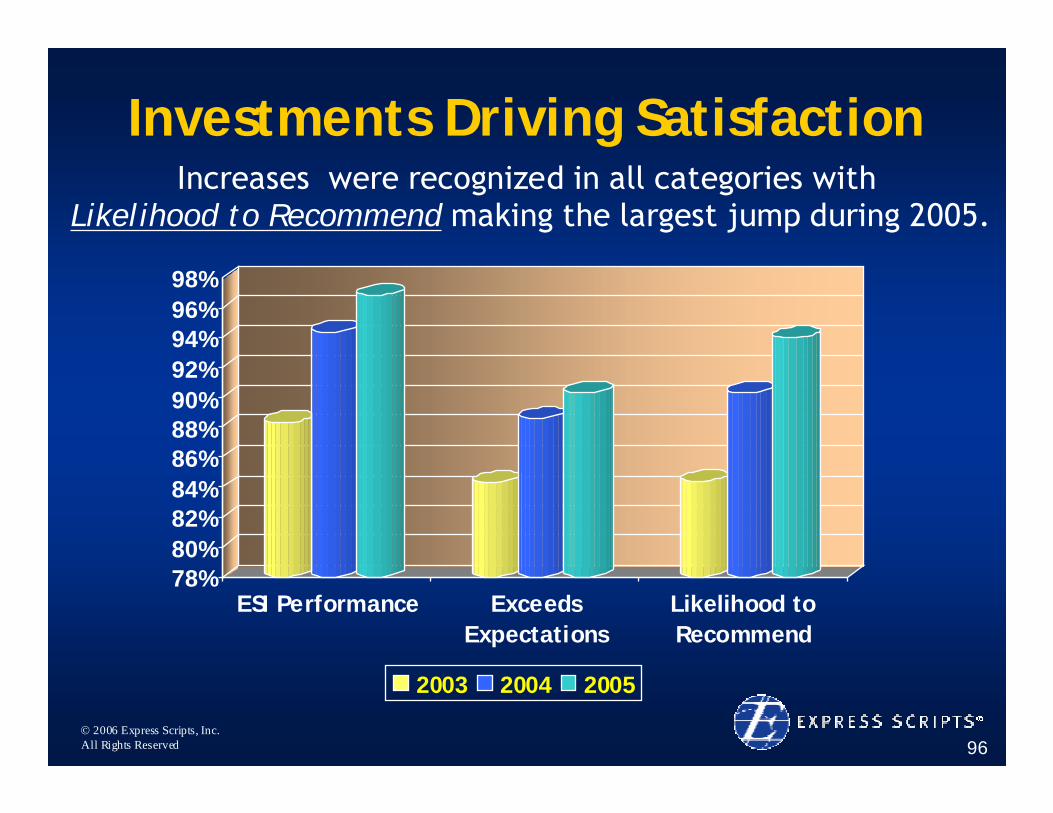
Investments Driving SatisfactionIncreases were recognized in all categories with
Likelihood to Recommend making the largest jump during 2005.
78%80%82%84%86%88%90%92%94%96%98%
ESI Performance ExceedsExpectations
Likelihood toRecommend
2003 2004 2005
© 2006 Express Scripts, Inc.All Rights Reserved 97
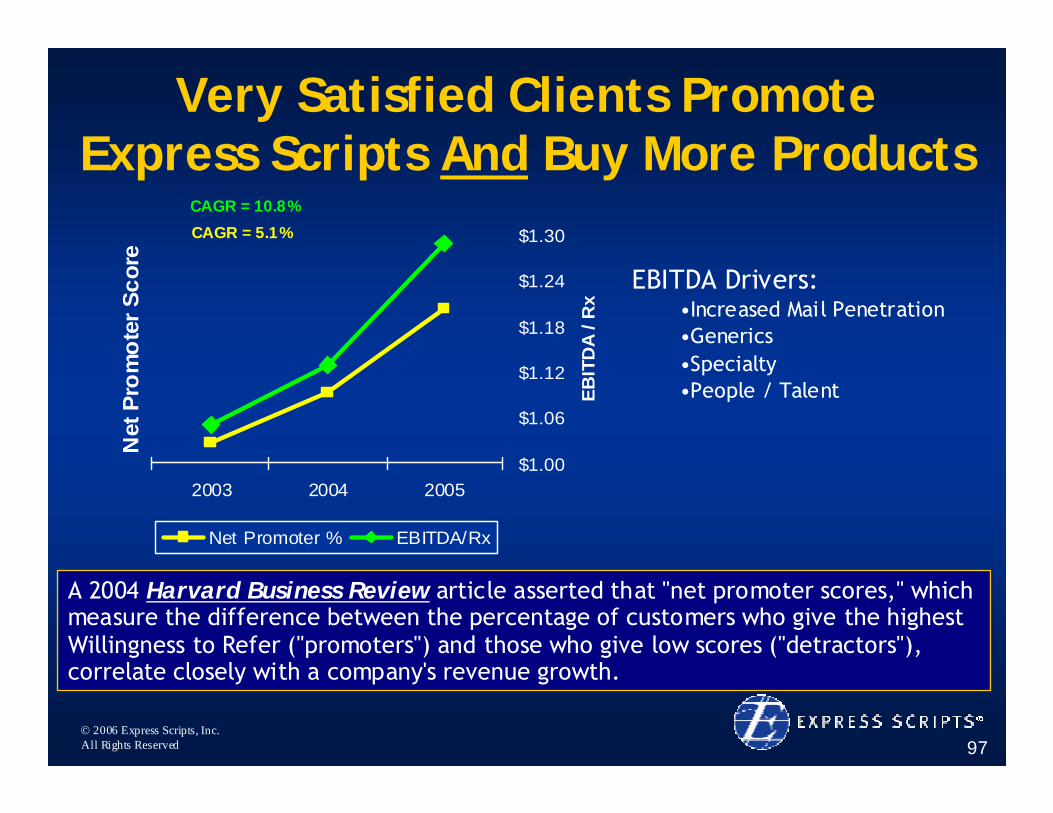
Very Satisfied Clients Promote Express Scripts And Buy More Products
A 2004 Harvard Business Review article asserted that "net promoter scores," which measure the difference between the percentage of customers who give the highest Willingness to Refer ("promoters") and those who give low scores ("detractors"), correlate closely with a company's revenue growth.
2003 2004 2005
Net
Pro
mot
er S
core
$1.00
$1.06
$1.12
$1.18
$1.24
$1.30
EBIT
DA
/ Rx
Net Promoter % EBITDA/Rx
CAGR = 5.1%CAGR = 10.8%
EBITDA Drivers:•Increased Mail Penetration•Generics•Specialty•People / Talent
© 2006 Express Scripts, Inc.All Rights Reserved 98
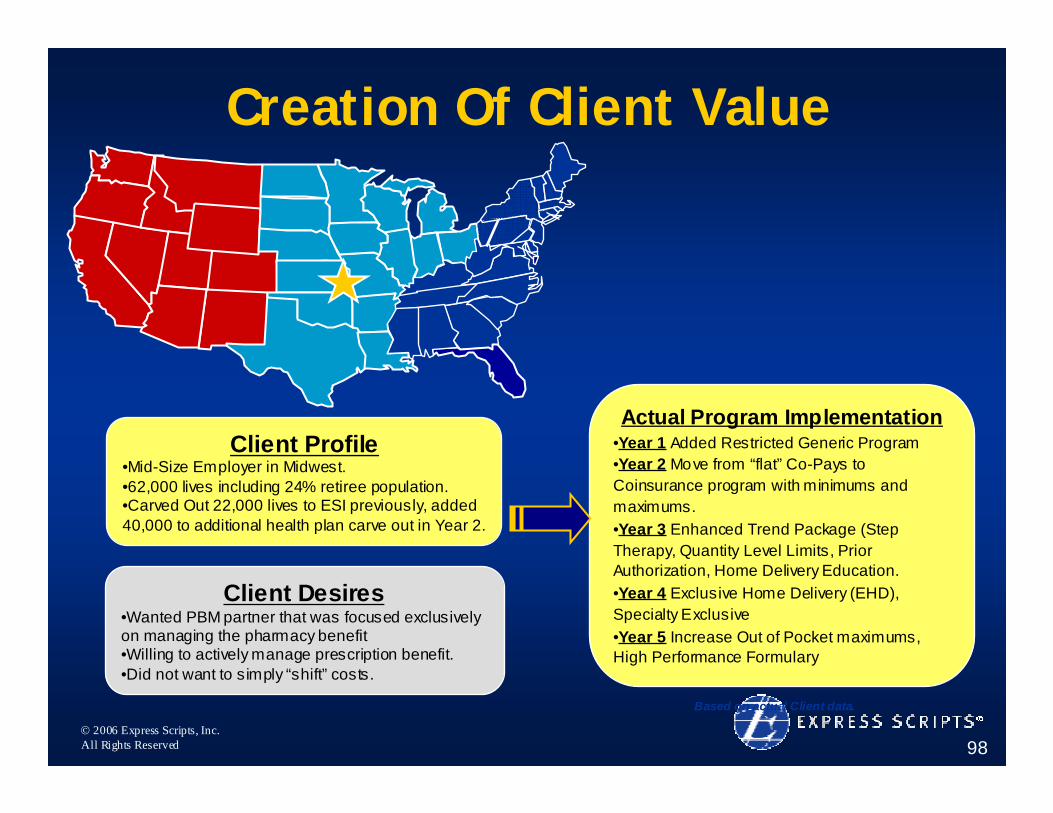
Creation Of Client Value
Client Profile•Mid-Size Employer in Midwest.•62,000 lives including 24% retiree population.•Carved Out 22,000 lives to ESI previously, added 40,000 to additional health plan carve out in Year 2.
Client Desires•Wanted PBM partner that was focused exclusively on managing the pharmacy benefit•Willing to actively manage prescription benefit.•Did not want to simply “shift” costs.
Actual Program Implementation•Year 1 Added Restricted Generic Program•Year 2 Move from “flat” Co-Pays to Coinsurance program with minimums and maximums.•Year 3 Enhanced Trend Package (Step Therapy, Quantity Level Limits, Prior Authorization, Home Delivery Education.•Year 4 Exclusive Home Delivery (EHD), Specialty Exclusive•Year 5 Increase Out of Pocket maximums, High Performance Formulary
Based on actual Client data.
© 2006 Express Scripts, Inc.All Rights Reserved 99
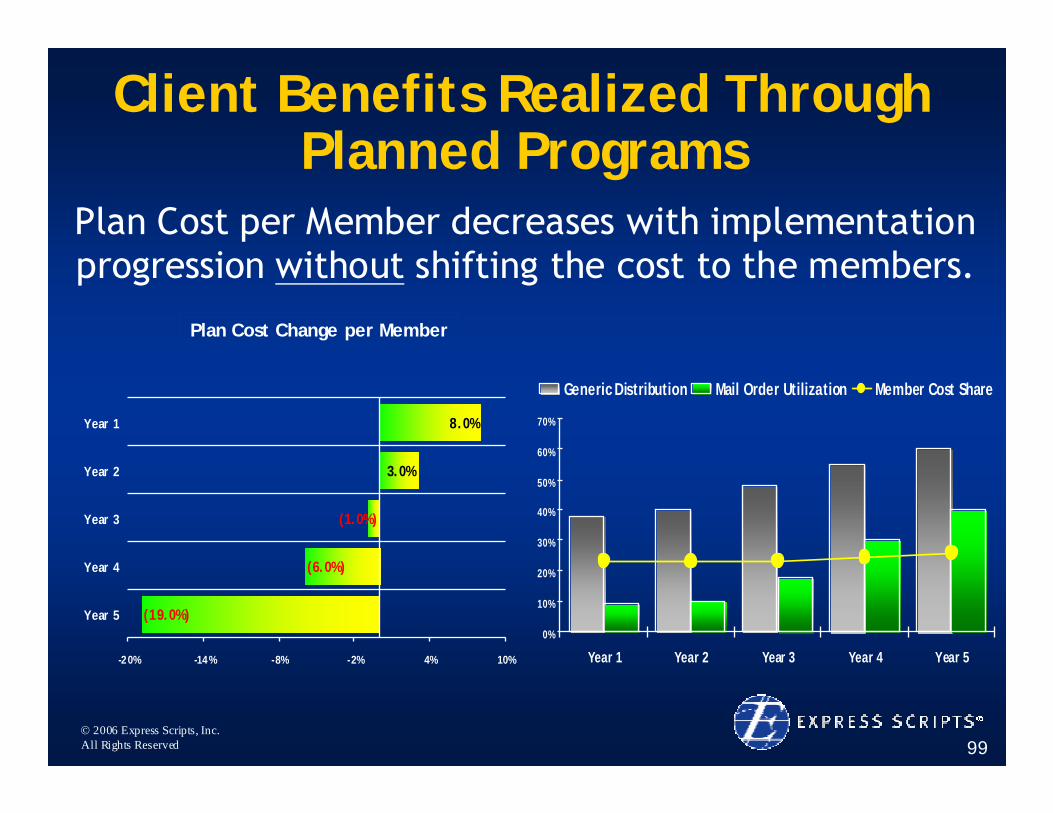
Client Benefits Realized Through Planned Programs
(19.0%)
(6.0%)
(1.0%)
3.0%
8.0%
-20% -14% -8% -2% 4% 10%
Year 5
Year 4
Year 3
Year 2
Year 1
Plan Cost Change per Member
0%
10%
20%
30%
40%
50%
60%
70%
Year 1 Year 2 Year 3 Year 4 Year 5
Generic Distribution Mail Order Utilization Member Cost Share
Plan Cost per Member decreases with implementation progression without shifting the cost to the members.
© 2006 Express Scripts, Inc.All Rights Reserved 100
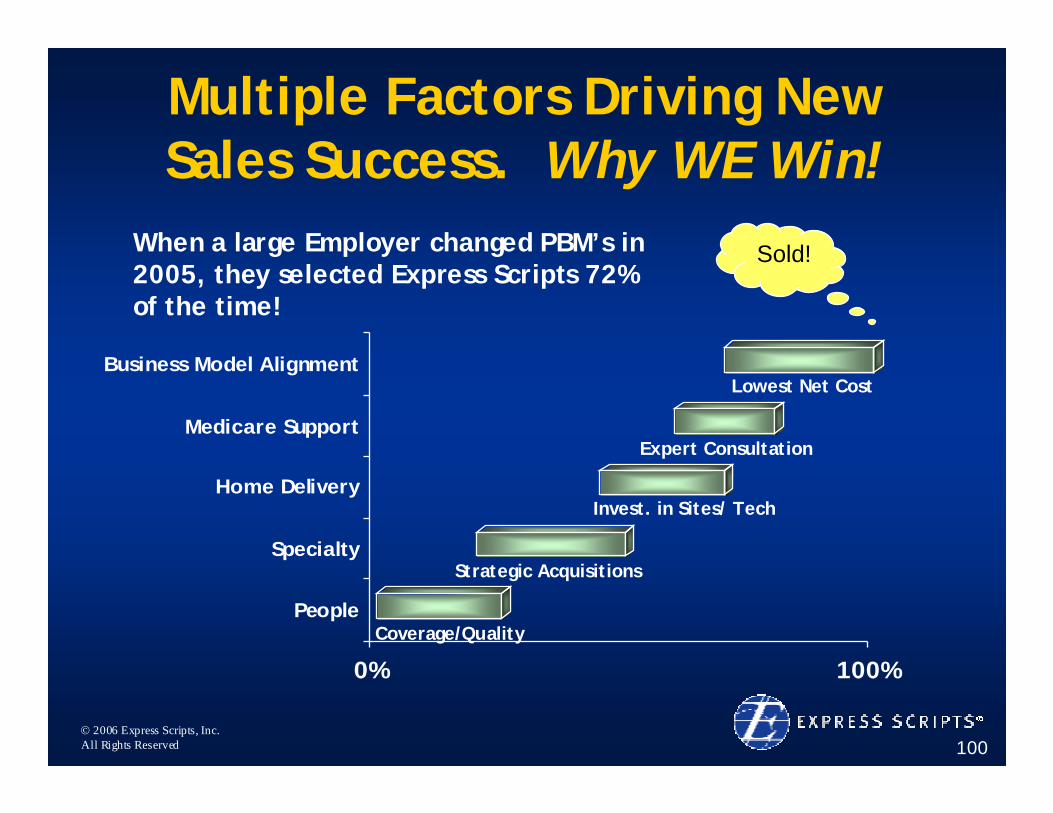
Multiple Factors Driving New Sales Success. Why WE Win!
0% 100%
People
Specialty
Home Delivery
Medicare Support
Business Model Alignment
Sold!
Coverage/Quality
Strategic Acquisitions
Invest. in Sites/ Tech
Expert Consultation
Lowest Net Cost
When a large Employer changed PBM’s in 2005, they selected Express Scripts 72% of the time!
© 2006 Express Scripts, Inc.All Rights Reserved 101
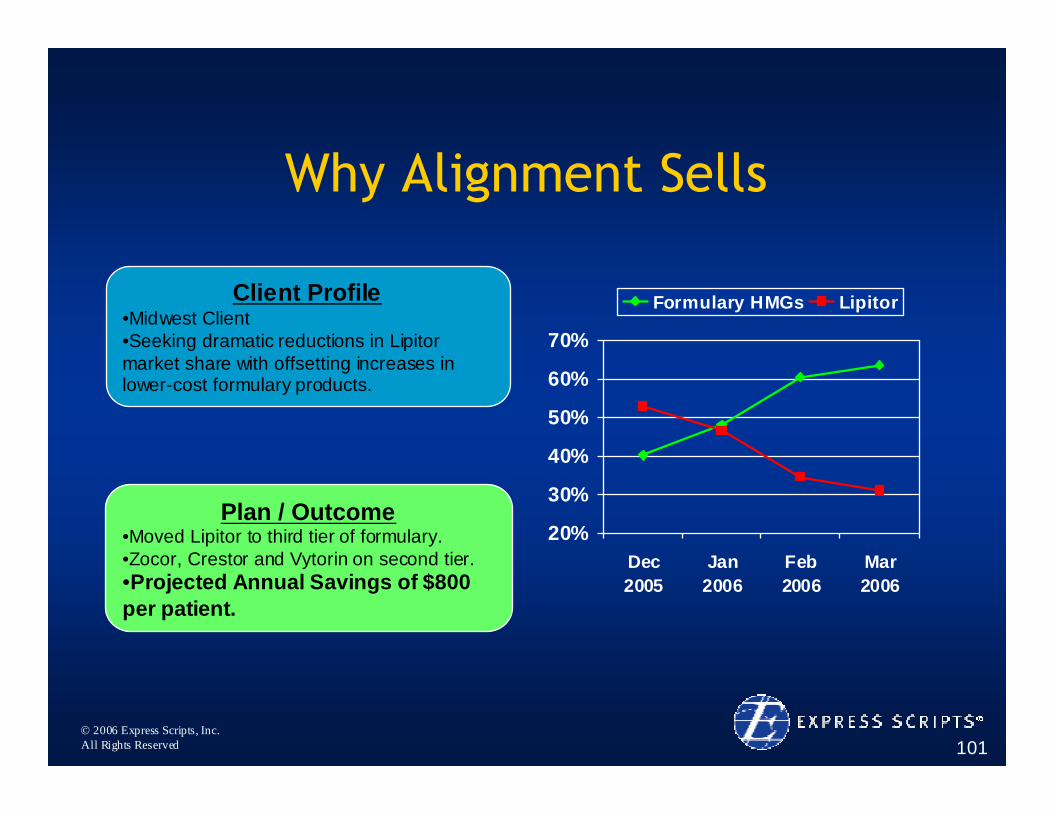
Why Alignment Sells
20%
30%
40%
50%
60%
70%
Dec2005
Jan2006
Feb2006
Mar2006
Formulary HMGs LipitorClient Profile•Midwest Client•Seeking dramatic reductions in Lipitor market share with offsetting increases in lower-cost formulary products.
Plan / Outcome•Moved Lipitor to third tier of formulary.•Zocor, Crestor and Vytorin on second tier.•Projected Annual Savings of $800 per patient.
© 2006 Express Scripts, Inc.All Rights Reserved 102
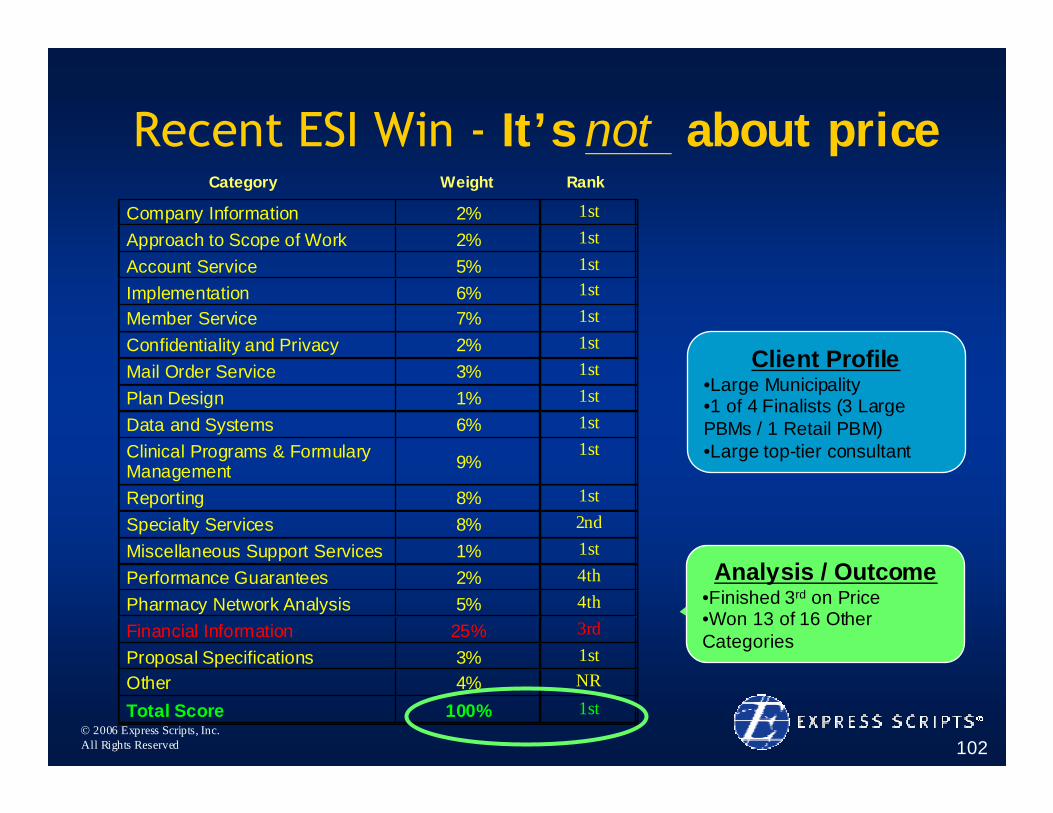
Recent ESI Win - It’s not about priceCompany Information 2% 1st Approach to Scope of Work 2% 1st Account Service 5% 1st Implementation 6% 1st Member Service 7% 1st Confidentiality and Privacy 2% 1st Mail Order Service 3% 1st Plan Design 1% 1st Data and Systems 6% 1st Clinical Programs & Formulary Management 9%
1st
Reporting 8% 1st Specialty Services 8% 2nd Miscellaneous Support Services 1% 1st Performance Guarantees 2% 4th Pharmacy Network Analysis 5% 4th Financial Information 25% 3rd Proposal Specifications 3% 1st Other 4% NR
Total Score 100% 1st
Client Profile•Large Municipality •1 of 4 Finalists (3 Large PBMs / 1 Retail PBM)•Large top-tier consultant
Analysis / Outcome•Finished 3rd on Price•Won 13 of 16 Other Categories
Category Weight Rank
© 2006 Express Scripts, Inc.All Rights Reserved 103
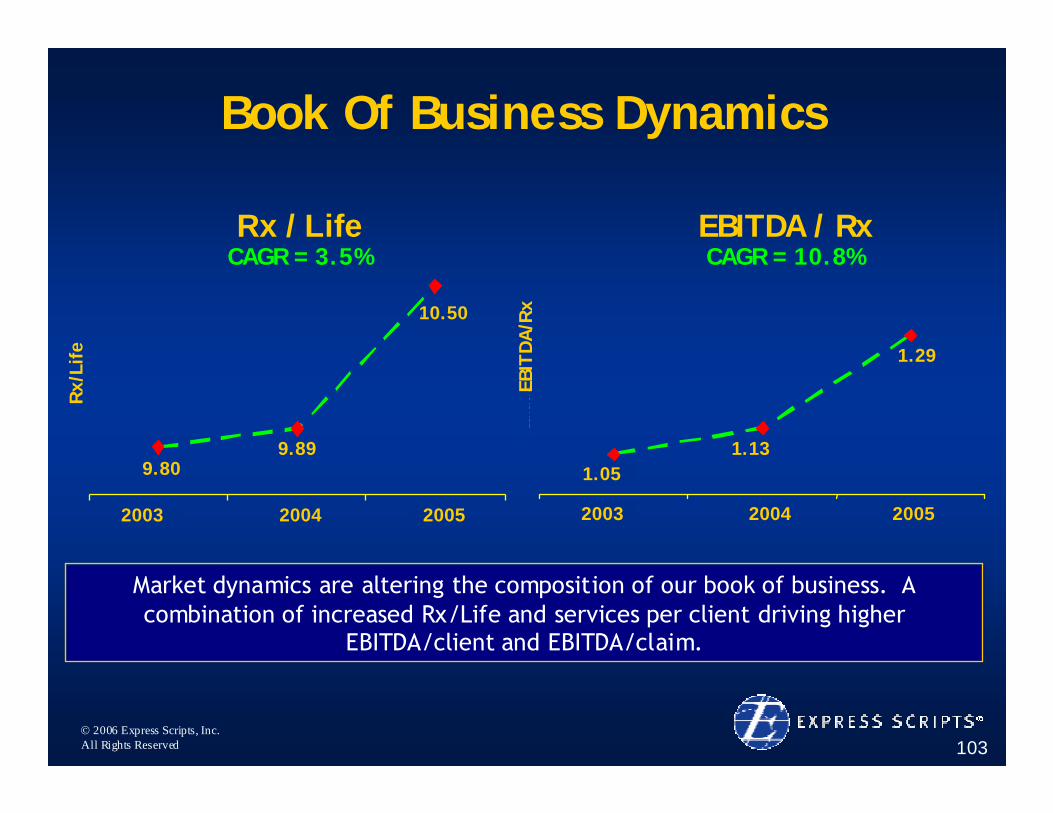
Market dynamics are altering the composition of our book of business. A combination of increased Rx/Life and services per client driving higher
EBITDA/client and EBITDA/claim.
Book Of Business Dynamics
1.05
1.13
1.29
2003 2004 2005
EBIT
DA/R
x
Rx / Life
9.809.89
10.50
2003 2004 2005
Rx /
Life
CAGR = 3.5%
10.50
9.89
200520042003
9.80
Rx/
Life
EBITDA / RxCAGR = 10.8%
1.29
1.131.05
200520042003EB
ITD
A/R
x
© 2006 Express Scripts, Inc.All Rights Reserved 104
Why Express Scripts?• Differentiation Through Alignment
– Alignment sells in the marketplace
• Strategic Execution– Investments in human capital and service
initiatives
• Room to Run– Significant upsell opportunities and targeted
organic growth
Superior Growth, ROIC and Shareholder Value
© 2006 Express Scripts, Inc.All Rights Reserved
Focus On Margin Enhancement And ROIC
Ed StiftenCFO
© 2006 Express Scripts, Inc.All Rights Reserved 106
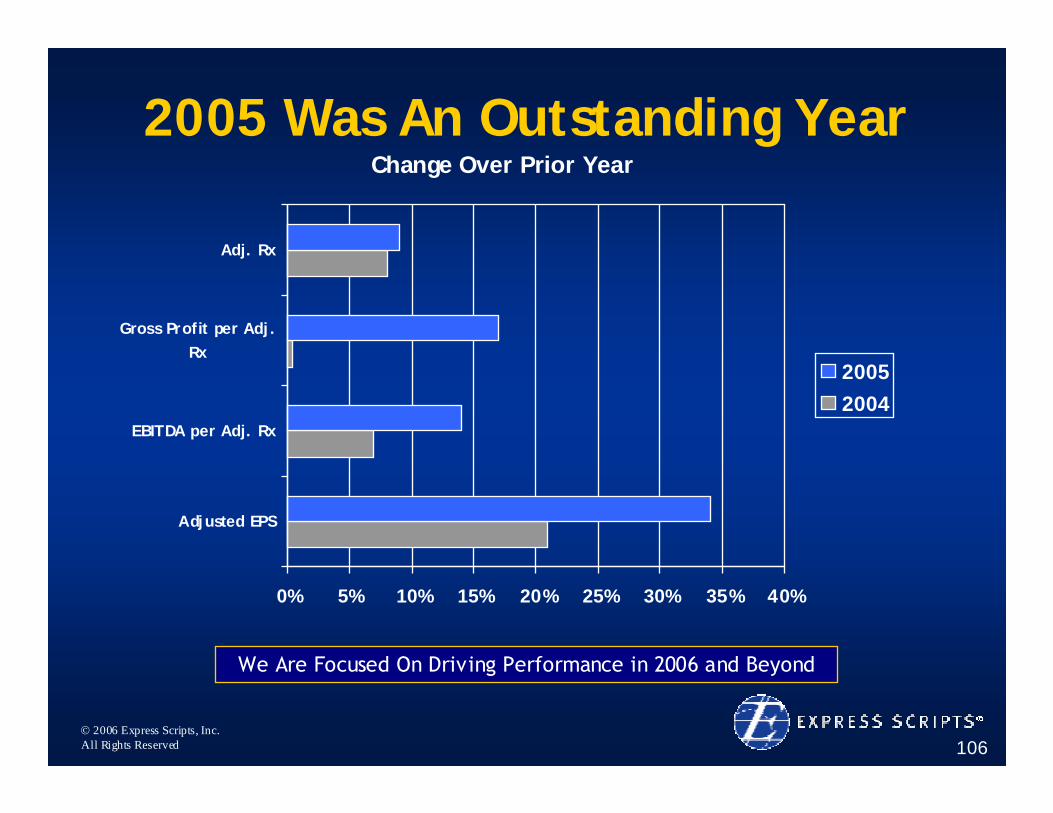
Change Over Prior Year
0% 5% 10% 15% 20% 25% 30% 35% 40%
Adjusted EPS
EBITDA per Adj. Rx
Gross Profit per Adj.Rx
Adj. Rx
20052004
2005 Was An Outstanding Year
We Are Focused On Driving Performance in 2006 and Beyond
© 2006 Express Scripts, Inc.All Rights Reserved 107
Changing Paradigm For Growth
We have positioned Express Scripts to produce
superior earnings growth and shareholder value
in an environment of claims growth that is lower than we have
experienced historically
© 2006 Express Scripts, Inc.All Rights Reserved 108
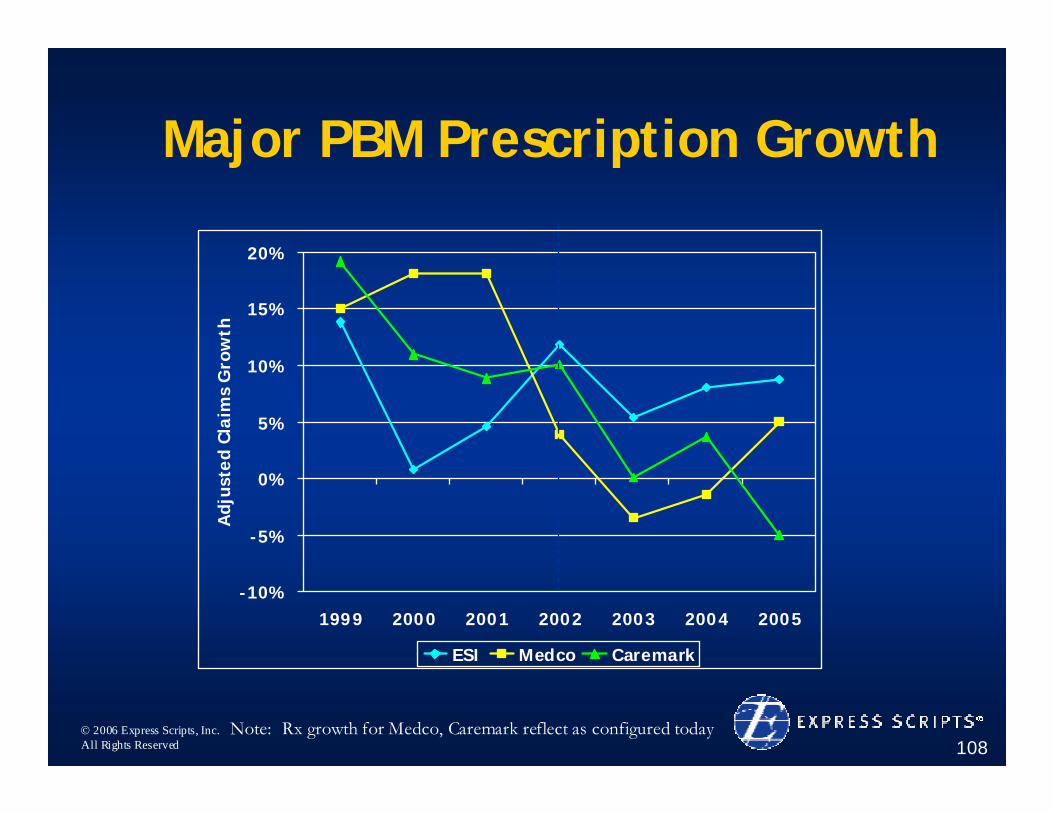
-10%
-5%
0%
5%
10%
15%
20%
1999 2000 2001 2002 2003 2004 2005
Adj
uste
d Cl
aim
s G
row
th
ESI Medco Caremark
Major PBM Prescription Growth
Note: Rx growth for Medco, Caremark reflect as configured today
© 2006 Express Scripts, Inc.All Rights Reserved 109
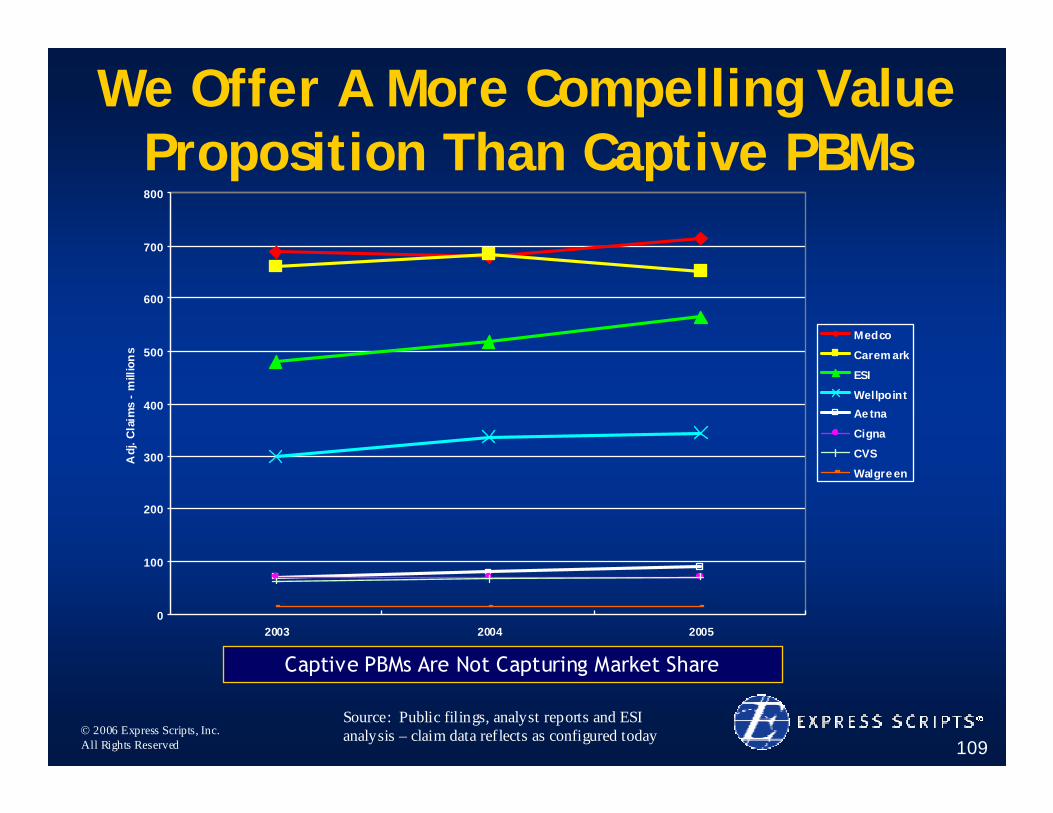
We Offer A More Compelling Value Proposition Than Captive PBMs
0
100
200
300
400
500
600
700
800
2003 2004 2005
Adj
. Cla
ims
- m
illio
ns
Medco
Carem ark
ESI
WellpointAe tna
Cigna
CVS
Walgre en
Source: Public filings, analyst reports and ESI analysis – claim data reflects as configured today
Captive PBMs Are Not Capturing Market Share
© 2006 Express Scripts, Inc.All Rights Reserved 110
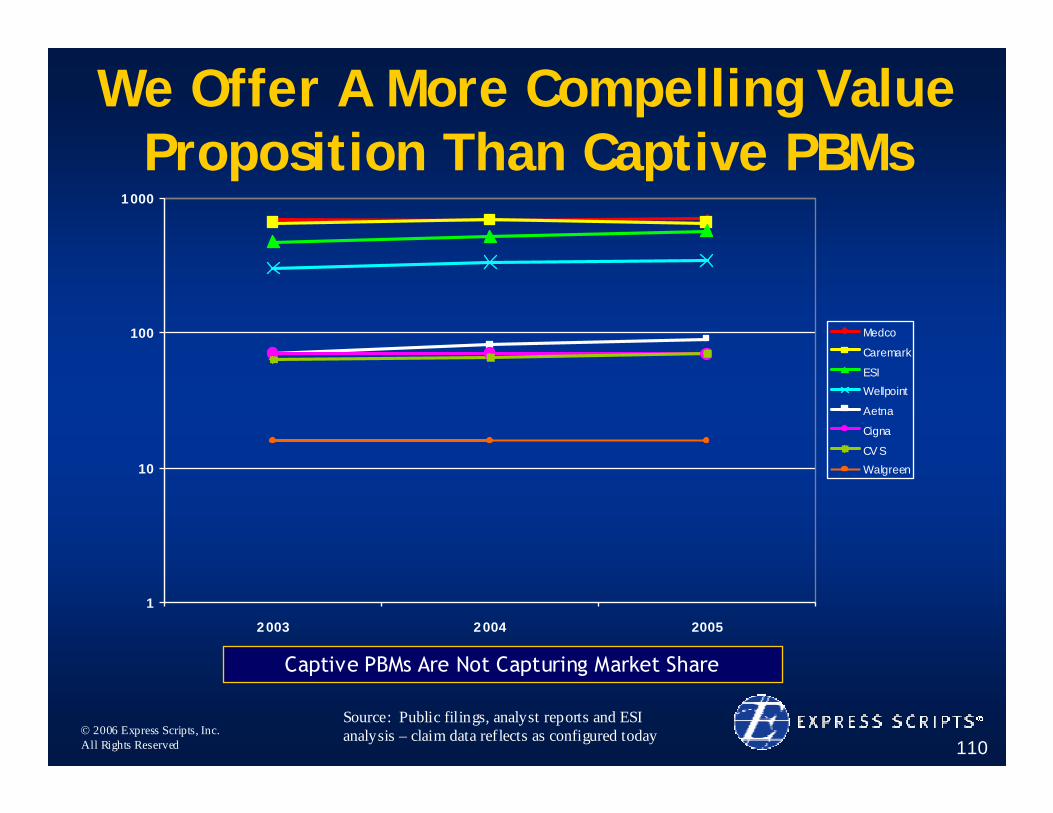
We Offer A More Compelling Value Proposition Than Captive PBMs
1
10
100
1000
2003 2004 2005
Medco
Caremark
ESIWellpoint
Aetna
Cigna
CV SWalgreen
Source: Public filings, analyst reports and ESI analysis – claim data reflects as configured today
Captive PBMs Are Not Capturing Market Share

© 2006 Express Scripts, Inc.All Rights Reserved 111
Components Of EPS Growth
9%
7%
5%
0%
5%
10%
15%
20%
25%
2004
Rx Growth EBITDA/Rx Growth Cap Structure/Other
Higher Claims Growth in the Past Required Less EBITDA per Claim Growth
© 2006 Express Scripts, Inc.All Rights Reserved 112
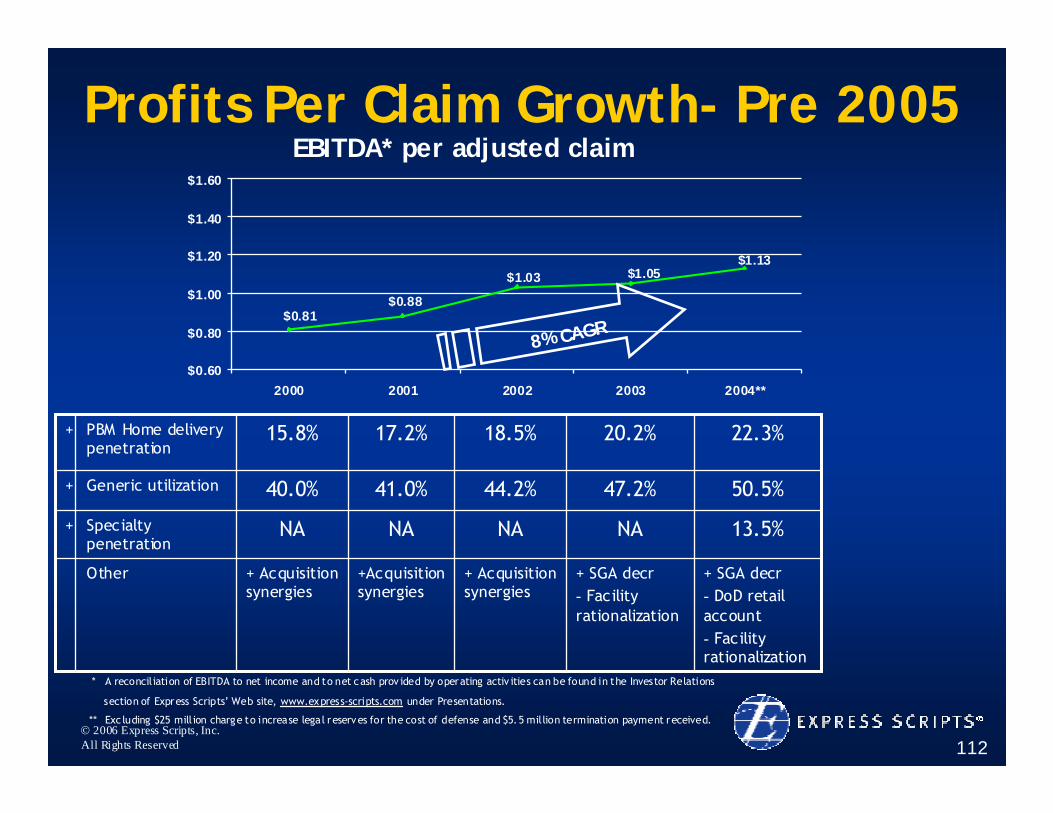
Profits Per Claim Growth- Pre 2005
$1.13$1.05$1.03
$0.88$0.81
$0.60
$0.80
$1.00
$1.20
$1.40
$1.60
2000 2001 2002 2003 2004**
EBITDA* per adjusted claim
* A reconciliation of EBITDA to net income and to net cash prov ided by operating activ ities can be found in the Investor Relations
section of Express Scripts’ Web site, www.express-scripts.com under Presentations.
** Exc luding $25 million charge to increase legal reserves for the cost of defense and $5.5 million termination payment received.
8% CAGR
+
+
+
+ SGA decr- DoD retail account- Facility rationalization
+ SGA decr- Facility rationalization
+ Acquisition synergies
+Acquisition synergies
+ Acquisition synergies
Other
13.5%NANANANASpecialty penetration
50.5%47.2%44.2%41.0%40.0%Generic utilization
22.3%20.2%18.5%17.2%15.8%PBM Home delivery penetration

© 2006 Express Scripts, Inc.All Rights Reserved 113
Drivers Of EBITDA/Rx Growth - 2005
• Lower home delivery and retail drug purchasing costs
• Specialty pharmacy
• Generic utilization
• Home delivery
• Productivity improvements – pharmacy and call centerMore Moderate Claims Growth Requires More EBITDA per Claim Growth
© 2006 Express Scripts, Inc.All Rights Reserved 114
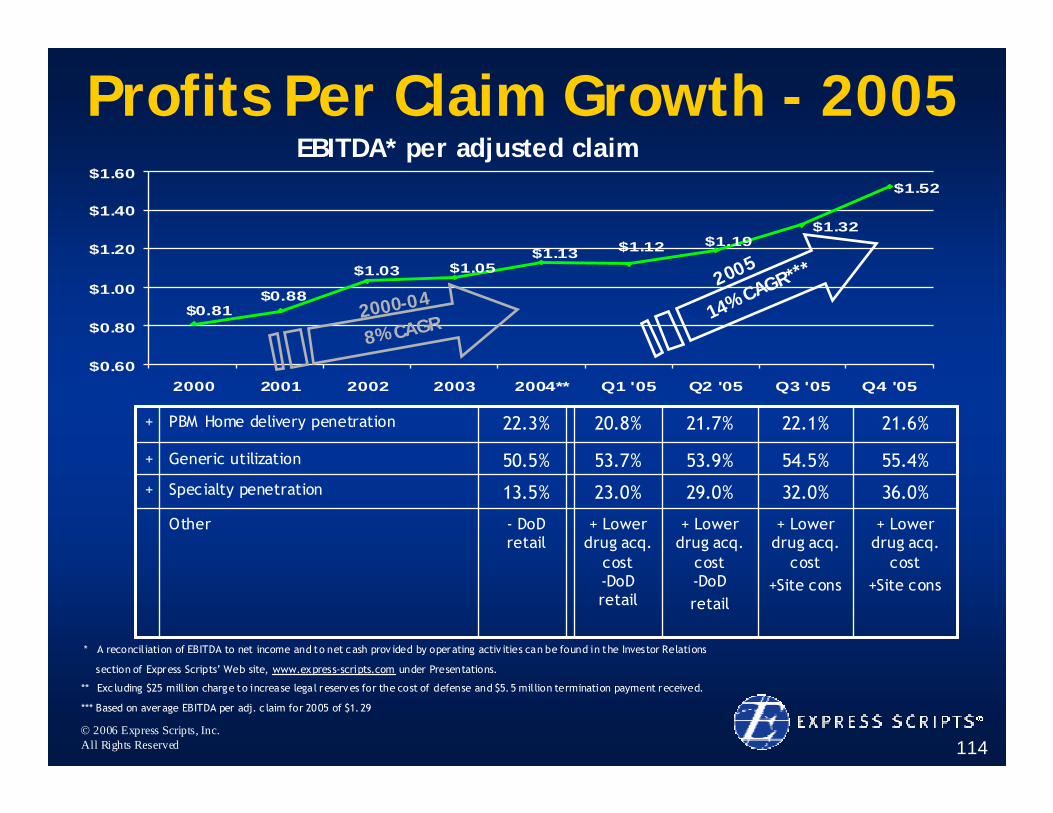
Profits Per Claim Growth - 2005
$1.32
$1.52
$1.13 $1.12$1.05$1.03
$0.88$0.81
$1.19
$0.60
$0.80
$1.00
$1.20
$1.40
$1.60
2000 2001 2002 2003 2004** Q1 '05 Q2 '05 Q3 '05 Q4 '05
EBITDA* per adjusted claim
* A reconciliation of EBITDA to net income and to net cash prov ided by operating activ ities can be found in the Investor Relations
section of Express Scripts’ Web site, www.express-scripts.com under Presentations.
** Exc luding $25 million charge to increase legal reserves for the cost of defense and $5.5 million termination payment received.
*** Based on average EBITDA per adj. c laim for 2005 of $1.29
2005
14% CAGR***
2000-04
8% CAGR
+
+
+
+ Lower drug acq.
cost+Site cons
+ Lower drug acq.
cost+Site cons
+ Lower drug acq.
cost -DoDretail
+ Lower drug acq.
cost -DoD retail
- DoD retail
Other
36.0%32.0%29.0%23.0%13.5%Specialty penetration
55.4%54.5%53.9%53.7%50.5%Generic utilization
21.6%22.1%21.7%20.8%22.3%PBM Home delivery penetration
© 2006 Express Scripts, Inc.All Rights Reserved 115
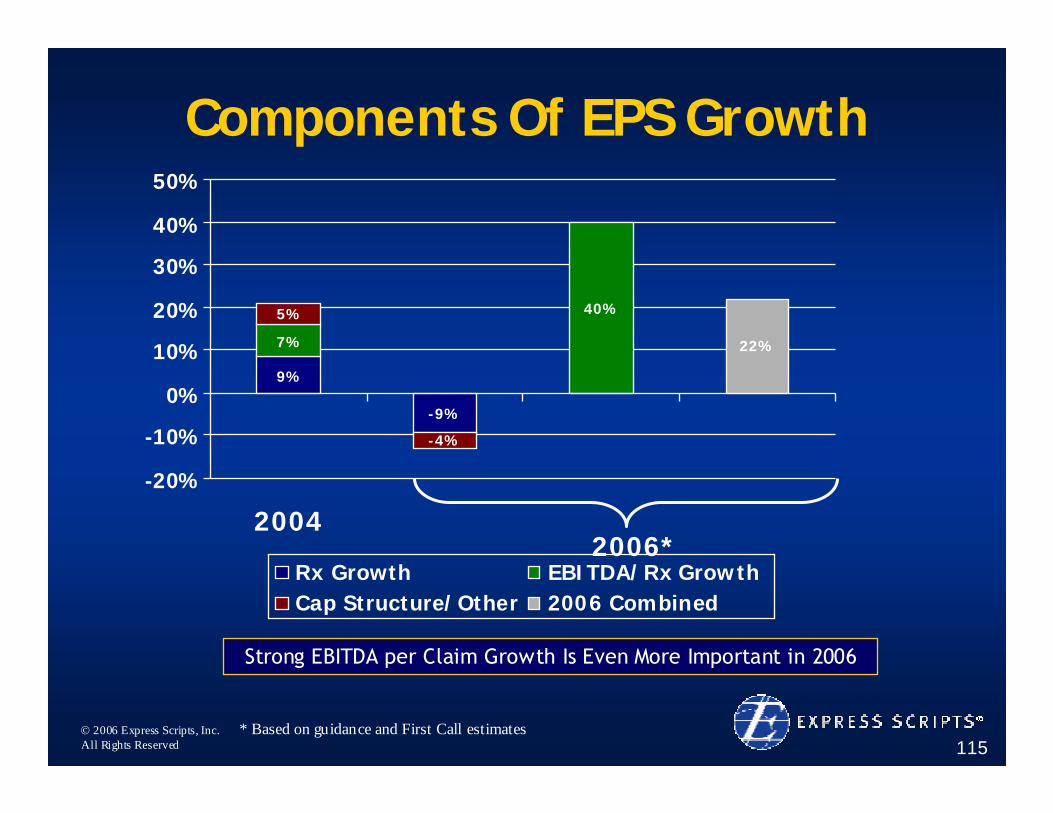
Components Of EPS Growth
9%
-9%
7%
40%5%
-4%
22%
-20%
-10%
0%
10%
20%
30%
40%
50%
2004
Rx Growth EBITDA/Rx GrowthCap Structure/Other 2006 Combined
2006*
* Based on guidance and First Call estimates
Strong EBITDA per Claim Growth Is Even More Important in 2006
© 2006 Express Scripts, Inc.All Rights Reserved 116
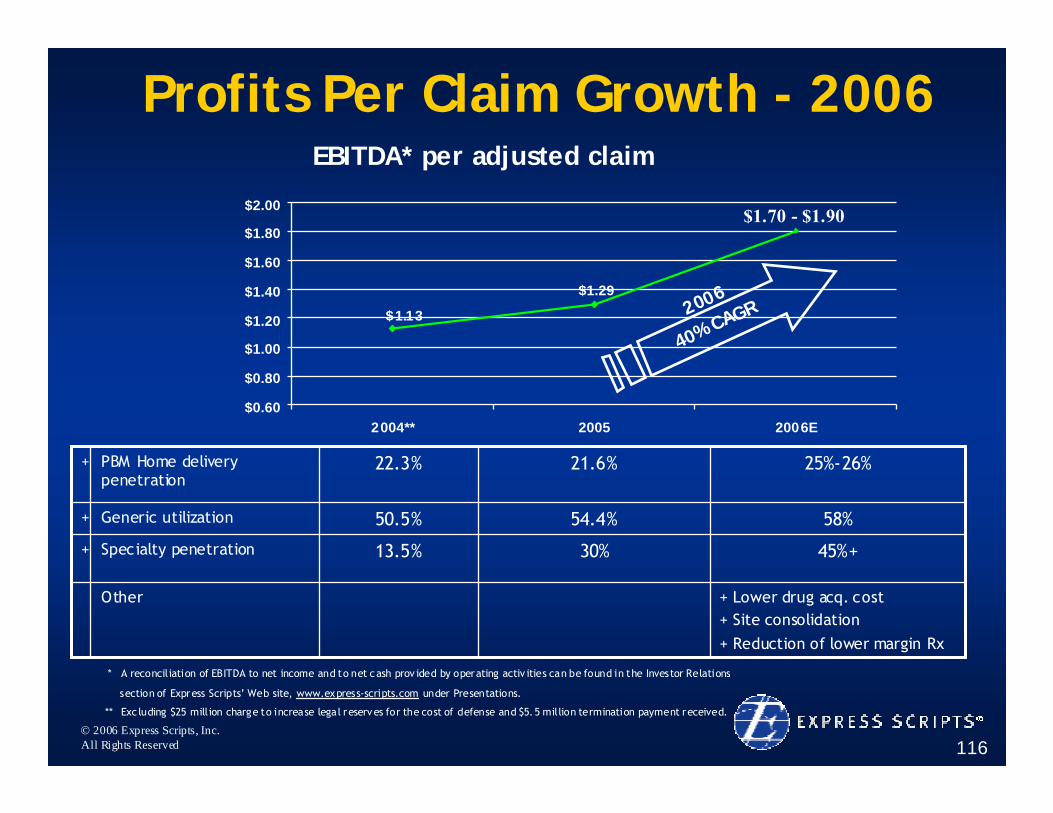
Profits Per Claim Growth - 2006
$1.13
$1.29
$0.60
$0.80
$1.00
$1.20
$1.40
$1.60
$1.80
$2.00
2004** 2005 2006E
EBITDA* per adjusted claim
$1.70 - $1.90
2006
40% CAGR
* A reconciliation of EBITDA to net income and to net cash prov ided by operating activ ities can be found in the Investor Relations
section of Express Scripts’ Web site, www.express-scripts.com under Presentations.
** Exc luding $25 million charge to increase legal reserves for the cost of defense and $5.5 million termination payment received.
+
+
+
+ Lower drug acq. cost+ Site consolidation+ Reduction of lower margin Rx
Other
45%+30%13.5%Specialty penetration
58%54.4%50.5%Generic utilization
25%-26%21.6%22.3%PBM Home delivery penetration
© 2006 Express Scripts, Inc.All Rights Reserved 117
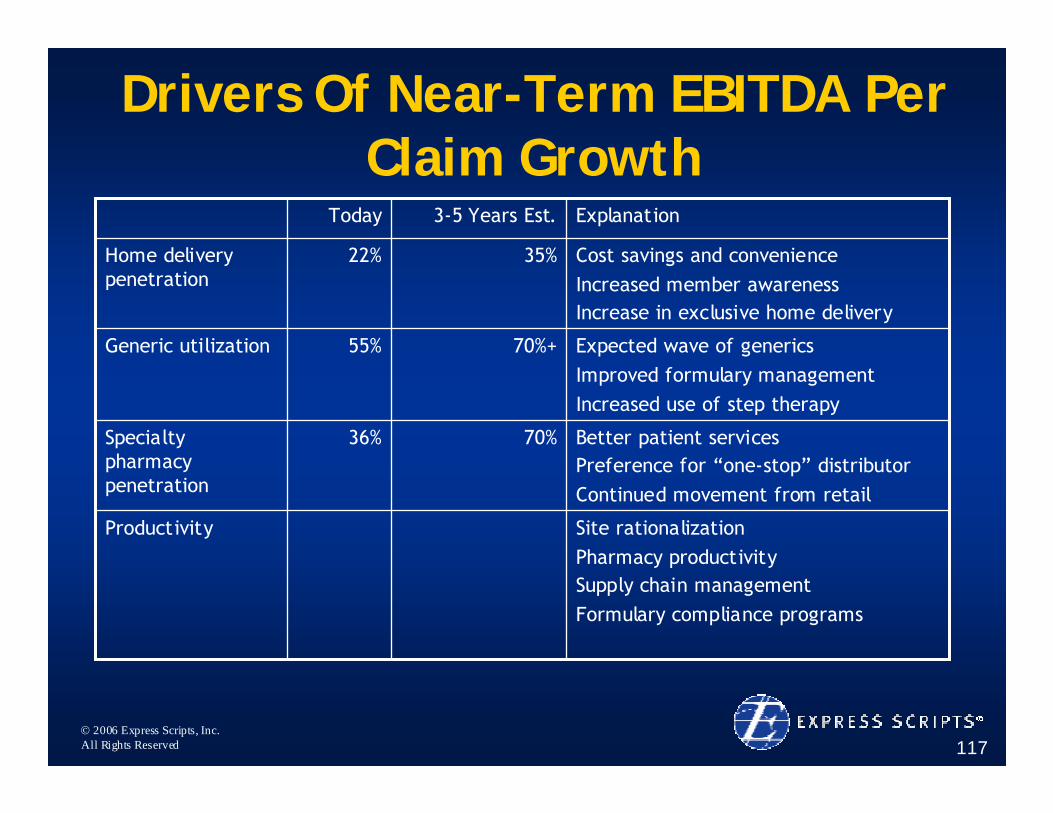
Drivers Of Near-Term EBITDA Per Claim Growth
Better patient servicesPreference for “one-stop” distributorContinued movement from retail
70%36%Specialty pharmacy penetration
Site rationalizationPharmacy productivitySupply chain managementFormulary compliance programs
Productivity
Expected wave of generics Improved formulary managementIncreased use of step therapy
70%+55%Generic utilization
Cost savings and convenienceIncreased member awarenessIncrease in exclusive home delivery
35%22%Home delivery penetration
Explanation3-5 Years Est.Today
© 2006 Express Scripts, Inc.All Rights Reserved 118
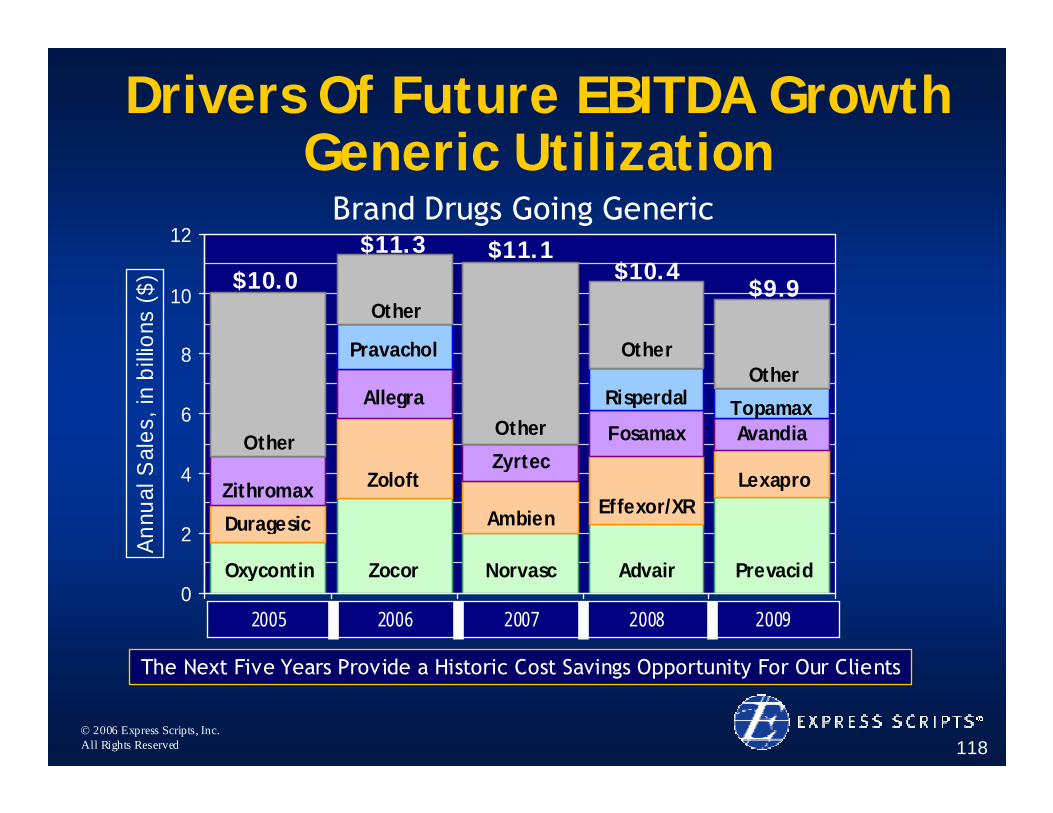
Drivers Of Future EBITDA Growth Generic Utilization
The Next Five Years Provide a Historic Cost Savings Opportunity For Our Clients
0
2
4
6
8
10
12
2005 2006 2007 2008 2009
Annu
al S
ales
, in
billio
ns ($
)
Oxycontin
Duragesic
Zithromax
Other
Zocor
Zoloft
Allegra
Pravachol
Other
Norvasc
Ambien
Zyrtec
Other
Advair
Effexor/XR
Fosamax
Risperdal
Other
Prevacid
Lexapro
AvandiaTopamax
Other
$10.0$11.3 $11.1
$10.4$9.9
Brand Drugs Going Generic
© 2006 Express Scripts, Inc.All Rights Reserved 119
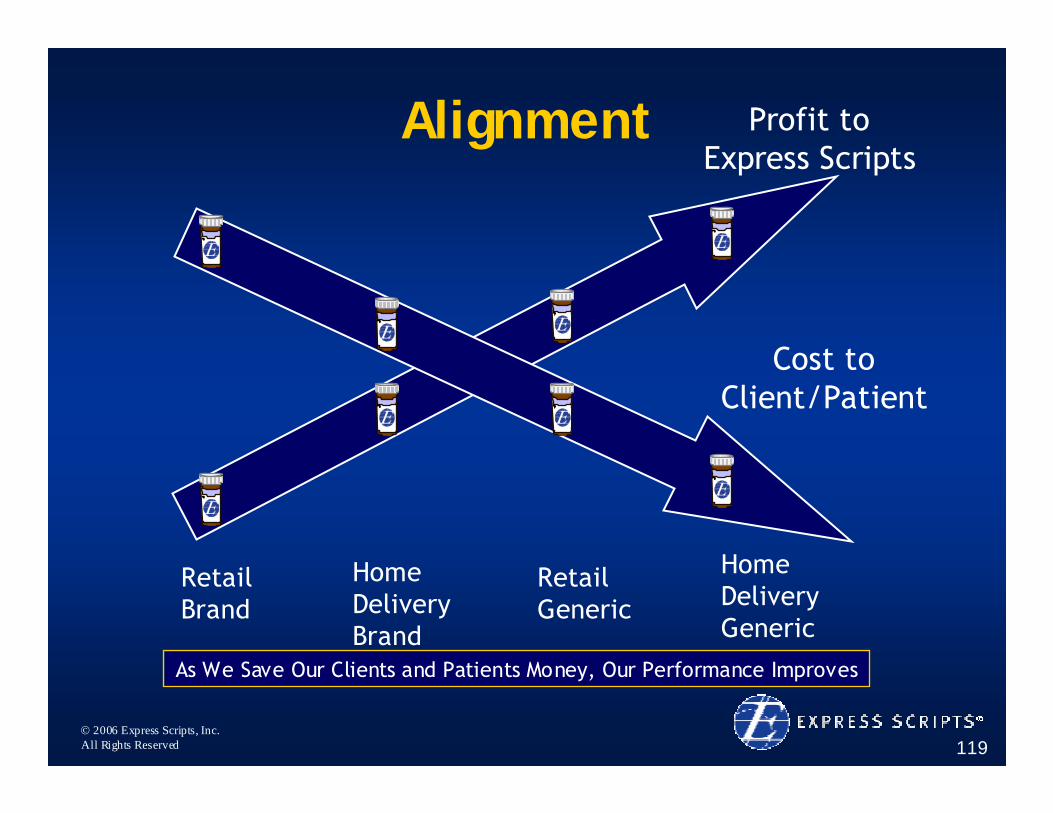
Alignment Profit to Express Scripts
Cost toClient/Patient
RetailBrand
Home DeliveryBrand
Retail Generic
HomeDelivery Generic
As We Save Our Clients and Patients Money, Our Performance Improves
© 2006 Express Scripts, Inc.All Rights Reserved 120
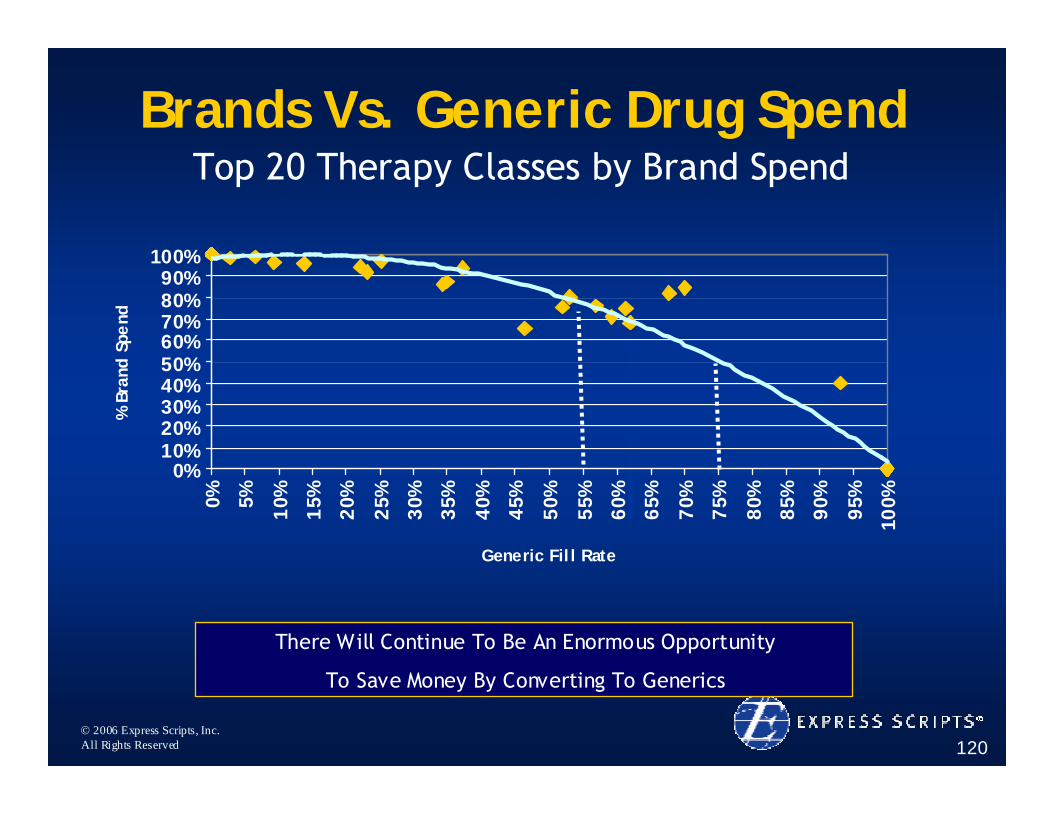
Brands Vs. Generic Drug SpendTop 20 Therapy Classes by Brand Spend
There Will Continue To Be An Enormous Opportunity
To Save Money By Converting To Generics
0%10%20%30%40%50%60%70%80%90%
100%
0% 5% 10%
15%
20%
25%
30%
35%
40%
45%
50%
55%
60%
65%
70%
75%
80%
85%
90%
95%
100%
Generic Fil l Rate
% B
rand
Spe
nd
© 2006 Express Scripts, Inc.All Rights Reserved 121
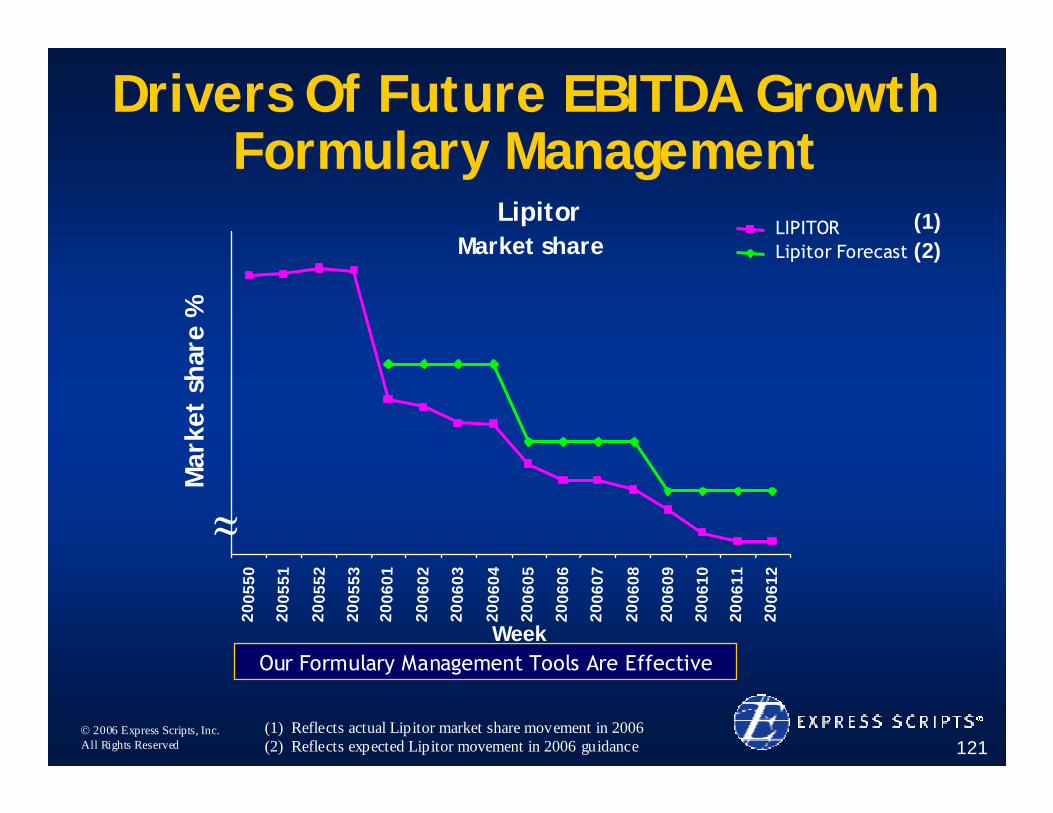
Drivers Of Future EBITDA Growth Formulary Management
(1) Reflects actual Lipitor market share movement in 2006(2) Reflects expected Lipitor movement in 2006 guidance
Our Formulary Management Tools Are Effective
LipitorMarket share
2005
50
2005
51
2005
52
2005
53
2006
01
2006
02
2006
03
2006
04
2006
05
2006
06
2006
07
2006
08
2006
09
2006
10
2006
11
2006
12
Week
Mar
ket
shar
e %
LIPITORLipitor Forecast
≈
(1)(2)
© 2006 Express Scripts, Inc.All Rights Reserved 122
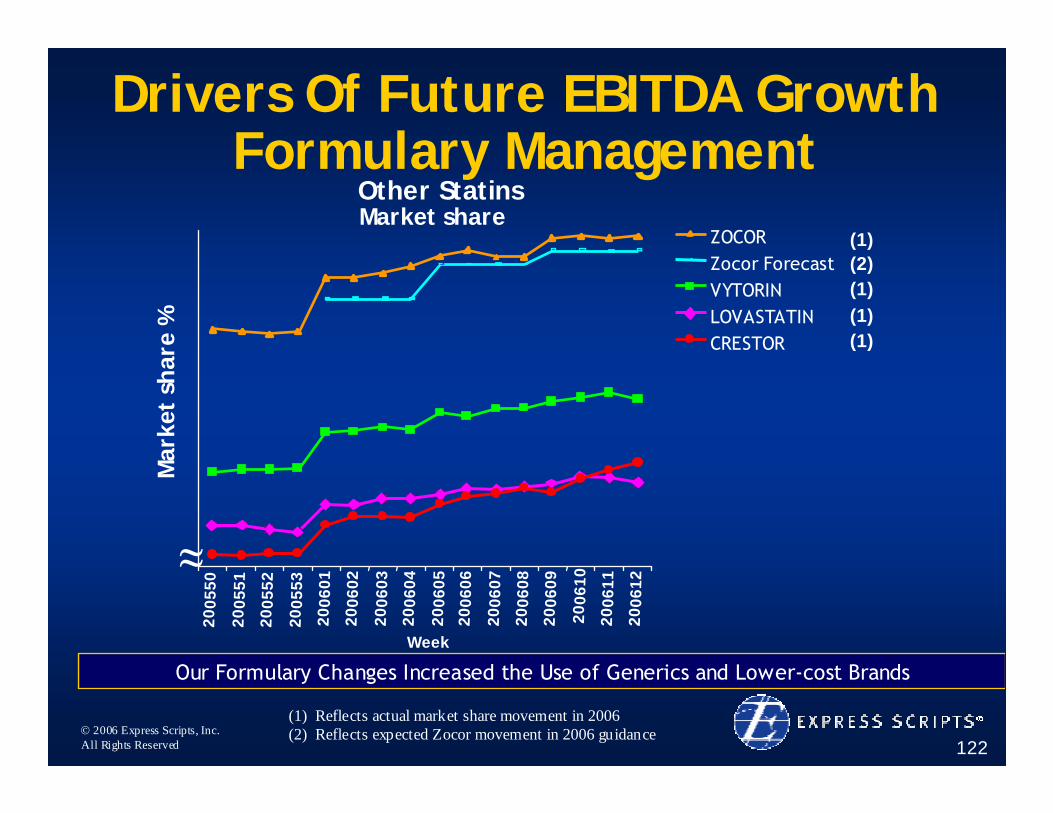
(1) Reflects actual market share movement in 2006(2) Reflects expected Zocor movement in 2006 guidance
Our Formulary Changes Increased the Use of Generics and Lower-cost Brands
Drivers Of Future EBITDA Growth Formulary Management
Other StatinsMarket share
Week
Mar
ket
shar
e %
2005
50
2005
51
2005
52
2005
53
2006
01
2006
02
2006
03
2006
04
2006
05
2006
06
2006
07
2006
08
2006
09
2006
10
2006
11
2006
12
ZOCORZocor ForecastVYTORINLOVASTATINCRESTOR
(1)(2)(1)(1)(1)
≈
© 2006 Express Scripts, Inc.All Rights Reserved 123
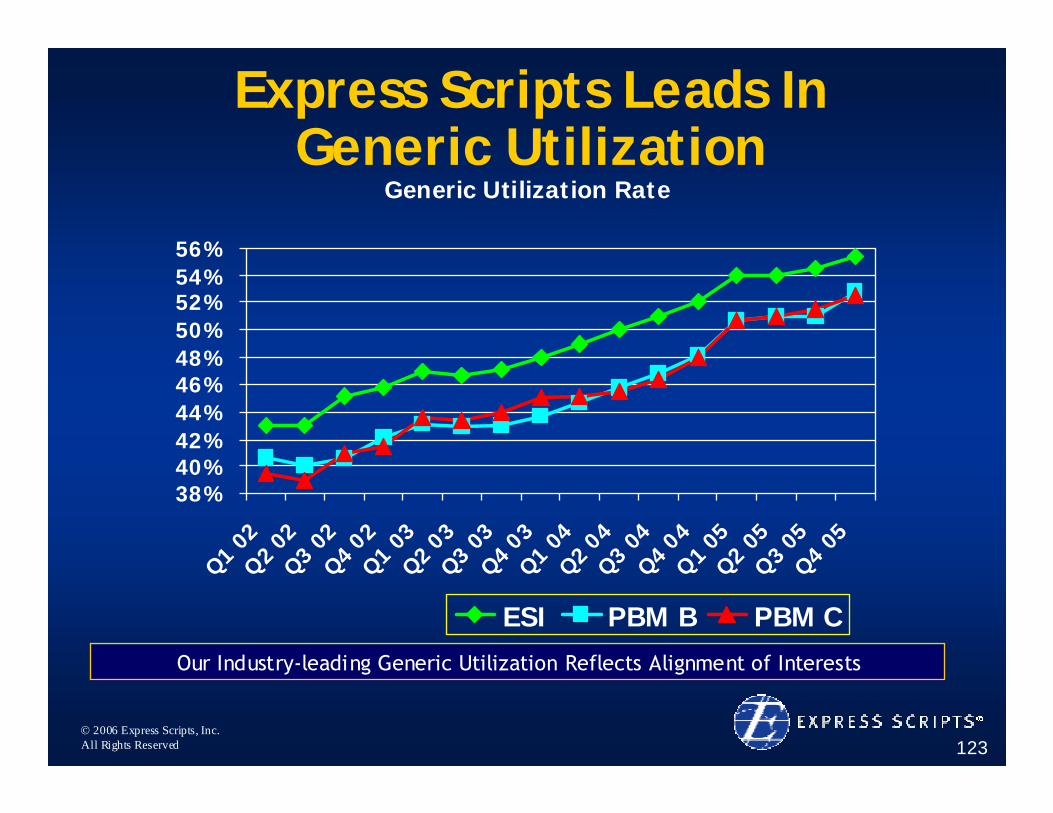
Express Scripts Leads In Generic Utilization
Generic Utilization Rate
38%40%42%44%46%48%50%52%54%56%
Q1 02
Q2 02
Q3 02Q4
02Q1 03Q2
03Q3 03Q4
03Q1 04Q2
04Q3 04Q4
04Q1
05Q2
05Q3
05Q4 05
ESI PBM B PBM COur Industry-leading Generic Utilization Reflects Alignment of Interests
© 2006 Express Scripts, Inc.All Rights Reserved 124
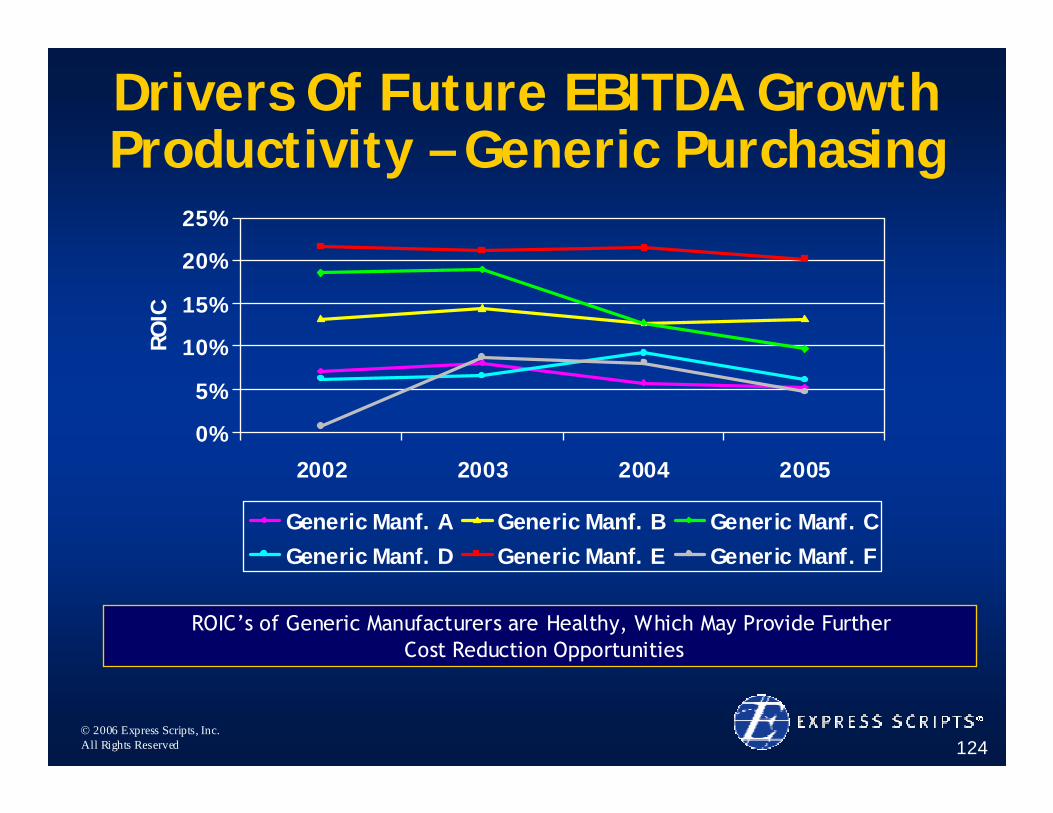
Drivers Of Future EBITDA Growth Productivity – Generic Purchasing
0%
5%
10%
15%
20%
25%
2002 2003 2004 2005
ROIC
Generic Manf. A Generic Manf. B Generic Manf. CGeneric Manf. D Generic Manf. E Generic Manf. F
ROIC’s of Generic Manufacturers are Healthy, Which May Provide FurtherCost Reduction Opportunities
© 2006 Express Scripts, Inc.All Rights Reserved 125
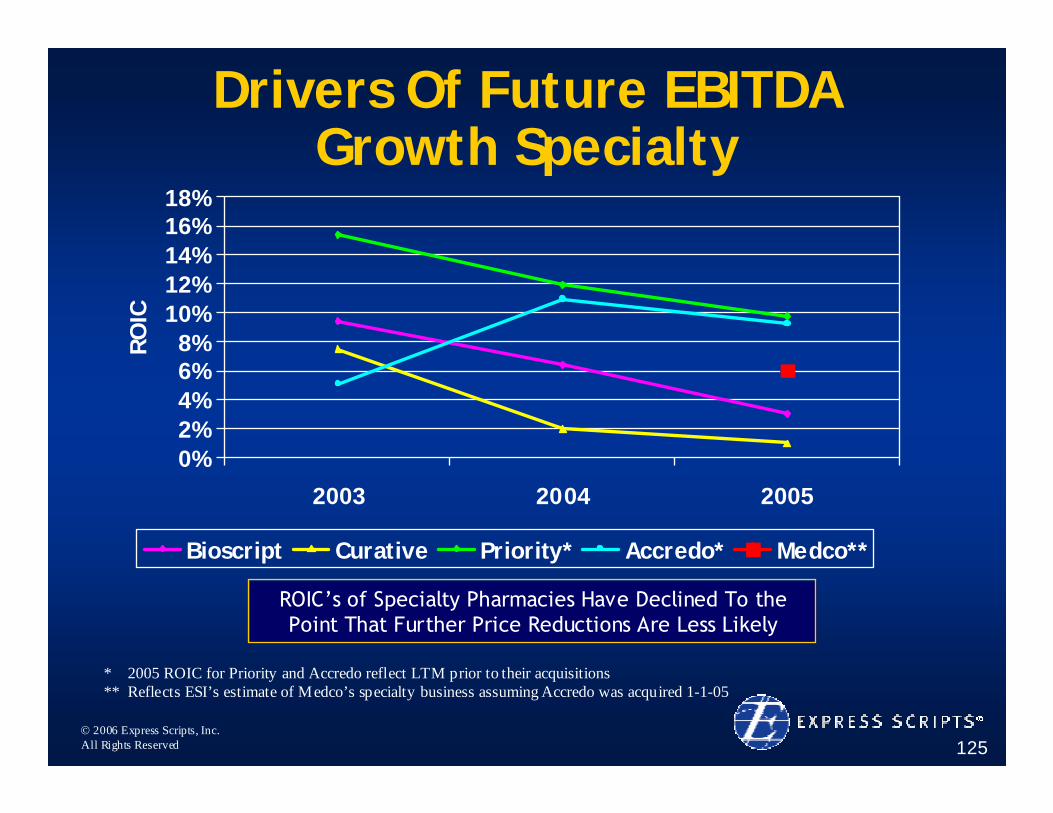
Drivers Of Future EBITDA Growth Specialty
0%2%4%6%8%
10%12%14%16%18%
2003 2004 2005
RO
IC
Bioscript Curative Priority* Accredo* Medco**
* 2005 ROIC for Priority and Accredo reflect LTM prior to their acquisitions** Reflects ESI’s estimate of Medco’s specialty business assuming Accredo was acquired 1-1-05
ROIC’s of Specialty Pharmacies Have Declined To the Point That Further Price Reductions Are Less Likely
© 2006 Express Scripts, Inc.All Rights Reserved 126
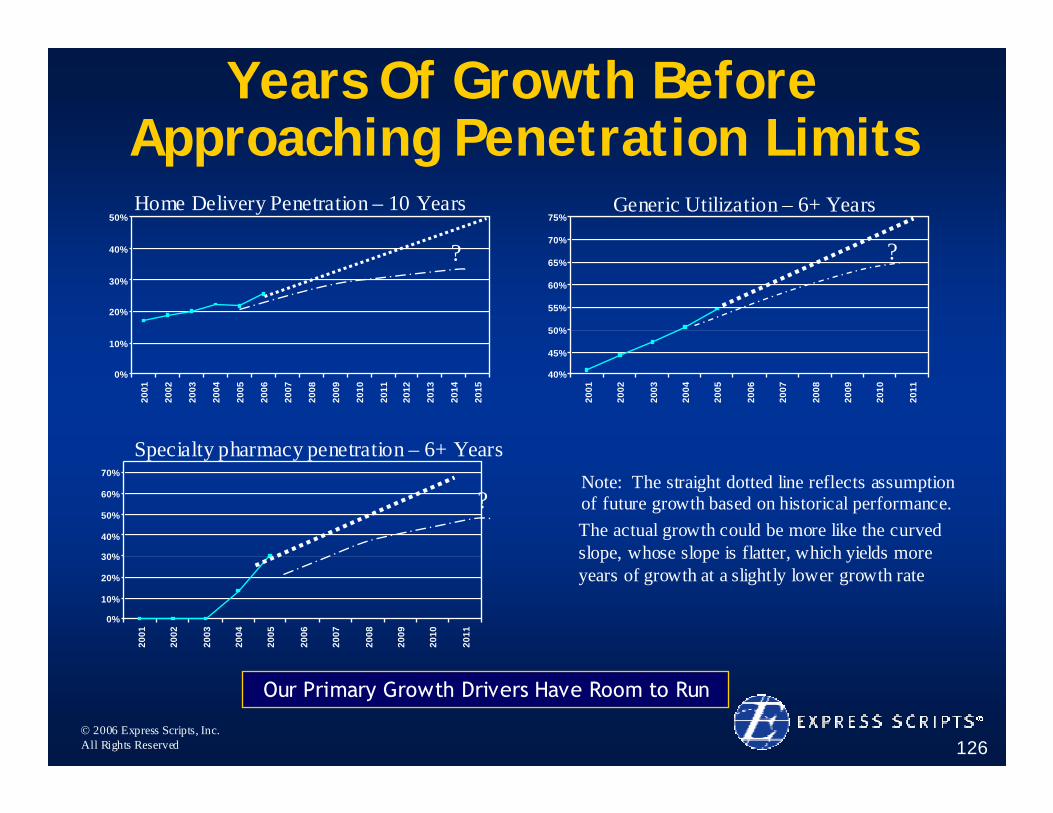
Years Of Growth Before Approaching Penetration Limits
0%
10%
20%
30%
40%
50%
2001
2002
2003
2004
2005
2006
2007
2008
2009
2010
2011
2012
2013
2014
2015
40%
45%
50%
55%
60%
65%
70%
75%
2001
2002
2003
2004
2005
2006
2007
2008
2009
2010
2011
Home Delivery Penetration – 10 Years Generic Utilization – 6+ Years
Specialty pharmacy penetration – 6+ Years
0%
10%
20%
30%
40%
50%
60%
70%
2001
2002
2003
2004
2005
2006
2007
2008
2009
2010
2011
? ?
?Note: The straight dotted line reflects assumption of future growth based on historical performance. The actual growth could be more like the curved slope, whose slope is flatter, which yields more years of growth at a slightly lower growth rate
Our Primary Growth Drivers Have Room to Run
© 2006 Express Scripts, Inc.All Rights Reserved 127
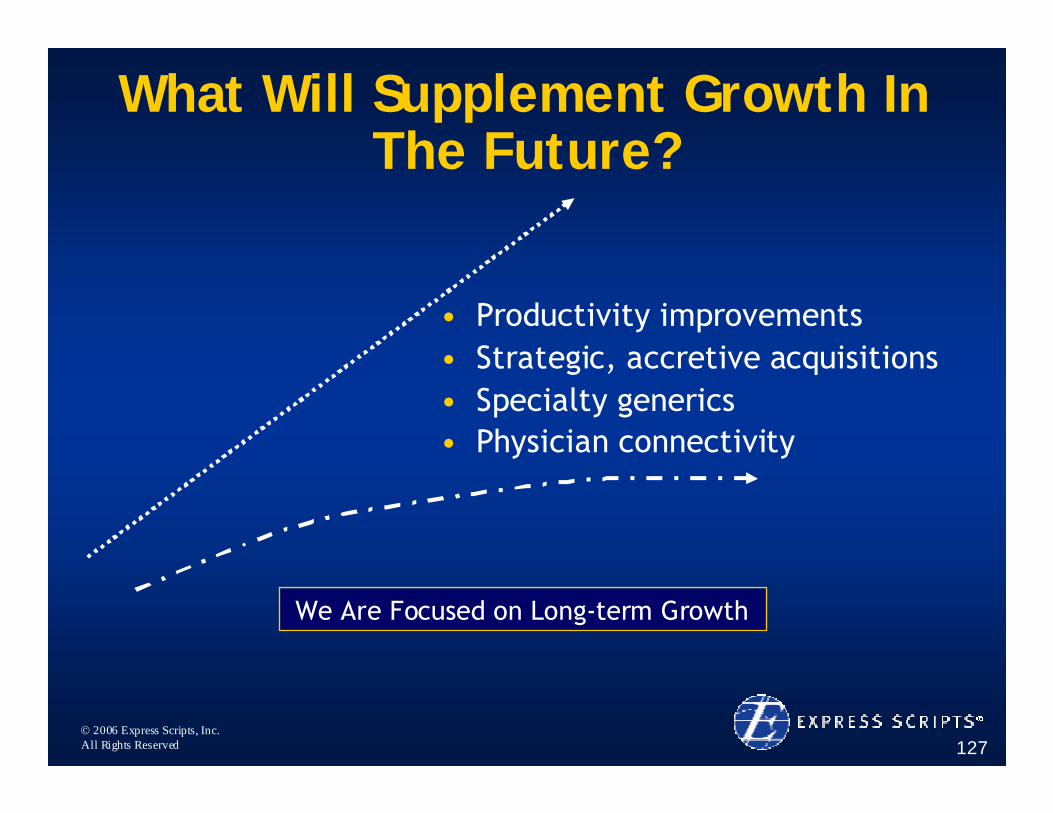
What Will Supplement Growth In The Future?
• Productivity improvements• Strategic, accretive acquisitions• Specialty generics• Physician connectivity
We Are Focused on Long-term Growth
© 2006 Express Scripts, Inc.All Rights Reserved 128
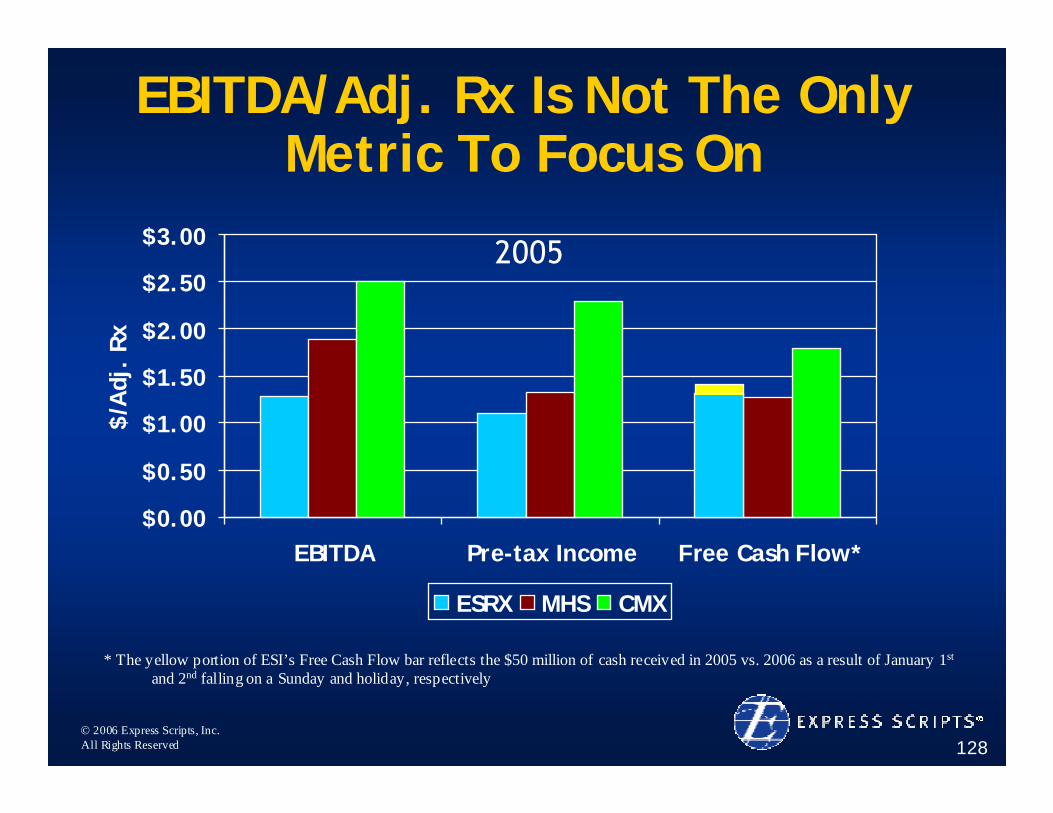
EBITDA/Adj. Rx Is Not The Only Metric To Focus On
$0.00
$0.50
$1.00
$1.50
$2.00
$2.50
$3.00
EBITDA Pre-tax Income Free Cash Flow*
$/A
dj.
Rx
ESRX MHS CMX
* The yellow portion of ESI’s Free Cash Flow bar reflects the $50 million of cash received in 2005 vs. 2006 as a result of January 1st
and 2nd falling on a Sunday and holiday, respectively
2005
© 2006 Express Scripts, Inc.All Rights Reserved 129
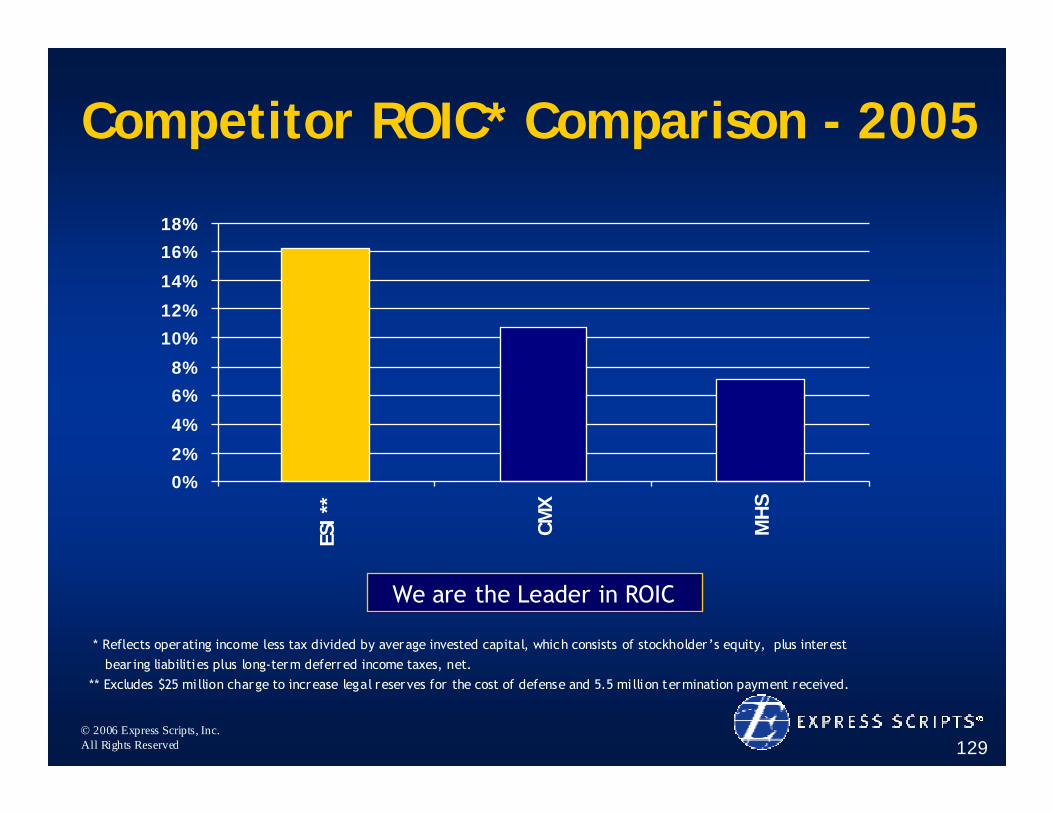
Competitor ROIC* Comparison - 2005
0%
2%
4%
6%
8%
10%
12%
14%
16%
18%
ESI *
*
CMX
MH
S
* Reflects operating income less tax divided by average invested capital, which consists of stockholder’s equity, plus interestbear ing liabilities plus long-term deferred income taxes, net.
** Excludes $25 mi llion charge to increase legal reserves for the cost of defense and 5.5 mi llion termination payment received.
We are the Leader in ROIC
© 2006 Express Scripts, Inc.All Rights Reserved 130
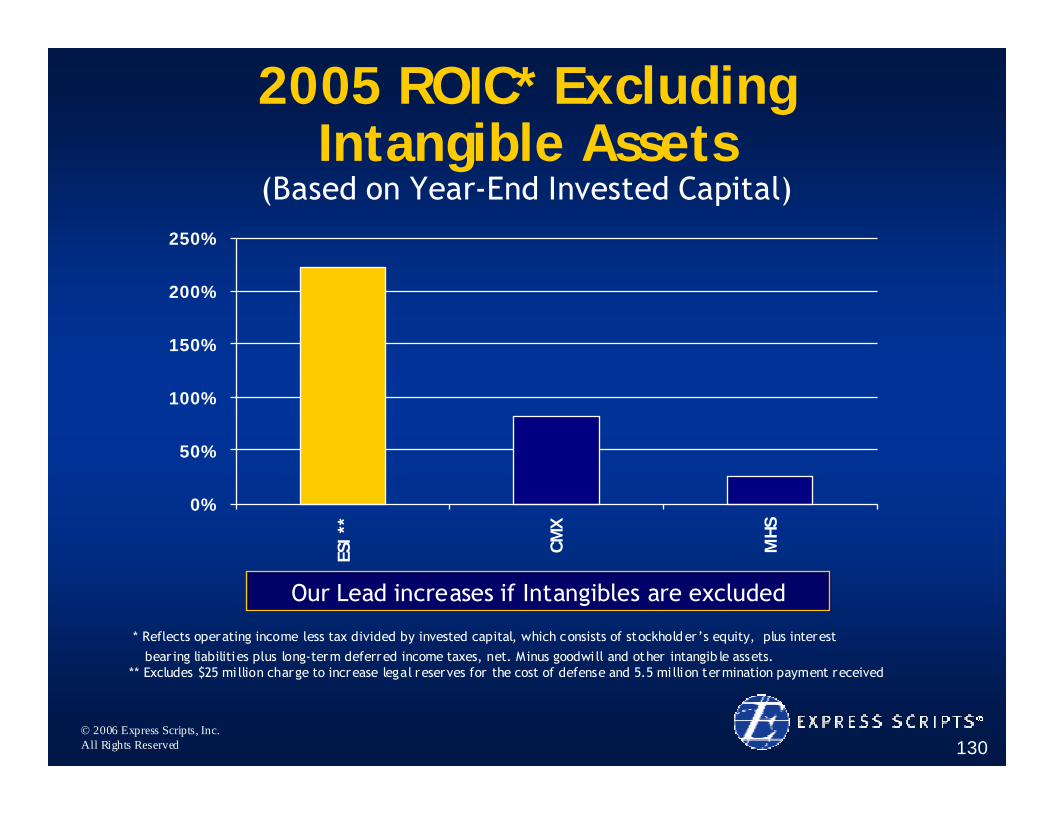
2005 ROIC* Excluding Intangible Assets
(Based on Year-End Invested Capital)
0%
50%
100%
150%
200%
250%
ESI *
*
CMX
MHS
* Reflects operating income less tax divided by invested capital, which consists of stockholder’s equity, plus interestbear ing liabilities plus long-term deferred income taxes, net. Minus goodwi ll and other intangib le assets.
** Excludes $25 mi llion charge to increase legal reserves for the cost of defense and 5.5 mi llion termination payment received
Our Lead increases if Intangibles are excluded
© 2006 Express Scripts, Inc.All Rights Reserved 131
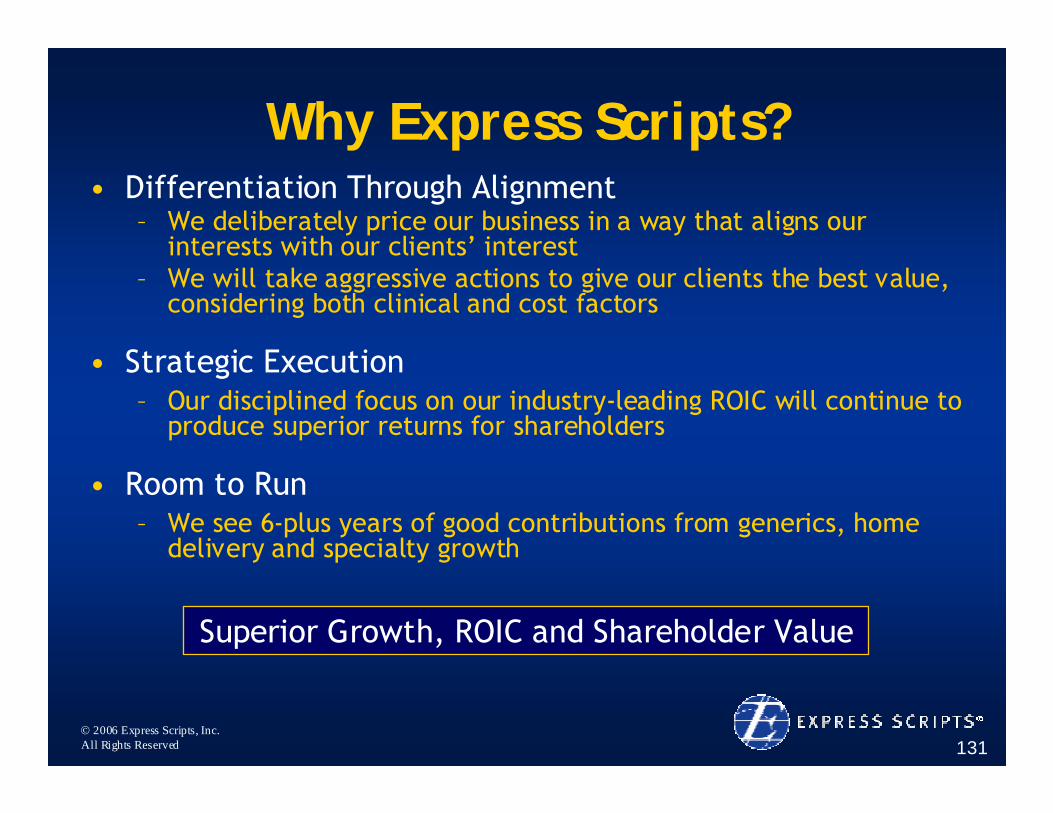
Why Express Scripts?• Differentiation Through Alignment
– We deliberately price our business in a way that aligns our interests with our clients’ interest
– We will take aggressive actions to give our clients the best value, considering both clinical and cost factors
• Strategic Execution– Our disciplined focus on our industry-leading ROIC will continue to
produce superior returns for shareholders
• Room to Run– We see 6-plus years of good contributions from generics, home
delivery and specialty growth
Superior Growth, ROIC and Shareholder Value
© 2006 Express Scripts, Inc.All Rights Reserved
George PazPresident and CEO
Express Scripts’ Value Proposition Positioning Us For the Future
© 2006 Express Scripts, Inc.All Rights Reserved 133
• Formulary and Trend Management• Generics, Home Delivery and Specialty• New Sales, Upsells and Retention• Innovative Product Development• Operational and Service Excellence• Strategic Deployment of Capital
Express Scripts is Well Positioned for the Future
© 2006 Express Scripts, Inc.All Rights Reserved 134
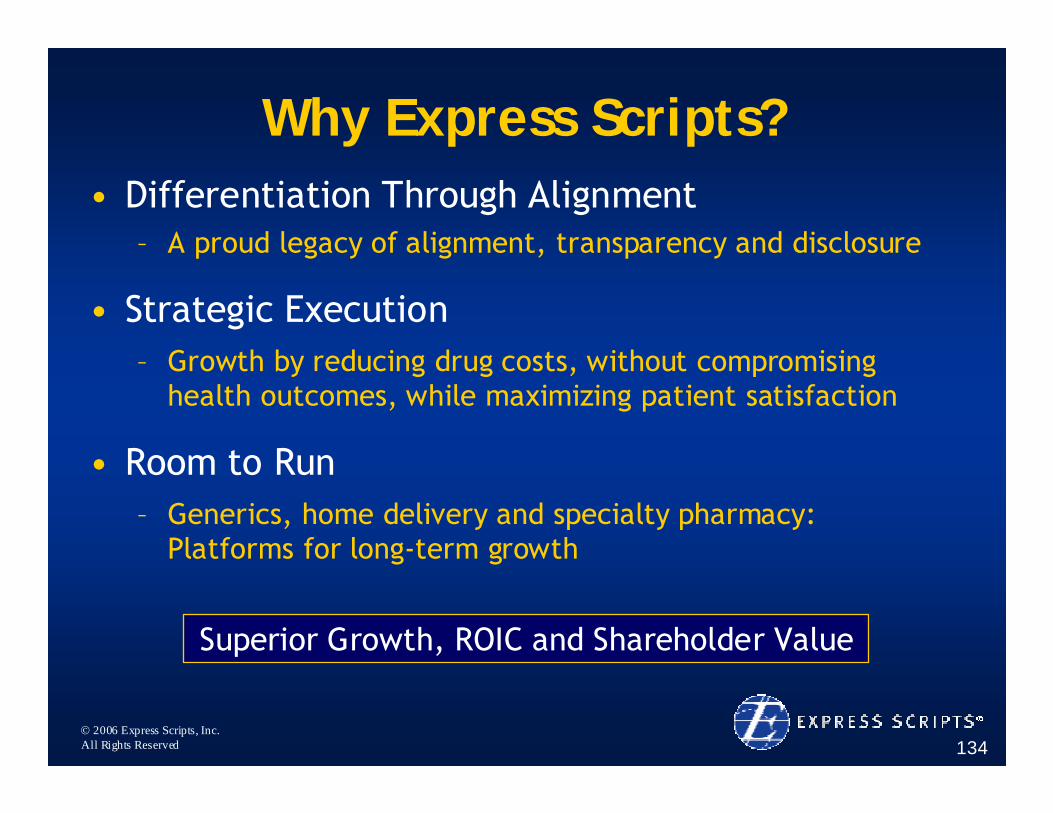
Why Express Scripts?• Differentiation Through Alignment
– A proud legacy of alignment, transparency and disclosure
• Strategic Execution– Growth by reducing drug costs, without compromising
health outcomes, while maximizing patient satisfaction
• Room to Run– Generics, home delivery and specialty pharmacy:
Platforms for long-term growth
Superior Growth, ROIC and Shareholder Value

© 2006 Express Scripts, Inc.All Rights Reserved
Our Pathways to Patients: Alignment in Action