investors presentation - accueil |...
TRANSCRIPT
ALIMENTATION COUCHE-TARD INC.
INVESTORSPRESENTATION
November 2017
This presentation and the accompanying oral presentation contain forward-looking statements within the meaning of applicable securities legislation.Forward-looking statements are typically identified by words such as “projected”, “estimate”, “may”, “anticipate”, “believe”, “expect”, “plan”, “intend”or similar words suggesting future outcomes or statements regarding an outlook. All statements other than statements of historical fact contained inthese slides are forward-looking statements.
Forward-looking statements involve numerous assumptions, risks and uncertainties. A variety of factors, many of which are beyond AlimentationCouche-Tard Inc.’s (“Couche-Tard”) control, may cause actual results to differ materially from the expectations expressed in its forward-lookingstatements. These factors include, but are not limited to, the effects of the integration of acquired businesses and the ability to achieve projectedsynergies, fluctuations in margins on motor fuel sales, competition in the convenience store and retail motor fuel industries, foreign exchange ratefluctuations, and such other risks as described in detail from time to time in documents filed by Couche-Tard with securities regulatory authorities inCanada, including those risks described in Couche-Tard’s management’s discussion and analysis (MD&A) for the year ended April 30, 2017.Couche-Tard’s MD&A and other publicly filed documents are available on SEDAR at www.sedar.com.
Unless otherwise required by law, Couche-Tard does not undertake to update any forward-looking statement, whether written or oral, that may bemade from time to time by it or on its behalf. No financial information presented in this presentation as of a date more recent than April 30, 2017 hasbeen audited.
While the information contained in this presentation is believed to be accurate, Couche-Tard expressly disclaims any and all liability for any losses,claims or damages of whatsoever kind based upon the information contained in, or omissions from, this presentation or any oral communicationtransmitted in connection therewith. In addition, none of the statements contained in this presentation are intended to be, nor shall be deemed to be,representations or warranties of Couche-Tard and its affiliates. Where the information is from third-party sources, the information is from sourcesbelieved to be reliable, but Couche-Tard has not independently verified any of such information contained herein.
This presentation is not, and under no circumstances is to be construed as, a prospectus, an offering memorandum, an advertisement or a publicoffering of securities. Under no circumstances should the information contained herein be considered an offer to sell or a solicitation of an offer tobuy any securities.
2
FORWARD-LOOKING INFORMATION AND CAUTIONARY LANGUAGE
1. Company Highlights2. Ambitions & Strategy3. Value Creation & Financial Review4. Recent acquisitions summary
AGENDA
3
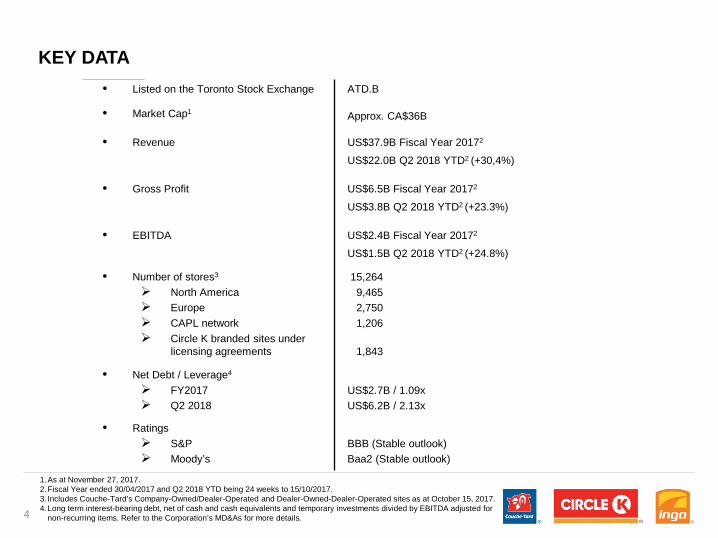
1.As at November 27, 2017.2.Fiscal Year ended 30/04/2017 and Q2 2018 YTD being 24 weeks to 15/10/2017.3. Includes Couche-Tard’s Company-Owned/Dealer-Operated and Dealer-Owned-Dealer-Operated sites as at October 15, 2017.4.Long term interest-bearing debt, net of cash and cash equivalents and temporary investments divided by EBITDA adjusted for
non-recurring items. Refer to the Corporation’s MD&As for more details.
• Listed on the Toronto Stock Exchange ATD.B
• Market Cap1 Approx. CA$36B
• Revenue US$37.9B Fiscal Year 20172
US$22.0B Q2 2018 YTD2 (+30,4%)
• Gross Profit US$6.5B Fiscal Year 20172
US$3.8B Q2 2018 YTD2 (+23.3%)
• EBITDA US$2.4B Fiscal Year 20172
US$1.5B Q2 2018 YTD2 (+24.8%)
• Number of stores3
North America Europe CAPL network Circle K branded sites under
licensing agreements
15,2649,4652,7501,206
1,843
• Net Debt / Leverage4
FY2017 Q2 2018
US$2.7B / 1.09xUS$6.2B / 2.13x
• Ratings S&P Moody’s
BBB (Stable outlook)Baa2 (Stable outlook)
KEY DATA
4
ALIMENTATION COUCHE-TARD INC.
COMPANY HIGHLIGHTS
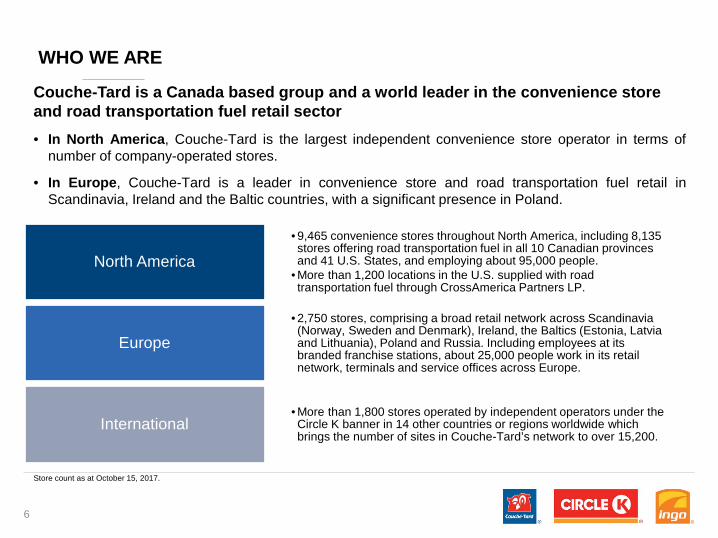
Couche-Tard is a Canada based group and a world leader in the convenience store and road transportation fuel retail sector• In North America, Couche-Tard is the largest independent convenience store operator in terms of
number of company-operated stores.
• In Europe, Couche-Tard is a leader in convenience store and road transportation fuel retail inScandinavia, Ireland and the Baltic countries, with a significant presence in Poland.
WHO WE ARE
Store count as at October 15, 2017.
• 9,465 convenience stores throughout North America, including 8,135 stores offering road transportation fuel in all 10 Canadian provinces and 41 U.S. States, and employing about 95,000 people.
• More than 1,200 locations in the U.S. supplied with road transportation fuel through CrossAmerica Partners LP.
North America
• 2,750 stores, comprising a broad retail network across Scandinavia (Norway, Sweden and Denmark), Ireland, the Baltics (Estonia, Latvia and Lithuania), Poland and Russia. Including employees at its branded franchise stations, about 25,000 people work in its retail network, terminals and service offices across Europe.
Europe
• More than 1,800 stores operated by independent operators under the Circle K banner in 14 other countries or regions worldwide which brings the number of sites in Couche-Tard’s network to over 15,200.
International
6
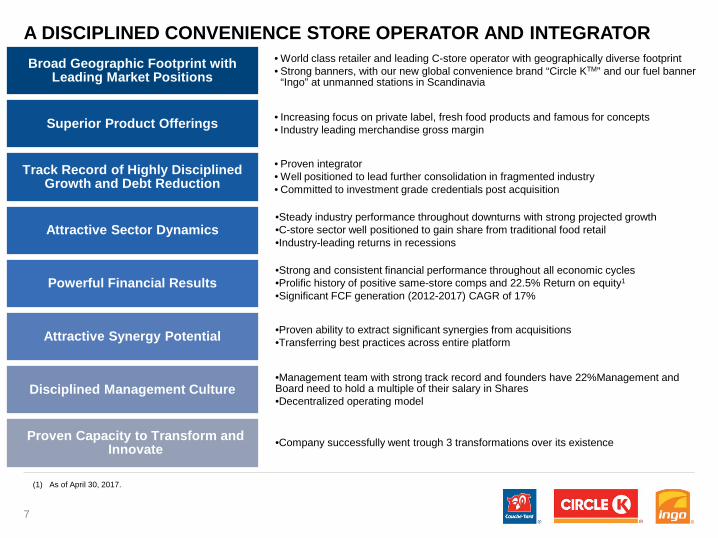
A DISCIPLINED CONVENIENCE STORE OPERATOR AND INTEGRATOR• World class retailer and leading C-store operator with geographically diverse footprint• Strong banners, with our new global convenience brand “Circle KTM” and our fuel banner
“Ingo” at unmanned stations in ScandinaviaBroad Geographic Footprint with
Leading Market Positions
• Increasing focus on private label, fresh food products and famous for concepts• Industry leading merchandise gross marginSuperior Product Offerings
• Proven integrator• Well positioned to lead further consolidation in fragmented industry• Committed to investment grade credentials post acquisition
Track Record of Highly Disciplined Growth and Debt Reduction
•Steady industry performance throughout downturns with strong projected growth•C-store sector well positioned to gain share from traditional food retail•Industry-leading returns in recessions
Attractive Sector Dynamics
•Strong and consistent financial performance throughout all economic cycles•Prolific history of positive same-store comps and 22.5% Return on equity1
•Significant FCF generation (2012-2017) CAGR of 17%Powerful Financial Results
•Proven ability to extract significant synergies from acquisitions•Transferring best practices across entire platformAttractive Synergy Potential
•Management team with strong track record and founders have 22%Management and Board need to hold a multiple of their salary in Shares•Decentralized operating model
Disciplined Management Culture
•Company successfully went trough 3 transformations over its existenceProven Capacity to Transform and Innovate
7
(1) As of April 30, 2017.
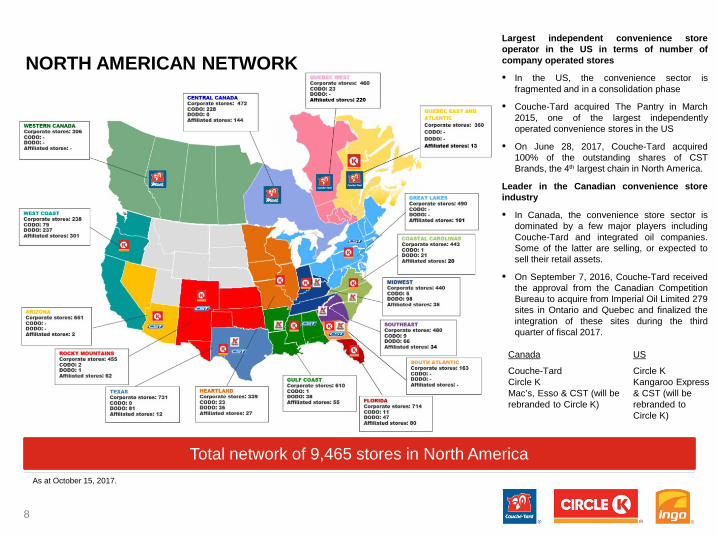
Total network of 9,465 stores in North America
Largest independent convenience storeoperator in the US in terms of number ofcompany operated stores
• In the US, the convenience sector isfragmented and in a consolidation phase
• Couche-Tard acquired The Pantry in March2015, one of the largest independentlyoperated convenience stores in the US
• On June 28, 2017, Couche-Tard acquired100% of the outstanding shares of CSTBrands, the 4th largest chain in North America.
Leader in the Canadian convenience storeindustry
• In Canada, the convenience store sector isdominated by a few major players includingCouche-Tard and integrated oil companies.Some of the latter are selling, or expected tosell their retail assets.
• On September 7, 2016, Couche-Tard receivedthe approval from the Canadian CompetitionBureau to acquire from Imperial Oil Limited 279sites in Ontario and Quebec and finalized theintegration of these sites during the thirdquarter of fiscal 2017.
As at October 15, 2017.
NORTH AMERICAN NETWORK
Canada US
Couche-Tard Circle KCircle KMac’s, Esso & CST (will be rebranded to Circle K)
Kangaroo Express & CST (will be rebranded to Circle K)
8
Leader in convenience store and road transportationfuel retail in the Scandinavian and Baltic countries andIreland
• The European convenience store sector is oftendominated by a few major players, includingintegrated oil companies. Some of these are in theprocess of selling, or are expected to sell their retailassets
• Key brands:
Circle K Being rebranded from StatoilIngo Unmanned Scandinavian stationsTopaz Will be rebranded to Circle K
As at October 15, 2017.
2,750 stores in 9 countries or regions in Europe
EUROPEAN NETWORK
9
United Arab Emirates
32
Malaysia10
Costa Rica8
Mexico558
Central / South America
Honduras
25
Egypt
8
Vietnam257
Indonesia465
Philippines22
Hong Kong332
China80
Macau31 Guam
13
Asia
INTERNATIONAL PRESENCE
As at October 15, 2017.
More than 1,800 licensed Circle K stores in Asia, Costa Rica, Egypt, Honduras, Mexico and U.A.E
• Convenience stores operated by independent operators under the Circle K brand
• License agreement to use the brand nameCircle K
10
Saudi Arabia
2
CONSOLIDATED NETWORK RECAP
Canada U.S. Europe Total
COCO(1) 1,598 5,754 1,975 9,327
CODO(2) 251 131 355 737
DODO(3) - 625 420 1,045
Franchise/Affiliated(4) 377 729 - 1,106
Number of sites, end of period 2,226 7,239 2,750 12,215
CAPL network - - - 1,206
Circle K branded sites under licensing agreements (5) - - - 1,843
Total network 15,264
Of which: Automats - - 978 978
# With fuel 1,197 6,938 2,748 10,883
% With fuel 54% 96% 99.9% 71%
(1) Sites for which the real estate is controlled by Couche-Tard (through ownership or lease agreements) and for which the stores (and/or the service stations) are operated by Couche-Tard or one of its commission agents.
(2) Sites for which the real estate is controlled by Couche-Tard (through ownership or lease agreements) and for which the stores (and/or the service stations) are operated by an independent operator in exchange for rent and to which Couche-Tard sometimes provides road transportation fuel through supply contracts. Some of these sites are subject to a franchise agreement, licensing or other similar agreement under one of our main or secondary banners.
(3) Sites controlled and operated by independent operators to which Couche-Tard supplies road transportation fuel through supply contracts. Some of these sites are subject to a franchise agreement, licensing or other similar agreement under one of our main or secondary banners.
(4) Stores operated by an independent operator through a franchising, licensing or another similar agreement under one of our main or secondary banners.(5) Stores operated by independent operators under the Circle K banner in other countries or regions worldwide.
As at October 15, 2017.
11
US72%
Canada17%
Europe11%
GROSS PROFITS
REVENUES
COUCHE-TARD IS A WORLD LEADER
12
US62%
Canada14%
Europe24%
US1%
Canada2%
Europe97%
US69%
Canada17%
Europe14%
US55%Canada
12%
Europe33%
US7% Canada
12%
Europe81%
Merchandises and services Motor Fuel Other
$11,531M $29,830M $1,154M
Merchandises and services Motor Fuel Other
$3,973M $2,960M $222M
Total
$42,514M
Total
$7,154M
Couche-Tard is a leading global convenience store operator with EBITDA of $2.7 billion• Well diversified across geographies• Focus on growing high margin categories
Financial data presented for the LTM as of Q2 2018.
Revenues By
ProductsLTM Q2
2018
Gross Profit By Products LTM Q2
2018
Merchandise and services
27%
Motor fuel70%
Other3%
Merchandise and services
56%
Motor fuel41%
Other3%
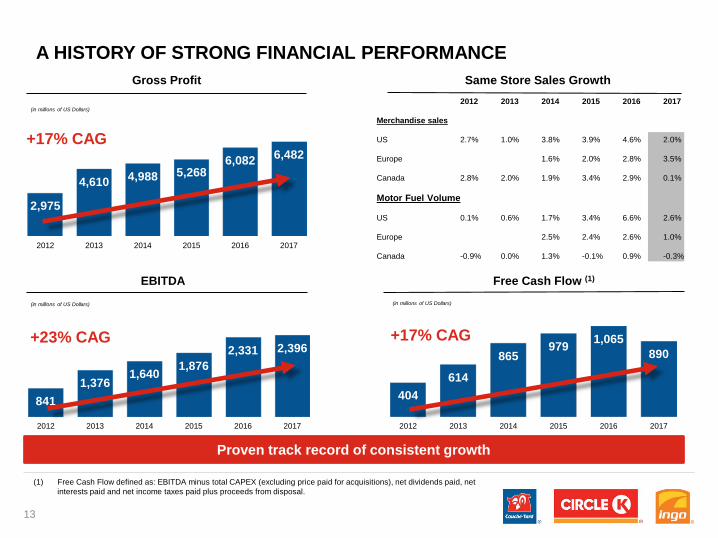
2012 2013 2014 2015 2016 2017
Merchandise sales
US 2.7% 1.0% 3.8% 3.9% 4.6% 2.0%
Europe 1.6% 2.0% 2.8% 3.5%
Canada 2.8% 2.0% 1.9% 3.4% 2.9% 0.1%
Motor Fuel Volume
US 0.1% 0.6% 1.7% 3.4% 6.6% 2.6%
Europe 2.5% 2.4% 2.6% 1.0%
Canada -0.9% 0.0% 1.3% -0.1% 0.9% -0.3%
8411,376
1,640 1,8762,331 2,396
2012 2013 2014 2015 2016 2017
404614
865979 1,065
890
2012 2013 2014 2015 2016 2017
2,975
4,610 4,988 5,2686,082 6,482
2012 2013 2014 2015 2016 2017
A HISTORY OF STRONG FINANCIAL PERFORMANCE
(in millions of US Dollars) (in millions of US Dollars)
(1) Free Cash Flow defined as: EBITDA minus total CAPEX (excluding price paid for acquisitions), net dividends paid, net interests paid and net income taxes paid plus proceeds from disposal.
Gross Profit
(in millions of US Dollars)
Proven track record of consistent growth
Same Store Sales Growth
EBITDA Free Cash Flow (1)
+23% CAG +17% CAG
13
+17% CAG
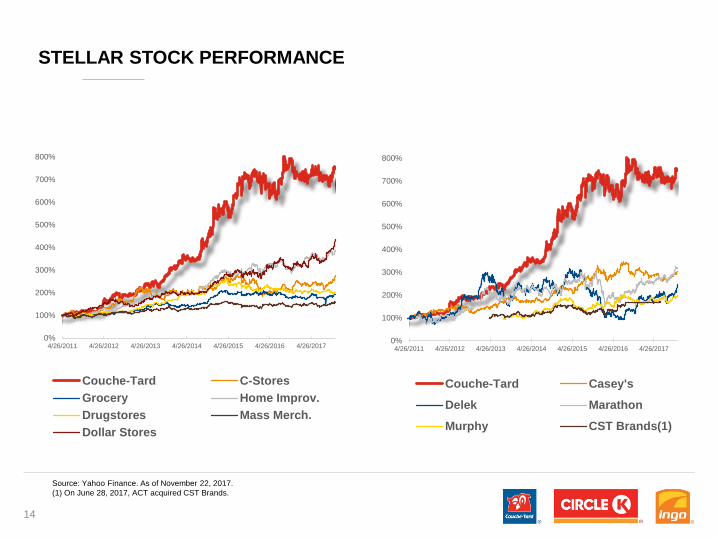
STELLAR STOCK PERFORMANCE
Source: Yahoo Finance. As of November 22, 2017.(1) On June 28, 2017, ACT acquired CST Brands.
14
0%
100%
200%
300%
400%
500%
600%
700%
800%
4/26/2011 4/26/2012 4/26/2013 4/26/2014 4/26/2015 4/26/2016 4/26/2017
Couche-Tard C-StoresGrocery Home Improv.Drugstores Mass Merch.Dollar Stores
0%
100%
200%
300%
400%
500%
600%
700%
800%
4/26/2011 4/26/2012 4/26/2013 4/26/2014 4/26/2015 4/26/2016 4/26/2017
Couche-Tard Casey'sDelek MarathonMurphy CST Brands(1)
ALIMENTATION COUCHE-TARD INC.
AMBITIONS & STRATEGY
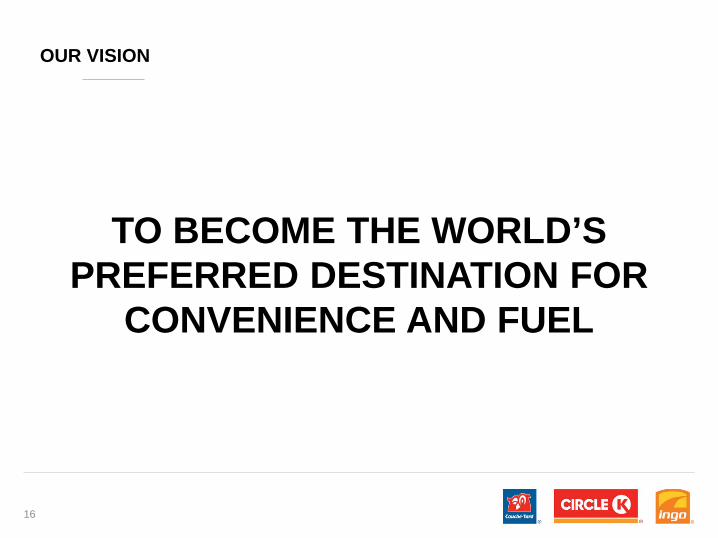
TO BECOME THE WORLD’S PREFERRED DESTINATION FOR
CONVENIENCE AND FUEL
16
OUR VISION
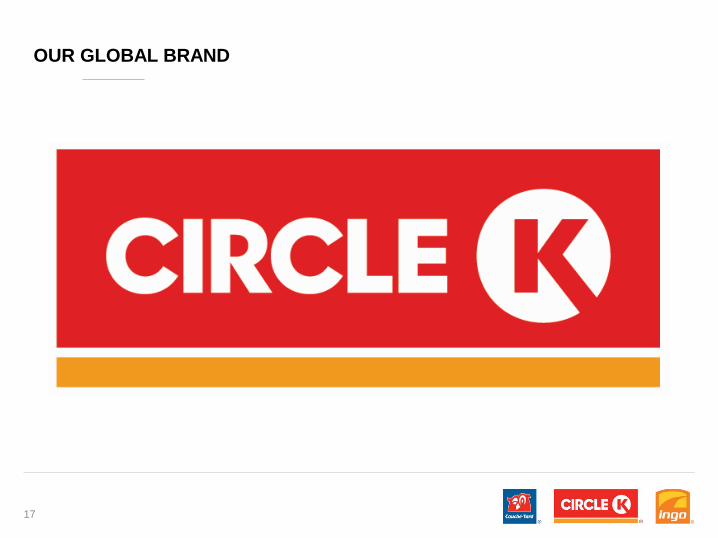
OUR GLOBAL BRAND
17
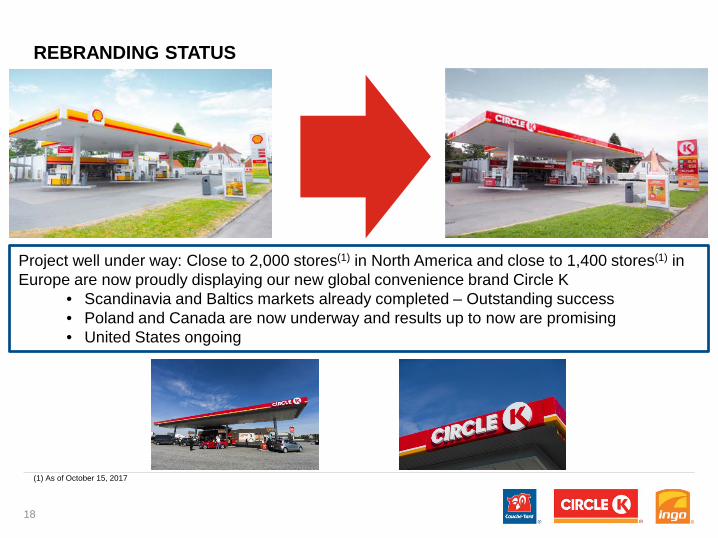
REBRANDING STATUS
Project well under way: Close to 2,000 stores(1) in North America and close to 1,400 stores(1) in Europe are now proudly displaying our new global convenience brand Circle K
• Scandinavia and Baltics markets already completed – Outstanding success• Poland and Canada are now underway and results up to now are promising• United States ongoing
18
(1) As of October 15, 2017
THE PROMISE BEHIND THE BRAND
19
SUPER GLOBALSUPER LOCAL
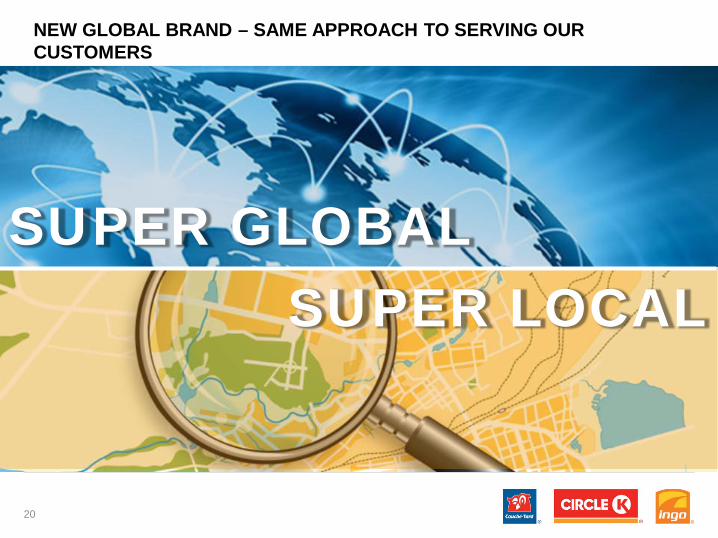
NEW GLOBAL BRAND – SAME APPROACH TO SERVING OUR CUSTOMERS
20
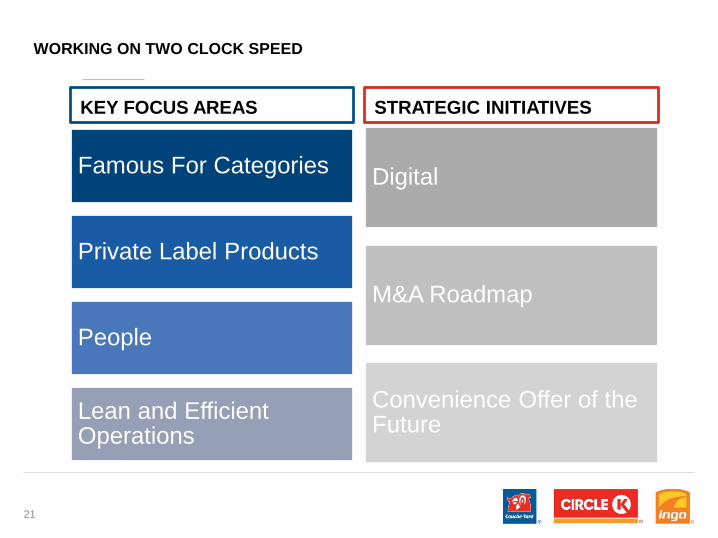
WORKING ON TWO CLOCK SPEED
KEY FOCUS AREAS
Famous For Categories
Private Label Products
People
Lean and Efficient Operations
STRATEGIC INITIATIVES
Digital
M&A Roadmap
Convenience Offer of the Future
21
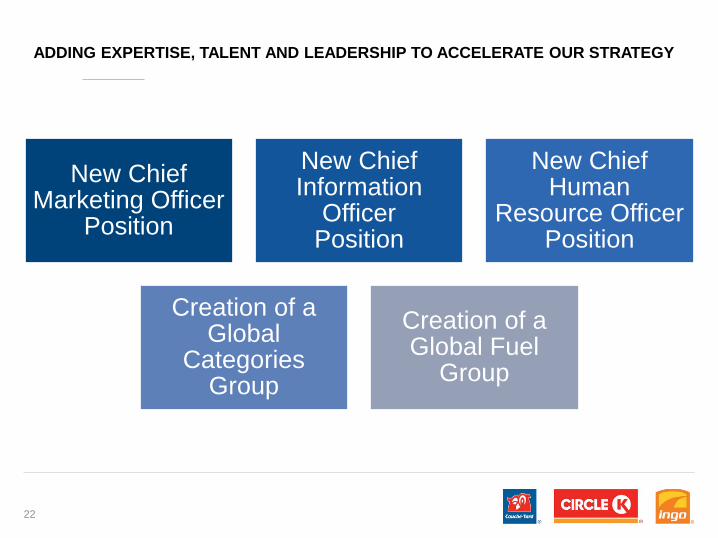
ADDING EXPERTISE, TALENT AND LEADERSHIP TO ACCELERATE OUR STRATEGY
New Chief Marketing Officer
Position
New Chief Information
OfficerPosition
New Chief Human
Resource OfficerPosition
Creation of a Global
CategoriesGroup
Creation of a Global Fuel
Group
22
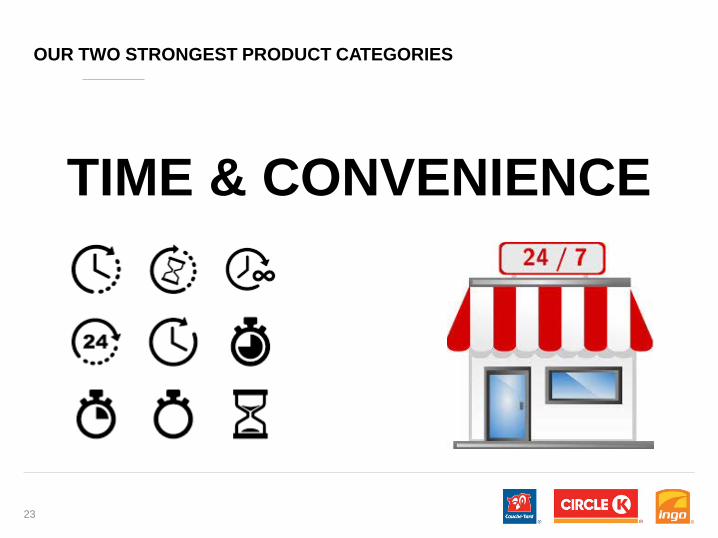
OUR TWO STRONGEST PRODUCT CATEGORIES
23
TIME & CONVENIENCE
TIME & CONVENIENCE
Shoppers recognize the c-store channel of trade for its convenient locations, extended hours of operations, one-stop shopping, grab-and-go foodservice, variety of merchandise and fast transactions
Industry offers speed of service to time-starved consumers who want to get in and out of the store quickly
Addresses consumer desires to satisfy and immediate need for food, refreshment and fuel
83% of the in-store merchandise that convenience stores sell is consumed within one hour of purchase, and 65% is immediately consumed
24
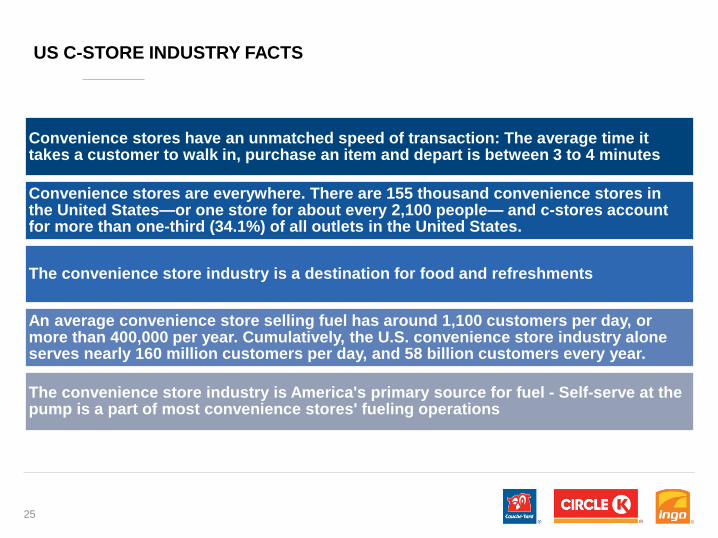
US C-STORE INDUSTRY FACTS
Convenience stores have an unmatched speed of transaction: The average time it takes a customer to walk in, purchase an item and depart is between 3 to 4 minutes
Convenience stores are everywhere. There are 155 thousand convenience stores in the United States—or one store for about every 2,100 people— and c-stores account for more than one-third (34.1%) of all outlets in the United States.
The convenience store industry is a destination for food and refreshments
An average convenience store selling fuel has around 1,100 customers per day, or more than 400,000 per year. Cumulatively, the U.S. convenience store industry alone serves nearly 160 million customers per day, and 58 billion customers every year.
The convenience store industry is America's primary source for fuel - Self-serve at the pump is a part of most convenience stores' fueling operations
25
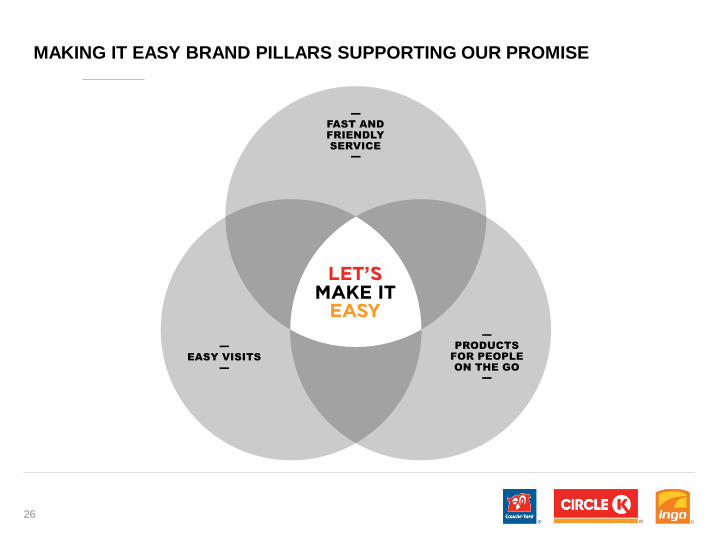
MAKING IT EASY BRAND PILLARS SUPPORTING OUR PROMISE
26
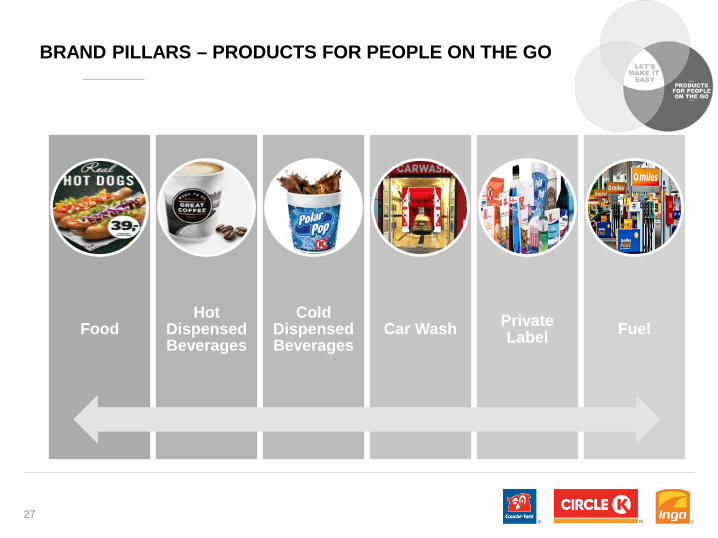
BRAND PILLARS – PRODUCTS FOR PEOPLE ON THE GO
FoodHot
DispensedBeverages
Cold DispensedBeverages
Car Wash PrivateLabel Fuel
27
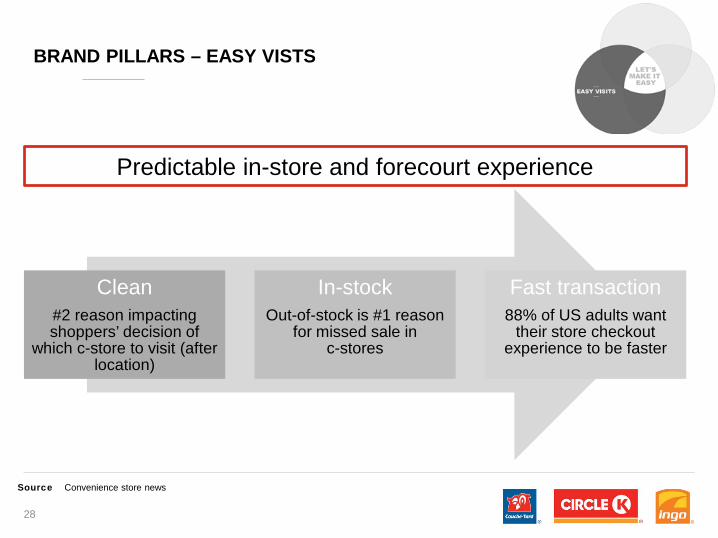
Clean#2 reason impacting shoppers’ decision of
which c-store to visit (after location)
In-stockOut-of-stock is #1 reason
for missed sale in c-stores
Fast transaction88% of US adults want
their store checkout experience to be faster
Predictable in-store and forecourt experience
Source Convenience store news
28
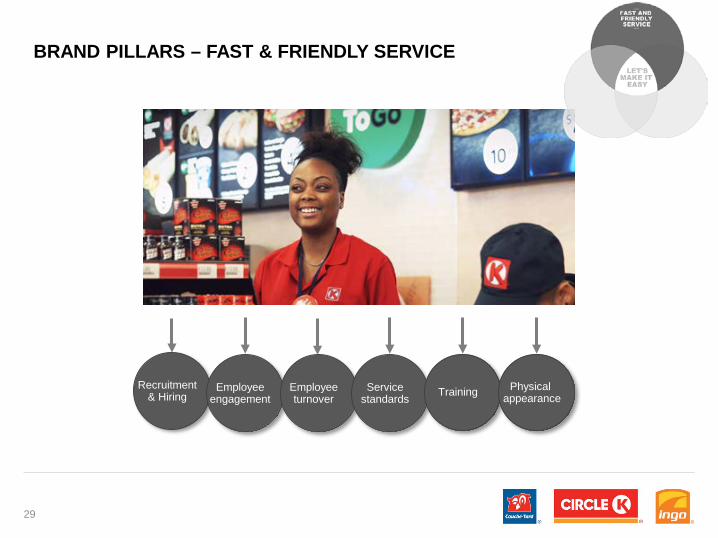
BRAND PILLARS – EASY VISTS
Recruitment& Hiring
Employeeengagement
Employeeturnover
Servicestandards Training Physical
appearance
BRAND PILLARS – FAST & FRIENDLY SERVICE
29
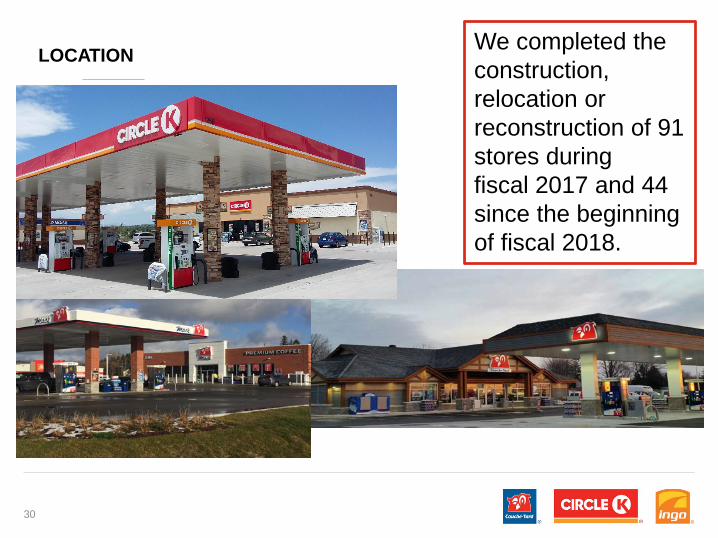
LOCATION We completed the construction, relocation or reconstruction of 91 stores duringfiscal 2017 and 44 since the beginningof fiscal 2018.
30
STRATEGIC INIATIVES - PREPARING FOR THE ROAD AHEAD
31

DIGITAL TRANSFORMATION
32
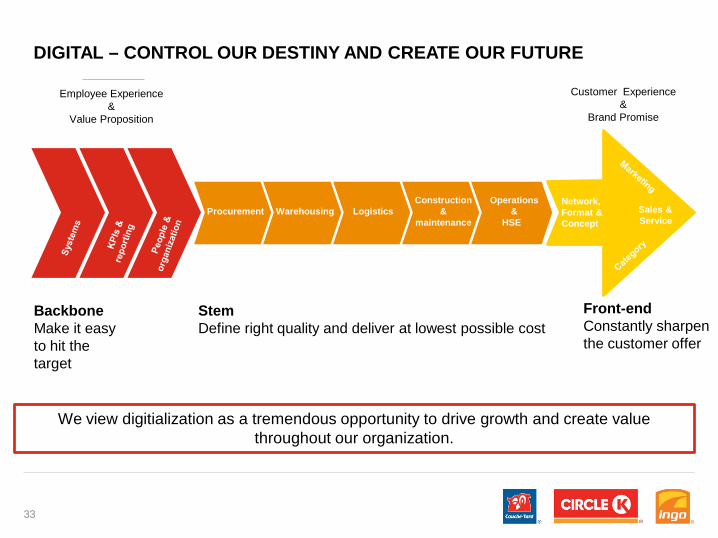
DIGITAL – CONTROL OUR DESTINY AND CREATE OUR FUTURE
33
Fuel
Convenience
Procurement Warehousing LogisticsConstruction
&maintenance
Operations &
HSE
Network,Format &Concept
Sales & Service
StemDefine right quality and deliver at lowest possible cost
BackboneMake it easy to hit the target
Front-endConstantly sharpen the customer offer
We view digitialization as a tremendous opportunity to drive growth and create value throughout our organization.
Employee Experience&
Value Proposition
Customer Experience &
Brand Promise
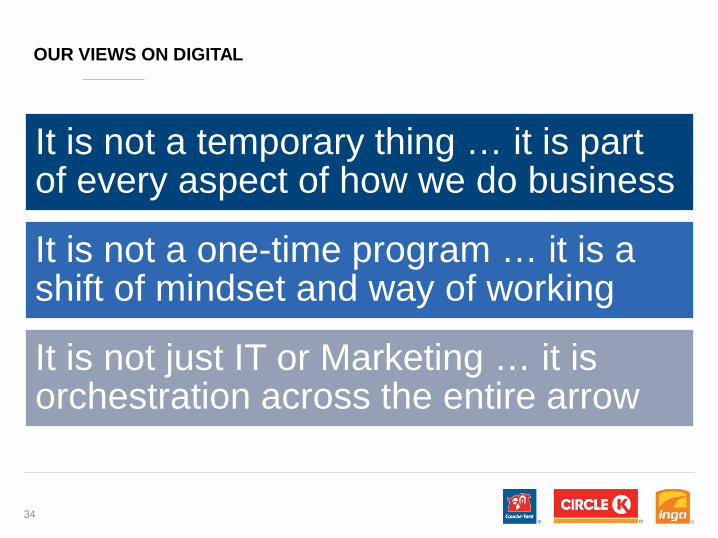
OUR VIEWS ON DIGITAL
34
It is not a temporary thing … it is part of every aspect of how we do business
It is not a one-time program … it is a shift of mindset and way of working
It is not just IT or Marketing … it is orchestration across the entire arrow
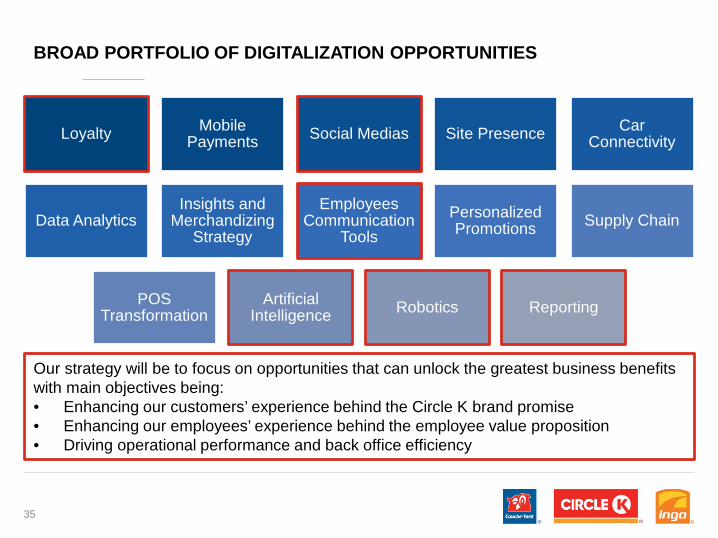
BROAD PORTFOLIO OF DIGITALIZATION OPPORTUNITIES
35
Loyalty Mobile Payments Social Medias Site Presence Car
Connectivity
Data AnalyticsInsights and
Merchandizing Strategy
Employees Communication
ToolsPersonalized Promotions Supply Chain
POS Transformation
Artificial Intelligence Robotics Reporting
Our strategy will be to focus on opportunities that can unlock the greatest business benefits with main objectives being:• Enhancing our customers’ experience behind the Circle K brand promise• Enhancing our employees’ experience behind the employee value proposition• Driving operational performance and back office efficiency
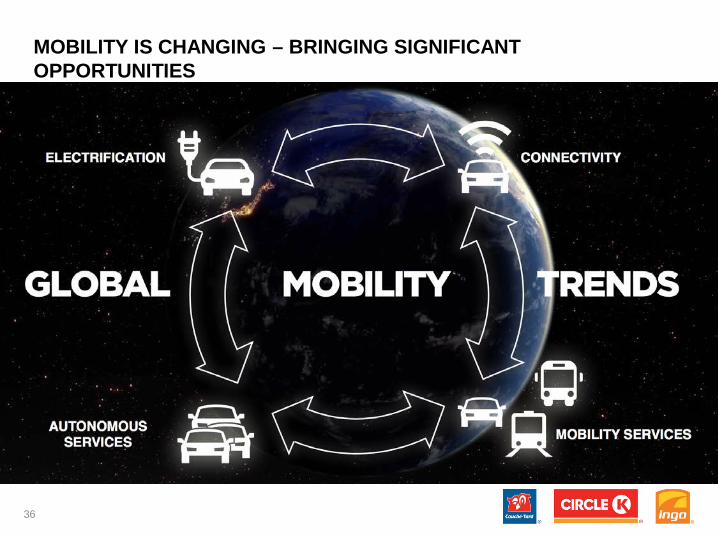
MOBILITY IS CHANGING – BRINGING SIGNIFICANT OPPORTUNITIES
36
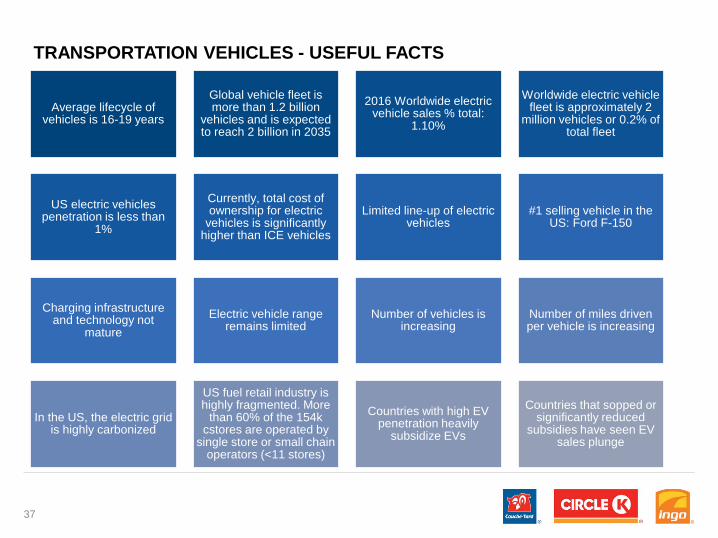
TRANSPORTATION VEHICLES - USEFUL FACTS
Average lifecycle of vehicles is 16-19 years
Global vehicle fleet is more than 1.2 billion
vehicles and is expected to reach 2 billion in 2035
2016 Worldwide electric vehicle sales % total:
1.10%
Worldwide electric vehicle fleet is approximately 2
million vehicles or 0.2% of total fleet
US electric vehicles penetration is less than
1%
Currently, total cost of ownership for electric
vehicles is significantly higher than ICE vehicles
Limited line-up of electric vehicles
#1 selling vehicle in the US: Ford F-150
Charging infrastructure and technology not
matureElectric vehicle range
remains limitedNumber of vehicles is
increasing Number of miles driven per vehicle is increasing
In the US, the electric grid is highly carbonized
US fuel retail industry is highly fragmented. More
than 60% of the 154k cstores are operated by
single store or small chain operators (<11 stores)
Countries with high EV penetration heavily
subsidize EVs
Countries that sopped or significantly reduced
subsidies have seen EV sales plunge
37
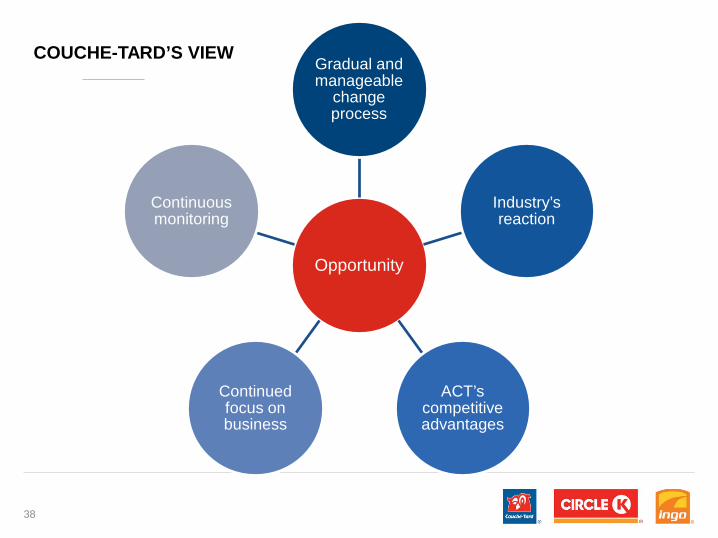
COUCHE-TARD’S VIEW
Opportunity
Gradual and manageable
change process
Industry’sreaction
ACT’scompetitiveadvantages
Continuedfocus on business
Continuousmonitoring
38
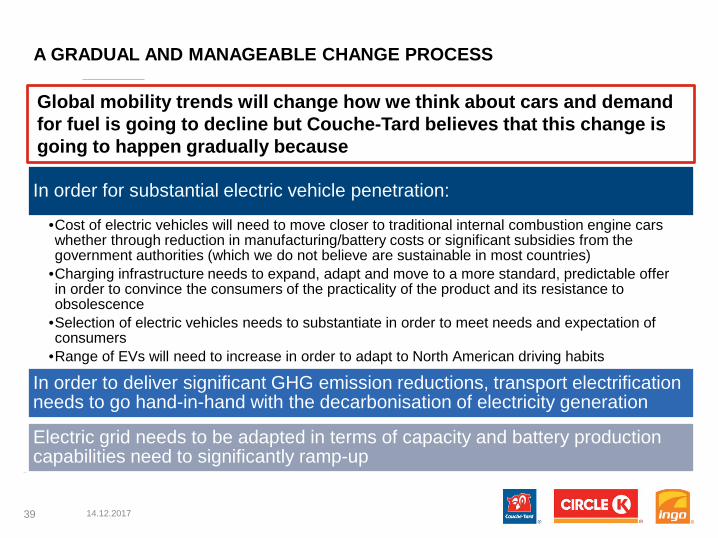
A GRADUAL AND MANAGEABLE CHANGE PROCESS
39
In order for substantial electric vehicle penetration:
•Cost of electric vehicles will need to move closer to traditional internal combustion engine cars whether through reduction in manufacturing/battery costs or significant subsidies from the government authorities (which we do not believe are sustainable in most countries)
•Charging infrastructure needs to expand, adapt and move to a more standard, predictable offer in order to convince the consumers of the practicality of the product and its resistance to obsolescence
•Selection of electric vehicles needs to substantiate in order to meet needs and expectation of consumers
•Range of EVs will need to increase in order to adapt to North American driving habits
In order to deliver significant GHG emission reductions, transport electrification needs to go hand-in-hand with the decarbonisation of electricity generation
Electric grid needs to be adapted in terms of capacity and battery production capabilities need to significantly ramp-up
14.12.2017
Global mobility trends will change how we think about cars and demand for fuel is going to decline but Couche-Tard believes that this change is going to happen gradually because
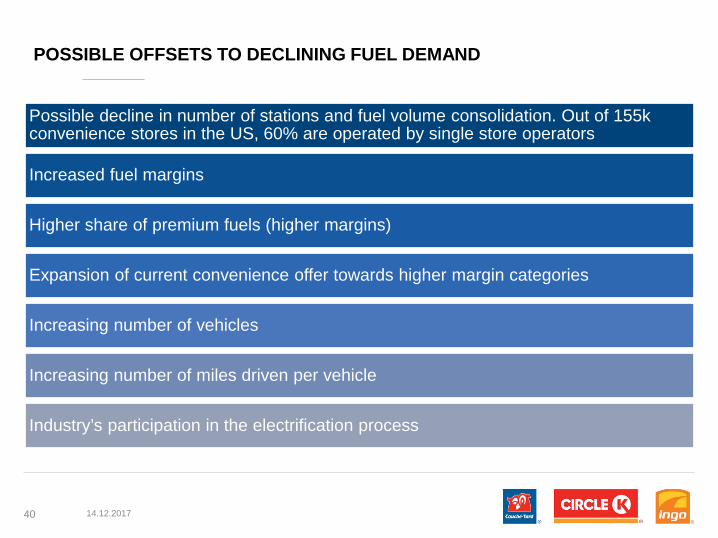
POSSIBLE OFFSETS TO DECLINING FUEL DEMAND
40
Possible decline in number of stations and fuel volume consolidation. Out of 155k convenience stores in the US, 60% are operated by single store operators
Increased fuel margins
Higher share of premium fuels (higher margins)
Expansion of current convenience offer towards higher margin categories
Increasing number of vehicles
Increasing number of miles driven per vehicle
Industry’s participation in the electrification process
14.12.2017
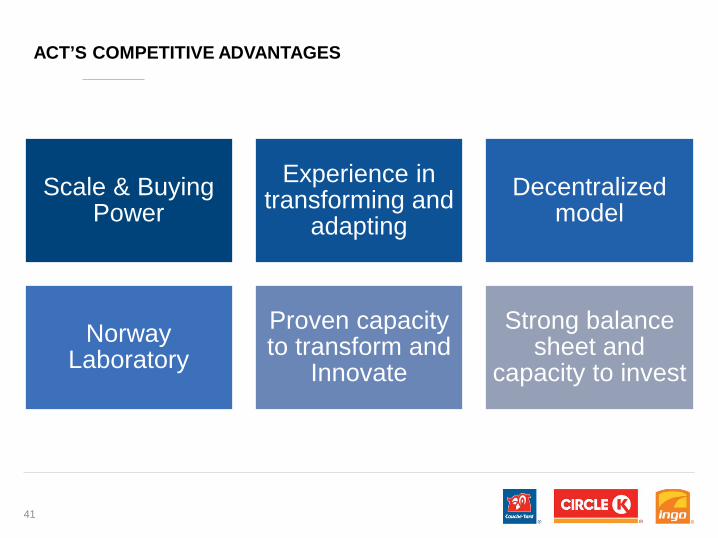
ACT’S COMPETITIVE ADVANTAGES
Scale & Buying Power
Experience in transforming and
adaptingDecentralized
model
Norway Laboratory
Proven capacity to transform and
Innovate
Strong balance sheet and
capacity to invest
41
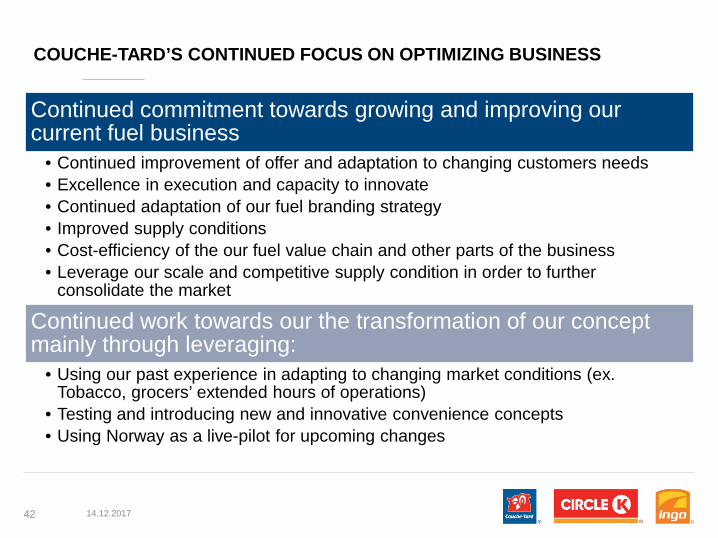
COUCHE-TARD’S CONTINUED FOCUS ON OPTIMIZING BUSINESS
42
Continued commitment towards growing and improving our current fuel business
• Continued improvement of offer and adaptation to changing customers needs• Excellence in execution and capacity to innovate• Continued adaptation of our fuel branding strategy• Improved supply conditions• Cost-efficiency of the our fuel value chain and other parts of the business• Leverage our scale and competitive supply condition in order to further
consolidate the market
Continued work towards our the transformation of our concept mainly through leveraging:
• Using our past experience in adapting to changing market conditions (ex. Tobacco, grocers’ extended hours of operations)
• Testing and introducing new and innovative convenience concepts• Using Norway as a live-pilot for upcoming changes
14.12.2017
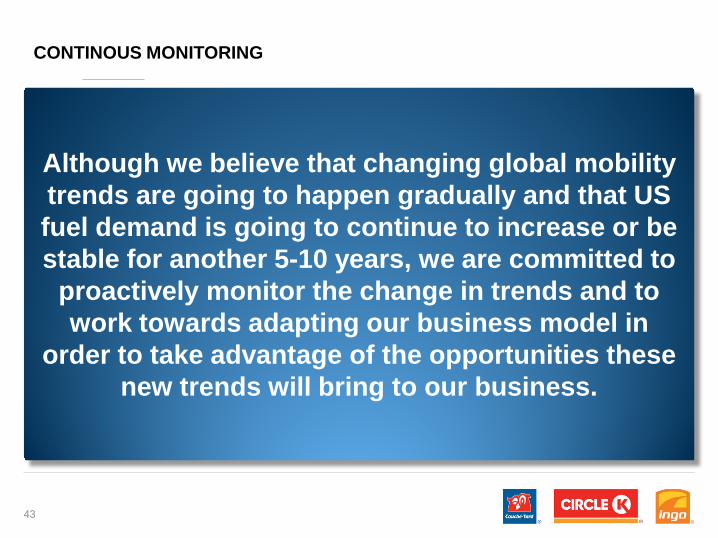
CONTINOUS MONITORING
Although we believe that changing global mobility trends are going to happen gradually and that US fuel demand is going to continue to increase or be stable for another 5-10 years, we are committed to
proactively monitor the change in trends and to work towards adapting our business model in
order to take advantage of the opportunities these new trends will bring to our business.
43
ALIMENTATION COUCHE-TARD INC.
VALUE CREATION AND FINANCIAL REVIEW
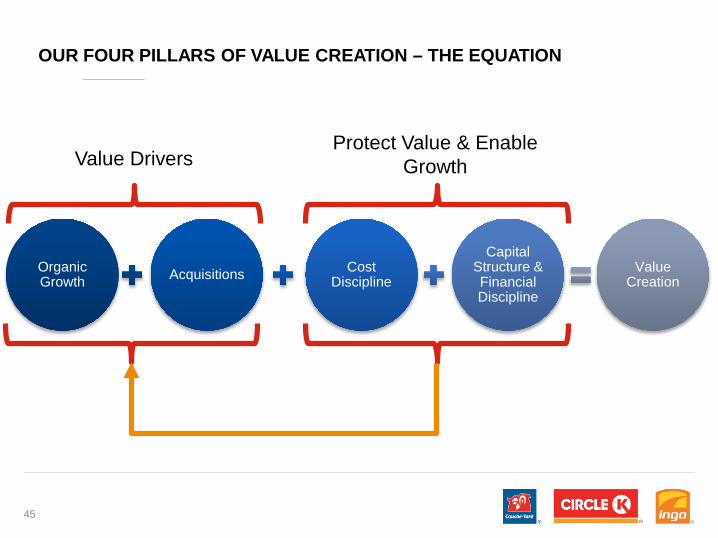
Value DriversProtect Value & Enable
Growth
OUR FOUR PILLARS OF VALUE CREATION – THE EQUATION
OrganicGrowth Acquisitions Cost
Discipline
Capital Structure & Financial Discipline
Value Creation
45
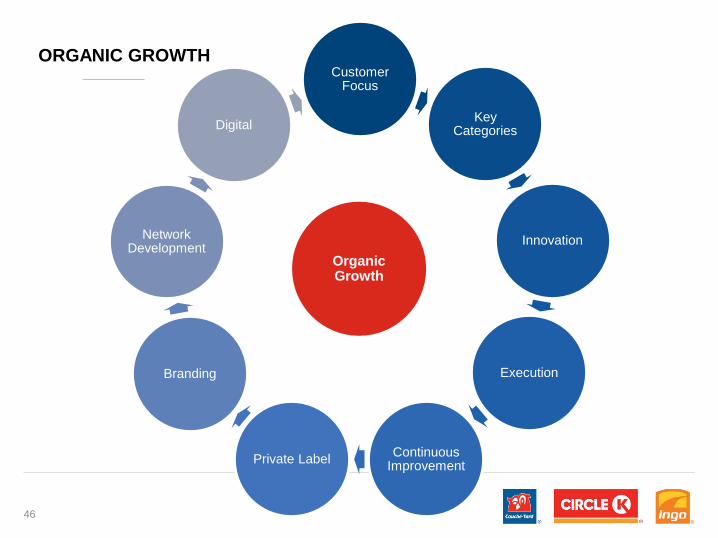
ORGANIC GROWTH
46
Customer Focus
Key Categories
Innovation
Execution
Continuous ImprovementPrivate Label
Branding
Network Development
Digital
OrganicGrowth
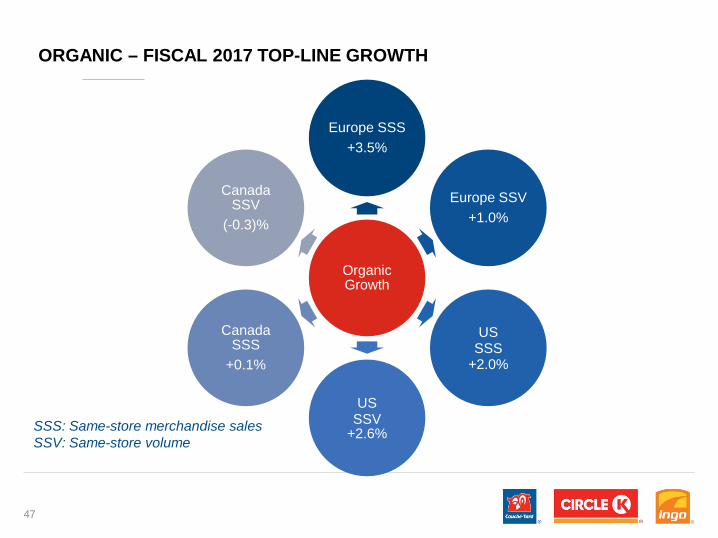
Organic Growth
Europe SSS+3.5%
Europe SSV+1.0%
USSSS
+2.0%
USSSV
+2.6%
Canada SSS
+0.1%
Canada SSV
(-0.3)%
ORGANIC – FISCAL 2017 TOP-LINE GROWTH
SSS: Same-store merchandise salesSSV: Same-store volume
47
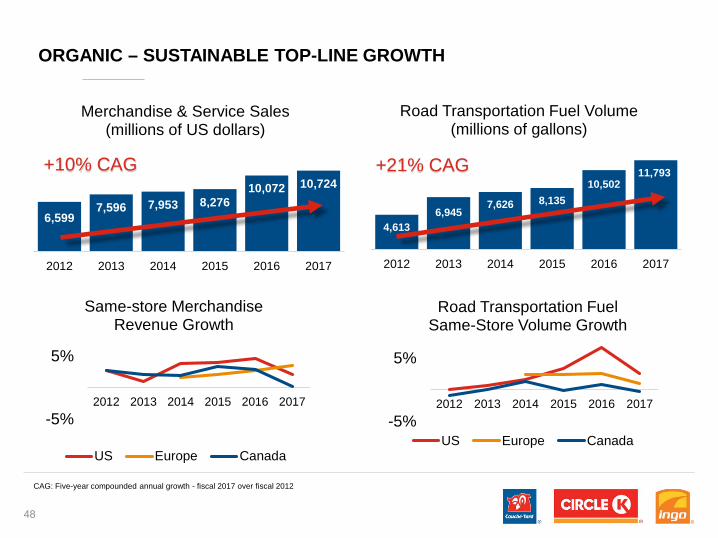
ORGANIC – SUSTAINABLE TOP-LINE GROWTH
6,5997,596 7,953 8,276
10,072 10,724
2012 2013 2014 2015 2016 2017
Merchandise & Service Sales(millions of US dollars)
+10% CAG
4,6136,945
7,626 8,13510,502
11,793
2012 2013 2014 2015 2016 2017
Road Transportation Fuel Volume(millions of gallons)
+21% CAG
-5%
5%
2012 2013 2014 2015 2016 2017
Road Transportation Fuel Same-Store Volume Growth
US Europe Canada-5%
5%
2012 2013 2014 2015 2016 2017
Same-store MerchandiseRevenue Growth
US Europe Canada
48
CAG: Five-year compounded annual growth - fiscal 2017 over fiscal 2012
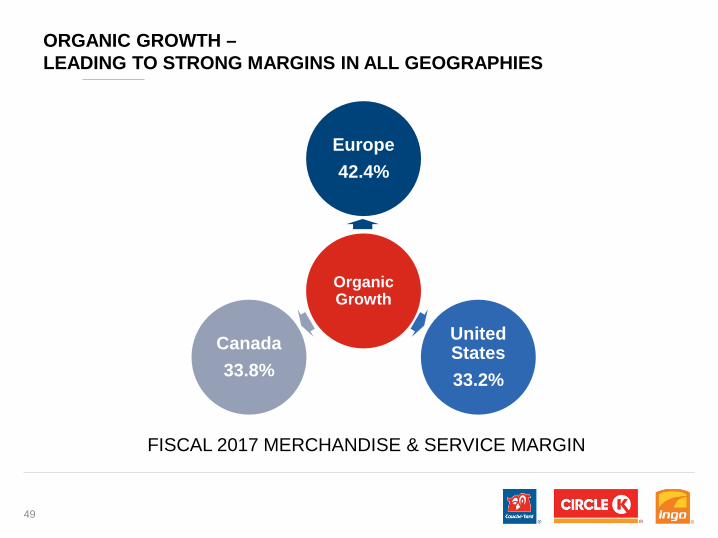
Organic Growth
Europe 42.4%
United States 33.2%
Canada33.8%
ORGANIC GROWTH –LEADING TO STRONG MARGINS IN ALL GEOGRAPHIES
49
FISCAL 2017 MERCHANDISE & SERVICE MARGIN
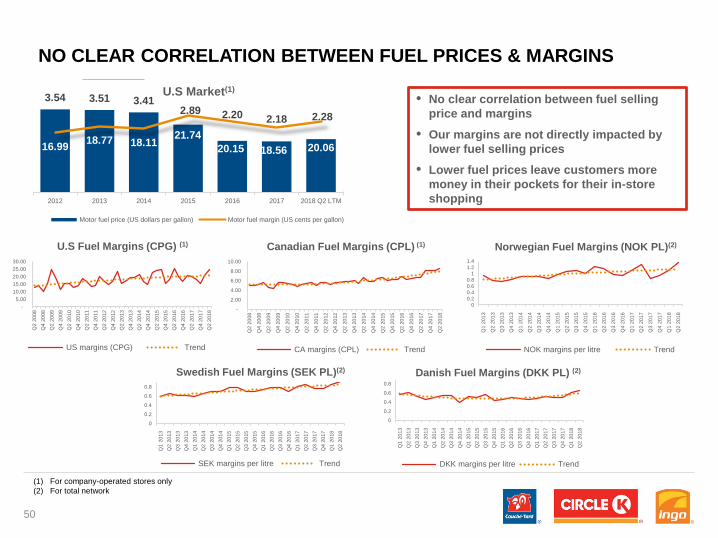
NO CLEAR CORRELATION BETWEEN FUEL PRICES & MARGINS
• No clear correlation between fuel selling price and margins
• Our margins are not directly impacted by lower fuel selling prices
• Lower fuel prices leave customers more money in their pockets for their in-store shopping
(1) For company-operated stores only(2) For total network
50
- 5.00
10.00 15.00 20.00 25.00 30.00
Q2
2008
Q4
2008
Q2
2009
Q4
2009
Q2
2010
Q4
2010
Q2
2011
Q4
2011
Q2
2012
Q4
2012
Q2
2013
Q4
2013
Q2
2014
Q4
2014
Q2
2015
Q4
2015
Q2
2016
Q4
2016
Q2
2017
Q4
2017
Q2
2018
U.S Fuel Margins (CPG) (1)
US margins (CPG) Trend
-
2.00
4.00
6.00
8.00
10.00
Q2
2008
Q4
2008
Q2
2009
Q4
2009
Q2
2010
Q4
2010
Q2
2011
Q4
2011
Q2
2012
Q4
2012
Q2
2013
Q4
2013
Q2
2014
Q4
2014
Q2
2015
Q4
2015
Q2
2016
Q4
2016
Q2
2017
Q4
2017
Q2
2018
Canadian Fuel Margins (CPL) (1)
CA margins (CPL) Trend
00.20.40.60.8
11.21.4
Q1
2013
Q2
2013
Q3
2013
Q4
2013
Q1
2014
Q2
2014
Q3
2014
Q4
2014
Q1
2015
Q2
2015
Q3
2015
Q4
2015
Q1
2016
Q2
2016
Q3
2016
Q4
2016
Q1
2017
Q2
2017
Q3
2017
Q4
2017
Q1
2018
Q2
2018
Norwegian Fuel Margins (NOK PL)(2)
NOK margins per litre Trend
0
0.2
0.4
0.6
0.8
Q1
2013
Q2
2013
Q3
2013
Q4
2013
Q1
2014
Q2
2014
Q3
2014
Q4
2014
Q1
2015
Q2
2015
Q3
2015
Q4
2015
Q1
2016
Q2
2016
Q3
2016
Q4
2016
Q1
2017
Q2
2017
Q3
2017
Q4
2017
Q1
2018
Q2
2018
Swedish Fuel Margins (SEK PL)(2)
SEK margins per litre Trend
0
0.2
0.4
0.6
0.8
Q1
2013
Q2
2013
Q3
2013
Q4
2013
Q1
2014
Q2
2014
Q3
2014
Q4
2014
Q1
2015
Q2
2015
Q3
2015
Q4
2015
Q1
2016
Q2
2016
Q3
2016
Q4
2016
Q1
2017
Q2
2017
Q3
2017
Q4
2017
Q1
2018
Q2
2018
Danish Fuel Margins (DKK PL) (2)
DKK margins per litre Trend
3.54 3.51 3.412.89 2.20 2.18 2.28
16.99 18.77 18.11 21.7420.15 18.56 20.06
2012 2013 2014 2015 2016 2017 2018 Q2 LTM
U.S Market(1)
Motor fuel price (US dollars per gallon) Motor fuel margin (US cents per gallon)
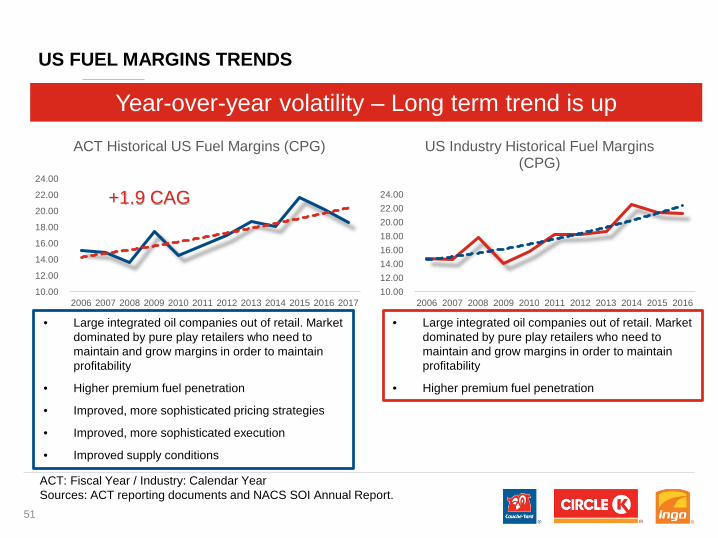
US FUEL MARGINS TRENDS
10.00
12.00
14.00
16.00
18.00
20.00
22.00
24.00
2006 2007 2008 2009 2010 2011 2012 2013 2014 2015 2016 2017
ACT Historical US Fuel Margins (CPG)
+1.9 CAG
10.00 12.00 14.00 16.00 18.00 20.00 22.00 24.00
2006 2007 2008 2009 2010 2011 2012 2013 2014 2015 2016
US Industry Historical Fuel Margins (CPG)
ACT: Fiscal Year / Industry: Calendar YearSources: ACT reporting documents and NACS SOI Annual Report.
Year-over-year volatility – Long term trend is up
• Large integrated oil companies out of retail. Market dominated by pure play retailers who need to maintain and grow margins in order to maintain profitability
• Higher premium fuel penetration
• Improved, more sophisticated pricing strategies
• Improved, more sophisticated execution
• Improved supply conditions
• Large integrated oil companies out of retail. Market dominated by pure play retailers who need to maintain and grow margins in order to maintain profitability
• Higher premium fuel penetration
51
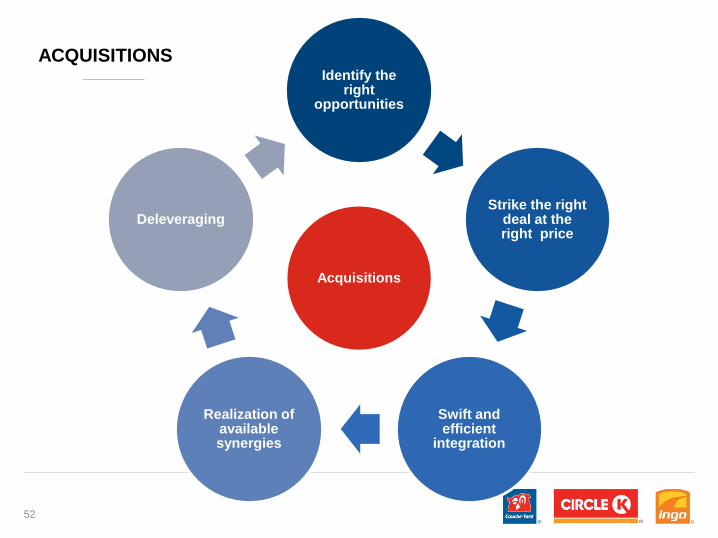
Identify the right
opportunities
Strike the right deal at the right price
Swift and efficient
integration
Realization of available synergies
Deleveraging
ACQUISITIONS
Acquisitions
52
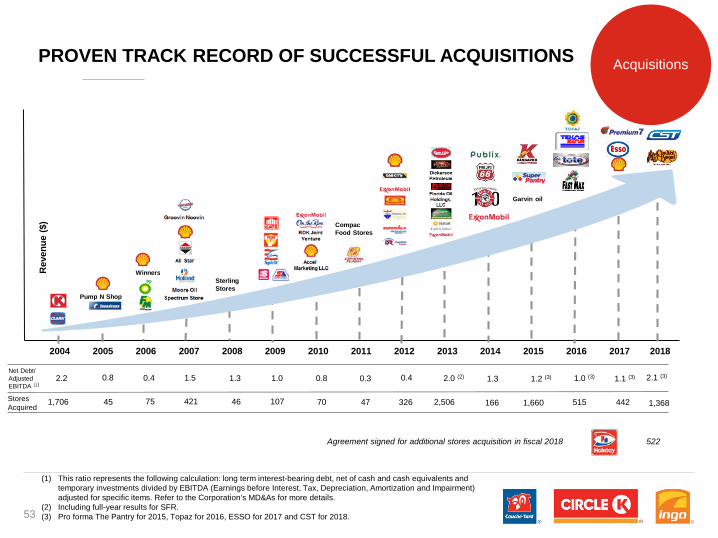
PROVEN TRACK RECORD OF SUCCESSFUL ACQUISITIONS
Net Debt/Adjusted EBITDA (1)
Stores Acquired
(1) This ratio represents the following calculation: long term interest-bearing debt, net of cash and cash equivalents and temporary investments divided by EBITDA (Earnings before Interest, Tax, Depreciation, Amortization and Impairment) adjusted for specific items. Refer to the Corporation’s MD&As for more details.
(2) Including full-year results for SFR.(3) Pro forma The Pantry for 2015, Topaz for 2016, ESSO for 2017 and CST for 2018.
2.2 0.8 0.4 1.5 1.3 1.0 0.8 0.3 0.4 2.0 (2) 1.3 1.2 (3) 1.0 (3) 1.1 (3)
53
Agreement signed for additional stores acquisition in fiscal 2018 522
1,706 45 75 421 46 107 70 47 326 2,506 166 1,660 515 442 1,368
Rev
enue
($)
Winners
Pump N Shop
Sterling Stores
Compac Food Stores
Garvin oil
2004 2005 2006 2007 2008 2009 2010 2011 2012 2013 2014 2015 2016 2017 2018
2.1 (3)
Acquisitions
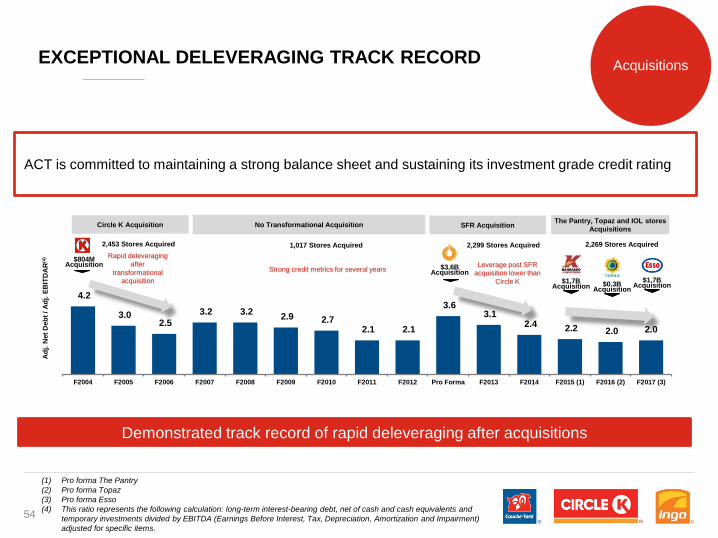
EXCEPTIONAL DELEVERAGING TRACK RECORD
ACT is committed to maintaining a strong balance sheet and sustaining its investment grade credit rating
(1) Pro forma The Pantry(2) Pro forma Topaz(3) Pro forma Esso(4) This ratio represents the following calculation: long-term interest-bearing debt, net of cash and cash equivalents and
temporary investments divided by EBITDA (Earnings Before Interest, Tax, Depreciation, Amortization and Impairment) adjusted for specific items.
4.2
3.0 2.5
3.2 3.2 2.9 2.7 2.1 2.1
3.6 3.1
2.4 2.2 2.0 2.0
F2004 F2005 F2006 F2007 F2008 F2009 F2010 F2011 F2012 Pro Forma F2013 F2014 F2015 (1) F2016 (2) F2017 (3)
Adj.
Net
Deb
t / A
dj. E
BIT
DAR
(4)
Circle K Acquisition No Transformational Acquisition SFR Acquisition The Pantry, Topaz and IOL stores Acquisitions
2,453 Stores Acquired 1,017 Stores Acquired 2,299 Stores Acquired 2,269 Stores AcquiredRapid deleveraging
after transformational
acquisitionStrong credit metrics for several years Leverage post SFR
acquisition lower than Circle K
$3.6B Acquisition
$1.7B Acquisition
$804MAcquisition
54
$0.3B Acquisition
$1.7B Acquisition
Demonstrated track record of rapid deleveraging after acquisitions
Acquisitions
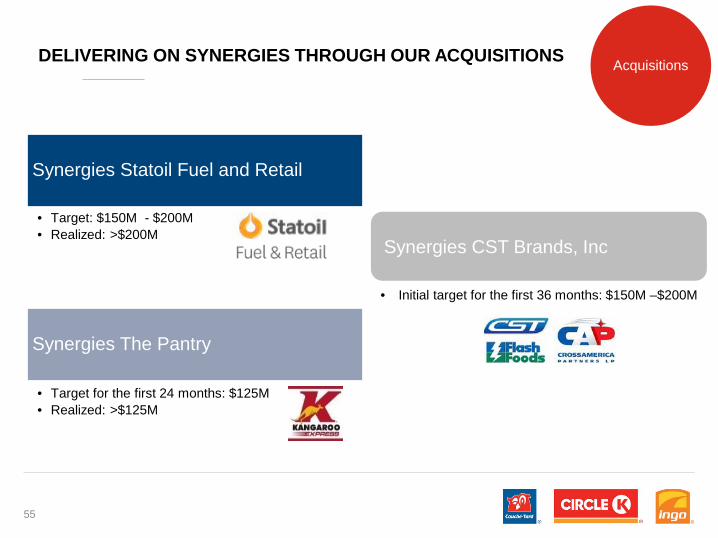
Synergies Statoil Fuel and Retail
• Target: $150M - $200M• Realized: >$200M
Synergies The Pantry
• Target for the first 24 months: $125M• Realized: >$125M
DELIVERING ON SYNERGIES THROUGH OUR ACQUISITIONS
55
Synergies CST Brands, Inc
• Initial target for the first 36 months: $150M –$200M
Acquisitions
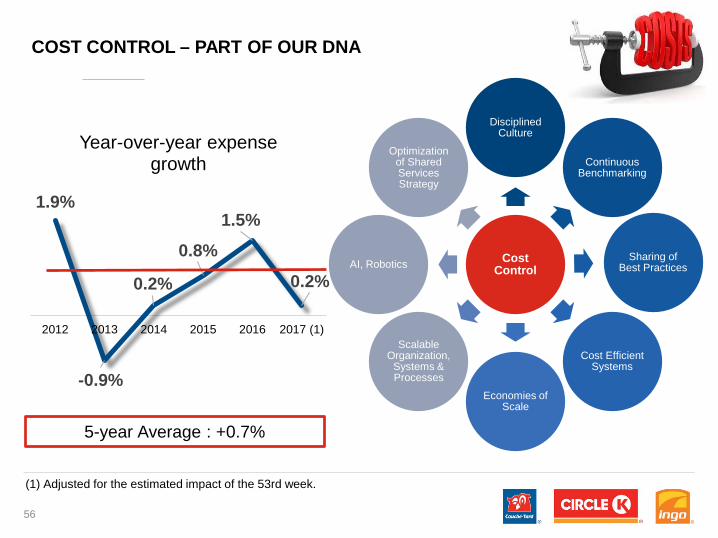
1.9%
-0.9%
0.2%
0.8%1.5%
0.2%
2012 2013 2014 2015 2016 2017 (1)
Year-over-year expense growth
5-year Average : +0.7%
COST CONTROL – PART OF OUR DNA
56
(1) Adjusted for the estimated impact of the 53rd week.
Cost Control
Disciplined Culture
Continuous Benchmarking
Sharing of Best Practices
Cost Efficient Systems
Economies of Scale
Scalable Organization,
Systems & Processes
AI, Robotics
Optimization of Shared Services Strategy
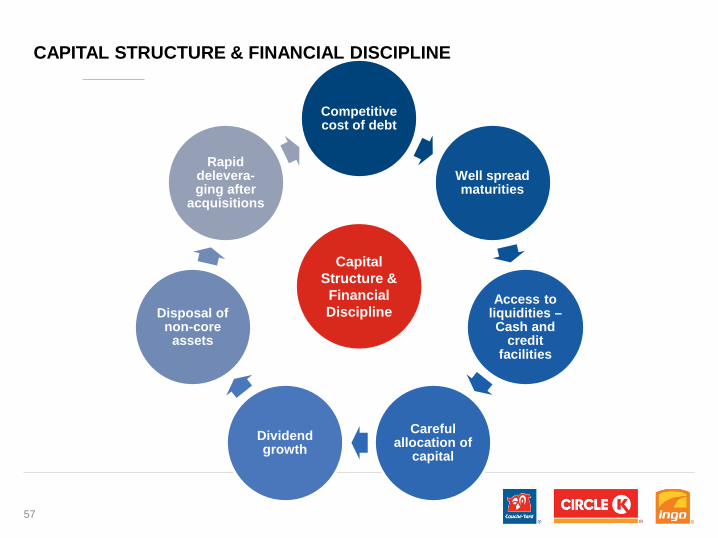
Competitive cost of debt
Well spread maturities
Access to liquidities –Cash and
credit facilities
Carefulallocation of
capitalDividend growth
Disposal of non-core
assets
Rapid delevera-ging after
acquisitions
CAPITAL STRUCTURE & FINANCIAL DISCIPLINE
Capital Structure &
Financial Discipline
57
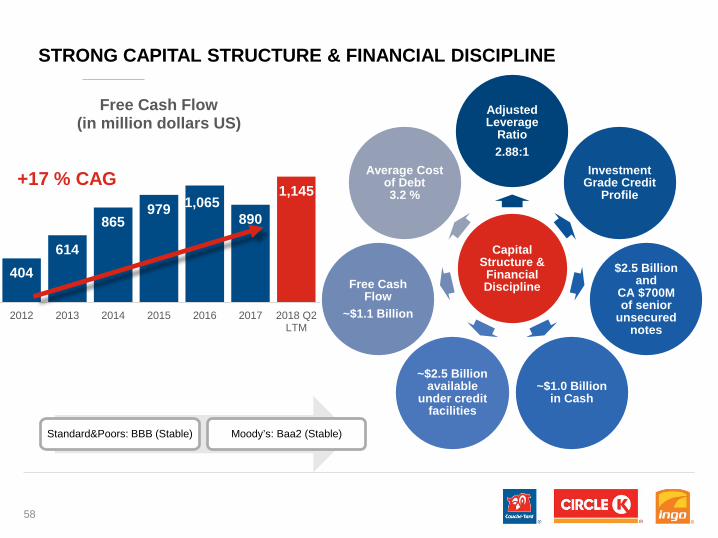
STRONG CAPITAL STRUCTURE & FINANCIAL DISCIPLINE
Capital Structure & Financial Discipline
Adjusted Leverage
Ratio2.88:1
Investment Grade Credit
Profile
$2.5 Billion and
CA $700M of senior
unsecured notes
~$1.0 Billion in Cash
~$2.5 Billion available
under credit facilities
Free Cash Flow
~$1.1 Billion
Average Cost of Debt 3.2 %
Standard&Poors: BBB (Stable) Moody’s: Baa2 (Stable)
58
404614
865979 1,065
890
1,145
2012 2013 2014 2015 2016 2017 2018 Q2LTM
Free Cash Flow (in million dollars US)
+17 % CAG
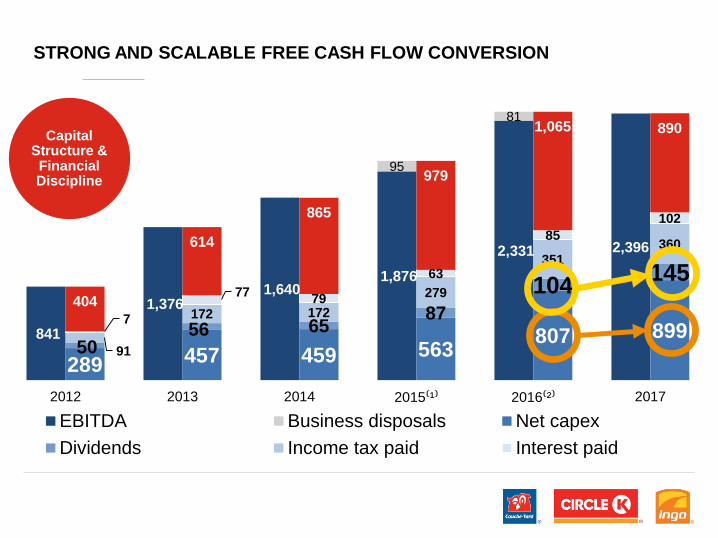
841
1,3761,640
1,8762,331 2,396
95
81
289 457 459 563 807 89950
56 65 87104 145
91
172 172279
351360
7
77 79
63
85102
404
614
865
979
1,065 890
2012 2013 2014 2015⁽¹⁾ 2016⁽²⁾ 2017
EBITDA Business disposals Net capexDividends Income tax paid Interest paid
Capital Structure & Financial Discipline
STRONG AND SCALABLE FREE CASH FLOW CONVERSION
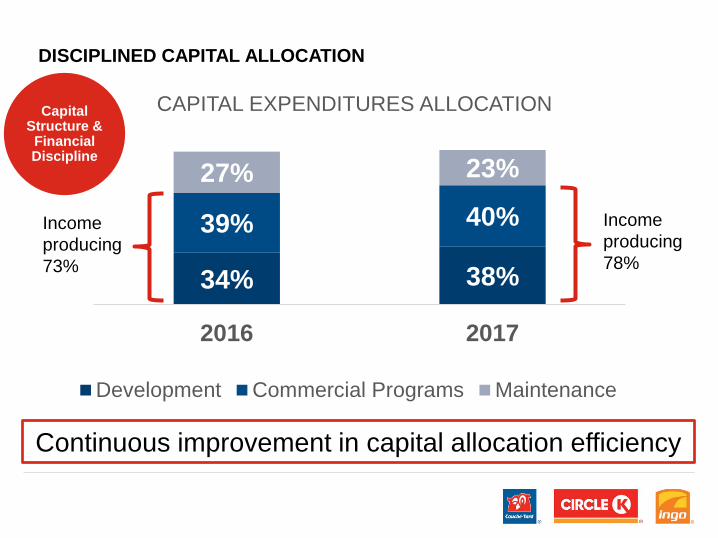
34% 38%
39% 40%27% 23%
2016 2017
CAPITAL EXPENDITURES ALLOCATION
Development Commercial Programs Maintenance
Continuous improvement in capital allocation efficiency
Income producing73%
Income producing78%
Capital Structure &
Financial Discipline
DISCIPLINED CAPITAL ALLOCATION
Value Creation
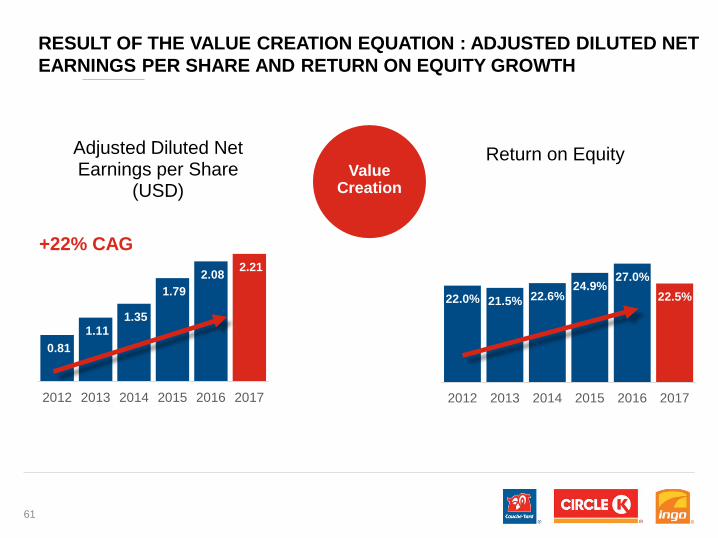
RESULT OF THE VALUE CREATION EQUATION : ADJUSTED DILUTED NET EARNINGS PER SHARE AND RETURN ON EQUITY GROWTH
0.81 1.11
1.35
1.79 2.08 2.21
2012 2013 2014 2015 2016 2017
Adjusted Diluted Net Earnings per Share
(USD)
+22% CAG
22.0% 21.5% 22.6%24.9%
27.0%22.5%
2012 2013 2014 2015 2016 2017
Return on Equity
61
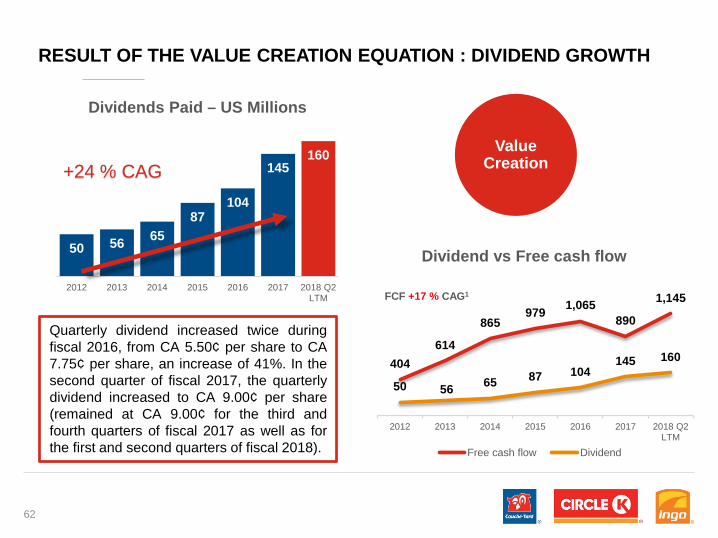
Quarterly dividend increased twice duringfiscal 2016, from CA 5.50¢ per share to CA7.75¢ per share, an increase of 41%. In thesecond quarter of fiscal 2017, the quarterlydividend increased to CA 9.00¢ per share(remained at CA 9.00¢ for the third andfourth quarters of fiscal 2017 as well as forthe first and second quarters of fiscal 2018).
Value Creation
RESULT OF THE VALUE CREATION EQUATION : DIVIDEND GROWTH
62
50 56 6587
104
145160
2012 2013 2014 2015 2016 2017 2018 Q2LTM
Dividends Paid – US Millions
+24 % CAG
404614
865979 1,065
890
1,145
50 56 65 87 104145 160
2012 2013 2014 2015 2016 2017 2018 Q2LTM
Dividend vs Free cash flow
Free cash flow Dividend
FCF +17 % CAG1
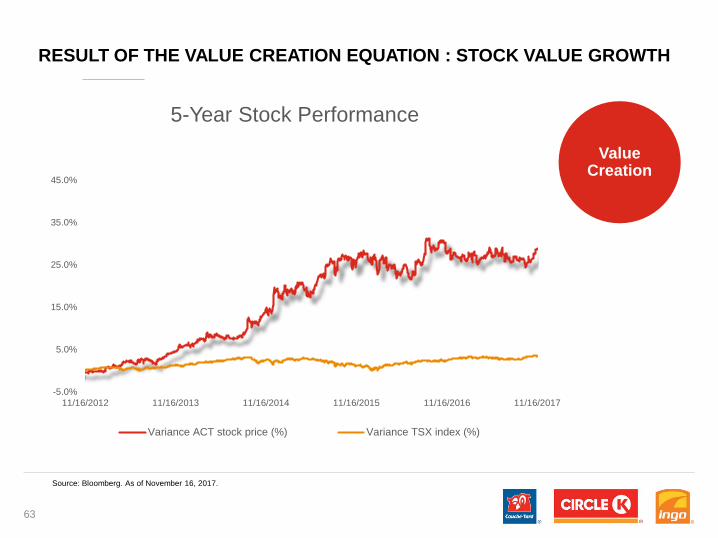
RESULT OF THE VALUE CREATION EQUATION : STOCK VALUE GROWTH
Value Creation
63
-5.0%
5.0%
15.0%
25.0%
35.0%
45.0%
11/16/2012 11/16/2013 11/16/2014 11/16/2015 11/16/2016 11/16/2017
5-Year Stock Performance
Variance ACT stock price (%) Variance TSX index (%)
Source: Bloomberg. As of November 16, 2017.
ALIMENTATION COUCHE-TARD INC.
ACQUISITIONS COMPLETEDDURING FY18
Value Creation
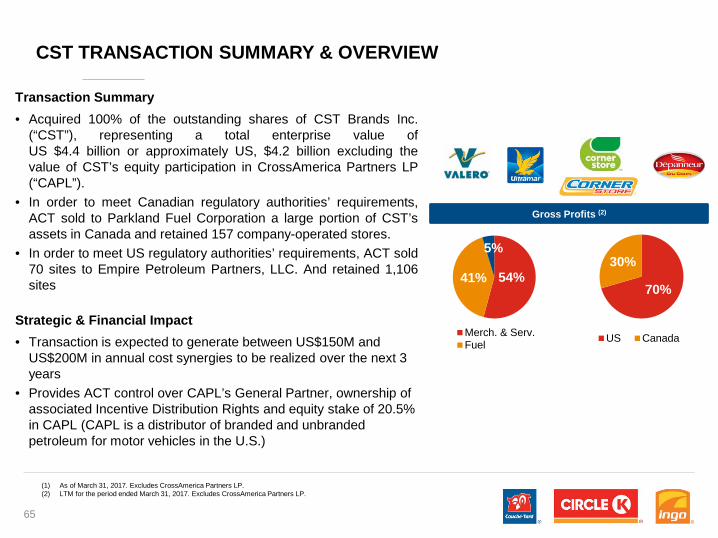
CST TRANSACTION SUMMARY & OVERVIEW
Gross Profits (2)
54%41%
5%
Merch. & Serv.Fuel
70%
30%
US Canada
Transaction Summary• Acquired 100% of the outstanding shares of CST Brands Inc.
(“CST”), representing a total enterprise value ofUS $4.4 billion or approximately US, $4.2 billion excluding thevalue of CST’s equity participation in CrossAmerica Partners LP(“CAPL”).
• In order to meet Canadian regulatory authorities’ requirements,ACT sold to Parkland Fuel Corporation a large portion of CST’sassets in Canada and retained 157 company-operated stores.
• In order to meet US regulatory authorities’ requirements, ACT sold70 sites to Empire Petroleum Partners, LLC. And retained 1,106sites
Strategic & Financial Impact• Transaction is expected to generate between US$150M and
US$200M in annual cost synergies to be realized over the next 3 years
• Provides ACT control over CAPL’s General Partner, ownership of associated Incentive Distribution Rights and equity stake of 20.5% in CAPL (CAPL is a distributor of branded and unbranded petroleum for motor vehicles in the U.S.)
(1) As of March 31, 2017. Excludes CrossAmerica Partners LP.(2) LTM for the period ended March 31, 2017. Excludes CrossAmerica Partners LP.
65
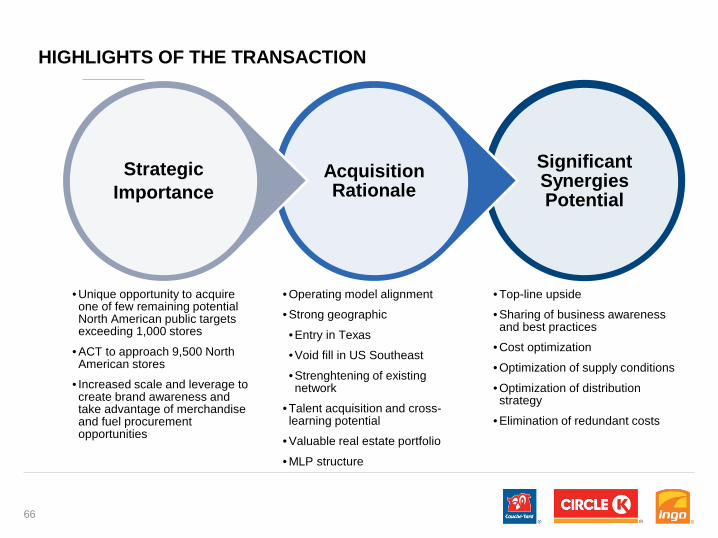
SignificantSynergiesPotential
• Top-line upside• Sharing of business awareness and best practices
• Cost optimization
• Optimization of supply conditions
• Optimization of distribution strategy
• Elimination of redundant costs
Acquisition Rationale
• Operating model alignment• Strong geographic
• Entry in Texas• Void fill in US Southeast
• Strenghtening of existing network
• Talent acquisition and cross-learning potential
• Valuable real estate portfolio
• MLP structure
StrategicImportance
• Unique opportunity to acquire one of few remaining potential North American public targets exceeding 1,000 stores
• ACT to approach 9,500 North American stores
• Increased scale and leverage to create brand awareness and take advantage of merchandise and fuel procurement opportunities
HIGHLIGHTS OF THE TRANSACTION
66
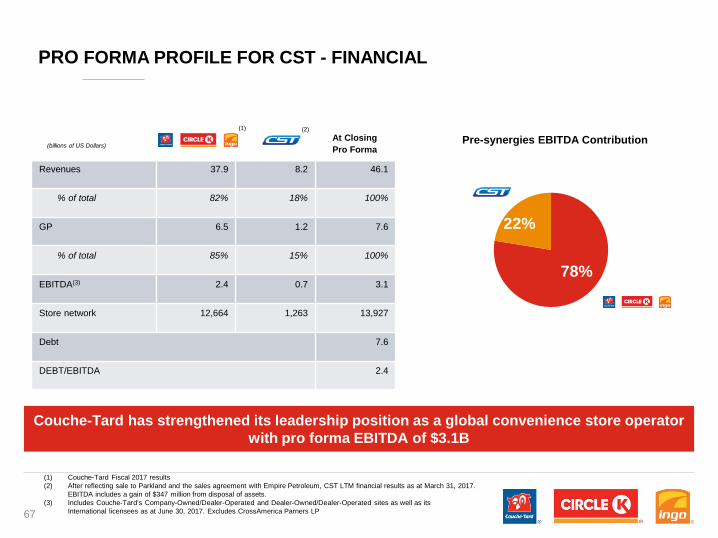
Revenues 37.9 8.2 46.1
% of total 82% 18% 100%
GP 6.5 1.2 7.6
% of total 85% 15% 100%
EBITDA(3) 2.4 0.7 3.1
Store network 12,664 1,263 13,927
Debt 7.6
DEBT/EBITDA 2.4
78%
22%
PRO FORMA PROFILE FOR CST - FINANCIAL
Couche-Tard has strengthened its leadership position as a global convenience store operator with pro forma EBITDA of $3.1B
(billions of US Dollars)At ClosingPro Forma
Pre-synergies EBITDA Contribution
(1) Couche-Tard Fiscal 2017 results(2) After reflecting sale to Parkland and the sales agreement with Empire Petroleum, CST LTM financial results as at March 31, 2017.
EBITDA includes a gain of $347 million from disposal of assets.(3) Includes Couche-Tard’s Company-Owned/Dealer-Operated and Dealer-Owned/Dealer-Operated sites as well as its
International licensees as at June 30, 2017. Excludes CrossAmerica Parners LP
(1) (2)
67
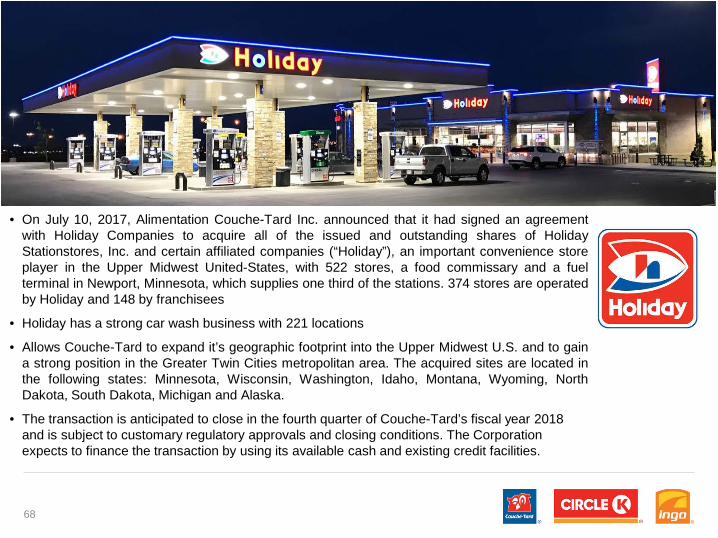
• On July 10, 2017, Alimentation Couche-Tard Inc. announced that it had signed an agreementwith Holiday Companies to acquire all of the issued and outstanding shares of HolidayStationstores, Inc. and certain affiliated companies (“Holiday”), an important convenience storeplayer in the Upper Midwest United-States, with 522 stores, a food commissary and a fuelterminal in Newport, Minnesota, which supplies one third of the stations. 374 stores are operatedby Holiday and 148 by franchisees
• Holiday has a strong car wash business with 221 locations
• Allows Couche-Tard to expand it’s geographic footprint into the Upper Midwest U.S. and to gaina strong position in the Greater Twin Cities metropolitan area. The acquired sites are located inthe following states: Minnesota, Wisconsin, Washington, Idaho, Montana, Wyoming, NorthDakota, South Dakota, Michigan and Alaska.
• The transaction is anticipated to close in the fourth quarter of Couche-Tard’s fiscal year 2018 and is subject to customary regulatory approvals and closing conditions. The Corporation expects to finance the transaction by using its available cash and existing credit facilities.
68
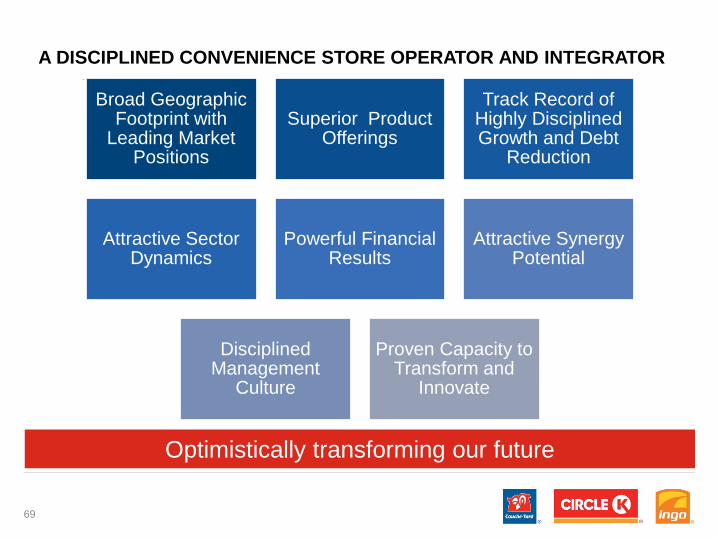
A DISCIPLINED CONVENIENCE STORE OPERATOR AND INTEGRATOR
Broad Geographic Footprint with
Leading Market Positions
Superior Product Offerings
Track Record of Highly Disciplined Growth and Debt
Reduction
Attractive Sector Dynamics
Powerful Financial Results
Attractive Synergy Potential
Disciplined Management
Culture
Proven Capacity to Transform and
Innovate
Optimistically transforming our future
69