invited paper overlappingcommunities explaincore...
TRANSCRIPT

INV ITEDP A P E R
Overlapping CommunitiesExplain Core–PeripheryOrganization of NetworksThe paper presents a new paradigm for uncovering the modular structure of
complex networks.
By Jaewon Yang and Jure Leskovec
ABSTRACT | Networks provide a powerful way to study
complex systems of interacting objects. Detecting network
communitiesVgroups of objects that often correspond to func-
tional modulesVis crucial to understanding social, technolog-
ical, and biological systems. Revealing communities allows for
analysis of system properties that are invisible when consid-
ering only individual objects or the entire system, such as the
identification of module boundaries and relationships or the
classification of objects according to their functional roles.
However, in networks where objects can simultaneously be-
long to multiple modules at once, the decomposition of a
network into overlapping communities remains a challenge.
Here we present a new paradigm for uncovering the modular
structure of complex networks, based on a decomposition of a
network into any combination of overlapping, nonoverlapping,
and hierarchically organized communities. We demonstrate on
a diverse set of networks coming from a wide range of domains
that our approach leads to more accurate communities and
improved identification of community boundaries. We also
unify two fundamental organizing principles of complex net-
works: the modularity of communities and the commonly ob-
served core–periphery structure. We show that dense network
cores form as an intersection of many overlapping communi-
ties. We discover that communities in social, information, and
food web networks have a single central dominant core while
communities in protein–protein interaction (PPI) as well as
product copurchasing networks have small overlaps and form
many local cores.
KEYWORDS | Community detection; core–periphery structure;
ground-truth communities; networks
I . INTRODUCTION
Networks provide a way to represent systems of interacting
objects where nodes denote objects (people, proteins,
webpages) and edges between the objects denote interac-
tions (friendships, physical interactions, links). Nodes in
networks organize into communities [1], which oftencorrespond to groups of nodes that share a common pro-
perty, role or function, such as functionally related pro-
teins [2], social communities [3], or topically related
webpages [4]. Communities in networks often overlap as
nodes might belong to multiple communities at once.
Identifying such overlapping communities in networks is a
crucial step in studying the structure and dynamics of so-
cial, technological, and biological systems [2]–[5]. For ex-ample, community detection allows us to gain insights into
metabolic and protein–protein interactions (PPIs), eco-
logical foodwebs, social networks like Facebook, collab-
oration networks, information networks of interlinked
documents, and even networks of copurchased products
[6]–[12]. In particular, communities allow for analysis of
system properties that cannot be studied when considering
only individual objects or the entire system, such as theidentification of module boundaries and relationships and
the classification of objects according to their functional
roles [13]–[17].
Manuscript received March 20, 2014; revised August 1, 2014 and October 15, 2014;
accepted October 15, 2014. Date of publication November 11, 2014; date of current
version November 18, 2014. This work was supported by the National Science
Foundation (NSF) under Career Award IIS-1149837, by Defense Advanced Research
Projects Agency (DARPA) XDATA, by GRAPHS, by the Alfred P. Sloan Fellowship, and by
the Microsoft Faculty Fellowship.
J. Yang is with the Department of Electrical Engineering, Stanford University, Stanford,
CA 94305 USA (e-mail: [email protected]).
J. Leskovec is with the Department of Computer Science, Stanford University,
Stanford, CA 94305 USA (e-mail: [email protected]).
Digital Object Identifier: 10.1109/JPROC.2014.2364018
0018-9219 � 2014 IEEE. Personal use is permitted, but republication/redistribution requires IEEE permission.See http://www.ieee.org/publications_standards/publications/rights/index.html for more information.
1892 Proceedings of the IEEE | Vol. 102, No. 12, December 2014

Here we explore the community structure of a numberof networks from many domains. We distinguish between
structural and functional definitions of communities [18].
Communities are often structurally defined as sets of
nodes with many connections among the members of the
set and few connections to the rest of the network [1].
Communities can also be defined functionally based on the
function or role of community’s members. For example,
functional communities may correspond to social groupsin social networks, scientific disciplines or research groups
in scientific collaboration networks, and biological mod-
ules in PPI networks. The basic premise of community
detection is that these functional communities share some
common structural signature, which allows us to extract
them from the network structure.
Based on this distinction one can state that the goal of
community detection is to build a bridge between networkstructure and function, that is, to identify communities
based on the network structure with the aim that such
structurally identified communities would correspond to
functional communities.
In this paper, we build on the above view of network
community detection and develop community detection
methods that identify functional communities based on
their structural connectivity patterns. We identify net-works where we can obtain reliable external labels of
functional communities. We refer to such explicitly la-
beled functional communities as ground-truth communi-
ties [18]. We study structural properties of ground-truth
functional communities and find that they exhibit a par-
ticular structural pattern. We discover that the probability
of nodes being connected increases with the number of
ground-truth communities they share. Our observationmeans that nodes residing in overlaps of ground-truth
communities are more densely connected than nodes in
the nonoverlapping parts of communities. Interestingly,
we also find that assumptions behind many existing over-
lapping community detection methods lead to the oppo-
site conclusion that the more communities a pair of nodes
shares, the less likely they are to be connected [6]–[11].
Thus, as a consequence, many overlapping communitydetection methods may not be able to properly detect
ground-truth communities.
Based on the above observations, we develop a new
overlapping community detection method called the
community-affiliation graph model (AGM), which views
communities as overlapping ‘‘tiles’’ and the tile density
corresponds to edge density [19]. Fig. 1 illustrates the
concept. Our methodology decomposes the network into acombination of overlapping, nonoverlapping, and hierar-
chically organized communities. We compare AGM to a
number of widely used overlapping and nonoverlapping
community detection methods [6], [7], [10], [20] and show
that AGM leads to more accurate functional communities.
On average, AGM gives 50% relative improvement over
existing methods in assigning nodes to their ground-truth
communities in social, coauthorship, product copurchas-
ing, and biological networks.
Finally, we unify two fundamental organizing princi-ples of complex networks: overlapping communities and
the commonly observed core–periphery structure. While
network communities are often thought of as densely
linked clusters of nodes, in core–periphery network struc-
ture, the network is composed of a densely connected core
and a sparsely connected periphery [21]–[23]. Many large
networks may exhibit core–periphery structure. The net-
work core was traditionally viewed as a single giant com-munity, and, therefore, it was conjectured that the core
lacks internal communities [24]–[27]. We unify those two
organizing principles and show that dense network cores
form as a result of many overlapping communities. More-
over, we find that foodweb, social, and web networks
exhibit a single dominant core while PPI and product co-
purchasing networks contain many local cores formed
around the central core.Our methodology to decompose networks into commu-
nities provides a powerful tool for studying social,
technological, and biological systems by uncovering their
modular structure. Our work represents a new way of
studying networks of complex systems by bringing a shift
in perspective from defining communities as densely con-
nected nodes to conceptualizing them as overlapping tiles.
II . FROM STRUCTURAL TO FUNCTIONALDEFINITIONS OF COMMUNITIES
The traditional structural view of network communities is
based on two fundamental social network processes: tria-
dic closure [28] and the strength of weak ties theory [29],
[30]. Under this view, structural communities are often
defined as corresponding to sets of nodes with many
Fig. 1. Communities as tiles. (a) Communities in networks behave as
overlapping tiles. (b) Many methods view communities as clusters
with a homogeneous edge density and thus they may break the tiles.
(c) Our AGM methodology successfully decomposes the network into
different tiles (communities).
Yang and Leskovec: Overlapping Communities Explain Core–Periphery Organization of Networks
Vol. 102, No. 12, December 2014 | Proceedings of the IEEE 1893
‘‘strong’’ connections between the members of the commu-
nity and few ‘‘weak’’ connections with the rest of the net-
work [Fig. 2(a)]. However, in many domains, nodes may
belong to multiple communities at once, and thus the
notion of structural communities has also been extended to
include overlapping, hierarchical, and disassortative com-munity structures [6], [31]–[34].
Despite great progress in the field, we find that extend-
ing the traditional structural view to overlapping commu-
nities leads to an unnoticed consequence that nodes in
community overlaps are less densely connected than
nodes in the nonoverlapping parts of communities
[Fig. 2(b)]. (Refer to the extended version of the paper
[35] for details.) We find this hidden consequence to bepresent in many existing approaches to overlapping
community detection [6]–[11].
We examine a diverse set of six networks drawn from a
wide range of domains, including social, collaboration, and
copurchasing networks for which we obtain explicitly la-
beled functional communities, which we refer to as the
ground-truth communities [18]. For example, in social
networks, we take ground-truth communities to be socialinterest-based groups to which people explicitly join, and
in product networks, ground-truth communities are de-
fined to correspond to categories of products [35]. Note we
define ground-truth communities based on common func-
tions or roles around which networks organize into com-
munities [18]. Ground-truth communities are not defined
based on some observed attribute or property that the
nodes share (for example, age, gender, or hometown in acase of a social network) [6]. The idea behind ground-truth
communities is that they would correspond to true func-
tional modules in complex networks. While the obtained
ground-truth labels may sometimes be noisy or incom-
plete, consistency and robustness of the results suggestthat the ground-truth labels are overall reliable.1
By studying the structure of ground-truth communities
we find that two nodes are more likely to be connected if
they have multiple ground-truth communities in common
(Fig. 3). For example, in the LiveJournal online social
network (Table 1), the edge probability jumps from �10�6
for nodes that share no ground-truth communities to 0.1
for nodes that have one ground-truth community in com-mon and keeps increasing all the way to 0.7 as nodes share
more communities [Fig. 3(a)]. This implies that the area of
overlap between two communities has a higher average
density of edges than an area that falls in just a single
community [Fig. 2(c)].
Our observation is intuitive and consistent across
several domains. For example, proteins belonging to
multiple common functional modules are more likely tointeract [2], people who share multiple interests have a
higher chance of becoming friends [36], and researchers
with many common interests are more likely to
collaborate [36].
A. Defining Structural Communities as TilesWe think of communities as analogous to overlapping
‘‘tiles.’’ Thus, just as the overlap of two tiles leads to a
higher tile height in the overlapping area, the overlap of
two communities leads to higher density of edges in the
overlap. (Fig. 1 illustrates the concept.) The composition ofmany overlapping communities then gives rise to the
global structure of the network.
Conceptually, our methodology represents a shift in
perspective from structurally modeling communities as
sets of densely linked nodes to modeling communities as
overlapping tiles where the network emerges as a result of
the overlap of many communities. Our structural defini-
tion of communities departs from the strength of weak tiestheory [30] and is consistent with the earlier social
network theory called the web of group affiliations [37],
which postulates that edges arise due to shared community
affiliations.
Our findings here also have implications for the under-
standing of homophily, which is one of the primary forces
that shape the formation of social networks [36]. Homo-
phily is the tendency of individuals to connect to otherswith similar tastes and preferences. Based on [30], it has
been commonly assumed that homophily operates in
‘‘pockets,’’ and, thus, nodes that have neighbors in other
communities are less likely to share the attributes of
those neighbors [as in Fig. 2(a) and (b)]. In contrast, our
results are implying pluralistic homophily where the sim-
ilarity of nodes is proportional to the number of shared
memberships/functions, not just their similarity along a
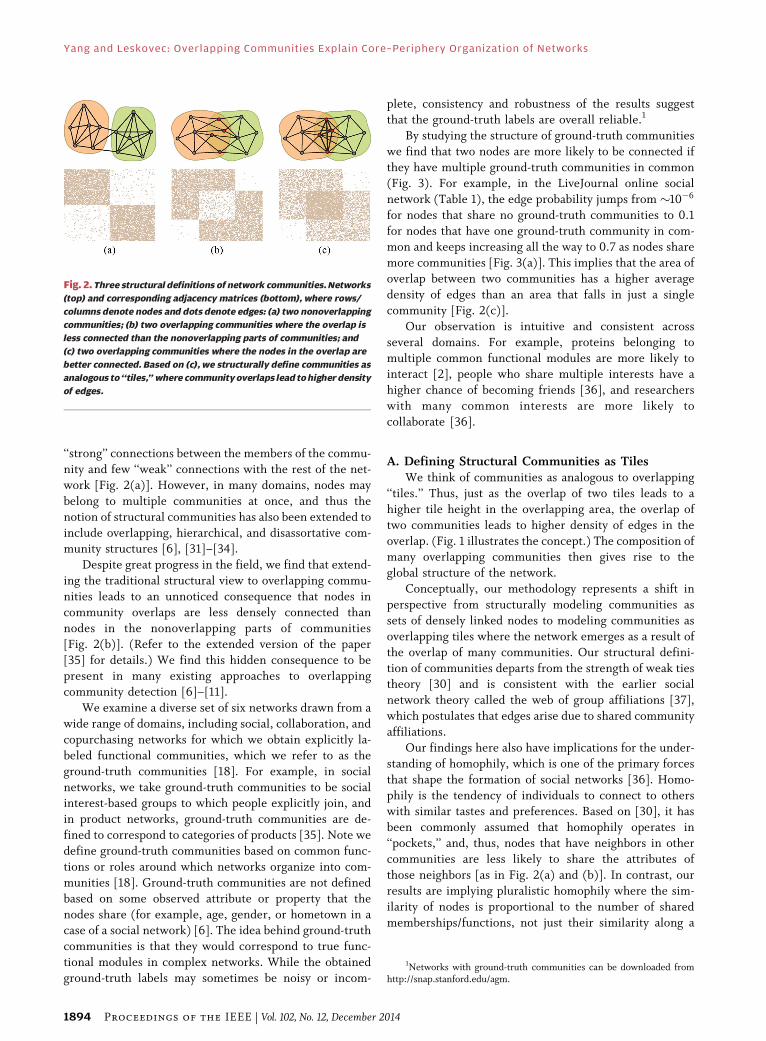
Fig. 2. Three structural definitions of network communities. Networks
(top) and corresponding adjacency matrices (bottom), where rows/
columns denote nodes and dots denote edges: (a) two nonoverlapping
communities; (b) two overlapping communities where the overlap is
less connected than the nonoverlapping parts of communities; and
(c) two overlapping communities where the nodes in the overlap are
better connected. Based on (c), we structurally define communities as
analogous to ‘‘tiles,’’ where community overlaps lead to higher density
of edges.
1Networks with ground-truth communities can be downloaded fromhttp://snap.stanford.edu/agm.
Yang and Leskovec: Overlapping Communities Explain Core–Periphery Organization of Networks
1894 Proceedings of the IEEE | Vol. 102, No. 12, December 2014

single dimension. In a multidimensional network, the
most central nodes are those that have the most shared
dimensions.
III . DECOMPOSITION OF NETWORKSINTO COMMUNITIES
In order to model communities in a network, we define the
AGM [19]. In our model, edges of the underlying network
arise due to shared community memberships [Fig. 4(a)]
[38], [39]. The AGM parameterizes each community Awith a single parameter pA. Two nodes that belong to
community A then form an edge in the underlying network
with probability pA. Each community A generates edges
between its members independently; however, if twonodes have already been connected, then the duplicate
edge is not included in the network.
The AGM naturally models communities with dense
overlaps [Fig. 4(a) and (b)]. Pairs of nodes that belong to
multiple common communities become connected in the
underlying network with a higher probability, since for
each shared community the nodes are given an indepen-
dent chance of forming an edge.
The flexible nature of the AGM allows for modeling a
wide range of network community structures, such as
nonoverlapping, hierarchically nested, and overlapping
communities [Fig. 4(c)–(e)]. Given a bipartite community
affiliation graph and a probability pA for each community
A, the AGM allows us to generate synthetic networks withrealistic community structures, a procedure useful in and
of itself.
Using the AGM, we can also identify and analyze com-
munity structure of real-world networks. We accomplish
decomposition of a given network into communities by
fitting the AGM to the network with tools of statistical
inference. We combine a maximum-likelihood approach
with convex optimization and a Monte Carlo sampling al-gorithm on the space of community affiliation graphs [19],
[35], [40]. This technique allows us to efficiently search for
the community affiliation graph that gives the observed
network the greatest likelihood. To automatically deter-
mine the number of communities in a given network, we
Table 1 Network Statistics and Properties of Detected Communities. We Consider the Facebook Ego-Network of a Particular User, the Full LiveJournal
Online Social Network, the Florida Bay Foodweb Network, the Stanford University Web Graph, the Literature-Curated Saccharomyces Cerevisiae
PPI Network, and the Amazon Product Copurchasing Network. Network Statistics: N: Number of Nodes; E: Number of Edges; hCi: Average Clustering
Coefficient; D: Effective Diameter; hki: Average Node Degree. Properties of Detected Communities: K: Number of Communities; hSi: AverageDetected Community Size; hAi: Average Number of Community Memberships Per Node. The Networks Vary From Those With Modular to Highly
Overlapping Community Structure and Represent a Wide Range of Edge Densities. While the Number of Communities Detected by AGM Varies, the
Average Community Size Is Quite Stable Across the Networks. Average Number of Community Memberships Per Node Reveals That Communities in the
Foodweb Overlap Most Pervasively, While in PPI and Social Networks Overlaps Are Smallest
Fig. 3. Community overlaps have higher edge density than the nonoverlapping parts of communities. Edge probability PðkÞ as a function of
the number of common community memberships k (a) in the social network and (b) in the product copurchasing network (Table 1). Results in
(a) and (b) suggest that, as nodes share multiple communities, they are more likely to be connected, which leads to higher edge density in
community overlaps, as illustrated in Fig. 2(c).
Yang and Leskovec: Overlapping Communities Explain Core–Periphery Organization of Networks
Vol. 102, No. 12, December 2014 | Proceedings of the IEEE 1895

apply techniques from statistical regularization and sparsemodel estimation [35].
IV. ACCURACY OF DETECTED COMMUNITIES
Next, we aim to infer functional communities based only
on the structure of a given unlabeled undirected network.
A. Qualitative EvaluationAs an illustrative example, we consider a Facebook
friendship network of a single user’s friends [Fig. 5(a)
and Table 1]. In order to obtain labels for ground-truth
communities, we asked the user to manually organize his
Facebook friends into communities. The user classified
his friends into four communities corresponding to his
Fig. 4. Community-affiliation graph model (AGM) [19]. (a) Squares represent communities and circles represent the nodes of a network.
Edges represent node community memberships. For each community A that two nodes share they create a link independently with probability pA.
The probability that a pair of nodes u, v creates a link is thus pðu;vÞ ¼ 1�Q
A2Cuvð1� pAÞ, where Cuv is the set of communities that u and v share.
If u and v do not share any communities, we assume they link with a small probability ". (b) Network generated by the AGM in (a). As pairs
of nodes that share multiple communities get multiple chances to create edges, the AGM naturally generates networks where nodes in the
community overlaps are more densely connected than the nodes in nonoverlapping regions. (c)–(e) AGM is capable of modeling any combination
of (c) nonoverlapping, (d) hierarchically nested, as well as (e) overlapping communities.
Fig. 5. An example on a Facebook friendship network of a particular user. (a) Facebook friendship network of a single user. (b) The same
network but with communities explicitly labeled by the user: high school friends, colleagues at the workplace, and university friends with whom
the user plays basketball and squash. Communities are denoted by filled regions. Note that nodes in the overlap of communities have higher
density of edges. (c)–(e) Results of applying (c) clique percolation, (d) link clustering, and (e) mixed-membership stochastic block model to the
Facebook network.
Yang and Leskovec: Overlapping Communities Explain Core–Periphery Organization of Networks
1896 Proceedings of the IEEE | Vol. 102, No. 12, December 2014

high school, workplace, and two communities of
university friends. The visualization of the same networkusing communities in Fig. 5(b) shows that the network
in Fig. 5(a) is in fact composed of the overlaps of the
four communities. In this example, the goal of commu-
nity detection is to identify the communities in Fig. 5(b)
based only on the connectivity structure of the network
in Fig. 5(a).
Due to an implicit assumption that nodes in commu-
nity overlaps are less densely connected than nodes in thenonoverlapping parts of communities [Fig. 2(a)], many
overlapping community detection approaches [6]–[11] fail
to properly detect communities in this network. For
example, Fig. 5(c)–(e) illustrates the result of applying
clique percolation [10], link clustering [6], and the mixed-
membership stochastic block (MMSB) model [7] to the
Facebook network in Fig. 5(a). We also give a formal
argument that explains the behavior of these methods inAppendix I-A and the extended version [35].
However, when we use the AGM to analyze the
Facebook network, the AGM automatically detects four
communities (Fig. 6), which is the same as the number
identified by the user. Moreover, the communities de-
tected by the AGM nearly perfectly correspond to com-
munities identified by the user. The AGM correctly
determines community overlaps and community member-ships for 94% of the user’s friends.
B. Quantitative EvaluationWe also perform a large-scale quantitative evaluation
on AGM on biological, social, collaboration, and productnetworks where functional communities are explicitly
labeled [18]. The networks represent a wide range of
sizes and edge densities, as well as amounts of
community overlap. We compare the AGM to a number
of widely used overlapping and nonoverlapping commu-
nity detection methods [6], [7], [10], [20] and quantify
the correspondence between the explicitly labeled
ground-truth communities and the communities detectedby a given method. The performance metrics quantify
the accuracy of the method in assigning nodes to their
ground-truth communities. (Refer to Appendix I-B for
further details.)
On a set of social, collaboration, and product
networks, AGM on average outperforms existing meth-
ods by 50% in four different metrics that quantify the
accuracy in assigning nodes to their ground-truthcommunities [Fig. 11(a)]. In particular, AGM gives a
50% relative improvement over clique percolation [10].
Link clustering [6] detects overlapping as well as
hierarchical communities and AGM improves 61% over
it. Similar levels of improvement are achieved when
comparing AGM to other overlapping and nonoverlap-
ping methods [7], [20]. Furthermore, AGM gives a 14%
relative improvement over link clustering using the samenetworks and the same data-driven benchmarks as used
in the link clustering work [6].
Furthermore, we also experiment with AGM on a set
of four different biological PPI networks. Remarkably,
even though AGM was developed based on insights
gained on primarily social networks, we find that AGM
performs surprisingly well on biological networks as
well. As performance metrics, we compute the averagestatistical significance of detected communities (p-value)
for the three types of gene ontology (GO) [41]. We con-
sider negative logarithm of average p-values for each of the
three GO term types as three separate scores. On average,
the AGM outperforms link clustering by 150%, the clique
percolation method (CPM) by 163%, Infomap by 148%,
and the MMSB model for 12 times [Fig. 11(b)]. Fur-
ther experimental details are in the Appendixes III, IV,and [35].
Overall, the AGM approach yields substantially more
accurate communities. The success of our approach
relies on the AGM’s flexible nature, which allows the
AGM to decompose a given network into a combina-
tion of overlapping, nonoverlapping, and hierarchical
communities.
V. COMMUNITIES, PLURALISTICHOMOPHILY, ANDCORE–PERIPHERY STRUCTURE
The AGM also makes it possible to gain well-founded in-
sights into the community structure of networks. In parti-
cular, we discover that overlapping communities lead to a
global core–periphery network structure. Core–peripherystructure captures the notion that many networks decom-
pose into a densely connected core and a sparsely con-
nected periphery [21], [22]. The core–periphery structure
is a pervasive and crucial characteristic of large networks
[23], [24], [42].
We discover that a network core forms as a result of
pluralistic homophily where the connectedness of nodes is
Fig. 6. AGM on the Facebook network from Fig. 5. AGM successfully
decomposes the network into different tiles (communities) and
correctly determines community overlaps as well as community
memberships for 94% of the nodes.
Yang and Leskovec: Overlapping Communities Explain Core–Periphery Organization of Networks
Vol. 102, No. 12, December 2014 | Proceedings of the IEEE 1897
proportional to the number of shared community member-
ships, and not just their similarity along a single dimension
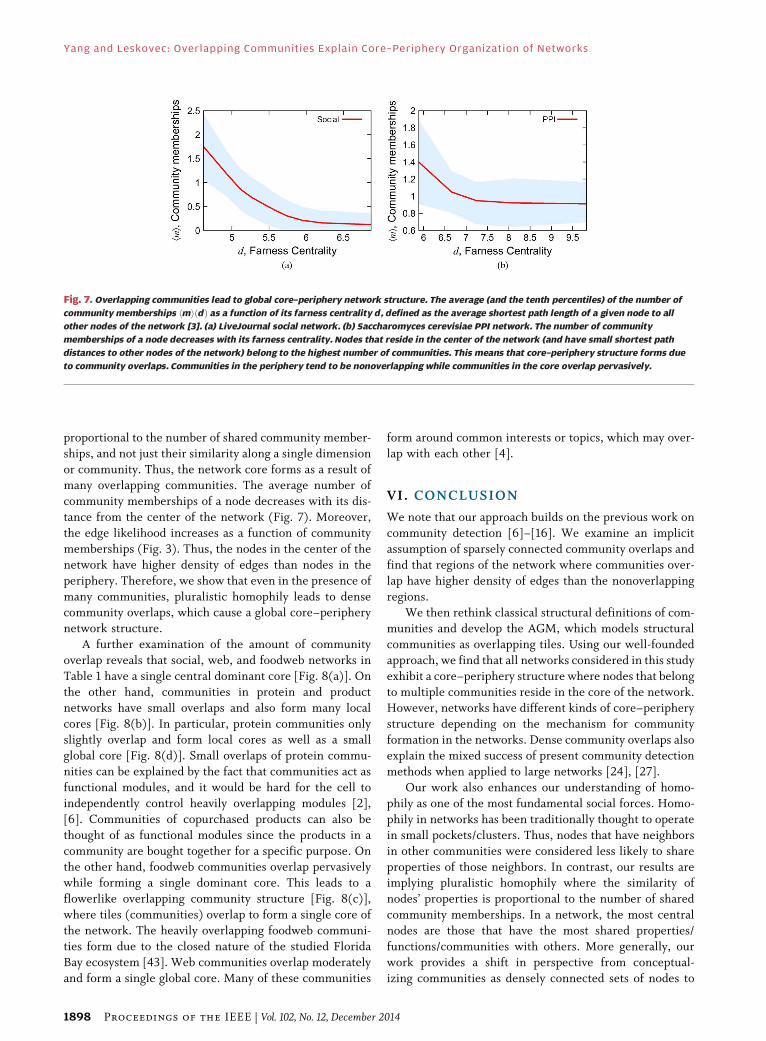
or community. Thus, the network core forms as a result ofmany overlapping communities. The average number of
community memberships of a node decreases with its dis-
tance from the center of the network (Fig. 7). Moreover,
the edge likelihood increases as a function of community
memberships (Fig. 3). Thus, the nodes in the center of the
network have higher density of edges than nodes in the
periphery. Therefore, we show that even in the presence of
many communities, pluralistic homophily leads to densecommunity overlaps, which cause a global core–periphery
network structure.
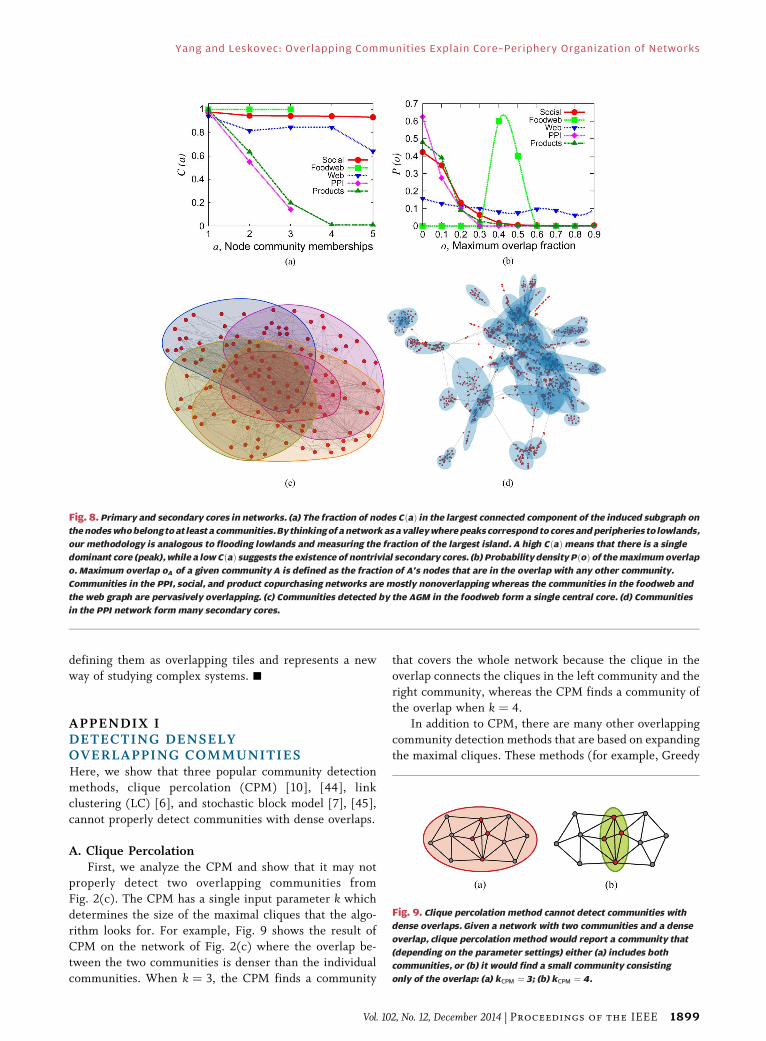
A further examination of the amount of community
overlap reveals that social, web, and foodweb networks in
Table 1 have a single central dominant core [Fig. 8(a)]. On
the other hand, communities in protein and product
networks have small overlaps and also form many local
cores [Fig. 8(b)]. In particular, protein communities onlyslightly overlap and form local cores as well as a small
global core [Fig. 8(d)]. Small overlaps of protein commu-
nities can be explained by the fact that communities act as
functional modules, and it would be hard for the cell to
independently control heavily overlapping modules [2],
[6]. Communities of copurchased products can also be
thought of as functional modules since the products in a
community are bought together for a specific purpose. Onthe other hand, foodweb communities overlap pervasively
while forming a single dominant core. This leads to a
flowerlike overlapping community structure [Fig. 8(c)],
where tiles (communities) overlap to form a single core of
the network. The heavily overlapping foodweb communi-
ties form due to the closed nature of the studied Florida
Bay ecosystem [43]. Web communities overlap moderately
and form a single global core. Many of these communities
form around common interests or topics, which may over-
lap with each other [4].
VI. CONCLUSION
We note that our approach builds on the previous work on
community detection [6]–[16]. We examine an implicit
assumption of sparsely connected community overlaps and
find that regions of the network where communities over-
lap have higher density of edges than the nonoverlapping
regions.
We then rethink classical structural definitions of com-munities and develop the AGM, which models structural
communities as overlapping tiles. Using our well-founded
approach, we find that all networks considered in this study
exhibit a core–periphery structure where nodes that belong
to multiple communities reside in the core of the network.
However, networks have different kinds of core–periphery
structure depending on the mechanism for community
formation in the networks. Dense community overlaps alsoexplain the mixed success of present community detection
methods when applied to large networks [24], [27].
Our work also enhances our understanding of homo-
phily as one of the most fundamental social forces. Homo-
phily in networks has been traditionally thought to operate
in small pockets/clusters. Thus, nodes that have neighbors
in other communities were considered less likely to share
properties of those neighbors. In contrast, our results areimplying pluralistic homophily where the similarity of
nodes’ properties is proportional to the number of shared
community memberships. In a network, the most central
nodes are those that have the most shared properties/
functions/communities with others. More generally, our
work provides a shift in perspective from conceptual-
izing communities as densely connected sets of nodes to
Fig. 7. Overlapping communities lead to global core–periphery network structure. The average (and the tenth percentiles) of the number of
community memberships hmiðdÞ as a function of its farness centrality d, defined as the average shortest path length of a given node to all
other nodes of the network [3]. (a) LiveJournal social network. (b) Saccharomyces cerevisiae PPI network. The number of community
memberships of a node decreases with its farness centrality. Nodes that reside in the center of the network (and have small shortest path
distances to other nodes of the network) belong to the highest number of communities. This means that core–periphery structure forms due
to community overlaps. Communities in the periphery tend to be nonoverlapping while communities in the core overlap pervasively.
Yang and Leskovec: Overlapping Communities Explain Core–Periphery Organization of Networks
1898 Proceedings of the IEEE | Vol. 102, No. 12, December 2014
defining them as overlapping tiles and represents a new
way of studying complex systems. h
APPENDIX IDETECTING DENSELYOVERLAPPING COMMUNITIESHere, we show that three popular community detection
methods, clique percolation (CPM) [10], [44], link
clustering (LC) [6], and stochastic block model [7], [45],
cannot properly detect communities with dense overlaps.
A. Clique PercolationFirst, we analyze the CPM and show that it may not
properly detect two overlapping communities from
Fig. 2(c). The CPM has a single input parameter k which
determines the size of the maximal cliques that the algo-
rithm looks for. For example, Fig. 9 shows the result of
CPM on the network of Fig. 2(c) where the overlap be-
tween the two communities is denser than the individual
communities. When k ¼ 3, the CPM finds a community
that covers the whole network because the clique in the
overlap connects the cliques in the left community and the
right community, whereas the CPM finds a community of
the overlap when k ¼ 4.In addition to CPM, there are many other overlapping
community detection methods that are based on expanding
the maximal cliques. These methods (for example, Greedy
Fig. 8. Primary and secondary cores in networks. (a) The fraction of nodes CðaÞ in the largest connected component of the induced subgraph on
the nodes who belong to at least a communities. By thinking of a network as a valley where peaks correspond to cores and peripheries to lowlands,
our methodology is analogous to flooding lowlands and measuring the fraction of the largest island. A high CðaÞmeans that there is a single
dominant core (peak), while a low CðaÞ suggests the existence of nontrivial secondary cores. (b) Probability density PðoÞ of the maximum overlap
o. Maximum overlap oA of a given community A is defined as the fraction of A’s nodes that are in the overlap with any other community.
Communities in the PPI, social, and product copurchasing networks are mostly nonoverlapping whereas the communities in the foodweb and
the web graph are pervasively overlapping. (c) Communities detected by the AGM in the foodweb form a single central core. (d) Communities
in the PPI network form many secondary cores.
Fig. 9. Clique percolation method cannot detect communities with
dense overlaps. Given a network with two communities and a dense
overlap, clique percolation method would report a community that
(depending on the parameter settings) either (a) includes both
communities, or (b) it would find a small community consisting
only of the overlap: (a) kCPM ¼ 3; (b) kCPM ¼ 4.
Yang and Leskovec: Overlapping Communities Explain Core–Periphery Organization of Networks
Vol. 102, No. 12, December 2014 | Proceedings of the IEEE 1899

clique expansion [46] and EAGLE [47]) also suffer from
the same problem.
B. Stochastic Block ModelsWe show that three variants of stochastic block models
are unable to correctly discover communities with dense
overlaps: the traditional stochastic block model [45], the
degree-corrected stochastic block model [48], and the
MMSB model [7]. Based on the input matrix from
Fig. 2(c), all three models identify three blocks, as illustrated
in Fig. 10. The reason for this is that the edge probability
between two nodes that belong to communities A and B isweighted average of PðA; AÞ and PðB; BÞ, where PðX; YÞ is an
edge probability between a node in community X and a node
in community Y. This means that the edge probability
between the two nodes that share multiple communities is
smaller than the maximum of PðA; AÞ and PðB; BÞ (due to the
weighted summation). Therefore, the edge probability
between overlapping nodes cannot be higher than the edge
probability between nodes in an individual community. Wealso note that in principle one could apply postprocessing of
communities detected by stochastic block models to identify
which of the detected structural communities actually
correspond to overlaps of functional communities. However,
it is not immediately clear how to develop such postproces-
sing method.
C. Link ClusteringLast, we show that link clustering [6] is not able to
correctly detect overlapping communities with dense over-laps. Link clustering performs hierarchical clustering with
the edges of the given network based on the Jaccard simi-
larity between the adjacent nodes of the edges. Since edge
density in the area of community overlap is higher, this
means that the Jaccard similarity between the adjacent
nodes will be higher, which in turn means that link clus-
tering will identify the edges in the overlap as a separate
community. (Refer to the extended version [35] for a moreformal argument.)
APPENDIX IIMETRICS OF COMMUNITYDETECTION ACCURACYWe focus the evaluation of community detection methods
on their ability to correctly identify overlapping ground-
truth communities.
To quantify the performance, we measure the level ofagreement between the detected and ground-truth com-
munities. Given a network GðV; EÞ, we consider a set of
ground-truth communities C� and a set of detected com-
munities C, where each ground-truth community Ci 2 C�
and each detected community Ci 2 C is defined by a set of
its member nodes. To compare C and C�, we use four
performance metrics.
1) Average F1 score [49]: We compute FgðCiÞ ¼maxj F1ðCi; CjÞ for each ground-truth community
Ci and FdðCiÞ ¼ maxj F1ðCj; CiÞ for each detected
community Ci, where F1ðS1; S2Þ is the harmonic
mean of precision and recall between two node
sets S1; S2. The average F1 score is ð1=2Þð �Fg þ �FdÞwhere �Fg ¼ ð1=jC�jÞ
Pi FgðCiÞ and �Fd ¼ ð1=jCjÞ�P
i FdðCiÞ.2) Omega index [50]: For each pair of nodes u; v 2 V,
we define Cuv to be the set of ground-truth com-
munities to which both u and v belong and Cuv to
be the set of detected communities to which both
nodes belong. Then, the omega index is
ð1=jVj2ÞP
u;v2V 1fjCuvj ¼ jCuvjg.3) Normalized mutual information [12]: We com-
pute 1�ð1=2ÞðHðC�jCÞþHðCjC�ÞÞ, where HðAjBÞis the extension of entropy when A; B are sets ofsets [12].
4) Accuracy in the number of communities:
1� ðjjC�j � jCjjÞ=jC�j, which is the relative error
in predicting the number of communities.
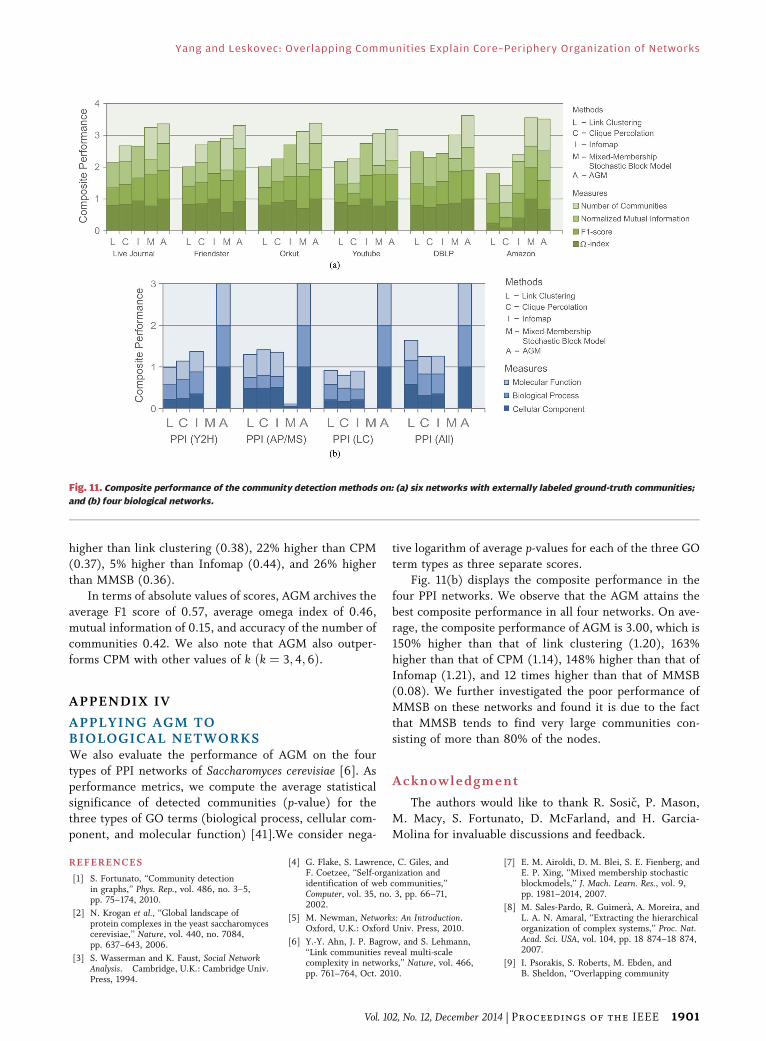
APPENDIX IIIAPPLYING AGM TO SOCIAL, PRODUCT,AND COLLABORATION NETWORKSFig. 11(a) displays the composite performance of each of
the five methods over the six networks with ground-truth
communities. Overall, we note that AGM gives best overall
performance on all networks, except the Amazon, where it
ties with MMSB. Furthermore, AGM detects highestquality communities for most individual performance me-
trics in all networks. On average, the composite perfor-
mance of AGM is 3.40, which is 61% higher than that of
link clustering (2.10), 50% higher than that of CPM (2.41),
30% higher than that of Infomap, and 8% higher than that
of MMSB (3.25). The absolute average value of omega
index of AGM over the six networks is 0.46, which is 21%
Fig. 10. The result of the stochastic block model and the
mixed-membership stochastic block model on a network of two
communities with dense overlap. The adjacency matrix of the network
in Fig. 2(c) is shown, and the bold lines denote the three partitions
discovered by the stochastic block models, where the overlap is
confused as a separate community.
Yang and Leskovec: Overlapping Communities Explain Core–Periphery Organization of Networks
1900 Proceedings of the IEEE | Vol. 102, No. 12, December 2014
higher than link clustering (0.38), 22% higher than CPM
(0.37), 5% higher than Infomap (0.44), and 26% higher
than MMSB (0.36).
In terms of absolute values of scores, AGM archives the
average F1 score of 0.57, average omega index of 0.46,
mutual information of 0.15, and accuracy of the number of
communities 0.42. We also note that AGM also outper-
forms CPM with other values of k ðk ¼ 3; 4; 6Þ.
APPENDIX IV
APPLYING AGM TOBIOLOGICAL NETWORKSWe also evaluate the performance of AGM on the four
types of PPI networks of Saccharomyces cerevisiae [6]. As
performance metrics, we compute the average statisticalsignificance of detected communities (p-value) for the
three types of GO terms (biological process, cellular com-
ponent, and molecular function) [41].We consider nega-
tive logarithm of average p-values for each of the three GO
term types as three separate scores.
Fig. 11(b) displays the composite performance in the
four PPI networks. We observe that the AGM attains the
best composite performance in all four networks. On ave-
rage, the composite performance of AGM is 3.00, which is
150% higher than that of link clustering (1.20), 163%
higher than that of CPM (1.14), 148% higher than that ofInfomap (1.21), and 12 times higher than that of MMSB
(0.08). We further investigated the poor performance of
MMSB on these networks and found it is due to the fact
that MMSB tends to find very large communities con-
sisting of more than 80% of the nodes.
Acknowledgment
The authors would like to thank R. Sosic, P. Mason,
M. Macy, S. Fortunato, D. McFarland, and H. Garcia-
Molina for invaluable discussions and feedback.
RE FERENCES
[1] S. Fortunato, ‘‘Community detectionin graphs,’’ Phys. Rep., vol. 486, no. 3–5,pp. 75–174, 2010.
[2] N. Krogan et al., ‘‘Global landscape ofprotein complexes in the yeast saccharomycescerevisiae,’’ Nature, vol. 440, no. 7084,pp. 637–643, 2006.
[3] S. Wasserman and K. Faust, Social NetworkAnalysis. Cambridge, U.K.: Cambridge Univ.Press, 1994.
[4] G. Flake, S. Lawrence, C. Giles, andF. Coetzee, ‘‘Self-organization andidentification of web communities,’’Computer, vol. 35, no. 3, pp. 66–71,2002.
[5] M. Newman, Networks: An Introduction.Oxford, U.K.: Oxford Univ. Press, 2010.
[6] Y.-Y. Ahn, J. P. Bagrow, and S. Lehmann,‘‘Link communities reveal multi-scalecomplexity in networks,’’ Nature, vol. 466,pp. 761–764, Oct. 2010.
[7] E. M. Airoldi, D. M. Blei, S. E. Fienberg, andE. P. Xing, ‘‘Mixed membership stochasticblockmodels,’’ J. Mach. Learn. Res., vol. 9,pp. 1981–2014, 2007.
[8] M. Sales-Pardo, R. Guimera, A. Moreira, andL. A. N. Amaral, ‘‘Extracting the hierarchicalorganization of complex systems,’’ Proc. Nat.Acad. Sci. USA, vol. 104, pp. 18 874–18 874,2007.
[9] I. Psorakis, S. Roberts, M. Ebden, andB. Sheldon, ‘‘Overlapping community
Fig. 11. Composite performance of the community detection methods on: (a) six networks with externally labeled ground-truth communities;
and (b) four biological networks.
Yang and Leskovec: Overlapping Communities Explain Core–Periphery Organization of Networks
Vol. 102, No. 12, December 2014 | Proceedings of the IEEE 1901

detection using Bayesian non-negativematrix factorization,’’ Phys. Rev. E, vol. 83,2011, 066114.
[10] G. Palla, I. Derenyi, I. Farkas, and T. Vicsek,‘‘Uncovering the overlapping communitystructure of complex networks in natureand society,’’ Nature, vol. 435, no. 7043,pp. 814–818, 2005.
[11] T. S. Evans and R. Lambiotte, ‘‘Linegraphs, link partitions, and overlappingcommunities,’’ Phys. Rev. E, vol. 80, 2009,Art. ID. 016105.
[12] A. Lancichinetti and S. Fortunato,‘‘Community detection algorithms:A comparative analysis,’’ Phys. Rev. E,vol. 80, no. 5, 2009, 056117.
[13] V. D. Blondel, J.-L. Guillaume, R. Lambiotte,and E. Lefebvre, ‘‘Fast unfolding ofcommunities in large networks,’’ J. Stat.Mech., Theory Exp., vol. 2008, no. 10,2008, P10008.
[14] M. Newman and M. Girvan, ‘‘Finding andevaluating community structure in networks,’’Phys. Rev. E, vol. 69, 2004, 026113.
[15] P. J. Mucha, T. Richardson, K. Macon,M. A. Porter, and J.-P. Onnela, ‘‘Communitystructure in time-dependent, multiscale,and multiplex networks,’’ Science, vol. 328,no. 5980, pp. 876–878, 2010.
[16] C. Granell, S. Gomez, and A. Arenas,‘‘Hierarchical multiresolution method toovercome the resolution limit in complexnetworks,’’ Int. J. Bifurcat. Chaos, vol. 22,no. 7, 2012, 1250171.
[17] B. Ball, B. Karrer, and M. E. J. Newman,‘‘Efficient and principled method for detectingcommunities in networks,’’ Phys. Rev. E,vol. 84, 2011, 036103.
[18] J. Yang and J. Leskovec, ‘‘Defining andevaluating network communities based onground-truth communities,’’ in Proc. IEEEInt. Conf. Data Mining, 2012, pp. 745–754.
[19] J. Yang and J. Leskovec,‘‘Community-affiliation graph modelfor overlapping network communitydetection,’’ in Proc. IEEE Int. Conf.Data Mining, 2012, pp. 1170–1175.
[20] M. Rosvall and C. T. Bergstrom, ‘‘Mapsof random walks on complex networks revealcommunity structure,’’ Proc. Nat. Acad. Sci.USA, vol. 105, pp. 1118–1123, 2008.
[21] S. P. Borgatti and M. G. Everett, ‘‘Modelsof core/periphery structures,’’ Social Netw.,vol. 21, pp. 375–395, 1999.
[22] P. Holme, ‘‘Core-periphery organization ofcomplex networks,’’ Phys. Rev. E, vol. 72,2005, 046111.
[23] F. D. Rossa, F. Dercole, and C. Piccardi,‘‘Profiling core-periphery network structure
by random walkers,’’ Sci. Rep., vol. 3, 2013,DOI: 10.1038/srep01467.
[24] J. Leskovec, K. J. Lang, A. Dasgupta, andM. W. Mahoney, ‘‘Community structure inlarge networks: Natural cluster sizes andthe absence of large well-defined clusters,’’Internet Math., vol. 6, no. 1, pp. 29–123,2009.
[25] A. Clauset, M. Newman, and C. Moore,‘‘Finding community structure in verylarge networks,’’ Phys. Rev. E, vol. 70, 2004,066111.
[26] M. Coscia, G. Rossetti, F. Giannotti, andD. Pedreschi, ‘‘Demon: A local-first discoverymethod for overlapping communities,’’ inProc. ACM SIGKDD Int. Conf. Knowl. Disc.Data Mining, 2012, pp. 615–623.
[27] J. Leskovec, K. Lang, and M. Mahoney,‘‘Empirical comparison of algorithms fornetwork community detection,’’ in Proc. Int.Conf. World Wide Web, 2010, pp. 631–640.
[28] D. Watts and S. Strogatz, ‘‘Collectivedynamics of small-world networks,’’Nature, vol. 393, pp. 440–442, 1998.
[29] J. A. Davis, ‘‘Clustering and StructuralBalance in Graphs,’’ Human Relations,vol. 20, pp. 181–187, 1967.
[30] M. S. Granovetter, ‘‘The strength ofweak ties,’’ Amer. J. Sociol., vol. 78,pp. 1360–1380, 1973.
[31] A. Clauset, C. Moore, and M. Newman,‘‘Hierarchical structure and the predictionof missing links in networks,’’ Nature,vol. 453, no. 7191, pp. 98–101, 2008.
[32] F. Radicchi, C. Castellano, F. Cecconi,V. Loreto, and D. Parisi, ‘‘Defining andidentifying communities in networks,’’Proc. Nat. Acad. Sci. USA, vol. 101, no. 9,pp. 2658–2663, 2004.
[33] J. Yang, J. McAuley, and J. Leskovec,‘‘Community detection in networks withnode attributes,’’ in Proc. IEEE Int. Conf.Data Mining, 2013, pp. 1151–1156.
[34] J. J. Yang, McAuley, and J. Leskovec,‘‘Detecting cohesive and 2-mode communitiesin directed and undirected networks,’’ inProc. ACM Int. Conf. Web Search Data Mining,2014, pp. 323–332.
[35] J. Yang and J. Leskovec, ‘‘Structure andoverlaps of communities in networks,’’Stanford InfoLab, Tech. Rep., Oct. 2014.[Online]. Available: http://snap.stanford.edu/agm
[36] M. McPherson, L. Smith-Lovin, andJ. M. Cook, ‘‘Birds of a feather: Homophilyin social networks,’’ Annu. Rev. Sociol.,vol. 27, pp. 415–444, 2001.
[37] G. Simmel, Conflict: The Web of GroupAffiliations, Trans. by Kurt H. Wolff and
Reinhard Bendix. Florence, MA, USA:Free Press, 1955.
[38] R. L. Breiger, ‘‘The duality of personsand groups,’’ Social Forces, vol. 53, no. 2,pp. 181–190, 1974.
[39] S. Lattanzi and D. Sivakumar, ‘‘Affiliationnetworks,’’ in Proc. 41st Annu. ACM Symp.Theory Comput., 2009, pp. 427–434.
[40] J. Yang and J. Leskovec, ‘‘Overlappingcommunity detection at scale: A non-negativefactorization approach,’’ in Proc. ACMInt. Conf. Web Search Data Mining, 2013,pp. 587–596.
[41] E. Boyle et al., ‘‘GO::TermFinderVOpensource software for accessing gene ontologyinformation and finding significantly enrichedgene ontology terms associated with a listof genes,’’ Bioinformatics, vol. 20, no. 18,pp. 3710–3715, 2004.
[42] M. P. Rombach, M. A. Porter, J. H. Fowler,and P. J. Mucha, ‘‘Core-periphery structurein networks,’’ SIAM J. Appl. Math., vol. 74,no. 1, pp. 167–190, 2014.
[43] R. E. Ulanowicz, C. Bondavalli, andM. S. Egnotovich, ‘‘Network analysis oftrophic dynamics in south Florida ecosystem,FY 97: The Florida Bay ecosystem,’’ Annu.Rep. U.S. Geol. Service Biol. Resources Div.,1998, pp. 98–123.
[44] S. Lehmann, M. Schwartz, and L. K. Hansen,‘‘Biclique communities,’’ Phys. Rev. E,vol. 78, 2008, 016108.
[45] P. W. Holland, K. B. Laskey, and S. Leinhardt,‘‘Stochastic blockmodels: First steps,’’ SocialNetw., vol. 5, no. 2, pp. 109–137, 1983.
[46] C. Lee, F. Reid, A. McDaid, and N. Hurley,‘‘Detecting highly overlapping communitystructure by greedy clique expansion,’’ in Proc.4th SNA-KDD Workshop, pp. 33–42, 2010.
[47] H. Shen, X. Cheng, K. Cai, and M.-B. Hu,‘‘Detect overlapping and hierarchicalcommunity structure in networks,’’Physica A, Stat. Mech. Appl., vol. 388, no. 8,pp. 1706–1712, 2009.
[48] B. Karrer and M. Newman, ‘‘Stochasticblockmodels and community structurein networks,’’ Phys. Rev. E, vol. 83, 2010,016107.
[49] C. D. Manning, P. Raghavan, and H. Schutze,Introduction to Information Retrieval.Cambridge, U.K.: Cambridge Univ. Press,2008.
[50] S. Gregory, ‘‘Fuzzy overlapping communitiesin networks,’’ J. Stat. Mech., Theory Exp.,vol. 2011, no. 2, 2011, P02017.
ABOUT THE AUT HORS
Jaewon Yang received the B.S. degree in electri-
cal engineering from Seoul National University,
Seoul, Korea and the M.S. degree in statistics and
the Ph.D. degree in electrical engineering from
Stanford University, Stanford, CA, USA.
He is a Research Scientist at LinkedIn. His
research interests include network community
detection, matrix factorization, and recommender
systems.
Dr. Yang received the SIGKDD doctoral disser-
tation award in 2014 and the IEEE ICDM best paper award in 2010.
Jure Leskovec received the B.S. degree in com-
puter science from the University of Ljubljana,
Ljubljana, Slovenia, the Ph.D. degree in machine
learning from Carnegie Mellon University,
Pittsburgh, PA, USA, and postdoctoral training
from Cornell University, Ithaca, NY, USA.
He is an Assistant Professor of Computer Science
at Stanford University. His research focuses on
mining large social and information networks.
Problems he investigates are motivated by large
scale data, the Web, and online media.
Dr. Leskovec received several awards including a Microsoft Research
Faculty Fellowship, the Alfred P. Sloan Fellowship, and numerous best
paper awards.
Yang and Leskovec: Overlapping Communities Explain Core–Periphery Organization of Networks
1902 Proceedings of the IEEE | Vol. 102, No. 12, December 2014