ion separation from dilute electrolyte solutions by
TRANSCRIPT

PH0100008
Ion Separation from Dilute Electrolyte Solutions By Nanofiltration
A Dissertation By:
Corazon M. GarciaB.S.ChE, MEE
Submitted to the Graduate DivisionCollege of Engineering
University of the Philippines
In Partial Fulfillment of the RequirementsFor the Degree of Doctor of Philosophy
(Chemical Engineering)
College of EngineeringUniversity of the Philippines
Diliman, Quezon City
March 2000

PLEASE BE AWARE THATALL OF THE MISSING PAGES IN THIS DOCUMENT
WERE ORIGINALLY BLANK

APPROVAL SHEET
This dissertation, entitled "ION SEPARATION FROM DILUTEELECTROLYTE SOLUTIONS BY NANOFILTRATION" prepared and submittedby CORAZON M. GARCIA, in partial fulfillment of the requirements for the degree ofDOCTOR OF PHILOSOPHY (Chemical Engineering) is hereby accepted.
DR. JONATHAN L. SALVACIONDissertation Adviser and Chairman
Doctoral Examination Panel
DR. RCFTNO C1LIRAGDoctors L Examination Panel
DR. ARTURO B. CORTEZDoctoral Examination Panel
DR. ANALIZA P. ROLLONDoctoral Examination Panel
DR. WILFREDO I. JOSEDoctoral Examination Panel
Accepted as partial fulfillment of the requirements for the degree of DOCTOROF PHILOSOPHY (Chemical Engineering).
PROF.E!Dean
College of EngineeringUniversity of the Philippines
ACIO

ACKNOWLEDGEMENT
Above all things, I would like to thank and praise the Almighty God Jehovah for Hislove and provisions. He is the source of wisdom and knowledge that made all this wonderfulthings possible.
I would like to acknowledge the support of Professor Anthony G. Fane, Director of theUNESCO Research Center for Membrane Science and Technology, Univesity of New SouthWales, Sydney, Australia, who did the supervisions of the experimental and laboratory aspects ofthis research.
The support and company of the following nice people from UNSW, Sydney, Australiawill always be remembered: Dr. Mark Wainwright and staff, Mary, Ann, Barbara Carter, Dr.Barry Edenborough and Keith.
I would like to thank Dr. Rufino C. Lirag who was my original dissertation adviser forhis support and suggestions. His effort has helped me a lot in carrying-out my research plans.
The tactfulness of Dr. Arturo B. Cortes in reviewing my report is very much appreciated.He has done a great deal of job in helping me set the right attitude and approach in presentingmy research work in writing.
I would like to thank also Dr. Jonathan L. Salvacionfor making tight situations easier tohandle.
Thank you to Dr. Estrella F. Alabastro and the entire staff ofDOST-ESEP for thescholarships and moral support.

ABSTRACT
Nanofiltration (NF) is a pressure-driven process which is considered potential for the
separation of ionic species selectively from solutions containing mixture of electrolyte solutes.
The lower operating pressure requirement of NF than reverse osmosis (RO) makes the earlier
potentially economical.
In the separation of ions, many authors believed that there are membranes with
characteristic fixed surface charge and that the mechanism of separation of ions is by the
differences in valences of the ions.
In this study, experiments involving dilute single-solute and multiple-solute electrolyte
solutions were performed using three different NF membranes. Permeate fluxes and ion rejections
of the different species of ions in samples of permeate solutions were measured at varied
conditions. The mechanism of separation in NF was determined based on the analysis of the
trends and behavior of ion rejection relative to the solution temperature, pressure, type of solute,
feed concentration and feed solution pH. The results of the experiments show that there is no
evidence of the presence of fixed surface charge on the NF membranes. Ion separation was made
possible by the combination of sieve effect and ion-hydration effect. Ions having higher hydration
numbers showed higher ion rejection than those having lower hydration numbers.
A method to determine the effective membrane pore size of NF membranes using
hydrodynamic model was proposed. The proposed method is based on the assumptions that the
membrane is neutral and that the separation is based on sieving effect.

TABLE OF CONTENTS
Title Page
ACKNOWLEDGEMENT i
ABSTRACT ii
TABLE OF CONTENTS iii
LIST OF TABLES vi
LIST OF FIGURES vii
Chapter 1 INTRODUCTION 1
1.1 Background 1
1.2 Statement of the Problem 5
1.3 Objectives 6
1.4 Scope and Limitations 7
Chapter 2 REVIEW OF RELATES LITERATURE 9
2.1 Studies on Charged UF Membranes 9
2.2 Studies Made on Reverse Osmosis 14
2.3 Previous Studies Made on Nanofiltration 20
2.4 Theoretical Consideration 21
2.4.1 Membrane Principles 21
2.4.2 Electrolyte Solution 25
Chapter 3 EXPERIMENT METHODS 27
3.1 Introduction 27
3.2 Materials and Equipment 28
3.3 Laboratory Procedures 31
3.3.1 Membrane Preparation, Installation and Maintenance 31
3.3.2 Preparation of Solutions 3 3
3.4 Experimental Procedures 34
3.5 Analytical Procedures 38
in

Chapter 4 DISCUSSIONS OF RESULTS 39
4.1 Water Flux and Solvent Permeability 39
4.2 Permeate Flux of Electrolyte Solutions 41
4.2.1 Effect of Time on Flux Measurement 41
4.2.2 Permeate Flux and Temperature 41
4.2.3 Permeate Flux and Feed Solution Concentration 42
4.2.4 Permeate Flux and Pressure 45
4.2.5 Permeate Flux and Feed Solution pH 50
4.3 Separation Mechanism from the Analysis of Rejection Data 52
4.3.1 Introduction 52
A. The Ion hydration Model 53
B. Ion Adsorption on a Neutral Surface 53
4.3.2 Ion Separation in Solutions of Single Electrolyte Solutes 53
A. Ion Rejection and Time 53
B. Reproducibility of Ion Rejection
and Retention of Ions In the Membrane 54
C. Charge Separation 57
D. Comparison of Cations Rejections
in Solutions with Single Electrolyte Solutes 64
E. Effect of Temperature on Ion Rejection 66
F. Effect of Applied Pressure on Ion Rejection 68
G. Effects of pH in Solutions
Containing Single Electrolyte Solutes 70
4.3.3 Solutions with Mixture of Different Electrolyte Solutes 75
4.4 Microscopic Investigation of Nanofiltration Membranes 87
4.5 Characterization of NF Membrane from Flux and Rejection Data 90
4.5.1 Introduction 90
4.5.2 Transport in Neutral Porous Membrane 90
4.5.3 Calculation of Membrane Effective Pore Size 96
4.5.4 Fitting Experimental Data Into The Model 98
4.6 UF, RO, andNF 104
4.6.1 Introduction 104
4.6.2 Comparison Between NF and UF 104
IV

4.6.3 Comparison Between NF and RO 105
Chapter 5 CONCLUSIONS 108
Symbols and Abbreviations 111
List of References 113
Appendices 118
A. Membrane Properties and Module Design 119
B. Computer Programs 127
C. Equipment and Instruments in Membrane Experiments 134

LIST OF TABLES
Table No. Title Page
Table 1.1
Table 1.2
Table 1.3
Table 2.4.1
Table 3.4.la
Table 3.4.1b
Table 3.4. lc
Table 3.4. Id
Table 3.5.1
Table 4.5.1
Table 4.5.2
Table 4.5.3
Ranges in Membrane Separation Processes.
Net driving pressure equivalent to 50 ml/min.
for some NF and RO membranes.
Reported Salt Rejections of Some UF, NF and
RO Membranes
Some Properties of Ions that may be Relevant in
Predicting the Mechanism of Ion Separation in NF
Operating Conditions for Experiments Involving Pure
Water as Feed
Operating Conditions Used in Experiments on
Solutions of Single Electrolyte Solute
List of Operating Conditions Used in Experiments
Involving Solutions Having a Combination of Two
Different Electrolyte Solutes.
List of Operating Conditions Used in Experiments
Involving Solutions Having a Combination of Three
Different Electrolyte Solutes.
Selected Variable Parameters in A AS Operation.
Expansion Coefficients for Hydrodynamic Functions
Summary of Results of Fitting Chloride Salts
Experimental Rejection Data into the
Hydrodynamic Model.
Comparison of the Results of Hydrodynamic
Model Curve-fitting Obtained from NaCl
rejection data with that obtained from Na2SO4
rejection data.
26
35
36
37
37
38
93
100
102
VI

LIST OF FIGURES
Figure No. Title Page
Figure 1.1 Membrane Structure
Figure 2.2.1 Normalized flux (Jv-Ax/Ak) against Cl" rejection
in NaCl solution.
Figure 2.3.1 pH versus zeta potential in nanofiltration membranes
based on Childress et al. (1996).
Figure 2.4.1 Schematic diagram illustrating co-ion rejection model
as predicted by Tsuru et al. (1991).
Figure 2.4.2 Schematic model for hydration of ion based on
Frank and Wen (1957).
Figure 3.2.1 The membrane cell used in the experiments on NF operation.
Figure 3.2.2 Flow diagram of the laboratory set-up.
Figure 3.2.3 Equipment used in the experiments on nanofiltration operation.
Figure 4.1.1 Water flux vs. pressure differential for different membranes
(MPT-34, NF-70, and TFC-SR).
Figure 4.2.1 Permeate Flux behavior with temperature for different
NF membranes using 500ppm NaCl.
Figure 4.2.2a Permeate flux vs. feed concentration in MPT-34
for different solutes.
Figure 4.2.2b Permeate flux vs. feed concentration in NF-70
for different solutes.
Figure 4.2.2c Permeate flux vs. feed concentration in TFC-SR
for different solutes.
Figure 4.2.3a Permeate flux vs. pressure differential in MPT-34
for pure water and 8.55 x 1E-3 mols/L solutions of
single solute containing NaCl, Na2SC>4, CsCl, and CoCl2
at various pressures and constant temperature of 30°C.
18
21
22
25
29
30
31
40
42
43
44
44
46
vn

Figure No. Title Page
Figure 4.2.3b Permeate flux vs. pressure differential in NF-70 for
pure water and 8.55 x 1E-3 mols/L solutions of
single solute containing NaCl, Na2SO4, CsCl, and CoCl2
at various pressures and constant temperature of 30°C. 47
Figure 4.2.3c Permeate flux vs. pressure differential in TFC-SR
for pure water and 8.55 x 1E-3 mols/L solutions of
single solute containing NaCl, Na2SO4, CsCl, and CoCl2
at various pressures and constant temperature of 30°C. 48
Figure 4.2.4a Permeate flux vs. feed solution pH obtained in passing
500 ppm NaCl solution through MPT-34. 50
Figure 4.2.4b Permeate flux vs. feed solution pH obtained in passing
500 ppm NaCl solution through TFC-SR. 51
Figure 4.3.1a Ion rejection vs. feed concentration in MPT-34
for two cycles: cycle 1 starts with clean membrane
and cycle 2 is just a replicate of the first cycle
but started immediately upon completion of
cycle 1 without cleaning the membrane. 55
Figure 4.3. lb Ion rejection vs. feed concentration in NF-70
for two cycles: cycle 1 starts with clean membrane
and cycle 2 is just a replicate of the first cycle
but started immediately upon completion of
cycle 1 without cleaning the membrane. 55
Figure 4.3.1c Ion rejection vs. feed concentration in TFC-SR
for two cycles: cycle 1 starts with clean membrane
and cycle 2 is just a replicate of the first cycle
but started immediately upon completion of
cycle 1 without cleaning the membrane. 56
Figure 4.3.2a Ion rejection vs. feed concentration in passing NaCl
solution through MPT-34. 58
viu

Figure No. Title Page
Figure 4.3.2b Ion rejection vs. feed concentration in passing Na2SO4
solution through MPT-34. 5 8
Figure 4.3.2c Ion rejection vs. feed concentration in passing CsCl
solution through MPT-34. 59
Figure 4.3,2d Ion rejection vs. feed concentration in passing CoCl2
solution through MPT-34. 59
Figure 4.3.3a Ion rejection vs. feed concentration in passing NaCl
solution through NF-70. 60
Figure 4.3.3b Ion rejection vs. feed concentration in passing CsCl
solution through NF-70. 60
Figure 4.3.3c Ion rejection vs. feed concentration in passing CoC12
solution through NF-70. 61
Figure 4.3.4a Ion rejection vs. feed concentration in passing NaCl
solution through TFC-SR. 61
Figure 4.3.4b Ion rejection vs. feed concentration in passing NajSCU
solution through TFC-SR. 62
Figure 4.3.4c Ion rejection vs. feed concentration in passing CsCl
solution through TFC-SR. 62
Figure 4.3.4d Ion rejection vs. feed concentration in passing CoCl2
solution through TFC-SR. 63
Figure 4.3.5a Cation rejection vs. feed concentration in solutions of
single electrolyte solute in MPT-34 at operating
pressure of 1000 KPa and solution temperature of 30°C. 65
Figure 4.3.5b Cation rejection vs. feed concentration in solutions of
single electrolyte solute in NF-70 at operating pressure
of 400 KPa and solution temperature of 30°C. 65
Figure 4.3.5c Cation rejection vs. feed concentration in solutions of
single electrolyte solute in TFC-SR at operating pressure
of 400 KPa and solution temperature of 30°C. 66
IX

Figure No. Title Page
Figures 4.3.6a Na+ rejection vs. operating temperature obtained by passing
500 ppm NaCl solution through the different membranes,
namely MPT-34, NF-70 and TFC-SR. 67
Figures 4.3.6b Cl" rejection vs. operating temperature obtained by passing
500 ppm NaCl solution through the different membranes,
namely MPT-34, NF-70 and TFC-SR. 67
Figure 4.3.7a Cl" rejection vs. applied pressure obtained by passing
feed solution of single solute having concentration
of 8.55 x 10"3 mols/L at temperature of 30°C through
MPT-34 membrane. 68
Figure 4.3.7b Cl" rejection vs. applied pressure obtained by passing
feed solution of single solute having concentration
of 8.55 x 10"3 mols/L at temperature of 30°C through
NF-70 membrane. 69
Figure 4.3.7c Cl" rejection vs. applied pressure obtained by passing
feed solution of single solute having concentration
of 8.55 x 10~3 mols/L at temperature of 30°C through
TFC-SR membrane. 69
Figure 4.3.8 pH versus zeta potential in nanofiltration membranes
with reference to the findings of Childress, et al. (1996). 70
Figure 4.3.9a Rejection of Na+ and Cl" in MPT-34 at various pH levels. 71
Figure 4.3.9b Rejection of Na+ and Cl" in TFC-SR at various pH levels. 71
Figure 4.3.10 pH Difference resulting from the adjustment of
feed solution pH 73
Figure 4.3.lla Ion rejection vs. feed concentration obtained in passing
NaCl-Na2SO4 (in 1:1 mole ratio) solution through
MPT-34 at operating pressure of 1000 KPa and solution
temperature of 30°C. 76
Figure 4.3.1 lb Ion rejection vs. feed concentration obtained in passing
NaCl-Na2SO4 (in 1:1 mole ratio) solution through
NF-70 at operating pressure of 400 KPa and solution
temperature of 30°C. 77

Figure No. Title Page
Figure 4.3.11c Ion rejection vs. feed concentration obtained in passing
NaCl-Na2SO4 (in 1:1 mole ratio) solution through
TFC-SR at operating pressure of 400 KPa and solution
temperature of 30°C. 77
Figure 4.3.12a Ion rejection vs. feed concentration obtained in passing
NaCl-CsCl (in 1:1 mole ratio) solution through MPT-34
at operating pressure of 1000 KPa and solution
temperature of 30°C. 78
Figure 4.3.12b Ion rejection vs. feed concentration obtained in passing
NaCl-CsCl (in 1:1 mole ratio) solution through NF-70
at operating pressure of 400 KPa and solution
temperature of 30°C. 79
Figure 4.3.12c Ion rejection vs. feed concentration obtained in passing
NaCl-CsCl (in 1:1 mole ratio) solution through TFC-SR
at operating pressure of 400 KPa and solution
temperature of 30°C. 79
Figure 4.3.13a Ion rejection vs. feed concentration obtained in passing
solution of NaCl-CoCl2 (in 1:1 mole ratio) through
MPT-34 membrane. 80
Figure 4.3.13b Ion rejection vs. feed concentration obtained in passing
solution of NaCl-CoCl2 (in 1:1 mole ratio) through
NF-70 membrane. 81
Figure 4.3.13c Ion rejection vs. feed concentration obtained in passing
solution of NaCl-CoCl2 (in 1:1 mole ratio) through
TFC-SR membrane. 81
Figure 4.3.14a Ion rejection vs. feed concentration obtained in passing
solution of CsCl-CoCl2 (in 1:1 mole ratio) through
MPT-34 membrane. 82
Figure 4.3.14b Ion rejection vs. feed concentration obtained in passing
solution of CsCl-CoCl2 (in 1:1 mole ratio) through
NF-70 membrane. 83
XI

Figure No. Title Page
Figure 4.3.14c Ion rejection vs. feed concentration obtained in passing
solution of CsCl-CoCl2 (in 1:1 mole ratio) through
TFC-SR membrane. 83
Figure 4.3.15a Ion rejection vs. feed concentration obtained in
passing solution of NaCl-CsCl-CoCl2
(in 1:1:1 mole ratio) through MPT-34 membrane. 84
Figure 4.3.15b Ion rejection vs. feed concentration obtained in
passing solution of NaCl-CsCl-CoCl2
(in 1:1:1 mole ratio) through NF-70 membrane. 85
Figure 4.3.15c Ion rejection vs. feed concentration obtained in
passing solution of NaCl-CsCl-CoCl2
(in 1:1:1 mole ratio) through TFC-SR membrane. 85
Figure 4.4. la Photograph of the observed regions of unused MPT-34
membrane sample. 87
Figure 4.4. lb Photograph of the observed regions of used MPT-34
membrane sample. 87
Figure 4.4.2a Photograph of the observed regions of unused NF-70
membrane sample. 88
Figure 4.4.2b Photograph of the observed regions of used NF-70
membrane sample. 88
Figure 4.4.3a Photograph of the observed regions of unused TFC-SR
membrane sample. 89
Figure 4.4.3b Photograph of the observed regions of used TFC-SR
membrane sample. 89
Figure 4.5.1. Ion rejection vs. permeates flux (Jv) at different X
calculated from assumed input data using the
hydrodynamic model. Ax/At was set at lxl 0"4 m and
mass transfer coefficient (k) was assumed greater than
1 x 10'5 m/sec. 97
Figure 4.5.2. Sieving coefficient (S) vs. permeates flux (Jv) at different
Ax/Ak calculated from assumed input data using the
hydrodynamic model. 97
Xll

Figure No. Title Page
Figure 4.5.3. Curve fitting by model calculations for MPT-34. 99
Figure 4.5.4. Curve fitting by model calculations for NF-70. 99
Figure 4.5.5. Curve fitting by model calculations for TFC-SR. 100
Figure 4.5.6. Curve fitting by model calculations for TFC-SR using
Na2SO4 feed solution. 102
xm

Chapter 1.0
INTRODUCTION
1.1 Background
Membrane is an intervening phase separating two phases and acting as barrier that permits
preferential transport of some species. The membranes used for this purpose are artificial and
permselective. Membranes that are classified as permselective exclude membranes with functions
other than for phase separation such as those used for loudspeakers. Membrane separation
processes are differentiated based on the range of particle size for which each one is applicable.
They are microfiltration (MF), ultrafiltration (UF), nanofiltration (NF), and reverse osmosis (RO).
Table 1.1 shows the different ranges in particle size and molecular weight corresponding to the
different membrane separation process. Microfiltration has been used to remove suspended
particles, large colloidal particles, and organisms of around micron size (10"6 m) [1, 2, 3].
Ultrafiltration has been used to remove macromolecules, solutes of large molecular size and small
colloidal particles [1, 2, 3]. Previous studies on reverse osmosis report that it is capable of
removing small solute molecules and ions [1,3].
Membranes are mostly synthetic polymers. The first membrane was an animal bladder used by a
French named Abbe Nollet in 1748 [1]. He placed 'spirits of wine' in a container and sealed its
mouth with the bladder. When the bladder is placed in pure water, it swelled while water
penetrated the container. Today most membranes are made of thin film cellophane, regenerated
cellulose, cellulose nitrate, cellulose acetate, polyamide, polycarbonate, polysulfone, polyacetal,
polyacrylate, polyelectrolyte complexes, crosslinked polyvinyl alcohol, copolymers of
acrylonitrile and vinyl chloride, polyvinylidene flouride, polyvinyl chloride, and polypropylene
[1,3]. Section Al of Appendix A shows the structural formula of some membrane materials.
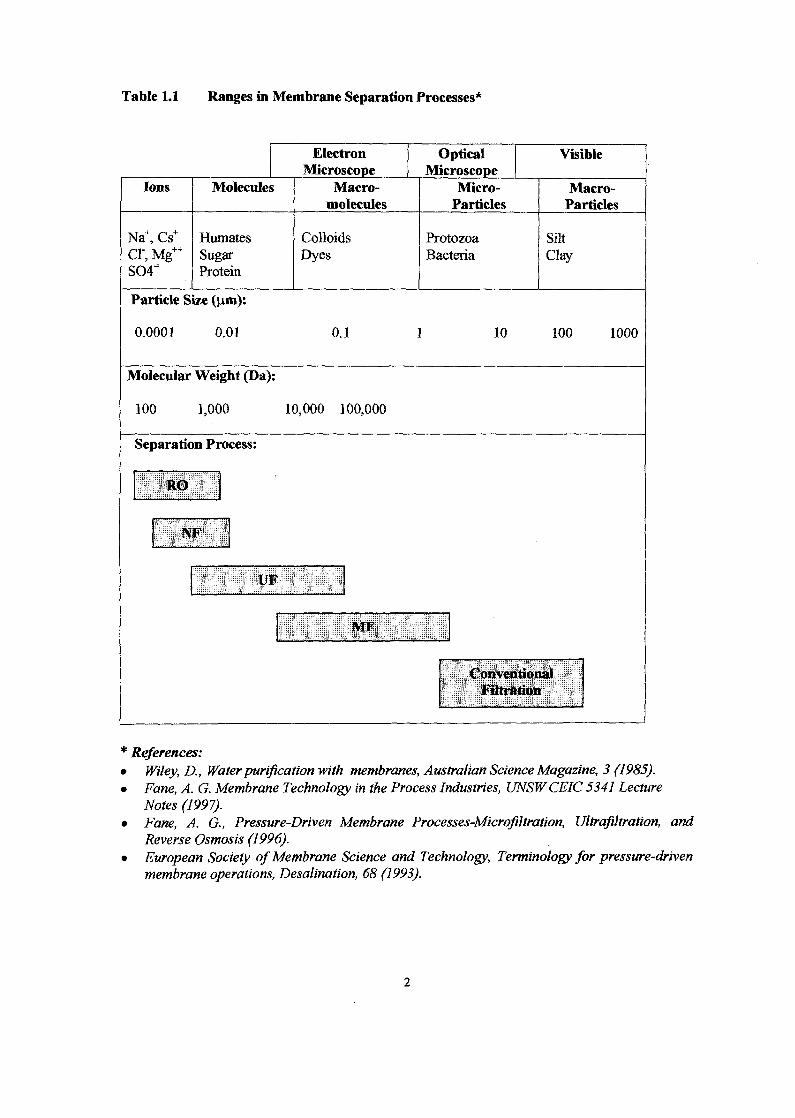
Table 1.1 Ranges in Membrane Separation Processes*
Ions
Na+, Cs+
cr , Mg++
ElectronMicroscope
Molecules
HumatesSugarProtein
Particle Size (jim):
0.0001 0.01
Molecular Weight (Da):
100 1,000
Separation Process:
RO
NF
OpticalMicroscope
Macro-molecules
ColloidsDyes
Visible
Micro-Particles
ProtozoaBacteria
Macro-Particles
SiltClay
0.1 1 10 100 1000
10,000 100,000
UF
lliiiiili• References:• Wiley, D., Water purification with membranes, Australian Science Magazine, 3 (1985).• Fane, A. G. Membrane Technology in the Process Industries, UNSWCEIC 5341 Lecture
Notes (1997).• Fane, A. G., Pressure-Driven Membrane Processes-Microfiltration, Ultrafiltration, and
Reverse Osmosis (1996).• European Society of Membrane Science and Technology, Terminology for pressure-driven
membrane operations, Desalination, 68 (1993).

Most available membranes have structure that may be classified as symmetric, asymmetric, or
thin-film composite [1, 4J. Symmetric membranes consist of structure having pores of the same
sizes. A substructure having pores much larger than those for its active skin (smooth top
membrane surface) supports Asymetric membranes. Thin film composite membranes are made of
composite materials where a polymer film is deposited by reaction or adhesion of a solution on its
porous substructure. A composite material means any homogeneous mixture of polymers or
combination of polymers and other materials. Asymetric membranes may also be made of
composite materials [1,3, 6]. Figure 1.1 illustrates the different membrane structures.
SymmetricMembrane
Active Skin
SubstructureI .
AsymmetricMembrane
Active Skin ^ ^Substructure 1
Substructure 2
Thin FilmCompositeMembrane
Figure 1.1 Membrane Structure
Membranes are contained together with other supporting structures in a unit called module [1, 5,
8]. The types of modules are discussed and illustrated in Section A2 of Appendix A.
The term nanofiltration (NF) is derived from the fact that these membranes are characterized by
molecular cut-off values corresponding to hypothetical pores of one (1) nanometer (equivalent to
10 Angstroms) or 10"9 m. J5,9].

NF membranes are estimated to have pore size in the range of 2 to 15 nm which categorizes
them between ultrafiltration membranes (UF) which has pore size in the range of 5 to 200 nm,
and reverse osmosis (RO) membranes which are thought not to contain discrete, fixed pores in
contrast to ultrafiltration membranes (UF) [5,7]
Like other membrane processes that are previously mentioned, nanofiltration is a pressure-driven
process working on liquid phase. MF, having larger pore size than UF, requires lower operating
pressure than the latter. NF requires lower operating pressure than RO, although improvements
made on commercially available RO has lowered the required pressure for some RO membranes.
RO systems are generally designed and utilized at net driving pressure of around 2.8 MPa (400
psi) [30]. Table 1.2 shows the required pressure for some NF membranes where each membrane
is identified by the code name assigned by the manufacturer. It shows the required pressure for
FT30, an improved RO membrane that requires relatively lower pressure than other RO
membranes [9,10].
Table 1.2 Net driving pressure equivalent to 50 ml/min. for some NF and RO
membranes
Membrane
FT30
NF70
XP45
XP20
Type
RO
NF
NF
NF
Operating PressureMPa (psi) *
1.4(200)
0.4(57.14)
0.7 (700)
1.0(142.86)
* Cadotte, J., Forester, R., Kim, M., Petersen, R. andStocker, T., "Nanofiltration MembranesBroaden the Use of Membrane Separation Technology", Desalination, 70(1-3), (1988), 77-88.
Regarding the performance of different types of membranes, results of recent studies show that
NF falls between the high salt permeability of UF membranes and the high salt retention of RO
membranes. NF differs from both UF and RO in the manner in which it works on ionic specie.

NF exhibits different rejection for different ionic species. Water fluxes in NF membranes are
shown to be between UF and RO. Table 1.3 provides reported rejection of some electrolytes from
membrane manufacturers' data. Rejection is the ability of a membrane to hinder a component to
pass through it. The level of rejection is reported as a fractional coefficient or as a value in
percentage that defines the degree of separation of a certain component from the solvent by the
membrane under defined operating condition.
Table 1.3 Reported Salt Rejections of SomeUF, NF and RO Membranes
MembraneMiUipore PTGC*FilmTec FT30***NF-70 *XP45*XP20*NTR-7410 **NTR-7450 **PSA*SC-L100 *
Membrane TypeUFRONFNFNFNFNFNFNF
NaCl0
98%75%50%20%15%
u 5 1 %17%75%
Na2SO4
099%
55%92%95%97%
MgCl2
0
70%83%
4%13%39%90%
MgSO4
0
97.5%97.5%85%9%
32%92%98%
* Macoun, R. G, Shen, Y. R., Fane, A. G. and C. D. Fell, Nanofiltration: Theory and
Applications to Ionic Separations, Chemeca (1991) 398-405.
** Ikeda, K., Nakano, T., Kubota, T. and Yamamoto, S., New Composite Charged Reverse
Osmosis Membrane, Desalination, 68(1988) 109-119.
*** Cadotte, 1, Forester, R., Kim, M, Petersen, R. andStocker, T., "Nanofiltration Membranes
Broaden the Use of Membrane Separation Technology", Desalination, 70(1-3), (1988), 77-
88.
1.2 Statement of the Problem
Based on manufacturers' data, NF can be distinguished from RO and UF by way of their rejection
of salts. Most UF could hardly reject salt while RO shows very high rejection for most salts. NF
rejection data shows that for each type of membrane, different rejection for different electrolyte
solutions are obtained. Authors of recent studies or reviews support the idea that there are
membranes with characteristic fixed surface charge and that the mechanism of separation in

electrolyte solutions is by the differences in valences of the ions [28,31,32]. This hypothesis was
made more popular with the assumption that RO membranes are non-porous [10] and that
rejection of ions is made possible due to ionic charge. The same hypothesis was also used to
explain why NF membranes as well as some UF membranes are able to reject salts despite the
small size of the solute particles compared to the range of pore size of the membrane. Some
authors of recent studies both on UF and RO report electrolyte separation potential from solutions
containing single solute in terms of salt rejection and not by ion rejection [49]. In this regard,
charge separation is not clearly presented. The following issues concerning NF need to be
resolved and explained:
1. Separation of ions during the permeation: possible or not possible;
2. Mechanism of separation: by charge effect, ionic size, or hydration of ion;
3. Membrane surface charge: due to presence of fixed charge or due to adsorbed ions.
The explanation of the above issues will determine the applicability of NF for selective separation
of ions. This will help to differentiate NF from RO, which has previously been found to reject salt
very efficiently.
1.3 Objectives
This research has been so designed as to settle the issues concerning NF which have been
mentioned in Section 1.2. The main objective of this research is to determine the performance
characteristics of NF membranes in separating electrolyte solutions. By varying the operating
conditions in the experiments, the trends and behavior of permeate fluxes and ion rejections can
be determined. From the information gathered from previous studies on electrolyte solution
properties, appropriate model of ions in solution can be applied to establish the model on the
mechanism of separation of electrolytes in NF. This research will also help establish the
similarity and differences between UF, NF and RO in the mechanism of separation and their
respective area of applicability. In this study, I also intend to determine applicable model for
membrane characterization that may include determination of the membranes' performance
parameters such as hydraulic permeability and some physical characteristics such as effective
membrane pore size.

1.4 Scope and Limitations
This study involves experiments that aim to compare the separation performance of three
different NF membranes: MPT-34, NF-70 and TFC-SR on different types of electrolyte solutions.
Like other membranes, NF membranes are identified by the code name assigned by their
respective manufacturers. MPT-34, NF-70 and TFC-SR membranes were specially considered
because of their different predicted performances based on the data provided by the membrane
manufacturers [12, 13]. MPT-34 requires high operating pressure and is expected to show
moderately high level of NaCl rejection. NF-70 requires low operating pressure but is expected to
give very high NaCl rejection. TFC-SR also requires low operating pressure and is expected to
provide medium level of NaCl rejection. The number of membrane samples considered was
restricted by the availability of supplies, which were requested from the manufacturers.
Four different electrolytic compounds were considered in the study. They are: NaCl, NajSCU,
CsCl, and C0CI2. In the choice of solute, it is important that comparison be made on the effect of
charge and size of the ions and the degree of hydration of the ions. For this matter NaCl and CsCl
were chosen to compare cations of the same valence but of different size and hydration number.
In addition, C0CI2 was used to have a comparison between cations of salt with the same anion. To
study a solute sample involving divalent anion, Na2SO4 was used since it can make a good
comparison with NaCl having the same cation involved.
The choice of solutes for the experiments was also limited by the availability of analytical method
and equipment to be used for the solution analysis. Atomic absorption spectrometry and ion
chromatography were the methods chosen for the analysis of cations and anions, respectively.
These methods were expected to provide more accurate results than other methods at the level of
concentration of the sample solutions.
The small range of pressure and temperature to which each membrane sample was applicable
limited the number of runs for each experiment involving these parameters. Only three trials for
every run were taken because of the constraint of time, both for the test runs and for the sample
analysis.

Evaluations made on NF were based on fluxes and rejection data obtained from the experiments
performed at different conditions. The pores of NF membranes are so small that they are not
visible even with the use of an electron microscope. It was used however to observe physical
changes that may indicate damages after completion of the experiments.

Chapter 2
REVIEW OF RELATED LITERATURE
2.1 Studies on Charged UF Membranes
UF membranes typically have pores in the range of 10 to 1000 A and are capable of retaining
species in the molecular weight range of 300 to 500,000 Dalton. Most UF membranes are
described by their nominal molecular weight cutoff (MWCO), which is defined as the molecular
weight of the smallest molecular weight specie for which the membrane has more than 90%
rejection.
The view that in UF, the separation is based on molecular size was true as first approximation in
evaluating UF membrane's performance characteristics. MWCO of a given UF membrane could
vary with changing feed chemistry and operating conditions.
The separation performance of UF membranes can be measured in terms of rejection ( R ) which
is defined by the equation given below.
(2.1.1)
In the equation, cp and cf are the concentrations of specie / in the permeate and feed, respectively.
There were cases when UF researchers obtained negative rejections from UF operations.
Negative rejection is obtained when the permeate collected is richer in the specie / than the feed.
Akred et ah (1979) reviewed other authors experimental results, which showed negative
rejections of some ions. They reviewed the negative rejections obtained by other authors for HC1
and H2SO4 in a RO membrane believed to have positive charge. They also reviewed the negative
rejection obtained for NaCl in uncharged RO.

Akred et al. (1979) made modifications to earlier models for RO, which neglected effect of
convective solute transport in solute rejection. The model was based on convective and diffusive
transport of ions through neutral UF membrane, coupled with Donnan membrane theory, which
they used to predict negative rejections obtained experimentally from gelatin production liquor.
Donnan membrane theory is applicable to charged membrane wherein charged functional groups
attract counter-ions that leads to a deficit of co-ions in the membrane. In their study gelatin liquor
was used to determine the extent of removal of ash (mainly calcium bisufite) by UF operations.
Akred et al. (1979) found mat most negative rejections were obtained at the lowest pH level
(pH=2) and highest level of gel concentration (20% by weight gelatin).
Nakao and Kimura (1981) studied rejection of solutions of various molecular weight by UF
membranes in order to establish an analytical method of UF rejection data. The first step used in
their study was to correct the effects of concentration polarization by applying mass transfer
coefficient determined by the method of velocity variation. Concentration polarization takes
place when solute rejected by a membrane builds up at the membrane surface forming a layer of
high solute concentration. In concentration polarization model, permeate volumetric flux (Jv) is
expressed in terms of the mass transfer coefficient (k) and the solute concentration on the
membrane surface (cm) in the boundary layer. The bulk solution concentration is represented by cb
and the permeate concentration by cp. The equation is given below:
(2.1.2)
In the velocity variation method, k is expressed as a function of the Reynolds number (Re) by the
following relationship.
kau" (2.1.3)
In the above relationship, u is the feed velocity and a is a constant.
10

The results obtained by Nakao and Kimura (1981) were compared and analyzed using Deissler
correlation. This correlation involves membrane transport parameters. The equation is given
below.
NSh = 0.023 • NRe0S15 Nsf
25 (2.1.4)
In Deissler correlation, the transport parameters NSf, , NRe, and N$c represent the Sherwood
number, the Reynolds number, and the Schmidt number, respectively. In membrane operation
involving a turbulent system, the Sherwood number (NSh) is equivalent to the mass transfer
coefficient (k). The Reynolds number (JV&,) is defined by the following expression.
( 2 1 5 )
The Schmidt number (Nsc) is defined by the equation below.
In the above expressions, dh is the hydraulic diameter of the thin channel cell (m), Fis the axial
bulk velocity (m/sec), and D is the diffusion coefficient of the bulk solution (m2/sec). The
parameters p0 and TJO represent the density and viscosity of the solvent, respectively.
Following the use of Deissler correlation, Nakao and Kimura (1981) used equations developed by
Spiegler and Kedem (1966) to analyze transport of solute through UF membrane.
Spiegler and Kedem (1966) used the equation developed by Kedem and Katchalsky (1958) which
is given below.
J.

In the above equations:
Js = solute flux [moles/cm2- sec]
a = reflection coefficient
A n = osmotic pressure [atm]
cm = average solute concentration in both sides of the membrane [moles/cm3]
cm = solute concentration on the membrane surface [moles/cm3]
cp = solute concentration in the permeate [moles/cm3]
Ls = solute permeability [cm/sec]
In high-rejection UF system, the concentration differential (cm - cp) was so large that the
logarithmic mean concentration {cm ) would not correspond anymore to the correct average. To
solve this problem, Spiegler and Kedem (1966) divided the membrane into differential elements
in the direction of its thickness and applied the Kedem and Katchalsky equation in its differential
form. The result is an equation defining the real rejection (R,). The equation is given below.
where t h e / is a function defined by the expression given below.
-(\-a)-L.
(2.1.9)
From the above equation, Jv is the volume flux through the membrane, and Ls is the solute
permeability, and a is the reflection coefficient. The solute permeability (Ls) is the flux of a
component per unit of pressure difference and the reflection coefficient (a) is the measure of the
portion of the membrane through which the solute cannot be transferred. Based on the "pore
theory", the membrane structure could be estimated from Ls and a. This theory accounts for
transcapillary transport. The membrane was assumed to have cylindrical pores of radius rp and
length Ax. The solute particle was assumed to have a radius of rs. The pore length (Ax ) could not
n

be measured but the ArfAx, could be determined by the equation below. Furthermore, AtJAx should
be constant for the same membrane.
Ls=D-f(X)-SD-(^) (2.1.10)
From the above equation, f(X) is a wall correction factor for diffusion and SD is a steric hindrance
factor for diffusion. The wall correction factor for diffusion (f(X)) is a function of X which is the
radius of solute to radius of pore ratio (rjrp). It has been found from the study made by Nakao
and Kimura (1981) that pore length is in inverse proportion to the third power of the solute radius.
Battacharyya et al. (1982) considered the overall rejection characteristics as function of ion fluxes
due to convection, diffusion, and Donnan potential. They proposed that charged membranes
reject ionic solutes via repulsion of co-ions by the fixed charged groups on the membrane skin.
Co-ions are those ions having the same charge as the membrane, while counter-ions have charge
opposite that of the membrane. Based on their study, they predicted that ion rejection in an
electrolyte solution would depend on the co-ion charge.
Jitsuhara and Kimura (1983) found that UF made of sulfonated polysulfone would show high
rejection when solute concentration was low. This relationship is typical of charged membranes
[17]. They also found mat charged membrane could remove low content of inorganic salts at low-
pressure range.
Nakao et al. (1988) in a recent study, experimented on charged UF for separation of protein
mixtures. They found that protein rejection was low at the isoelectric poini, while it was high at
pH levels, which could give the protein the same sign of charge as that of the membrane.
Isoelectric point is the pH of a solution corresponding to zero zeta potential. In models
concerning electrical double layer, zeta potential is defined as the electrical potential at the plane
of shear. This plane of shear separates the fixed part from the mobile part of the electrical double
layer on the membrane surface [40], which is characterized by a certain ion distribution.
Tsuru et al. (1990) performed experiments to determine effective charge density and membrane
structure of UF membrane. The effective charge density was determined from measurement of
the membrane potential and found to be increasing with increasing feed concentration. Moreover,
13

it was found that solute rejection would increase with increasing permeate flux but would
decrease at increasing feed concentration.
Opong et al. (1991) determined actual sieving coefficients from filtrate concentrations in
assymetric polyethersulfone UF membranes using the stagnant film model developed by Blatt et
al. (1970) to account for bulk mass transport effects. Opong et al. (1991) used this model because
it could predict the concentration profiles above the membrane surface. Their results were said to
be in good agreement with available hydrodynamic models for the hindrance factors for
convective and diffusive transport of spherical solutes through well-defined pore [20].
2.2 Studies Made on Reverse Osmosis
Kimura and Sourirajan (1967) used reverse osmosis experimental data for some inorganic salts
with porous cellulose acetate membrane and analyzed these data to obtain the diffusivity of these
inorganic salts in the membrane. A parameter, dependent on diffusivity but independent of flow
rate, was found constant for each film in the concentration range considered for a particular solute
at a particular pressure. This parameter was DMJKS , and is defined by the equation below.
(2.1.11)
Where:
NA = solute flux [mole/cm2-sec]
c = molar density of solution [mole/ cm3]
DAM = solute diffusivity at the membrane phase [cm2/sec]
K = distribution ratio of solute between solution and membrane
5 = membrane thickness [cm]
mole fraction of solute in the membrane-solution interface
mole fraction of solute in the permeate
14
Hoffer and Kedem (1967) evaluated charged membrane according to the Teorell-Meyer-Siever
fixed charge model, which described membrane as a rigid matrix of constant volume, which
behaves as an ionized exchange body with fixed charge. Hoffer and Kedem (1967) introduced the
parameters, r and Y, which they defined as follows:
r = charge density / (feed concentration)(volume fraction of water) = [length6] (2.1.12)
and
7 = (volume flow)(membrane thickness) / (volume fraction of water)(tortuosity coefficient)
= [lenght4]
They found that the order of magnitude of the flux, which would lead to assymptotic values of
rejection, decreases when r increases. Assymptotic rejection is the limiting value of solute
rejection at high level of fluxes. For a loose membrane with thickness of 0.1 mm, r =10 and the
volumetric flux is about 10 cm/sec.
Hoffer and Kedem (1967) also found that divalent counter-ions salt rejection would be lower
than mono-valent counter-ions, which they attribute to the different ion distributions. They
obtained high rejections for di-valent co-ions.
Dresner (1972) made remarks on the extended Nernst-Planck equation described by Schlogl in
1964 and suggested simplified approximation to obtain assymptotic rejection of solutes. Nernst-
Planck equation according to Schlogl (1964) was based on three mechanisms of ionic transport in
a membrane, namely: diffusion, convection, and migration in an electric field. It involves highly
complicated equations, which are non-linear.
Dresner (1972) proposed that the case conditions be simplified in order to reduce the differential
equations in the Nernst-Planck equation to simple algebraic equations.
15

Ikeda et al. (1988) examined the performance of NTR-7400 (RO) membrane series. They found
that mono-valent cations would have higher rejections than those containing di-valent cations.
This result was opposite of those found in normal RO membranes. The also found that in charged
RO membranes, salt rejection decreased rapidly with increasing salt concentration, while
rejection of neutral solutes was constant over a wide range of concentration.
Tsuru et al (1991) numerically calculated the ion rejections of negative charged RO membranes
for single electrolytes of various valences and mixed electrolytes using the extended Nernst-
Planck equation under various conditions (volume flux, effective charge density to feed
concentration ratio, mole fraction in electrolyte mixtures).
Their assumption was based on the co-ion rejection model, which considers membranes to be
made of polyelectrolytes having charges due to their ionic groups such as sulfonic acid and
quarternary ammonium groups. Their calculation was based on separation ability in charged
membranes, which was attributed on "charge effect". The authors considered valence type of the
ion as possible basis for the separation mechanism.
The basic equation for the extended Nernst-Planck equation is as follows:
jt =ci
In the above equation,
= ioi
= electrochemical potential [j/mol]
-2 -1ji = ion flux based on membrane pore area [mol- m • s ]
CJ - concentration of ith ion in membrane [mol-m ]
R = real rejection (= 1 - Cp I Cm )
T = temperature [°K]
ZJ = valence of ion
4 -1F = Faraday constant [9.6485 x 10 coulombs • mol ]
ij/ = electric potential [V]
16

x = distance across membrane [m]
jo = volume flux based on membrane pore area [m • m • s ]
The above equation was developed with the following conditions: electroneutrality, no electric
current condition, and Donnan equilibrium existing at the interface between the membrane and
the external solution.
Tsuru et al. (1991) obtained an analytical solution for a single mono-valent electrolyte solution,
and the expression is shown below.
l Z(Cp)2-2CpZjCp)-A Cp fZ(Cp)-Cp-B\l ( p ) p j p ) A p f
|2 f {Z(Cmf-2CpZ(Cm)-A IB [Z(Cp)-Cp+B Z(Cm)-Cp-B)\
(2.1.14)
where:
and:
C = permeate concentration in external solution [mol-m ]p
Cm = membrane surface concentration [mol-m ]
Ds = s o l u t e d i f f u s i v i t y ( = 2 R T W 0 , u \ l ( u \ + u 2 ) )
3 -2 -1
Jo = volume flux based on membrane area [m • m • s ]
Ax/A = membrane thickness/porosiy [m]
o o o
a = cation transport number ( = u r. / (w t + u 2 ) )
$X = effective charge density [mol-m ]
17

Rej
ecti
on
1 -
0.8
0.6
0.4
0.2 -
0 1
cV) 5
. • —
, '
10
—£ —
.$ 0
.— o
15
Jv x Ax/Ak x
20
1E+10
25
sQs
—O 8
30
= 20
= 10
i
Ii• !
'i\
Jj\\%%t
ji\
35
Figure 2.2.1 Normalized flux (Jv-Ax/Ak) against Cl~ rejection in NaCl solution based on
theoretical calculations using the Extended Nernst-Planck's Equation done in this
present study. (Program NERNSTPLK.Bas used for calculation is shown in
Section Bl of Appendix B).
Figure 2.2.1 provides the limiting values of rejection against the normalized flux (Jv-Ax/Ak) at
different charge/feed concentration ratio, s obtained from the theoretical calculations made in this
present study using the extended Nernst-Planck equation. To facilitate the calculations the
program NERNSTPLK.Bas in the BASIC language was developed and used in this study.
Tsuru et al. (1991) also performed experiments using single electrolytes and mixed electrolyte
solutions on negatively charged loose RO (low-pressure-type) membranes. The experimental
results obtained were explained by the Nernst-Planck equation and summarized as follows:
a) The effective charge density, which was obtained by measuring electric potential,
increases with increasing feed concentration.
b) At low feed concentrations, rejection of the di-valent co-ion (SO4~ ) is higher than those
of mono-valent coions. Electrolytes having mono-valent counter-ions (Na+, K+) are more
rejected than those having di-valent counterions (Mg++, Ca++).
18

c) At high feed concentration (e.g. 1000 mol-m"3), rejection approaches zero. This was
explained by Tsuru et al. (1991) as due to the diminished charge effect at high
concentration.
Starov et al. (1992) explained fixed charge formation in cellulose acetate membrane and
explained that the electroneutrality condition inside the membrane is an algebraic sum of the
solution concentration and membrane fixed charges. They stressed that membrane charge are
determined by the concentration inside the membrane and these concentrations are complex
functions of feed solution concentration.
Hall et al. (1997) developed a model for multicomponent electrolyte separations through
multilayer RO membranes based on the following:
a) basic transport concepts using extended Nernst-Planck equation;
b) fundamental laws such as electroneutrality and zero electric current conditions;
c) presence of charge groups in the membrane material which is responsible for ion-
exchange and that the magnitude of membrane charge varies with ion concentration and
pH inside the membrane;
d) specific interaction potential between an ion and the membrane material helps determine
the effective distribution of an ion;
e) the presence and influence of an electric field that forms , in part , to counteract the
tendency of the membrane to create small amounts of charge separation.
The model by Hall et al. (1997) predicted that on membranes with negative charge operating on
NaCl solution of concentration below 10"2 M, there will be more Na+ man Cl" in the permeate
because of the extra Na+ inside the membrane to counterbalance the fixed charge. As a result, the
rejection of Na+ decreases while that for Cl" increases. Water splitting provides FT and OH" to
maintain electroneutrality in the permeate resulting to difference in the permeate pH compared to
that of the feed.
19

2.3 Previous Studies Made on Nanofiltration
Macoun et al. (1991) explained that the forces affecting ions as they pass through fine porous NF
membranes are coulombic forces, dialectic forces, and hydration forces [10]. He defined that
coulombic forces were those arising from repulsion or attraction of the ions by the charges on the
membrane and the ion. Dialectic forces were considered to be those resulting from the repulsion
of the ions by their images (functional group having the same charge) in the low dialectric
medium of the membrane polymer. The hydration forces were those arising from the interaction
of the water molecules hydrating both the ion and the membrane.
Macoun et al. (1991) based bis proposal on early simple models. Levine et al. (1975) predicted
the increase of rejection with increase in membrane charge or increase in the charge of the co-
ions. From the electrostatic model of Persegian (1969) it was predicted that rejection will increase
at an increase in ion charge and will decrease with increase in membrane pore size. In the
concentric shell model for solvated ion proposed by Frank and Evans (1945) it was predicted that
there will be a barrier arising to ion passage when the pore is too small to contain a hydrated ion
while there will be no barrier when the pore is large enough to contain a fully hydrated ion.
Bowen and Mukhtar (1996) studied rejection of single electrolyte solutions using different NF
membranes. The experimental data were interpreted based on the extended Nernst-Planck and
found that those data were in agreement with the equation used. They proposed a model
procedure for membrane characterization.
Childress et al. (1996) found that for four different reverse osmosis and nanofiltration
membranes, the zeta potentials were positive at pH levels below their respective identified
isoelectric point and negative at higher pH levels. Two samples of nanofiltration membranes were
used, TFCS and NF-70. TFCS was considered to have positive charge at pH lower than 3, while
NF-70 have positive charge at pH lower than 4. Childress et al. (1996) considered the two NF
membranes to have neutral charge at their isoelectric points, and to have negative charge at pH
above the isoelectric points.
20

Figure 2.3.1 shows the results of the experiments performed Childress et al. (1996) for NF-70 and
TFCS. Almost identical trends were obtained for the two membranes. In this experiments,
membrane charge was measured by zeta potential.
E
1a
N
10
0 -(
-10 -
-20 -
Zeta Potential
l 2
Measurements
Solution
NF-70 —
in NF Membranes
o o
^ v
pH
TFCS
ibi
j
•I
Figure 2.3.1 pH versus zeta potential in nanofiltration membranes based on Childress et al.
(1996) [39].
2.4 Theoretical Consideration
2.4.1 Membrane Principles
A. The Coion Rejection in a Charged Membrane
Charged UF and RO membranes are thought to have separation ability, which is based not only
on sieve effect but also on charge effect because of the electrostatic repulsive forces that they
exert against the electrolytic solute. In mis way, charged solutes with dimensions much smaller
than the membrane pore size can be rejected.
21

Hoffer and Kedem (1967) evaluated membrane separation according to the fixed charge model.
The model regarded membrane phase as a mixture of poly-salt and low-molecular weight salt. It
assumed that if the charge density was high compared to the salt concentration, salt could be
effectively rejected from the membrane. Hoffer and Kedem (1967) found that di-valent counter-
ions would have lower salt rejection than mono-valent counter-ions and di-valent co-ions would
have higher salt rejection than mono-valent co-ions.
Dresner (1972) described electrolyte separation in an ion-exchange membrane as a result of
interaction between a charged membrane and the counter-ions in the solution. He predicted that
counter-ions would be abundant on the membrane surface in the absence of applied pressure.
When the pressure is exerted on one side of the membrane, water flows through the membrane,
exerting frictional force on the mobile counter-ions in the membrane drawing them in the
direction of water flow. The excess of counterions at the low-pressure side of the membrane and
shortage at the high-pressure side create an electric field, which prevents further counterion flow
and accelerates the coions. The electrical force which balances the frictional force eventually
stops the flow of counterions and prevents the steady separation of charge until the counterion
and co-ion fluxes are in stoichiometric ratio and together are equivalent to a salt flow. Figure
2.4.1 shows the schematic representation of the coion rejection model.
Figure 2.4.1 Schematic diagram illustrating co-ion rejection model as predicted by Tsuru et al.
(1991). Note: Downward arrow means unrejected; upward arrow means rejected.
22

B. Acquired Charge by a Neutral Surface
Shaw (1969) explained that polymeric membrane acquires surface charge when brought into
contact with an aqueous medium. The mechanisms, which are responsible for the acquired charge
of this material, are ionization, ion adsorption, and ion dissolution. These origin of charges are
described as follows:
1. Ionization
When certain polyatomic groups are ionized, the net molecular charge will depend on the
resulting pH of the solution. The pH at which the net charge due to ionization is zero is
called the iso-ionic point. The pH at which the electrophoretic mobility is zero is called
the iso-electric point.
2. Ion Adsorption
A net charge can be acquired by unequal adsorption of oppositely charged ions. Surfaces
in contact with aqueous media are more often negatively charged than positively charged.
This is a consequence of the fact that cations are generally more hydrated than anions and
so they have the tendency to reside in the bulk aqueous medium. The smaller, less
hydrated and more polarizing anions can get closer to non-polar or hydrophobic surfaces.
In this situation, the surface acquires negative electrokinetic potential due to the presence
of anions beyond the plane of shear.
Surfaces that are already charged, e.g. by ionization, usually show a preferential tendency
to adsorb counter-ions , especially if polyvalent. It is possible for counter-ion adsorption
to cause a reversal of charge.
3. Ion Dissolution
Unequal dissolution is responsible for charge formation. The potential-determining ions
are those of whose concentration determine the electric potential at the molecular particle
surface.

Kunnin and Myers (1950) in their study of ion exchange behavior of ions explained ion exchange
behavior of various cations and anions based on ionic hydration theory. It is explained that ion
exchange is based on the adsorbability of an ion, which on the otherhand depends on the relative
charges, and ionic radii of the two ions entering into the exchange. According to the theory, ions
in aqueous solution are hydrated and that the degree of hydration for cations increases with
increasing charge and decreasing crystallographic radius. Less hydrated ions are more adsorbable
than the more hydrated ones.
C. Osmotic Pressure Model
The permeate flux (Jv) for a porous membrane is defined by:
Jv = L(AP-aATl) (2.4.1)
where L is the hydraulic permeability , AP and All are the differences in applied pressure and
differences in osmotic pressure, respectively [IS, 42,43].
For "ideal semi-permeable" membranes, which permit passage of water but not solute, the
reflection coefficient, a = 1 [IS].
For solutions that depart from ideality the osmotic pressure differential is expressed as:
(2.4.2)
where c is the solution concentration, T is the temperature, and ^ is a correction factor called
osmotic coefficient. Values for osmotic coefficient used were taken from Table 2.7.6 of Horvatt,
Handbook of Electrolyte Solutions [44] which provides <f> relevant to chemical industries. For
NaCl solution having concentrations of 0.1, 0.01 and 0.001 M, <f> is 0.933, 0.968, and 0.988,
respectively.
24

2.4.2 Electrolyte Solution
The Ion Hydration Model
Frank and Wen, 1957 [46, 47] proposed a model that distinguishes three regions around the
solvated ion. Figure 2.4.2 shows this regions. These are the assumed rigid and ordered inner
solvation shell (A), the region of disordered and highly mobile solvent molecules (B), and the
region of the bulk of pure solvent (C).
Figure 2.4.2 Schematic model for hydration of ion based on Frank and Wen (1957). I represents
the ion; A, the rigid and ordered shell; B, the disordered mobile solvent; C, the bulk solvent.
In nanofiltration membrane where the membrane pore size is thought to be within nanometer
range, separation of ions based on this model could be possible in a very dilute electrolyte
solutions. Table 2.4.1 provides some properties of ions, which may be relevant in predicting
the mechanism of ion separation in NF.
25

Table 2.4.1 Some Properties of Ions mat may be Relevant in Predicting theMechanism of Ion Separation in NF
Ion
Na+
Cs+
cr
so42
Co+2
Crystal or "Bare"Radius (A)**
0.95
1.69
1.81
2.90
0.72
Hydrated Volumecm3/mole**
115.80
89.91
92.39
137.45
191.50
HydrationNumber*
6.5
4.3
3.9
5.3
11.5
** Horvath, (1985).* Marcus, (1985)
26

Chapter 3
EXPERIMENTAL METHODS
3.1 Introduction
In the design of the experimental methods to be used in this research, simplicity is a major
consideration. The equipment set-up, which is a cross-flow model, is so designed to avoid
components that may introduce "dead" volumes and additional flow resistance that may require
additional parameters for consideration. This is important in order to eliminate or at least
minimize the effect of influences other than those identified to be related to the two major
subjects in the experiments: the nanofiltration membrane and the electrolyte solution.
The electrolyte solutes used in the experiments are: NaCl, Na2SO4, CsCl, and CoCl2. NaCl and
CsCl have monovalent cations while has CoCl2 divalent cation. The choice of the three chloride
compounds allows comparison of the behavior of the cations based on ionic charge, size, and
hydration. Using NaCl and Na2SCM enables comparison of the behavior of monovalent chloride
from the divalent sulfate ions.
Feed solution concentration used in all experiments was in the range of 10 ppm to 500 ppm. It is
expected that at low solution concentration ion-ion interactions are very low. The effect of
membrane properties such as surface charge on the behavior of the ions could be observed.
Three types of nanofiltration membranes were used in the experiments. They are: (1) MPT-34
from Kiryat Weizmann Ltd. in Israel, (2) NF-70 from Filtec Membranes, DOW Chemicals,
U.S.A., and (3) TFC-SR from Fluid Systems Corp. in San Diego, California, U.S.A. The first
membrane, MPT-34, required high operating pressure while the next two; NF-70 and TFC-SR
required much lower pressure.
27
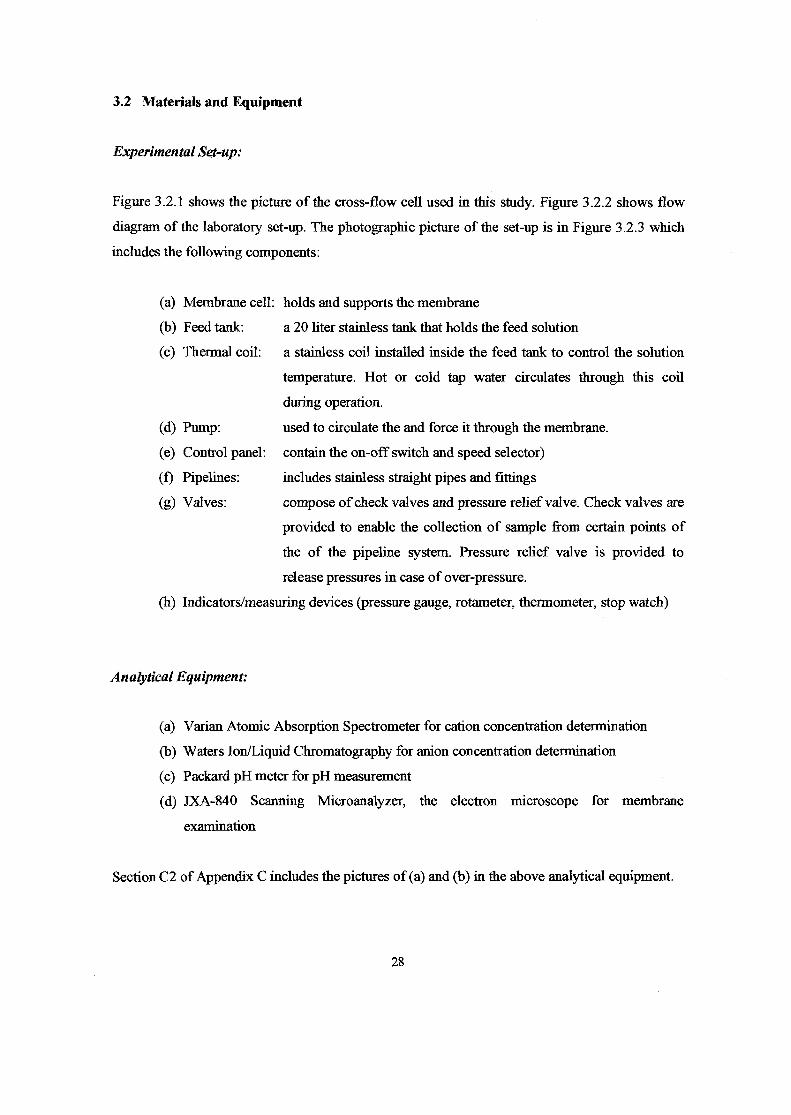
3.2 Materials and Equipment
Experimental Set-up:
Figure 3.2.1 shows the picture of the cross-flow cell used in this study. Figure 3.2.2 shows flow
diagram of the laboratory set-up. The photographic picture of the set-up is in Figure 3.2.3 which
includes the following components:
(a) Membrane cell: holds and supports the membrane
(b) Feed tank: a 20 liter stainless tank that holds the feed solution
(c) Thermal coil: a stainless coil installed inside the feed tank to control the solution
temperature. Hot or cold tap water circulates through this coil
during operation.
(d) Pump: used to circulate the and force it through the membrane.
(e) Control panel: contain the on-off switch and speed selector)
(f) Pipelines: includes stainless straight pipes and fittings
(g) Valves: compose of check valves and pressure relief valve. Check valves are
provided to enable the collection of sample from certain points of
the of the pipeline system. Pressure relief valve is provided to
release pressures in case of over-pressure.
(h) Indicators/measuring devices (pressure gauge, rotameter, thermometer, stop watch)
Analytical Equipment:
(a) Varian Atomic Absorption Spectrometer for cation concentration determination
(b) Waters Ion/Liquid Chromatography for anion concentration determination
(c) Packard pH meter for pH measurement
(d) JXA-840 Scanning Microanalyzer, the electron microscope for membrane
examination
Section C2 of Appendix C includes the pictures of (a) and (b) in the above analytical equipment.
28

Chemicals:
Samples of electrolyte solutions were prepared from analytical grade salts. The electrolytes used
were NaCl, Na2SO4, CsCl, and CoCl2 (in the form CoCl2-6H2O). Concentrated (Analytical grade)
HC1 solution was used for the preparation of approximately IN solution which was used in the
experiments that require adjustment of pH to lower range. Analytical grade NaOH pellets were
used to prepare 2000 ppm solution which was used to treat feed solutions to adjust pH to higher
range. The same solution was used to clean membrane. Analytical grade sodium metabisulfite
(Na2S2O5) was used to prepare 0.25% by weight solution used to soak membrane during one or
two weeks equipment shutdown.
Figure 3.2.1 The membrane cell used in the experiments on NF operation. The mode of
operation for which this membrane cell is designed is called cross-flow. In this mode of
operation, the feed flows parallel to the membrane while the permeate flows in the transverse
direction. This membrane cell is made of stainless steel and is designed to withstand high
pressure. It can support a 23.3 cm x 2.5 cm membrane sheet between its high-pressure side (upper
side) and low-pressure side (lower side). The two sides of the membrane cell are fastened
together by screwing them together tightly. A pair of stainless steel flexi-tubes connects the inlet
and outlet line of the membrane cell to the pipeline.
29

PressureGauge
ControlPanel
APermeate
Figure 3.2.2 Flow Diagram of the IMboratory Set-up. (Electrolyte solution is pumpedfrom the temperature-controlled tank to the membrane cell and is recycled back to the tank.Permeate is collected from point A.)
30

Figure 3.2.3 Equipment used in the experiments on nanofiltration operation
3.3 Laboratory Procedures
3.3.1 Membrane Preparation, Installation and Maintenance:
Membrane Preparation
(a) Cutting:
The membrane is cut to an effective rectangular sheet of 23.3 cm length and 2.5 cm width.
(b) Riming:
The cut membrane sheet is immersed several times for about four hours in millipore water. The
purpose of this procedure is to remove the preserving solution so as to achieve maximum flux
capability of the membrane.
31
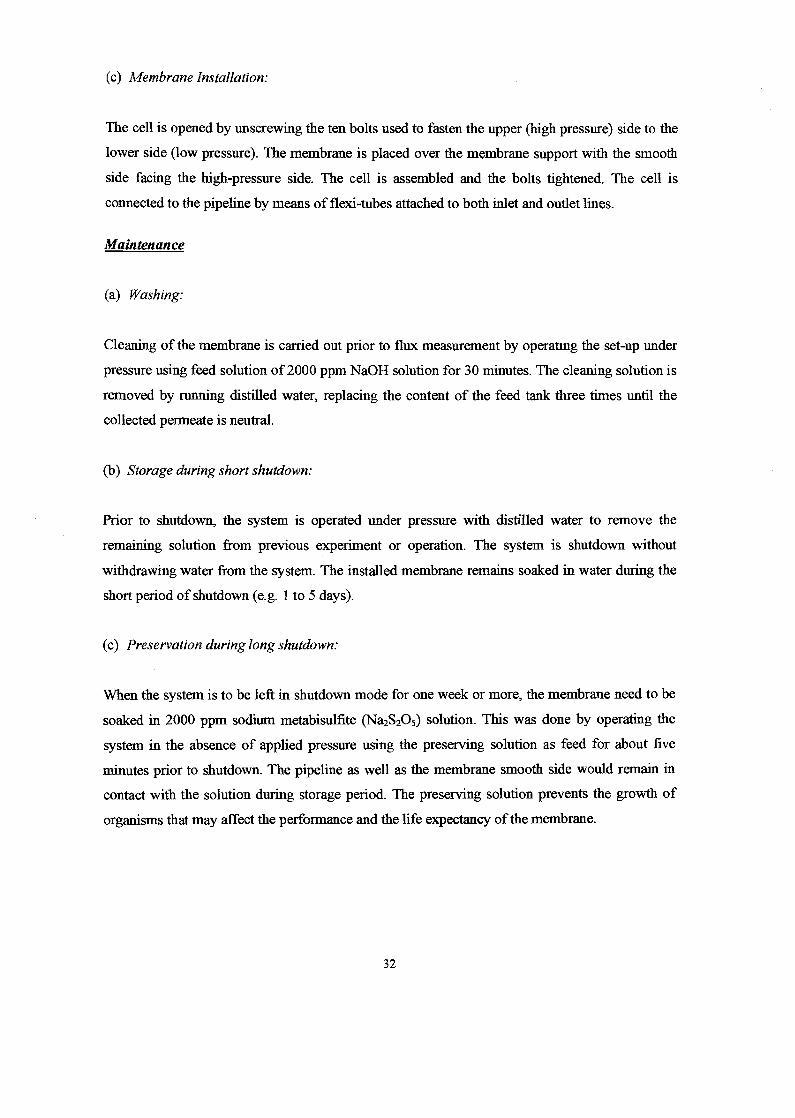
(c) Membrane Installation:
The cell is opened by unscrewing the ten bolts used to fasten the upper (high pressure) side to the
lower side (low pressure). The membrane is placed over the membrane support with the smooth
side facing the high-pressure side. The cell is assembled and the bolts tightened. The cell is
connected to the pipeline by means of flexi-tubes attached to both inlet and outlet lines.
Maintenance
(a) Washing:
Cleaning of the membrane is carried out prior to flux measurement by operating the set-up under
pressure using feed solution of 2000 ppm NaOH solution for 30 minutes. The cleaning solution is
removed by running distilled water, replacing the content of the feed tank three times until the
collected permeate is neutral.
(b) Storage during short shutdown:
Prior to shutdown, the system is operated under pressure with distilled water to remove the
remaining solution from previous experiment or operation. The system is shutdown without
withdrawing water from the system. The installed membrane remains soaked in water during the
short period of shutdown (e.g. 1 to 5 days).
(c) Preservation during long shutdown:
When the system is to be left in shutdown mode for one week or more, the membrane need to be
soaked in 2000 ppm sodium metabisulfite (Na2S2O5) solution. This was done by operating the
system in the absence of applied pressure using the preserving solution as feed for about five
minutes prior to shutdown. The pipeline as well as the membrane smooth side would remain in
contact with the solution during storage period. The preserving solution prevents the growth of
organisms that may affect the performance and the life expectancy of the membrane.
32

3.3.2 Preparation of Solutions
Liquid/Solutions for Soakine and Cleaning Fresh Membrane:
The liquid or solutions used for soaking and cleaning fresh membrane were prepared according to
the recommendations of the manufacturer of the membrane. All solutions were used freshly
prepared.
• For MPT-34
The fresh membrane was rinsed and soaked in millipore water overnight prior to installation.
This is done to remove the 0.7% Roccal (Benzalkonium Chloride) solution which was used
to preserve the membrane during storage and transport.
• ForNF-70
The membrane was soaked overnight and rinsed several times using millipore water to
remove the preservative solution.
• For TFC-SR
To remove preservative, the membrane was soaked and rinsed in 60°C millipore water
several time, until the shiny, smooth side of the membrane is free from visible impurities.
Membrane Preservative Solution for Short Term Storage (one week shutdown)
• For MPT-34 and TFC-SR
For MPT-34 and TFC-SR the preservative used is 2000 ppm sodium metabisulfite solution
directly prepared by dissolving Na2S2Os in tripled distilled water.
• For NF-70
FilmTec recommends 1% sodium metabisulfite solution directly prepared by dissolving
Na2S2C>5 in tripled distilled water, i.e. tap water that has been purified using triple-effect
distillation system.
33

Eluent for Ion Chromatosraphv
The following were dissolved in millipore water to make up one (1) liter of eluent solution:
34 grams Boric Acid
11.75 grams Gluconic Acid Anhydride
15 grams LiOH
The eluent solution was diluted by adding appropriate amount of millipore water to prepare 15 %
solution which is injected into the ion chromatography equipment.
Sample Solutions for Analysis
All samples were diluted to the required level prior to analysis using AAS or IC by the addition of
appropriate quantity of millipore water (tap water that has been purified by RO) to the appropriate
amount of sample.
Standard Solutions for AAS and IC
All standard solutions used were prepared from 1000 ppm standard solution.
3.4 Experimental Procedures
The experiments performed are classified based on the type of feed solution used as follows:
a) Experiments using pure water to verify linearity of water flux with pressure differential.
b) Experiments using solutions of single electrolyte solutes at varied operating conditions.
c) Experiments using solutions of a mixture of two different electrolyte solutes at constant feed
solution temperature and operating pressure but variable total salt concentration.
34

d) Experiments using solutions having a mixture of three different electrolyte solutes at constant
feed solution temperature and operating pressure but variable total salt concentration.
Table 3.4. la shows the operating conditions used for experiments using pure water.
Table 3.4.1a Operating Conditions for Experiment Involving Pure Water as Feed
Membrane
MPT-34
NF-70
TFC-SR
Temperature, °C
30
30
30
Pressure, kPa
800 to 1000
100 to 400
100 to 400
The experiments done using solutions, each having single electrolyte solute were carried out at
different sets of conditions. Each experiment involves flux measurements and analysis of
permeate samples collected for anion and cation concentration determination. Ion rejections are
calculated from the ion concentration obtained by permeate sample analysis. The conditions used
for experiments on solutions having single electrolyte solute are as follows:
(a) Variable pressure at constant temperature and feed concentration
(b) Variable temperature at constant pressure and feed concentration
(c) Variable concentration at constant pressure, temperature and pH of solution
(d) Variable solution pH at constant pressure, temperature and feed concentration
Table 3.4. lb shows the list of conditions used in the different experiments done.
Experiments involving condition (c) were used to determine possible build-up of ions in the
membrane. If present, building-up of ions may indicate that there is attraction between membrane
and ions. It will also effect the concentration and composition of the permeate solution. The same
series of experiments were repeated immediately upon completion of the first run without
cleaning the installed membrane prior to the re-run. The re-run was done under exactly the same
condition as the first run. The ion rejections resulting from the first cycles are compared from
those resulting from the repeat cycles.
35

Time dependence of results from the above experiment was determined by collecting permeate
samples of different volumes (20 ml, 30 ml, 50 ml) in an experimental run. The sample collection
time was used to calculate the corresponding permeate flux. The rejection of ions corresponding
to the collection time was obtained by sample analysis.
Table 3.4.1b Operating Conditions Used in Experiments on Solutions of Single ElectrolyteSolute
NF Membrane TemperaturePCI
PressureffcPal
Concentration pH
a) Variable pressure at constant temperature and feed concentration
MPT-34 [NaCl, Na2SO4,CsCl, CoCl2l
NF-70 [NaCl, Na2SO4,CsCl, CoCl2l
TFC-SR [NaCl, Na2SO4,CsCl, CoCl2]
30
30
30
1000 to 1400
100 to 400
100 to 400
8.55 x 10³
mols/L
8.55 x 10'3
mols/L
8.55 x 10"3
mols/L
7
7
7
b) Variable temperature at constant pressure and feed concentration
MPT-34 [NaCl]
NF-70 [NaCl]
TFC-SR [NaCl]
20 to 30
20 to 30
20 to 30
1000
400
400
500 ppm
500 ppm
500 ppm
7
7
7
c) Variable concentration at constant pressure, temperature and pH of solution
MPT-34 [NaCl, Na2SO4,csci, cocy
NF-70 [NaCl, CsCl, CoCl2]
TFC-SR [NaCl, Na2SO4,CsCl, CoCy
30
30
30
1000
400
400
0.0001 to 0.01mols/L
0.0001 to 0.01mols/L0.0001 to 0.01mols/L
7
7
7
d) Variable solution pH at constant pressure, temperature and feed concentration
MPT-34 [NaCl, CsCl]
TFC-SR [NaCl, CsCl]
30
30
1000
400
500 ppm
500 ppm
2 to 12
2 to 12
Note: The list of electrolyte solutes tested are enclosed in [ ].
36

The experiments involving solutions having mixtures of different electrolyte solutes were done at
constant temperature, pressure. Using 1:1 mole ratio of solutes, experiments were carried out at
different total salt concentration for solutions having combinations of two different solutes.
Similarly, experiments were carried out at different total salt concentration for solutions having
combinations of three different solutes using 1:1:1 mole ratio of solutes. Table 3.4.1c provides the
list of operating conditions used for experiments involving solutions having combinations of two
different solutes. Table 3.4.Id provides the list of operating conditions used for experiments
involving solutions having combinations of three different solutes.
Table 3.4.1c List of Operating Conditions Used in Experiments Involving Solutions HavingCombinations of Two Different Electrolyte Solutes
Membrane
MPT-34
NF-70
TFC-SR
SoluteCombination(1:1 by mole)
NaCl-Na2SO4
NaCl-CsClNaCl-CoCl2
CsCl-CoCl2
NaCl-Na2SO4
NaCl-CsClNaCl-CoCl2
CsCl-CoCl2
NaCl-Na2SO4
NaCl-CsClNaCl-CoCl2
CsCl-CoCl2
SaltConcentration
ppm
10, 50, 100
10, 50, 100
10, 50, 100
Temperature°C
30
30
30
PressurekPa
1000
400
400
Table 3.4.1 d List of Operating Conditions Used in Experiments Involving Solutions HavingCombinations of Three Different Electrolyte Solutes
Membrane
MPT-34
NF-70
TFC-SR
SoluteCombination(1:1 by mole)
NaCl-CsCl-CoCl2
NaCl-CsCl-CoCl2
NaCl-CsCl-CoCl2
SaltConcentration
ppm
10, 50, 100
10, 50, 100
10, 50, 100
Temperature°C
30
30
30
PressurekPa
1000
400
400
37

3.5 Analytical Procedures
Atomic Absorption Spectrometry
Cation concentrations in permeate samples were measured using Varian Atomic Absorption
Spectrometer (AAS). Table 3.5.1 provides the list of the conditions used for the analysis of
cations from permeate samples.
Table 3.5.1 Selected Variable Parameters in AAS Operation
Cations
Na+
Co+2
Cs+1
Wavelength, nm
589.0
240.7
852.1
Concentration,ppm0.003-1.5 ppm
0.06 - 15 ppm
0.2 - 25 ppm
Slit, nm *
0.5
0.2
1.0
Determines the spectral bandpass.
Ion Chromatography
Anion concentrations were determined from permeate samples using Waters Ion/Liquid
Chromatography.
pHMeter
The pH of feed and permeate solutions were measured by Packard pH Meter.
Electron Microscope
To investigate membrane samples before and after completion of experiments, membrane
samples were subjected to electron microscope investigation using JXA-840 Scanning
Microanalyzer. Observations were made for sample area of 100 fun and 1 jjm wherein image of
the selected area was magnified 250 times and 5,000 times respectively.
38

Chapter 4
DISCUSSIONS OF RESULTS
4.1 Water Flux and Solvent Permeability:
From equation 2.4.1 permeate flux for a porous membrane has been defined as follows:
Jv=L(AP-crAri) ( 4 1 1 )
The pressure differential (AP) represents the difference between the pressures in the opposite side
cf the membrane. In the experiment, AP was measured as the difference between the pressure at
permeate receiver and the applied pressure. The plot of pressure differential (AP) against pure
water flux (Jv) should result to straight line having slope corresponding to the hydraulic
permeability (L).
Equation 2.4.2 defined the osmotic pressure differential (AIT) as:
All = <4 1 2)
where c is the solution concentration, T is the feed solution temperature, and <j> is a correction
factor called osmotic coefficient set at 1.
To determine the hydraulic permeability (L) of the NF membrane samples MPT-34, NF-70 and
TFC-SR, experiments using distilled water were carried out at constant temperature but at
variable operating pressure. Water fluxes were measured at different pressures for each of the
membrane samples, taking three trials for each measurement. The ranges in operating pressure
were kept within those recommended by the respective manufacturer of each membrane while
temperature was kept constant at 30°C.
Permeation started at pressure close to 100 kPa for NF-70 and TFC-SR. For MPT-34, permeation
started at 600 kPa. The experiments were carried out at operating pressure range of 100 kPa to
500 kPa for both NF-70 and TFC-SR. For MPT-34, experiments were done at pressure range of
800 kPa to 1100 kPa. Water fluxes were measured several times for each pressure setting by
collecting permeate through a graduated cylinder. The time elapsed to obtain 30 ml of permeate
39

sample was measured. Water flux was calculated from the measured collecting time and
permeates volume using the membrane area (each membrane was of 23.3 cm long and 2.5 cm
wide). The pressure relief valve attached to the set-up limited the operating pressure to less than
1500 kPa.
E
=lux,
L/s
q. en o
ter
1c
L = 0.181 J»
y S ^ L = 0.1613
S' L = 0.0277
) 200 400 600 800 1000
Pressure Differential, kPa
O NF-70 - • - M P T - 3 4 A TFC-SR
Figure 4.1.1 Water flux vs. pressure differential for different membranes (MPT-34, NF-70, and
TFC-SR). Hydraulic permeability (L), [L-m^-h^kPa] were calculated as the slope of the lines
obtained from the plots of water flux vs. pressure differential from experimental data using
Equation 2.4.1 with the value of the reflection coefficient (a) set to 1 and the osmotic pressure
{AIT) calculated from Equation 2.4.2 with osmotic pressure coefficient (^ ) set to 1. Values of L
obtained are 0.0277 for MPT-34,0.1613 for NF-70, and 0.181 for TFC-SR.
There were at least three trials for each flux measurement. The results obtained from the different
trials for each run were the same. The highest relative standard deviations for water flux
measurements were 0.02,0.015, and 0.015 for TFC-SR, NF-70, and MPT-34, respectively,
The plots of water flux against the pressure differential obtained are shown in Figure 4.1.1. The
results are linear for all the membrane tested. The slope of each line represents the hydraulic
permeability (L) of the membrane. The value of L for each membrane was determined from the
average water flux. The obtained values of L are as follows: 0.0277 for MPT-34, 0.1613 for NF-
40

70, and 0.181 for TFC-SR. Both NF-70 and TFC-SR were found to be water permeable at lower
pressure differential unlike MPT-34.
4.2 Permeate Flux of Electrolyte Solutions
Each membrane sample was tested by passing NaCl solution through each membrane namely,
MPT-34, NF-70, and TFC-SR. Permeate flux was measured by collecting a known volume of
permeate in a graduated cylinder and recording the corresponding collection time. The permeate
flux (Jv) in Iiters/m2-sec. was calculated based on the following equation:
J~=h (421)
In the above expression, V is the volume of permeate collected converted to liter, t is the
collection time converted to hours and A is the membrane area converted to m2. Each membrane
has a rectangular dimension of 23.3 cm length and 2.5 cm width.
4.2.1 Effect of Time on Flux Measurement
Permeate samples were collected using graduated cylinder collecting 20 ml, 30 ml and 50 ml
permeate separately one after the other. Collection time was recorded in each case. The permeate
flux corresponding to each volume of sample collected was calculated and compared with one
another for every membrane. The results were almost the same for each membrane, showing that
permeate flux remains the same for the period of time covered by the experimental run.
4.2.2 Permeate Flux and Temperature
Permeate flux measured at constant pressure using 500 ppm NaCl (8.55 x 1E-3 mols/L) solution
increase with increase in solution temperature for the three membranes tested. Test runs with
MPT-34 were carried out at constant pressure of 1000 kPa and with NF-70 and TFC-SR at 400
kPa. The test temperature range is from 20 to 30° C for the three membranes. At least three trials
were taken for each flux measurement and the permeate flux was taken from the average of the
different trials. Figure 4.2.1 shows the results for MPT-34, NF-70 and TFC-SR. The highest
relative standard deviations obtained from the different permeate flux measurements were 0.016,
0.014, and 0.02 for TFC-SR, NF-70, and MPT-34, respectively.
41

The results of this experiment show that permeate flux increases as the feed solution temperature
is increased.
jtr 50 -I
3 40§ 30% 2 0
1 10 -Ie
0n. 273 283 293 303
Temperature, Degrees K
313
O MPT-34 HNF-70 A TFC-SR
Figure 4.2.1 Permeate Flux vs. temperature for different NF membranes using 500 ppm NaCl.
Operating pressures were 1000 kPa for MPT-34 and 400 kPa for NF-70 and TFC-SR.
4.2.3 Permeate Flux and Feed Solution Concentration
The plots of the results of the experiments on the effect of feed concentration on permeate flux
are shown in Figures 4.2.2a, 4.2.2b, and 4.2.2c. These plots show that permeate flux decreases at
increasing feed concentration at very low concentration range but remain almost constant as the
concentration is further increased. The tests were done at constant operating pressure. The applied
pressure for each membrane was according to the recommendation of the manufacturer of the
membrane. Single solute feed solutions of NaCl, Na2SO4, CsCl, and C0CI2 at concentration of
8.55 x 1E-3 mols/L were tested to determine the effect of solution concentration and the type of
solute on the permeate flux. The operating pressure used were 1000 kPa for MPT-34 and was 400
kPa for NF-70 and TFC-SR. The solution temperature was maintained at 30°C.
At least three trials were taken for each flux measurement. The relative standard deviations for
permeate flux were 0.014, 0.016, and 0.018 for TFC-SR, NF-70, and MPT-34, respectively.
Permeate flux is also shown to be dependent on the type of salt. Test results with MPT-34, NF-70
and TFC-SR show that permeate flux decreases according to the type of as follows:
NaCl, CsCl > Na2SO4 , CoCl2

It was observed that the permeate flux from NaCl solution and CsCl solution have very close
values. Almost similar values of permeate fluxes were also observed from Na2SO4 solution and
C0CI2 solution.
The above differences in permeate fluxes may be related to the physical properties of the
electrolyte solutions. The properties may be dependent on the solute characteristics such as
viscosity. The viscosity of solutions of electrolytes is a function of the mobility of the ion [44].
Ionic mobility is affected by the hydration of the ion. The more hydrated the ion, the more mobile
it becomes [68].
Permeate Flux Behavior with Bulk Solution Concentration
2 4 6 8
Feed Concentration, mols/L x 1E+3
10
- © - N a C l -Na2SO4 -CsCl -CoCI2
Figure 4.2.2a Permeate flux vs. feed concentration in MPT-34 for different solutes. Operating
pressure and solution temperature were 1000 kPa and 30°C, respectively.
43
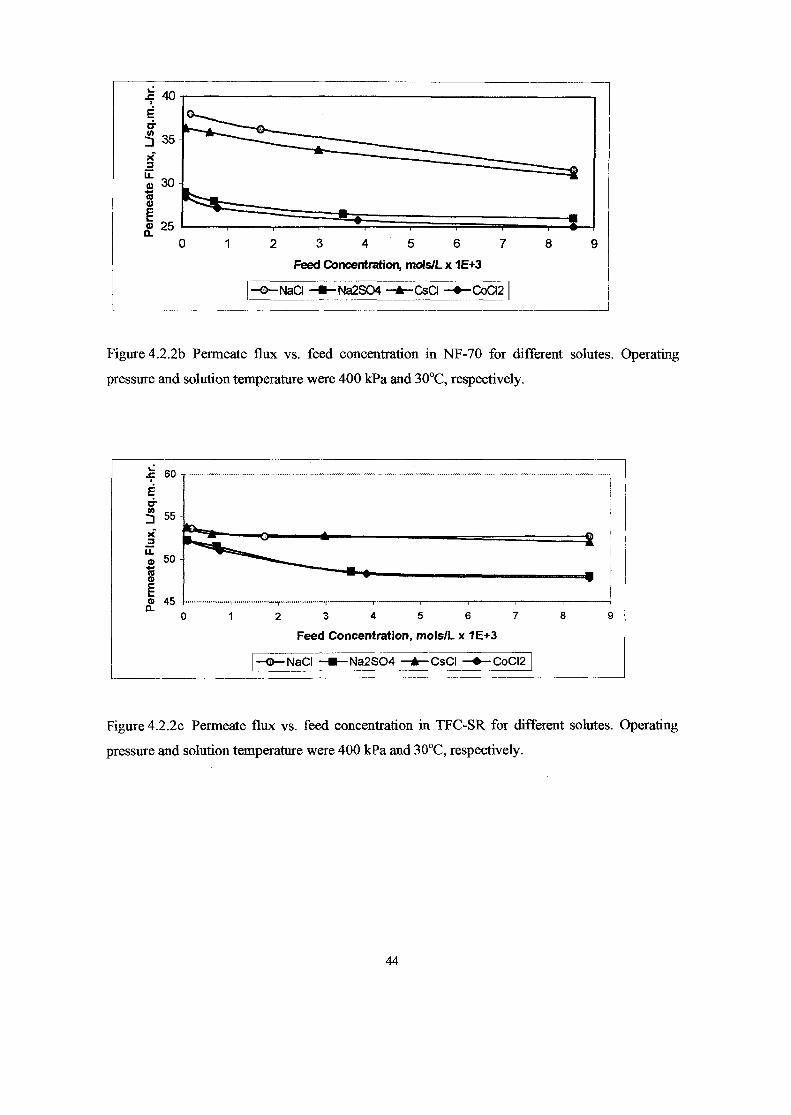
3 4 5 6
Feed Concentration, mcrfs/L x 1E+3
-O-NaCi -Na2SO4 -CsQ -CoCI2
Figure 4.2.2b Permeate flux vs. feed concentration in NF-70 for different solutes. Operating
pressure and solution temperature were 400 kPa and 30°C, respectively.
60 1
, L/
sq
_3
neat
e F
I
55
50
452 3 4 5 6 7
Feed Concentration, mols/L x 1E+3
—©—NaCI -Na2SO4 -CsCI -CoCI2
Figure 4.2.2c Permeate flux vs. feed concentration in TFC-SR for different solutes. Operating
pressure and solution temperature were 400 kPa and 30°C, respectively.
44

4.2.4 Permeate Flux and Pressure
Experiments involving 8.55 x 1E-3 mols/L solutions of single solute containing NaCl, Na2SO4,
CsCl, and CoCl2 at various pressures and constant temperature of 30°C were done to determine
the effect of pressure on the permeate flux of different solutes. In these experiments it was also
intended to determine if the resulting trends in fluxes will be in agreement with the osmotic
pressure model. The tests were done using MPT-34, NF-70, and TFC-SR membranes. Each
membrane was thoroughly cleaned with water before and after replacing the feed tank content
with another type of solution.
A. Trends and Behavior with Increase in Pressure Differential
Figures 4.2.3a to 4.2.3c show plots of permeate flux vs. pressure. Each graph includes plot of
water flux, which is linear with pressure and has slope equivalent to the hydraulic permeability, L
(obtained by regression). Permeate flux of electrolyte solutions were lower than that of pure
water. Unlike that of pure water, permeate flux of solution deviate from linearity as the pressure
is increased. The level in the permeate fluxes become closer as the pressure differential is
increased so that the plot of permeate flux versus pressure differential tends to form a curve
below the line representing pure water.
Operations involving the three different membranes required different pressure differentials, AP.
The results show that the three different membranes illustrate different levels at which the
permeate flux forms a curve below the water flux line. These differences could be attributed to
the differences in the pore size and thickness of membranes.
Different solutes show different levels of permeate fluxes at the same pressure differential
implying that permeate flux is dependent on the type of salt. Based on the results obtained from
experiments on NF-70 (see Figure 4.2.3b) permeate flux decrease according to type of solute as
follows:
NaCl > CsCl > Na2SO4 > CoCl2
Similar trends are also shown by the results of the experiments on MPT-34 and TFC-SR, but the
differences in the level of permeate fluxes between the different solutes are not very significant.
45

•hr.
liter
s/sq
.m.-
Flu
x,
30
25-
20-
15
10
5-
01
Rae\S&er S ^ * ' ' *L=0.0277 y f f : : l <
*£L - J _ 1 1 1 L_ _ | , 1 1
100 200 300 400 500 600
Pressure Differential, KRa
7D0 800 900 1000
NaQ - Na2SC4 - - *• - OsQ - - •• - OoCI2
Figure 4.2.3a Permeate flux vs. pressure differential in MPT-34 for pure water and 8.55 x 1E-3
mols/L solutions of single solute containing NaCl, Na2SO4, CsCl, and CoCl2 at various pressures
and constant temperature of 30°C. Membrane hydraulic permeability, (L) is 0.0277, obtained as
the slope of the line for pure water.
46

m
a-(0
Flux
,
a-)
50
40
30
20
10
n i
i
0 50 100
- -#- Nad
_ * * *
150 2D0
Rcssueuffiei
- - * - N329C4
/
250 300
• • | I/TV.
entici, r>ra
A--CBQ
• • • ™
- - *
I , , t
350 400 450
-•-•0002
Figure 4.2.3b Permeate flux vs. pressure differential in NF-70 for pure water and 8.55 x 1E-3
mols/L solutions of single solute containing NaCl, Na2SO4, CsCl, and CoCl2 at various pressures
and constant temperature of 30°C. Membrane hydraulic permeability, (L) is 0.1613, obtained as
the slope of the line for pure water.
47

I
£
iter
/sq.
u_
50
40
30
20
10-
n wr iu • i
0 50
RieV\£terL=0.181
y. , , , I 1
r • • i
100 150 200
FYessure Lllleneitial
• l ^a - -» - -M2SO* - - * -
250
,KRa
300
•CbO2
. .1
350
Figure 4.2.3c Permeate flux vs. pressure differential in TFC-SR for pure water and 8.55 x 1E-3
mols/L solutions of single solute containing NaCl, Na2SC<4, CsCl, and CoCl2 at various pressures
and constant temperature of 30°C. Membrane hydraulic permeability (L) is 0.181, obtained as the
slope of the line for pure water.

B. Permeate Flux and the Osmotic Pressure Model
The measured permeate fluxes were compared with those predicted by the osmotic pressure
model. Equation 2.4.1 was used to predict theoretical flux with the assumption that the
membranes used were "ideal semi-permeable" membranes, permit the passage of water but not
solute. The reflection coefficient (or) was set to 1.
Equation 2.4.2, which is applicable to solutions that depart from ideality was used to estimate the
osmotic pressure differential (All). The equation was stated as follows:
An = 6cRT (4.2.2)
where c is the solution concentration, T is the temperature, and 6 is a correction factor called
osmotic coefficient. Since the solution concentration falls between 0.1 to 0.001 M, 6 is set to 1
based on values provided in Table 2.7.6 of Horvatt, Handbook of Electrolyte Solutions [44].
Figures 4.2.3a to 4.2.3c show that the plot of permeate flux against pressure forms curves located
below the line representing water flux for the membrane. This is true for the different membranes
MPT-34, NF-70, and TFC-SR. There were very close agreement between the experimental results
and the calculated values resulting from the osmotic pressure model. The maximum observed
difference is ±5%.
These experiments show that permeate fluxes measured from an operation done by passing dilute
solution with single electrolyte solute through NF membrane agrees with the osmotic pressure
model.
49

4.2.6 Permeate Flux and Feed Solution pH
The pH of the feed solution significantly affects permeate flux obtained in passing 500 ppm NaCl
solution at an applied pressure of 1000 KPa and solution temperature of 30°C through MPT-34
(see Figure 4.2.4a). Highest flux was obtained when the feed solution is neutral. Permeate fluxes
were much lower and remained almost constant when the feed solution pH was decreased from
pH 5 to pH 3. A similar trend was obtained when feed solution pH was increased from pH of 6 to
pH 8. The permeate flux was significantly increased from feed solution pH of 3 to pH of 2. There
was a significant flux lowering when the feed solution pH was increased from 10 to 12.
Similar trends were obtained in passing 500 ppm NaCl solution through TFC-SR at an applied
pressure of 400 KPa and solution temperature of 30°C. The changes of permeate flux with feed
solution pH however was not large enough unlike in MPT-34 (see Figure 4.2.4b). Similar to that
of MPT-34, a higher level of flux was obtained when the feed solution pH was dropped from 3 to
2. There was flux lowering from feed solution pH of 8 to pH of 10.
Figure 4.2.4a Permeate flux vs. feed solution pH obtained in passing 500 ppm NaCl solution
through MPT-34 at operating pressure of 1000 KPa and solution temperature of 30°C.
50

Figure 4.2.4b Permeate flux vs. feed solution pH obtained in passing 500 ppm NaCl solution
through TFC-SR at operating pressure of 400 KPa and solution temperature of 30°C.
51

4.3 Separation Mechanism from the Analysis of Rejection Data
4.3.1 Introduction
Typically, in charged UF and RO membranes, feed solution of low solute concentrations would
show higher rejection than those of high solute concentrations [17, 31]. In order to determine if
this principle holds true in NF membranes, experiments involving solutions of single electrolyte
solute and mixture of electrolytes were performed at constant pressure and temperature at
different feed solution concentrations. These experiments were intended to determine the
following:
a) If the level of anion rejection and cation rejection will be the same;
b) If the behavior of cation and anion rejection with the feed concentration will be the same
as those obtained by other authors from experiments on charged UF and RO membranes.
Permeate samples collected from experiments were analyzed for cation and anion content and
studied. Cation concentrations were measured using Varian Atomic Absorption Spectrometer
while anion concentrations were determined using an ion chromatography analysis.
To calculate ion rejection, R from the permeate concentration obtained from permeate samples,
the following equation was used:
(4.3.1)
where cp is the permeate concentration [mols/L], c/is the feed concentration [mols/L] and i is the
ion specie.
From the rejection data at different feed concentrations, ion separation was evaluated. The effect
of pH on the rejection of ions was also determined. In the evaluation of the results, the hydration
model by Frank and Wen (1957) was used to describe ion behavior in dilute electrolyte solutions.
52

A. The Ion Hydration Model
In order to establish a model for the mechanism of ion separation in nanofiltration membranes, it
is necessary to describe ions in solution in terms of a model. In this research, solutions used in the
experiments are of low concentrations (below 0.01 mols/L). For this matter, it was assumed that
ions in solution agree with the ion hydration model proposed by Frank and Wen (1957) which
was based on solution of infinite dilution.
In the model proposed by Frank and Wen [46, 47], three regions around the solvated ion are
defined. The region of disordered and highly mobile solvent molecules surrounds the assumed
rigid and ordered inner solvation shell. The later region contains the ion. The outermost region is
the region of the bulk of pure solvent.
In nanofiltration membrane where the membrane pore size is thought to be within nanometer
range, separation of ions surrounded by water as described by this model could be possible in a
very dilute electrolyte solution.
B. Ion Adsorption on a Neutral Surface
Based on the explanation of Shaw [40] (See Chapter 2.), nanofiltration membranes are assumed
to have acquired surface charge when brought into contact with an aqueous electrolyte solution.
From the analysis of the rejection data obtained from the experiments, the mechanisms
responsible for the acquired charge of the NF membranes tested could be identified
4.3.2 Ion Separation in Solutions of Single Electrolyte Solutes
A. Ion Rejection and Time
The effect of time on ion rejection was determined by passing through each of the different
membranes 8.56 x 10"3 mols/L NaCl solution at constant solution temperature of 30°C and
constant applied pressure of 1000 kPa for MPT-34 and 400 kPa for NF-70 and TFC-SR,
respectively. During each run, 20 ml, 30 ml and 50 ml permeate samples were collected one after
53

the other in separate vials. Each of these volumes of permeate corresponds to different collection
time. The samples were taken for analysis (AAS for Na+ and IC for Cl~).
The anion rejections obtained from 20 ml, 30 ml and 50 ml samples were almost the same for
each membrane used. This was also true with the cation rejections obtained from 20 ml, 30 ml,
and 50 ml samples for each membrane used. These results show that ion rejection remains the
same for the period of time covering the experimental run.
B. Reproducibility of Ion Rejection and Retention of Ions in the Membrane
Experiments involving solutions of single electrolyte solute were performed at constant solution
temperature of 30°C and constant applied pressure of 1000 kPa for MPT-34 and 400 kPa for NF-
70 and TFC-SR, respectively. Feed concentration was varied within the low range of 1.7 x 10^
mols/L to 8.56 x 10"3 mols/L. At this low range of feed concentration, the interionic forces of
attraction are thought to be minimal and ionic separation can be closely observed [44, 50].
Experimental runs were done starting from the lowest solution concentration. The concentration
was gradually increased by the addition of solute to the feed tank. Running the set-up for ten to
fifteen minutes while recycling the collected permeate to the feed tank was done to allow
complete mixing of the feed solution.
Three trials were taken for each experimental run. Permeate sample was collected for analysis
during each trial. After a series of experimental runs for a specific electrolyte, the series of
experiment was repeated without cleaning the membrane. This was done by replacing the content
of the feed tank with fresh solution with concentration of 1.7 x 10~3 mols/L. The set-up was
operated repeating exactly the same procedures as the first cycle. This was intended to determine
reproducibility of ion rejections and the possible build-up of ions in the membrane.
54

o••&ua>
1o
1 -1
0.5 -
0 -(
-0.5 -
-1 -
-1 fi
_
2 4 6 8 1JD
Feed Concentration, mols/Lx1E+3
-Cycle 1 :Sodium
•Cycle 2:Sodium
— Cycle 1:Chloride
- -Cycle 2:Chloride
Figure 4.3.1a Ion rejection vs. feed concentration in MPT-34 for two cycles: cycle 1 starts with
clean membrane and cycle 2 is just a replicate of the first cycle but started immediately upon
completion of cycle 1 without cleaning the membrane. Operating pressure is 1000 kPa and
solution temperature is 30°C. Solid lines and broken lines are used to illustrate trends for cycle 1
and cycle 2, respectively.
4 6
Feed Concentration, mols/Lx1E+3
10
-Cycle 1:Sodium
•Cycle 2:Sodium
—*—Cyc le 1:Chloride
- - * - Cycle 2:Chloride
Figure 4.3.1b Ion rejection vs. feed concentration in NF-70 for two cycles: cycle 1 starts with
clean membrane and cycle 2 is just a replicate of the first cycle but started immediately upon
completion of cycle 1 without cleaning the membrane. Operating pressure is 400 kPa and solution
temperature is 30°C. Cycle 1 and cycle 2 are represented by solid lines and broken lines,
respectively.
55

ectio
nIo
n R
ej
1 -
0.5 -
0 -C
*»'
I
^^"""——— A . .
*
2
©—
• - * -
, . _ „
4
Feed Concentration,
-Cycle 1:Sodium
•Cycle 2:Sodium
6 8
mols/Lx1E+3
— * - -Cycle 1.Chloride
•Cycle 2:Chloride
—ik
-A
i
i
I10
Figure 4.3.1c Ion rejection vs. feed concentration in TFC-SR for two cycles: cycle 1 starts with
clean membrane and cycle 2 is just a replicate of the first cycle but started immediately upon
completion of cycle 1 without cleaning the membrane. Operating pressure is 400 kPa and solution
temperature is 30°C. Solid lines and broken lines are used to illustrate trends for cycle 1 and cycle
2, respectively.
The results of the sample analysis obtained from the different trials were the same for each run.
The highest relative standard deviation was 0.015, indicating that ion rejections are reproducible
at a given low feed solution concentration.
Ion rejections set at cycle 2 were lower than those set at cycle 1 at concentration below 1.7 x 10"3
mols/L for MPT-34, NF-70 and TFC-SR. The results are shown in Figures 4.3.1a to 4.3.1c. The
Cl" rejection in MPT-34 at the cycle 2 was negative due to the presence of retained solution in the
membrane from cycle 1. Negative rejection means that the concentration of the ion specie in the
permeate sample is higher than the concentration of the same ion specie in the feed. As cycle 2
was started, with the feed tank replaced with 1.7 x 10"4 mols/L solution, the retained solution was
flushed by the dilute feed solution producing more concentrated permeate than expected.
However, the ions retained during the high-concentration run of cycle 1 were not completely
flushed out from the membrane by the dilute feed solution of cycle 2.
As the concentration of solution in the feed tank is increased and high-concentration run of cycle
2 was continued, the retained ions in the membrane were further flushed out of the membrane. At
this stage, the effect of retained ions (from cycle 1) that mixed with the circulating concentrated
56

feed solution (of cycle 2) was no longer significant. The level of rejection of ions in cycle 2
approach that in cycle 1 until the rejection levels in cycle land in cycle 2 are equal.
C. Charge Separation
In the experiments involving solution of single electrolyte solutes, it was shown that in feed
concentration below 0.01 mole/L, cation rejections are higher than anion rejections (see Figures
3.3.2a to d, Figures 3.3.3a to c, and Figures 3.3.4a to d for MPT-34, NF-70, and TFC-SR,
respectively). Such separation similarly occurs in filtering/passing NaCl, CsCl, Na2SO4, and
CoCl2 solutions through MPT-34, NF-70 and TFC-SR.
The observations are as follows:
• The rejection of cation and anion remain the same at concentration approaching 0.01
mole/L indicating that balance of charge occurs at higher level of concentration.
• The difference between the rejection of cation and anion at very low concentration vary
according to the type of the membrane: the difference in TFC-SR is greater than that in
NF-70.
• Ion rejections become almost unchanged above concentration of 3 x 10"3 mole/L which is
contrary to what Ikeda et al. (1988) previously found for charged membranes, i.e. that
salt rejection would decrease rapidly with increasing salt concentration in charged
membranes.
The lower rejection of anions than cations indicate that anions are well adsorbed on the
membrane surface that must have caused the membrane to have negative surface charge. These
anions are drawn with the flow of water through the membrane resulting in lower rejection of
anion than the rejection of cation. As the bulk solution concentration is increased, distances
between ions decreased causing the interionic forces of attraction to be significant. Large particles
resulting from the attraction between ions must have formed which prevented some individual
ions to pass through the membrane. This phenomenon must have limited the level of rejection of
both anions and cations so that ion rejections remained almost the same at higher level of feed
concentration.
57

Ion Separation in MPT-34
C 0.8of> 0.62 " 0 .4-c•2 0.2 A
MPT-34
2 3 4 5 6 7
Feed Concentration, mols/L x1E+3
• N a + - - A - - C I -
Figure 4.3.2a Ion rejection vs. feed concentration in passing NaCl solution through MPT-34 at
operating pressure of 1000 kPa and solution temperature of 30°C.
1 -I
0.8
8 °-6
QZ 0.4c•2 0.2
2 3 4 5 6 7
Feed Concentration, mols/L Na2SO4 x 1E+3
-Sodium Ion - - A--Sulfate Ion
Figure 4.3.2b Ion rejection vs. feed concentration in passing Na2SO4 solution through MPT-34 at
operating pressure of 1000 kPa and solution temperature of 30°C.
58

i R
ejec
tio
1 n
OR -
0.6 -
0.4 -
0.2 -
n
c
.•A
k
1
™—_™ _ „
A
2 3 4
Feed Concentration,
- ^ C s +
5 6
mols/L CsCl
- - A- - -Cl-
7
X1E+3
A
8
j
|
i
i
9
Figure 4.3.2c Ion rejection vs. feed concentration in passing CsCl solution through MPT-34 at
operating pressure of 1000 kPa and solution temperature of 30°C.
UO
I
Rej
eIo
n
1 -
0.8 -
0.6 -
0.4 -|
0.2 -
n
(
P_ „,„.. ,.,.,—»,
•""--Hi
4- A
) 1 2
Feed
•
. . - . <A- - -
3 4 5
Concentration, mols/L
— • — Co++ - - A- -
6
CoCI2 x
•Cl-
7
1E+3
•
- - - - - A
8 9
Figure 4.3.2d Ion rejection vs. feed concentration in passing CoCl2 solution through MPT-34 at
operating pressure of 1000 kPa and solution temperature of 30°C.
59

loo Separation in NF-70
Feed Concentration, mols/L NaCl x 1E+3
Figure 4.3.3a Ion rejection vs. feed concentration in passing NaCl solution through NF-70.
Operating pressure was 400 kPa and solution temperature was 30°C.
Ion
Rej
ecti
i
1 i
0.8
0.6 -
0.4
0.2 -
n -
K'
0 1
—• - ©A
2 3 4
Feed Concentration,
^ - C s + -
5 6
mols/L CsCl
-A - -C I -
7
X1E+3
————,
A !!|
8 9
Figure 4.3.3b Ion rejection vs. feed concentration in passing CsCl solution through NF-70.
Operating pressure was 400 kPa and solution temperature was 30°C.
60

g 0.8
g 0.6
O 0.2-1
: : z : z : z : : : : : : : : : : : : : : : : :
2 3 4 5 6 7
Feed Concentration, mols/L CoCI2 x 1E+3
•Co++ - -A-- Cl-
Figure 4.3.3c Ion rejection vs. feed concentration in passing CoC12 solution through NF-70.
Operating pressure was 400 kPa and solution temperature was 30°C.
Ion Separation in TFC-SR
ject
ion
Ion
Re
4
0.8
0.6
0.4 -
0.2 -
n
(
A'""
3
*"-
1
— *
--A
2 3 4
Feed Concentration,
—•—Na+
5 6
moles/LNaClx1E+3
- - A - - C I -
7 8
TFC-SR
- A
c>
Figure 4.3.4a Ion rejection vs. feed concentration in passing NaCl solution through TFC-SR.
Operating pressure was 400 kPa and solution temperature was 30cC.
61

C 0.8 -O
g 0.6 -"57Q£ 0.4c2 0.2-
0 -
*
2 3 4 5 6 7
Feed Concentration, moles/L Na2SO4 x 1E+3
•Na+ --A---S04=TFC-SR
Figure 4.3.4b Ion rejection vs. feed concentration in passing Na2SO4 solution through TFC-SR.
Operating pressure was 400 fcPa and solution temperature was 30°C.
Feed Concentration, moles/L CsCl x 1E+3
Figure 4.3.4c Ion rejection vs. feed concentration in passing CsCl solution through TFC-SR.
Operating pressure was 400 kPa and solution temperature was 30°C.
62

Feed Concentration, motes/L CoCU x 1B3
Figure 4.3.4d Ion rejection vs. feed concentration in passing CoCl2 solution through TFC-SR.
Operating pressure is 400 kPa and solution temperature is 30°C.
63

D. Comparison of Cation Rejections in Solutions with Single Electrolyte Solute
Cation rejection remains almost the same at concentration between 3 x 10~3 moles/L and 9 x 10~3
moles/L in solutions of single electrolyte solutes. Figures 4.3.3a to 4.3.3c show plots of the
concentration vs. the rejection of mono- and di-valent cations in MPT-34, NF-70 and TFC-SR
membranes at constant operating pressures and temperature. The rejection of mono-valent ions
i.e. Na+ and Cs+ is lower than that of the di-valent cobaltous ion, Co++ at concentration below 9 x
10" moles/L. MPT-34 and TFC-SR show significant differences in the rejection of mono-valent
and di-valent cations (see Figures 4.3.5a and 4.3.5c). NF-70 showed very high cation rejections,
so high that the values are almost the same for Na+ and Cs+. These cations (Na+ and Cs+) are both
mono-valent, however, based on Table 2.4.1, Na+ has larger hydration number (h) than Cs+. The
size of the bare ion of Na+, however, is smaller than that of Cs+. From Kunnin's prediction [41],
less hydrated ions, i.e. has small hydration numbers (h), are more adsorbable. In membrane
operation, particles that are highly adsorbed should be less rejected. On this basis, Cs+ being less
hydrated than Na+ should be less rejected than the latter. Similarly, Co++, which has higher
hydration number (h) than both Na+ and Cs+ should have higher rejection than both the latter.
For solutions of single electrolyte solute, rejection of cation was found decrease in the following
order:
Co++>Na+ >Cs+
Figures 4.3.3a to 4.3.3c show those results for MPT-34, NF-70 and TFC-SR membranes. The
above order of decrease in rejection was compared with the values listed in Table 2.4.1 for
hydration number (h) of the different cations. The hydration number (h) for the three cations was
also found to decrease in the same order. The result of the comparison is given below.
Co++ (11.5) > Na+ (6.5) > Cs+ (4.3)
These results are consistent with the prediction, i.e. cations with high hydration number would be
less adsorbed on the membrane and will be highly rejected, while those with lower hydration
number would be more adsorbed on the membrane and would be less rejected.
64

ectie
ion
Re
<O
o
0.9 ]|7^%ae~- , ^
0.8 J ^ • -
0.7 \
0.6 -
0 "5 -
0 2
Feed
-•-Na+(NaCI)
.. .
4
Concentration
-«-Cs+ - * -
• • _ _
6
mols/L
Co++ —
—_
X1E+3
• - N a +
i
2"—rs i• ;
MPT-34 |
8 10
(Na2SO4)
Figure 4.3.5a Cation rejection vs. feed concentration in solutions of single electrolyte solute in
MPT-34 at operating pressure of 1000 KPa and solution temperature of 30°C. (A comparison
between mono- and di-valent cations)
Feed Concentration, mols/L x 1E+3
Figure 4.3.5b Cation rejection vs. feed concentration in solutions of single electrolyte solute in
NF-70 at operating pressure of 400 KPa and solution temperature of 30°C. (A comparison
between mono- and di-valent cations)
65

0.5
TFC-SR
T—
2 4 6 8Feed Concentration,mols/L x 1E+3
10
•Na+(NaCI) •Cs+ •Co++ •Na+(Na2SO4)
Figure 4.3.5c Cation rejection vs. feed concentration in solutions of single electrolyte solute in
TFC-SR at operating pressure of 400 KPa and solution temperature of 30°C. (A comparison
between mono- and di-valent cations)
E. Effect of Temperature on Ion Rejection
The behavior of ion rejection with temperature was determined from the results of the
experiments performed at constant pressure and feed concentration. Figures 4.3.6a and 4.3.6b
show the plots of ion rejection (Na+ rejection and Cl" rejection, respectively) versus temperature
in degrees Centigrade (°C) for MPT-34, NF-70, and TFC-SR membranes. The data used were
obtained by passing 500 ppm NaCl solution through each membrane at operating pressures of
1000 kPa for MPT-34 and 400 kPa for NF-70 and TFC-SR. The range of temperature used was
from 20°C to 30°C.
The highest relative standard deviations obtained from the different runs were 0.025, 0.022, and
0.028 for MPT-34, NF-70, and TFC-SR, respectively. From the experiment it was found that
different membranes show different levels of ion rejection. All of the membranes tested showed
that ion rejection slightly decreases with increase in temperature.
66

1 -
| 0.8 -
g 0.6-
K 0.4
1 0.2n -
c
• « •« • • - *A -A -A
) 5 10 15 20 25 30 35
Temperature, Degrees C
.-•O-- -MPT-24 - - Wr - NF-70 - - A- - -TFC-SR
Figures 4.3.6a Na+ rejection vs. operating temperature obtained by passing 500 ppm NaClsolution through the different membranes, namely MPT-34, NF-70 and TFC-SR. The operatingpressures are 1000 kPa for MPT-34 and 400 kPa for NF-70 and TFC-SR.
§ °-8
! 0.6-
(S 0.4-
° 0.2-
0 -
m - -A - - -
- - - H - - -
- A - - -
---m
- - A
i
10 15 20 25
Temperature, Degrees C
30 35
- • MPT-34 - - Eh - • NF-70 - - A- - TFC-SR
Figures 4.3.6b Cl" rejection vs. operating temperature obtained by passing 500 ppm NaClsolution through the different membranes, namely MPT-34, NF-70 and TFC-SR. The operatingpressures are 1000 kPa for MPT-34 and 400 kPa for NF-70 and TFC-SR.
67

F. Effect of Applied Pressure on Ion Rejection
The effect of applied pressure on the rejection of ion was determined by passing 8.55 x 10"3
mols/L of NaCl through the different membranes (MPT-34, NF-70, and TFC-SR) at feed solution
temperature of 30°C. Figures 4.3.9a to 4.3.9c show the plots of the rejection of Cl" ions from
NaCl and CsCl versus the applied pressure for MPT-34, NF-70, and TFC-SR, respectively. The
results in ion rejection were found reproducible. The highest values of relative standard
deviations obtained from NaCl solution Cl" rejection data were 0.028, 0.022, and 0.024 for MPT-
34, NF-70, and TFC-SR, respectively. The highest level of relative standard deviations obtained
from CsCl solution Cl" rejection data, were 0.03, 0.024, and 0.028 for MPT-34, NF-70, and TFC-
SR, respectively.
It is shown in Figures 4.3.9a that the level of rejection of Cl" from NaCl solution is slightly higher
than that from CsCl solution. It is also shown that in MPT-34, the rejection of Cl" were almost the
same at the range of applied pressure (1000 kPa to 1500 kPa) used in the experiment. Figures
4.3.9b and 4.3.9c show the same trend in Cl" rejection for NF-70 and TFC-SR, respectively. It is
shown from these two figures the tendency of the Cl" rejection (both from NaCl and CsCl) to
assume a plateau-like form as the applied pressure is increased.
• Rej
ectio
i
o
1 -,
0.8
0.6-
0.4
0.2
n i
C) 200
< ^ * ^ MP
400 600 800 1000
Applied Pressure, KPa
• Cl- from NaCl • Cl- from
T-34
1200
CsCl
••••»• —
A
1400
j
?
%
i
II1
5
1600
Figure 4.3.7a Cl" rejection vs. applied pressure obtained by passing feed solution of single solute
having concentration of 8.55 x 10"3 mols/L at temperature of 30°C through MPT-34 membrane.
68

1 -
c 0.8-o
s °-6
0C 0.4
5 0.2r\ 1
c
/
50
v-=—i -B O
NF-70
100 150 200 250 300 350
Applied Pressure, KPa
—•— Cl- from NaCI —©—Cl- from CsCI
400 450
Figure 4.3.7b Cl" rejection vs. applied pressure obtained by passing feed solution of single solute
having concentration of 8.55 x 10"3 mols/L at temperature of 30°C through NF-70 membrane.
=aTFC-SR
100 200 300
Applied Pressure, KPa
400 500
-Cl-from NaCI -Cl-from CsCI
Figure 4.3.7c Cl" rejection vs. applied pressure obtained by passing feed solution of single solute
having concentration of 8.55 x 10~3 mols/L at temperature of 30°C through TFC-SR membrane.
From this experiment, it was found that ion rejection increases as the applied pressure is increased
but at certain pressure remains the same even if the applied pressure is increased.
69

G. Effects ofpH in Solutions Containing Single Electrolyte Solutes
Childress et al. (1996) found that for four different reverse osmosis and nanofiltration membranes
the zeta potential were positive at pH level below their respective identified isoelectric point and
negative at higher pH levels. Isoelectric point is the pH corresponding to zero zeta potential. They
associated zeta potential to the membrane surface charge. They used two samples of
nanofiltration membranes, TFCS and NF-70. TFCS was positively charged at pH lower than its
isoelectric point of 3 while NF-70 was positively charged at pH lower than its isoelectric point of
4. The two NF membranes were neutral at the isoelectric points, and negative at pH above the
isoelectric points. Their findings are illustrated in Figure 4.3.8. Although the membranes used
differ in their isoelectric points, similar trends were observed for the two membranes, i.e. zeta
potential decreases as pH increases, and is positive below isoelectric point while negative above
isoelectric point. Based on this, they proposed that NF-70 and TFCS are negatively charged
membranes at neutral pH levels.
i
ial,
1oQ.
2N
30
15
0
-15
-30
1J0
Bulk Solution pH
•NF-70 •TFCS
Figure 4.3.8 pH versus zeta potential in nanofiltration membranes with reference to the findings
ofChildresse/fl/. (1996).
In this study, experiments using NaCl solution set at various pH levels were performed for MPT-
34 and TFC-SR. Such experiments were not done for NF-70. HC1 solution was used to lower the
solution pH while NaOH solution was used to adjust the pH to higher range. Permeate fluxes and
ion rejections at the applied pH were determined with the operating pressure and solution
temperature kept constant for both membranes. Figure 4.3.9a and 4.3.9b show the plot of the ion
rejection against solution pH obtained in passing 500 ppm NaCl solution through MPT-34 and
70

TFC-SR, respectively. Figure 4.3.10 shows the plot of the pH difference (pH of permeate - pH of
feed solution) against the pH of the feed solution.
u
Io
1
0.8
0.6 -
0.4 --
0.2 -
0
MPT-34
0 6 8
Bulk Solution pH
10 12 14
-Na+ -Cl-
Figure 4.3.9a Rejection of Na+ and Cl" in MPT-34 at various pH levels. The operating pressurewas 1000 KPa and the feed solution temperature was 30°C.
1
c 0.8oo 0.6 -
'5Ta: 0.4c- 0.2 TFC-SR
6 8
Bulk Solution pH
10 12
E—i
14
•Na+ •Cl-
Figure 4.3.9b Rejection of Na+ and Cl" in TFC-SR at various pH levels. The operating pressurewas 400 KPa and the feed solution temperature was 30°C.
Figure 4.3.9a and 4.3.9b show that at solution pH lower than 5, the rejection of Cl" is much lower
than that of Na+. It is shown in Figure 4.3.10 that in MPT-34, the pH of the permeate solution is
lower than that of the feed solution, except at pH 2 and 7. The lower pH of the permeate solution
implies that there is flow of the hydronium ions (H3O+) through the membrane which
71

compensates the passage of anions through the membrane and the abundance of cations on the
high pressure side of the membrane. Based on the illustration in Figure 4.3.8, the membrane must
have a positive zeta potential because of the excess Na+ ions on the high pressure side of the
membrane.
At pH between 5 and 7 there is a decrease in the ion rejection, both for Na+ and Cl" in MPT-34.
The values of rejection of the two opposite ions start to approach each other indicating lower
separation of ionic charges at solution pH of 7. As shown in Figure 4.3.10, permeate pH
increases until at pH 7 where the pH of permeate equals the pH of feed solution. These results
indicate that the permeate becomes less acidic at feed solution pH approaching 7. Figure 4.3.9a
shows a minimum rejection for both Na+ and Cl" at pH 7. At this pH level, less Cl" ions must have
passed through the membrane resulting to the build-up of Cl" ions on the high pressure side of the
membrane. The membrane must have negative zeta potential, which can be attributed to the
increasing Cl" ions adsorbed on the membrane surface.
At pH higher than 7, both Na+ and Cl" are shown to be more highly rejected compared to the
conditions were feed solution is made acidic. At this pH levels, the rejection values of the two
oppositely charged ions approach each other. At this condition wherein the feed solution is basic,
OH" is abundant in the feed solution. Having very high mobility, OH" can get close to the
membrane surface, which may prevent the passage of the less mobile Cl" through the membrane.
This explanation is suggested by Figure 4.3.10, which means that as the pH of feed solution
increases from 7 to 9, the negative pH difference increases in magnitude, indicating that OH- is
abundant in the low pressure side of the membrane. Considering illustration shown in Figure
4.3.8, the membrane surface is expected to be negative at this pH condition. The high rejection of
Cl", indicates that Cl" is abundant on the high pressure side of the membrane. Being less hydrated,
Cl" has stronger tendency to be adsorbed on membrane surface than Na+. This stronger adsorption
tendency of the anion (Cl") compared to that of the cation (Na+) may cause the membrane to have
increasing negative charge.
The same trend was observed in TFC-SR although the changes in rejection caused by the changes
in the pH of the feed solution are not the same as those in MPT-34 (see Figure 4.3.9b).
The pH range characterized by positive zeta potential in Figure 4.3.8 can be identified in the ion
rejection curve (see Figure 4.3.9a and 4.3.9b) as the pH range characterized by low Cl" rejection
72

THIS PAGE IS MISSINGIN THE
ORIGINAL DOCUMENT

c) Negative zeta potential must be an indication of the abundance of anion on the high pressure
side of the membrane. Being less hydrated, anions have stronger tendency to be adsorbed on
membrane surface than cations. This stronger adsorption tendency of the anion compared to
that of the cation may have cause the membrane to have increasing negative charge.
Similarly, a positive zeta potential is obtained when the cation rejection is high while that of
the anion is low. At this condition the passage of anion through the membrane causes a
depletion of the anion and abundance of the cation on the high-pressure side of the
membrane.
The above findings show that the NF membrane surface has no fixed charge.
74

4.3 J Solutions with Mixture of Different Electrolyte Solutes
Experiments involving solutions containing two and more different electrolyte solutes in 1:1 ratio
by mole were performed. Experimental runs were done at three different concentrations within
the range of 10 to 120 ppm total salts, taking at least three trials for each run. Ion rejections
obtained from different trials for each run were found reproducible with maximum relative
standard deviation of 0.016.
Solutions containing mixture of different chloride salts were used to compare the behavior of
different cations in the same solution. Comparison between mono-valent Cl" and di-valent SO4"
was done by performing experiments involving solution containing mixture of NaCl and Na2SO4.
The results of the experiments show that in a solution containing different ions, the more hydrated
ion are more rejected in nanofiltration operation (see Section 4.3.2).
Rejection patterns obtained in solutions containing mixture of electrolytes are different from
those obtained from experiments involving solutions of single electrolyte solutes because of the
effect of ion-ion interactions which tend to limit the rejection of all ions in solutions to certain
range.
The different combinations of mixtures of electrolyte solutes used in the experiments are as
follows:
A. NaCl-Na2SO4
B. NaCl-CsCl
C. NaCl-CoCl2
D. CsCl-CoCl2
E. NaCl-CsCl-CoCl2
A. NaCl-Na^SO4 Solution
In the solution containing NaCl-Na2SO4, rejection of ions in MPT-34, NF-70, and TFC-SR was
found to decrease in the order:
Na+ > SO4= > Cl"
75

Figures 4.3.11a to 4.3.11c show the ion rejections obtained in MPT-34, NF-70, and TFC-SR,
respectively. The above order is consistent with the order of decrease in hydration number (h) of
the three ions involved, which is:
Na+ (h = 6.5) > SOT (h = 5.3) > Cl" (h = 3.9)
The numbers in parenthesis are the hydration numbers listed in Table 2.4.1. Figures 4.3.1 la to
4.3.11c also show the effect of an increase in concentration, i.e., as the feed concentration is
increased, the distance between ions decreases, i.e., ion-ion interaction dominates. As the feed
concentration increases the values of rejection of the component ions become close to each other.
o
I
1
0.8 -
0.6
0.4
0.2 +
0MPT-34
0 20 40 60 80 100
Feed Concentration, ppm total salts
120
-Na+ - - • • - -CI A- - -SO4= |
Figure 4.3.1 la Ion rejection vs. feed concentration obtained in passing NaCl-Na2SO4 (in 1:1
mole ratio) solution through MPT-34 at operating pressure of 1000 KPa and solution temperature
of30°C.
76

1
0.8
0.6 +
0.4
0.2
0
0
NF-70
20 40 60 80
Solute Concentration, ppm total salts
-Na+ - - * - - -CI- - - «• - SO4=
100 120
Figure 4.3.1 lb Ion rejection vs. feed concentration obtained in passing NaCl-Na2SO4 (in 1:1
mole ratio) solution through NF-70 at operating pressure of 400 KPa and solution temperature of
30°C.
1
0.8ot> 0.6 +.2.a o.4o~ 0.2 + TFC-SR
20 40 60 80 100
Feed Concentration, ppm total salts
-Na+ - - A- - CI- - - » - SO4=
120
Figure 4.3.1 lc Ion rejection vs. feed concentration obtained in passing NaCl-Na2SO4 (in 1:1
mole ratio) solution through TFC-SR at operating pressure of 400 KPa and solution temperature
of30°C.
77

B. NaCl-CsCl Solution
Different trends in the plots of ion rejection vs. feed concentration were obtained in passing
solution containing mixture of NaCl and CsCl through MPT-34, NF-70, and TFC-SR. The
different membranes, however, showed the same order of decrease in ion rejection values, which
is consistent with the order of decrease in hydration number (h). Figures 4.3.12a to 4.3.12c show
ion rejection vs. feed concentration for MPT-34, NF-70 and TFC-SR, respectively. The rejection
of the component ions decreases in the following order for the three different membranes:
Na+ > Cs+ > OT
Based on hydration number the sequence of ions is:
Na+ (h=6.5) > Cs+ (h=4.3) > Cl" (h=3.9)
o
8.o
1
0.8
0.6 +
0.4
0.2 -I
0
0
MPT-34
-A
20 40 60 80 100
Solute Concentration, ppm total salts
120
-Na+ -CS+ - - * - Cl-
Figure 4.3.12a Ion rejection vs. feed concentration obtained in passing NaCl-CsCl (in 1:1
mole ratio) solution through MPT-34 at operating pressure of 1000 KPa and solution temperature
of30°C.
78

is
o
1 -p
0.6 -
0 . 4 -
0.2
0 —
^tassae===========ss-'~\ - - -"""-
NF-70
I • • I : I I -
•i ' >
- - - -A
• • • 1 I
20 40 60 80 100
Solute Concentration, ppm total salts
120
-Na+ -Cs+ - - * - -Cl-
Figure 4.3.12b Ion rejection vs. feed concentration obtained in passing NaCl-CsCl (in 1:1
mole ratio) solution through NF-70 at operating pressure of 400 KPa and solution temperature of
30°C.
c 0.8 -
1a o.4 +
•2 0.2 +
0
TFC-SR
•+•
0 20 40 60 80
Feed Concentration, ppm total salts
100 120
-Na+ -Cs+ - - * - Cl-
Figure 4.3.12c Ion rejection vs. feed concentration obtained in passing NaCl-CsCl (in 1:1
mole ratio) solution through TFC-SR at operating pressure of 400 KPa and solution temperature
of30°C.
79

C. NaCl-CoCl2
In solution containing NaCl-CoCl2 mixture, rejection decreases in the same trend as the hydration
number of the component ions as follows:
Co++ > Na+ > Cl"
Based on hydration number (h), the ions are of the order:
Co++(h=11.5) > Na+(h=6.5) > Cl"(3.9)
Figures 4.3.13a to 4.3.13c show the ion rejection vs. feed concentration obtained in passing
solution of NaCl-CoCl2 through MPT-34, NF-70, and TFC-SR, respectively. The rejection of Cl"
decreases at feed concentration above 60 ppm which could be due to the high concentration of Cl"
ions produced from the dissociation of C0CI2. CT, which are mostly adsorbed on the membrane
surface repel each other pushing some of them through the membrane resulting to permeate
which is rich in Of ions.
o
1
0.8 -
0.6
c 0.4o
0.2 -
0
MPT-34
20 40 60 80
Feed Concentration, ppm total salts
100 120
-Sodium -Cobalt - - * - Chloride
Figure 4.3.13a Ion rejection vs. feed concentration obtained in passing solution of NaCl-
CoCl2 (in 1:1 mole ratio) through MPT-34 membrane. The operating pressure was 1000 KPa and
the solution temperature was 30°C.
80

Solute Concentration, ppm total salts
Figure 4.3.13b Ion rejection vs. feed concentration obtained in passing solution of NaCl-
C0CI2 (in 1:1 mole ratio) through NF-70 membrane. The operating pressure was 400 KPa and the
solution temperature was 30°C.
om
Ion
Rej
i -
0.8 -
0.4 -
0.2 -
0 -
• .
1 ——
, •
A . . .
t
" - -ATFC-SR
1 1 h———
20 40 60 80 100
Feed Concentration, ppm total salts
120
•Na+ -Co++ - - * • - Cl-
Figure4.3.13c Ion rejection vs. feed concentration obtained in passing solution of NaCl-
CoCl2 (in 1:1 mole ratio) through TFC-SR membrane. The operating pressure was 400 KPa and
the solution temperature was 30°C.
81

D. CsCl and CoCl2
In the solution containing CsCl and C0CI2 , the rejection of ions decreases in the same order as
the hydration numbers (h) of the ions. The sequence based on rejection is:
Co++ > Cs+ > Cl"
Based on hydration number the order of ions is:
Co++(h=11.5) > Cs+(h=4.3) > Cl"(h=3.9)
Figures 4.3.14a to 4.3.14c show the ion rejection vs. feed concentration obtained in passing
solution containing CsCl-CoCl2 (in 1:1 mole ratio) through MPT-34, NF-70, and TFC-SR,
respectively. Similar to what is shown for NaCl-CoC^, the rejection of Cl" decreases as the feed
concentration increases from 60 ppm which could also be explained by high concentration of Cl"
resulting from the dissociation of C0CI2. The repulsion between Cl" ions, which are mostly
adsorbed on the membrane surface, pushes some of them through the membrane resulting to
permeate which is rich in Cl" ions.
MPT-34
20 40 60 80 100
Feed Concentration, ppm total salts
120
-Cesium -Cobalt - - * • - Chloride
Figure 4.3.14a Ion rejection vs. feed concentration obtained in passing solution of CsCl-
CoCl2 (in 1:1 mole ratio) through MPT-34 membrane. The operating pressure was 1000 KPa and
the solution temperature was 30°C.
82
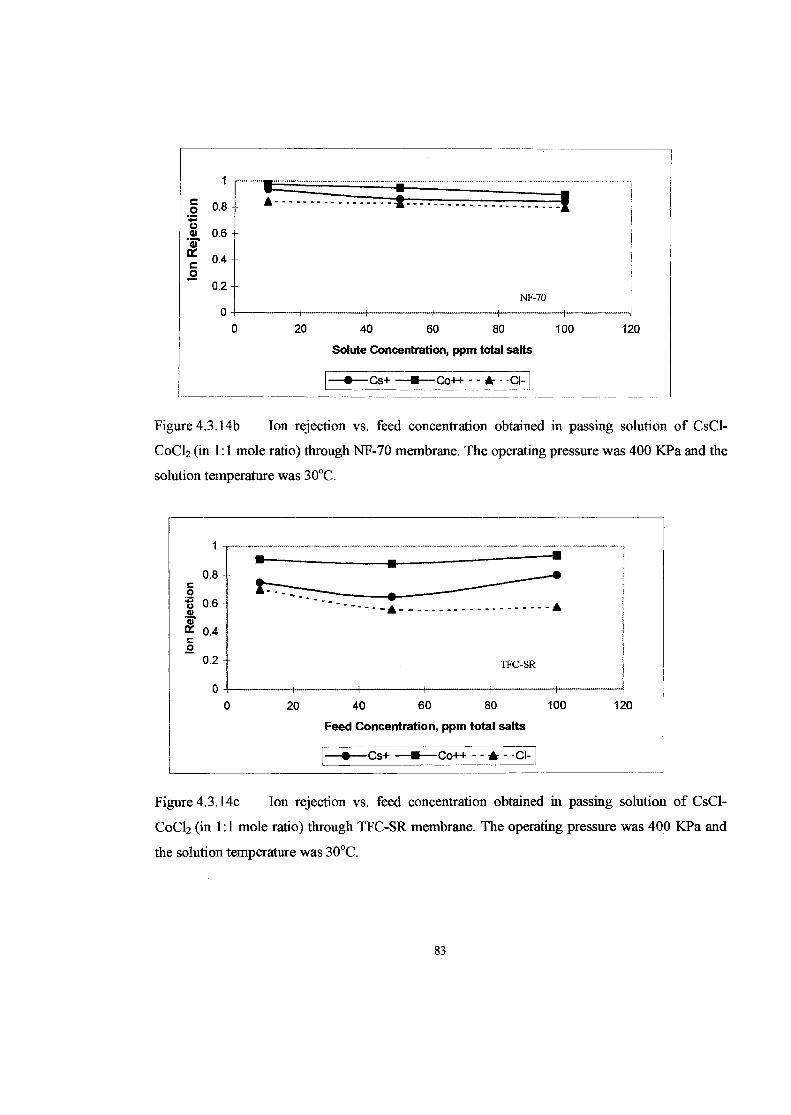
Solute Concentration, ppm total salts
Figure 4.3.14b Ion rejection vs. feed concentration obtained in passing solution of CsCl-
C0CI2 (in 1:1 mole ratio) through NF-70 membrane. The operating pressure was 400 KPa and the
solution temperature was 30°C.
1
0.8otj 0.6.2.* 0.4c_o
0.2
0
TFC-SR
0 20I I I
40 60 80
Feed Concentration, ppm total salts
100 120
-Cs+ -Co++ - - * - -Cl-
Figure 4.3.14c Ion rejection vs. feed concentration obtained in passing solution of CsCl-
CoCl2 (in 1:1 mole ratio) through TFC-SR membrane. The operating pressure was 400 KPa and
the solution temperature was 30°C.
83

E. NaCl-CsCl-CoCh
Using solutions of three different chloride salts at mole ratio 1:1:1, the rejection of ions in MPT-
34, NF-70, and TFC-SR were determined to have an insight on the involved mechanism of charge
separation. Figure 4.3.15a to 4.3.15c show the plots of ion rejection vs. feed concentration
obtained in passing solution containing NaCl-CsCl-CoCl2 through MPT-34, NF-70 and TFC-SR
membranes, respectively.
The decreasing order of rejection of the four ions involved is in agreement with the decreasing
order of hydration number (h) of the ions. The sequence in rejection is as follows:
Co++ > Na+ > Cs+ > Cl"
Based on hydration numbers, the order of ions is:
Co++(h=11.5) > Na+(h=6.5) > Cs+(h=4.3) > Cl~(b=3.9)
1
0.8 +oB 0.6<D'«"
* 0.4o
0.2
00
MPT-34
20 40 60
Feed Concentration, ppm total salts
—i—
80 100
-Na+ -Cs+ -Co++ - - A- - Cl-
Figure 4.3.15a Ion rejection vs. feed concentration obtained in passing solution of NaCl-
CSCI-C0CI2 (in 1:1:1 mole ratio) through MPT-34 membrane. The operating pressure was 1000
KPa and the solution temperature was 30°C.
84

1
c 0.8 -fo"5 0.6 +•2,$ 0.4o~ 0.2 -
0
t—A
4
•- - A
•
A
NF-70
— I —
20
I I I
40 60 80
Feed Concentration, ppm total salts
100
-Na+ -Cs+ -Co+2 -- A--CI-
Figure 4.3.15b Ion rejection vs. feed concentration obtained in passing solution of NaCl-CsCl-CoCl2 (in 1:1:1 mole ratio) through NF-70 membrane. The operating pressure was 400 KPaand the solution temperature was 30°C.
1 j
= 0.8 -oIS 0.6*a: o.4o~ 0.2 TFC-SR
—f-
20
i i I - •
40 60 80
Feed Concentration, ppm total salts
100
-Na+ -Cs+ -Co++ - - A- - Cl-
Figure 4.3.15c Ion rejection vs. feed concentration obtained in passing solution of NaCl-CsCl-CoCk (in 1:1:1 mole ratio) through TFC-SR membrane. The operating pressure was 400KPa and the solution temperature was 30°C.
85

For the three membranes used namely, MPT-34, NF-70, and TFC-SR, the rejection of ions in
solutions containing more than one electrolyte solute depends on the hydration number (h) of
each of the ion specie in the solution. Ions with higher hydration number (h) showed higher ion
rejection than those with lower hydration number.
Different membranes showed different levels of rejection of each specific ion from feed solutions
having the same solute combination. Figures 4.3.11a,4.3.11b, and 4.3.1 lc show these differences
obtained by passing feed solution having NaCl-Na2SC>4 solute combination through MPT-34, NF-
70, and TFC-SR, respectively. Figures 4.3.12a, 4.3.12b, and 4.3.12c show these differences
obtained by passing feed solution having NaCl-CsCl solute combination through MPT-34, NF-
70, and TFC-SR, respectively. Figures 4.3.13a, 4.3.13b, and 4.3.13c show these differences
obtained by passing feed solution having NaCl-CoCl2 solute combination through MPT-34, NF-
70, and TFC-SR, respectively.
In experiments involving feed solutions having combination of three different chloride salts,
Figures 4.3.15a, 4.3.15b, and 4.3.15c show the differences in the levels and trends of ion
rejections obtained from MPT-34, NF-70, and TFC-SR, respectively.
The effect of inter-ionic forces of attraction between component ions in a feed solution increases
as a result of increase in concentration. The distances between ions decrease as the feed
concentration increases. The attraction between ions serves as hindrance to some individual ions
in passing through the membrane. From the experiments involving feed solutions having three
component solutes, ion rejections remain almost the same at feed concentrations above 30 ppm.
Figures 4.3.13a to 4.3.13c show these results for MPT-34, NF-70, and TFC-SR membranes,
respectively.
86

4.4 Microscopic Investigation of Nanofiltration Membranes
Samples of unused and used NF membranes (MPT-34, NF-70, and TFC-SR) were investigated
using electron microscope system JXA-840 Scanning Microanalyzer. Observations were made by
magnifying 100 jam region 250 times and ljim region 5000 times (see Figures 4.4.1.to 4.4.3). At
this magnification, pores could not be seen in both used and unused membranes. The pores may
be several magnitudes smaller than the size of the observed region. Another explanation is that
the pores are rather slit-type than round. There were no indications of damages on the membrane
that have been used for the entire study, indicating that these membranes remained stable at the
operating conditions in the experiments.
Electron Microscopic Analysis of MPT-34 Membrane
(1) (2)
Figure 4.4.1a Photograph of the observed regions of unused MPT-34 membrane sample. (1) 100
|im region magnified 250 times (2) lnm region magnified 5,000 times.
'' ' ' (
(1) (2)
Figure 4.4.1b Photograph of the observed regions of used MPT-34 membrane sample. (1) 100
jam region magnified 250 times (2) Inm region magnified 5,000 times.
87

Electron Microscopic Analysis of NF-70 Membrane
(1) (2)
Figure 4.4.2a Photograph of the observed regions of unused NF-70 membrane sample. (1) 100
jim region magnified 250 times (2) Inm region magnified 5,000 times.
l l,•;;••• ' ,•• . ••.%";.:! i : , - - . i -
:! * . i
r:
!J
> j- / 6 s - . ••\-
:"\. .'
(1)
* * * *i * . . 4
(2)
Figure 4.4.2b Photograph of the observed regions of used NF-70 membrane sample. (1) 100 jam
region magnified 250 times (2) lnm region magnified 5,000 times.
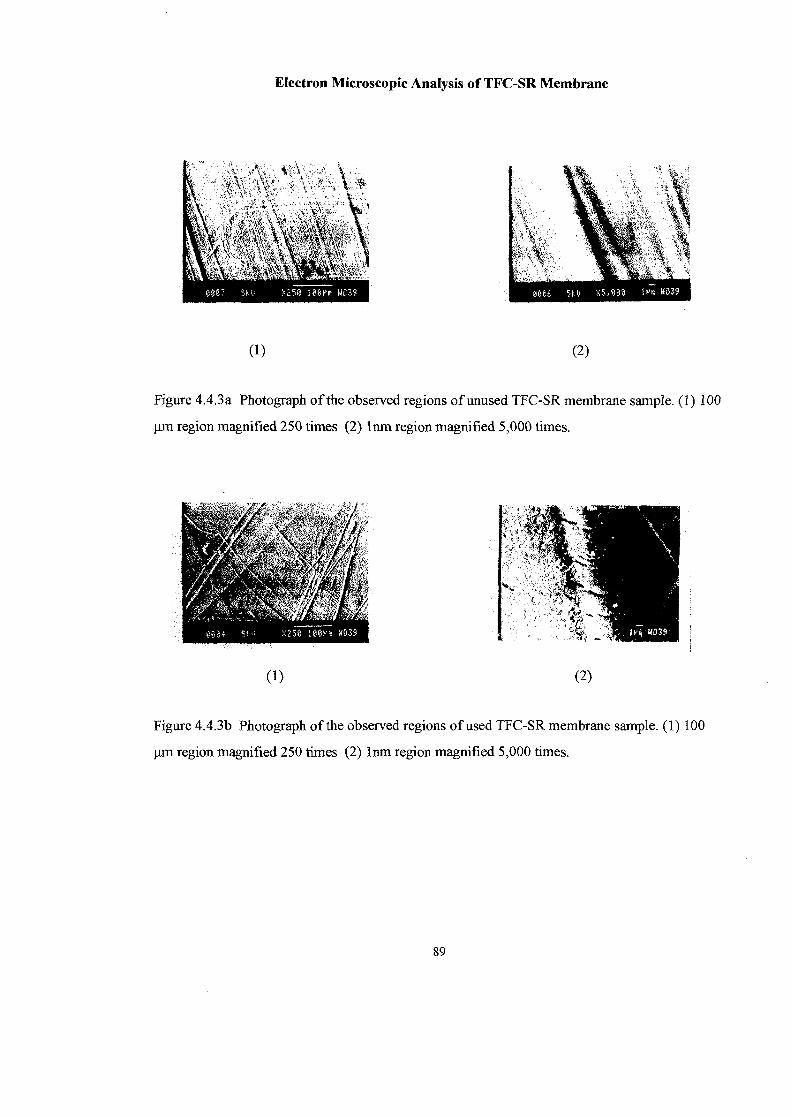
Electron Microscopic Analysis of TFC-SR Membrane
(2)
Figure 4.4.3a Photograph of the observed regions of unused TFC-SR membrane sample. (1) 100
jam region magnified 250 times (2) lnm region magnified 5,000 times.
•'/#
(1) (2)
Figure 4.4.3b Photograph of the observed regions of used TFC-SR membrane sample. (1) 100
|jm region magnified 250 times (2) lnm region magnified 5,000 times.
89

4.5 Characterization of NF Membrane from Flux and Rejection Data
4.5.1 Introduction
A wider range of application of nanofiltration (NF) can be achieved if quantitative methods for
predicting membrane performance will be available. Inasmuch as NF is thought to have pores in
nanometer range, measurement of length scales relevant to separation is not possible with the
present technology since this is only an order of magnitude greater than atomic dimension.
This study is intended to use and evaluate methods that would use experimentally measurable
physical data in conjunction with mathematical models to predict separation and membrane
characteristics. Since the results of the experiments performed in this study did not show
indications of the presence of fixed surface charge of the nanofiltration membranes used, the
hydrodynamic model [20,48] which is based on transport in neutral porous membrane was used.
4.5.2 Transport in Neutral Porous Membrane
To develope theoretical approaches that would describe transport through porous membranes,
other authors used two principles: the principles of irreversible thermodynamics and the
hydrodynamic model. The first principle involves phenomenological equations relating the solute
and solvent fluxes to gradients in the pressure and concentration driving forces. In hydrodynamic
model, the solute flux is evaluated directly from the governing equations of motion for single
solute in a well-defined pore, resulting to transport parameters expressed in terms of the solute
and pore characteristics. Both approaches consider the solute flux through the membrane, Ns as
the sum of the convective and diffusive contributions defined by equation 4.5.1.
dz
where cs is the solute concentration in the pore, Fis the average solution velocity, and Dx is the
free solution Brownian motion diffusivity, Kc and Kj are the hindrance factors for convective and
diffusive transport, respectively. The axis perpendicular to the membrane surface is identified as
90

z. Both factors reflect the additional drag on the solute molecule due to the presence of the pore
walls.
The convective contribution is given by the 1st term:
dcand the difrussive contribution is given by the 2nd term: KjD^ — -
dz
In transport in liquid-filled pores, the rates of convective transport of solute are generally lower
than the product of the bulk concentration and volume flow rate. This indicates that solute
transport is typically hindered or restricted.
In a review made by Deen (1987) [48], general approaches for the analysis of hindered transport
of rigid solutes in pores of arbitrary shapes have been discussed. Analytical expressions for
spherical solutes in cylindrical pores have been developed by Andersen and Quinn (1974) and
Bungay and Brenner (1973) using the centerline approximation (axisymetric case wherein the
sphere is on the centerline so that the radial position, r/ro is zero, i.e. r is the radial distance of
molecule in pore and r0 is the radius of cylindrical pore). Bungay and Brenner (1973) developed
expressions for the hindrance factors Kc and Kd, that are valid for all X, which represents the ratio
of solute radius (rs) to pore radius (rp) using the asymptotic expansions for both small and close
fitting spheres. The expressions for the hydrodynamic functions in Bungay and Brenner's analysis
(Kt and Ks) are given by Equations 4.5.2 and 4.5.3, respectively.
(4.5.2)
( }
Where ^ is the equilibrium partition coefficient, which for spherical solute in cylindrical pore isdefined in terms of A. The expression is given by Equation 4.5.4.
91

(4.5.4)
The equilibrium partition coefficient (^ ) is defined in terms of the boundary concentration ratio
by Equation 4.5.5.
cs(z =(4.5.5)
where cs is the solute concentration in the pore, cw is the pore wall concentration, cp is the
permeate concentration, and Ax is the membrane thickness, and z is the axis perpendicular to the
membrane surface.
Bungay and Brenner defined both K, and Ks in terms of A. The expressions are shown in
Equations 4.5.6 and 4.5.7 for K, and Ks, respectively.
s=- (4.5.6)n=0
Ks =4
"In=0
(4.5.7)
The values of the expansion coefficients in hydrodynamic model an and bn based on the
approximations made by Bungay and Brenner are listed in Table 4.5.1.
92

Table 4.5.1 Expansion Coefficients for Hydrodynamic Functions K, and Kt
n
1
2
3
4
5
6
7
-73/60
77,293/50,400
-22.5083
-5.6117
-0.3363
-1.216
1.647
bn
7/60
-2,227/50,400
4.0180
-3.9788
-1.9215
4.392
5.006
According to the hydrodynamic theory, the hindered diffusion coefficient (tfKJ) and the
asymptotic sieving coefficient (,!?«,) are unique functions of X [48]. The detailed pore geometry
and the magnitude of any long-range interactions determine the specific functionality.
The asymptotic sieving coefficient (S^) can be conveniently expressed in terms of the actual
sieving coefficient (Sa), which is defined as the ratio of the solute concentration in the permeate
(cp) to that of the upper surface of the membrane (cm) (See Equation 4.5.8).
a cm Sx+exp(Pe)-\(4.5.8)
where:
(4.5.9)
and Pe = PecletNo. = (4.5.10)

The partition coefficient (0 ) which has been previously defined by Equations 4.5.4 is given
below.
(4.5.11)
The quantity <j>Kd is called the hindered diffusivity and is defined by Equation 4.5.12.
(4.5.12)
Where A#is the effective diffiision coefficient and A*, is the bulk solution diffusion coefficient.
Spiegler and Kedem (1966) defined the actual sieving coefficient (Sa) in terms of the membrane
rejection (R). The expression is shown by Equation 4.5.13.
R = l-Sa (4.5.13)
The asymptotic sieving coefficient (SJ) is attained at infinite Peclet number (Pe) and can be
defined in terms of Pe by Equation 4.5.14.
in which case, the membrane thickness is Ax. At small Peclet number, solute transport is
governed primarily by diffusion resulting to almost equal concentrations on both sides of the
membrane. At this condition, the sieving coefficient (&„) approaches unity or rejection ( R )
approaches zero.
94

An expression directly relating the hindered diffussivity {$Kd ) to the asymptotic sieving
coefficient is obtained by combining Equations 4.5.10 and 4.5.13. Equation 4.5.15 gives the
resulting expression.
' ^ - 1 («-15)
Opong, et al. (1991) used the stagnant film model to relate the actual sieving coefficient,
(Sa = c/cm), observed sieving coefficient (So = cp /cb) and the mass transfer coefficient (k) where
the concentrations cp, cm and cb correspond to that in the permeate, on the membrane surface, and
in the bulk solution, respectively. Equation 4.5.16 defines Sabased on the model.
S » = h-7; (t-5-16)
They developed an expression to calculate flux, Jv corresponding to the minimum observed
sieving coefficient (or maximum observed rejection) by combining Equations 3.4.8, 3.4.11 and
3.4.14 . Equation 4.5.17 gives the resulting expression.
(4.5.17)Pe
Peclet number Pe* based on the bulk mass transfer coefficient (k) and the membrane skinporosity (Ak) is given by Equation 4.5 18.
(4.5.18)
95

The actual sieving coefficient is defined in terms of Pe* by Equation 4.5.19.
_ S^jl + Pe*)a~ S * ~ (4-5-19)
When the Peclet number, Pe*, is small, equation 4.4.16 becomes Jv = k, i.e. Jv becomes
independent of the membrane properties. At large Pe*, Jv<k and the actual sieving coefficient is
equal to Sao.-
4.5.3 Calculation of Membrane Effective Pore Size
The hydrodynamic model was used to determine X, the ratio of solute to pore radius xjrp. The
sieving coefficient (S) corresponding to each permeate flux value (</v) were calculated from
results obtained from the experiments using feed solution of single electrolyte solute done at
constant temperature and feed concentration but variable operating pressure. The calculations
were done from assumed values of thickness/porosity {AxlAk ), solute radius/pore radius (X), and
mass transfer coefficient (A) using the equations proposed in the model. To facilitate the
calculations, computer program HYDROMOD.BAS in the BASIC language was developed in
this study. This program can be found in Section B2 of Appendix B. Table 4.5.2 provides the list
of the input and output parameters in the program and the variables representing each.
Figure 4.5.1 and 4.5.2 show the plot of values obtained from the theoretical calculations using the
model. Figure 4.5.1 shows the effect of varying permeate flux (Jv) on ion rejection ( R ) at
different values of X with thickness/porosity {AxlAk ) set at lxlO"4 m and mass transfer (k)
coefficient assumed to be greater than 1 x 10"5 m/sec.
Figure 4.5.2 shows the effect of changing permeate flux («/v) on sieving coefficient (S) at different
assumed values of AxlAk while X was set at 0.6 and mass transfer coefficient (A;) was assumed to
be greater than 1 x 10"5 m/sec.
96

10 20 30 40
Jv x 1E+6 cu.m./sq.m.sec.
50 60 70
Figure 4.5.1. Ion rejection vs. permeates flux (Jv) at different X calculated from assumed input
data using the hydrodynamic model. Ax/At was set at lxlO"4 m and mass transfer coefficient (k)
was assumed greater than 1 x 10"5 m/sec
31 = 0.6
250 500
Jv x1E6 cu.m./sq.m.sec
750 1000
Figure 4.5.2. Sieving coefficient (S) vs. permeates flux (Jv) at different Ax/Ak calculated from
assumed input data using the hydrodynamic model. The value of X was set at 0.6 and mass
transfer coefficient (k) was assumed greater than 1 x 10"5 m/sec.
97

4.5.4 Fitting Experimental Data Into The Model
A. Using Data from Experiments Involving Chloride Salts
The best fit curve resulting from the theoretical calculations using the model was determined for
each set of flux and Cl" rejection data obtained from experiments done using 8.56 xlO'3 moIs/L
solutions of single solute containing NaCl and CsCl at constant feed solution temperature and
variable operating pressures (see item F of subsection 4.3.2). Theoretical values obtained at
constant X were first used to determine the best fit line that would match the predicted asymptotic
rejection for each membrane. After this, Ax/Au was adjusted until the series of points representing
the experimental data approximately match the line predicted by the model calculations.
The results obtained by using NaCl experimental data was compared from the results obtained by
using CsCl experimental data. Both chloride salts involve mono-valent cations. Points
representing Cl" rejection data were used in fitting experimental data into the model because Cl"
ion was common in NaCl and CsCl. From Section 4.3, it has been shown that in solutions of
single electrolyte solute, the rejection of Cl"ion was lower than that of its counterpart cation. This
means that the forces that act as barriers in the separation of ions has less effect on Cl" ion than on
its counterpart cation, i.e. it is reasonable to assume that the passage of Cl" through membrane
pore is governed primarily by the size of its hydrated ion and the membrane pore size. In a
membrane separation which works by sieving mechanism, a particle will pass through a given
pore if its particle size is smaller than the membrane pore size.
Figures 4.5.3 to Figures 4.5.5 show the results of curve-fitting for MPT-34, NF-70, and TFC-SR,
respectively.
98

c0
13Toco
1 1
0.8 -
0.6
0.4
0.2
0 <
C
MPT-34
^ ^ • ' ' ^ ~ - - ' ~ ~ ~"~~~ X. = 0.63, AX/AK =1E-4m
^^<<^V - " " X = 0.63, AX/AK = 2E-4 m
_ J - ^ f > - ' ""• ~* X = 0.63. Ax/A, = 3E-4 m
) 2 4 6 8
Jv x 1E+6 cu.mJsq.m.sec
* Experimental Data for NaCl Sol'n. • Experimental Data for CsCI Sol'n.
I
i
i
10
Figure 4.5.3. Curve fitting by model calculations for MPT-34. Lines represent values obtained
from theoretical calculations while points represent experimental data. The line that best fits the
experimental data for NaCl corresponds approximately to A = 0.63 and Ax/Ak = 3 x 10 m. The
best fit line for CsCI data corresponds approximately to A - 0.63 and Ax/Ak = ^
tio
nR
ejec
0.8 -
0.6
0.4 -
0.2 -
r.rT~A
/ /
/ /
0 2.5
* Experimental
+ f.—» • * • •
X = 0.73, Ax/
X = 0.73, Ax/A
NF-70
5 7.5 10 12.5
Jv x 1E+6 cu.m./sq.m.sec.
Data for NaCl Sol'n. • Experimental
AK=1E-4mK = 2E-4 m
15 17
Data for CsCI
..... . . _ _ _ , . ™ . . t
.5 20
Sol'n.
Figure 4.5.4. Curve fitting by model calculations for NF-70. Lines represent values obtained
from theoretical calculations while points represent experimental data The line that best fits the
experimental data for NaCl corresponds approximately to A = 0.73 and Ax/Ak = 1 x 10 m. The
best fit line for CsCI data corresponds approximately to A - 0.73 and AxlAu = 7.5xlO"5 m.

2.5 7.5 10 12.5
Jv x 1E+6 cu.m./sq.m.sec.
15 17.5 20
O Experimental Data for NaCI Sol'n. • Experimental Data for CsCI Sol'nT|
Figure 4.5.5. Curve fitting by model calculations for TFC-SR. Lines represent values obtained
from theoretical calculations while points represent experimental data. The line that best fits the
experimental data for NaCI corresponds approximately to X = 0.6 and Ax/Ak = 7 x 10"5 m.The
best fit line for CsCI data corresponds approximately to X = 0.6 and Ax/At = 5 x 10'5m.
Table 4.5.2 Summary of Results Obtained from Fitting Chloride Salts ExperimentalRejection Data into the Hydrodynamic Model
MembraneType
MPT-34
NF-70
TFC-SR
Results of Curve-Fitting
X = rjrp
NaCI
0.63
0.73
0.6
CsCI
0.63
0.73
0.6
AxlAk
NaCI
3x10^
lxlO"4
7xlQ-5
CsCI
2.8X10"1
7.5xlO"5
5xlO"5
Hydrated radii(rs x 1E+9, m)
Na+
0.358
Cs+
0.329
Cl
0.332
PoreRadius
(r p ,m)#
5.26xlO"10
4.54 xlO"10
5.53 xlO4 0
* Source: Horvath, A., Handbook of aqueous electrolyte solutions, 1985, England. [44]# Calculated based on C7~ experimental rejection data
100

It is shown in Table 4.5.2 that for the different membranes (MPT-34, NF-70, and TFC-SR) the
lines that best fit the experimental data for NaCl solution correspond to the same value of X as
those which best fit the experimental data for CsCl solution. The approximated values of effective
pore size obtained by using NaCl data is the same as those obtained from CsCl data for the
different membranes. Different values of X were obtained for different membrane. NF-70 was
found to have the smallest value of effective pore size while TFC-SR has the largest value.
The values obtained by using NaCl experimental data are different from those obtained using
CsCl experimental data. The values of Ax/At obtained in using CsCl data for curve-fitting are
slightly lower than those obtained in using NaCl.
B. Using Data from Experiments Involving Sodium Sulfate
Approximation of effective membrane pore size by hydrodynamic model was also used for data
obtained by passing Na2SO4 feed solution through TFC-SR membrane. This procedure was done
to determine the applicability of the method on salt of divalent anion, i.e. SO4~. The salt Na2SO4
involves two Na+ ions and one SO4~ ion in its dissociation, unlike NaCl and CsCl salts which
produce only one Na+ and one Cl" ion. The size of hydrated SO4~ ion is bigger than a hydrated Cl"
ion, i.e. the hydrated radii are 0.379 nm and 0.332 nm for SO4= and Cl", respectively. Figure 4.5.6
shows the results of fitting SO4= rejection data into the best fit line representing values calculated
using the hydrodynamic model. Table 4.5.3 summarizes the results obtained from NaCl and
experimental data for TFC-SR membrane.
101

X = 0.65 , Ax/Ak = 7E-5 mX = 0.67, Ax/Ak = 7E-5 m
X = 0.68 , Ax/Ak = 7E-5 m
2.5 5 7.5 10 12.5 15
Jv x 1E+6 cu.m./sq.m.sec.
17.5 20
[•Experimental Data for Na2SO4
Figure 4.5.6. Curve fitting by model calculations for TFC-SR using Na2SO4 feed solution. Lines
represent values obtained from theoretical calculations while points represent experimental data.
The line that best fits the experimental data for NaaSCXi corresponds approximately to X = 0.67
and Ax/At = 7xlO~5m.
Table 4.53 Comparison of the Results of Hydrodynamic Model Curve-fitting Obtained
from NaCl rejection data with that obtained from Na2SO4 rejection data.
ExperimentalData Source
Na2SO4
NaCl
Results of
Curve-fitting
^ = rs/rD
0.67
0.6
Ax/Ak
7xl(T5
7xl<T5
Hydrated radii(rs x 1JE+9, m)*
Na+
0.358
Cl
0.332
so4=
0.379
Pore Radius(rp, m) #
5.66 x 10"10
5.53 xlO"10
* Source: Horvath, A., Handbook of aqueous electrolyte solutions, 1985, England. [44]
# Calculated based on Cl andSO4= experimental rejection datain TFC-SR membrane
102

It is shown in Table 4.5.3 that X obtained from fitting SO4 experimental data into the
hydrodynamic model is the slightly larger than the value obtained from CT experimental data.
The approximated value for effective pore size was slightly affected by their difference in the
value of X. The effective pore size calculated using SCV data is slightly larger than the value
calculated using Cl" data. The same values of Ax/Ak were obtained from SQf and Cl"
experimental data.
103

4.6 UF,RO,andNF
4.6.1 Introduction
UF and RO membranes, which are thought to have a net positive or negative charge were
believed to have a separation ability which is based on both sieve and charge effect. Charge
membranes reject solute particles having the same charge as that of the membrane. In this way
they reject charged solutes with dimension much smaller than the membrane pore size. Dresner
(1972) [29] proposed the co-ion rejection model, which describes electrolyte separation in an ion-
exchange membrane as a result of interaction between a charged membrane and the counter-ions
in the solution.
4.6.2 Comparison Between NF and UF
Bhattacharyya et al. (1982) [16], performed experiments on the rejection of some di-valent metal
ions from 3 mM feed concentration by ultrafiltration (UF) membrane believed to be negatively
charged. The study was based on the knowledge that charged membranes reject ionic solutes via
repulsion of co-ions by the fixed charged groups on the membrane skin. Since the UF membrane
used was negative, cation rejection was expected to be low. Mono-valent cations should be more
rejected man di-valent cations.
Bhattacharyya et al. (1982) showed a list of cations and their corresponding rejection from a feed
containing mixture of ions. In this present study, the rejections of ions obtained by Bhattacharyya
et al. (1982) were used to assess rejection of di-valent cations based on their hydration numbers.
Table 4.6.1 below shows the tabulated values of the rejection and hydration numbers of the ions
considered in their study. Except for Cd++ and Zn++, the table shows that ion rejection increases as
hydration number increases. Cd++ and Zn++ have similar values of hydration numbers. The
rejections of the two cations are similarly close to each other. The results of Bhattacharyya et al.
(1982) show that in ultrafiltration, ions with higher hydration numbers are more rejected than
those having lower hydration number. This trend is similarly found in nanofiltration.
104

Table 4.6.1 Hydration Numbers and Rejection of Di-valent Cations
IonBe + +
Mn+ +
Zn+ +
Cd+ +
Pb + +
% Rejection #9085828173
Hydration No. M13.512.211.311.49.5
# Battacharyya et al. (1982) [16]
M Marcus (1985) [45]
4.63 Comparison with RO
In the experiments performed by Tsuru et al. (1991) [33] using single electrolytes on loose low-
pressure-type RO membranes which were believed to be negatively charged, it was concluded
that rejection of di-valent coions (SO4=) is higher than those with monovalent co-ion as a result
of co-ion repulsion by the membrane surface, i.e. their work was based on co-ion rejection model.
They showed that electrolytes having monovalent counterions (Na+, K+) have higher rejections
than di-valent counterions (Mg++, Ca++). These results were consistent with the co-ion rejection
model. However, in their discussion on the separation of artificial seawater, divalent cation, Mg++
is shown to be more rejected than Na+ from two RO membranes, which were believed to be
negative. In the work of Tsuru et al. (1991) the later discussions, which are about separation of
artificial seawater, are contrary to the earlier discussions about the results of their experiments
and are not consistent with the co-ion rejection model.
In this present study, results of experiments performed showed that ions having higher hydration
numbers were more rejected in nanofiltration operation. Mg++ has a hydration number of 11.7
while Na+ has only 6.5 [45], i.e., it can be predicted that Mg++ would show higher rejection than
Na+. Similarly, in the discussion of Tsuru et al. (1991) on the separation of artificial seawater,
Mg++ is shown to have higher level of rejection than Na+. It shows, therefore, that the differences
in the rejection of those cations are governed by the hydration numbers.
105

Urairi et al. (1992) [49] performed experiments by passing salts through negatively charged RO
wherein positively charged layers were provided on the low pressure side of the membrane to
enhance selectivity in rejection. They defined rejection in terms of salt concentration rather than
ion concentration, i.e., R = 1 - Cp/Cf, where Cp and Q-are salt concentrations in permeate and in
feed, respectively. The level of rejection for the salts tested decrease in the order: MgCl2 >
Na2SC>4 > NaCl. In their discussion concerning an experiment using artificial seawater as feed
solution to NTR-7450 membrane, ion rejection level were shown to decrease in the following
order.
SO4= > Mg++ > Na+ > Cl'
The co-ion rejection model cannot explain the low rejection of Cl- ion despite of its having the
same charge as the membrane. In this present study, the lower rejection of Cl" than cations, is
explained by the low hydration of Cl".
Hall et al. (1997) [35, 36] found that ion concentration in the membrane decrease as feed
concentration is decreased. They also explained that in a negative membrane, the permeate should
be richer in Na+ ions than in Cl" ions. In the separation of ions, water splitting maintains the
electroneutrality, i.e. water provides H* and OH" ions. Hall et al. (1997) also predicted based on
the results of the simulations they made that the rejections of Na+ and Cl" ions would not be equal
at low feed concentration (below 10"2 mols/L). They attributed this to the membrane charge,
which becomes more significant at these low concentrations. In this present study, experiments
performed using NaCl at feed concentration below 10"2 mols/L also showed unequal rejections of
Na+ and Cl", however, Na+ rejection was found to be higher than Cl" rejection.
Based on the above evaluations of results, it can therefore, be established that the mechanisms of
separation of ions in NF, UF, and RO membranes are the same, i.e. a combination of sieve effect
and ion hydration effect. Since all single atomic ions, as well as some simple poly-atomic ions
have hydrated radii in the order of 10"10 of a meter (less than one nanometer) f45], it is possible
for each of these ions to pass through a RO or NF membrane pore. It was found from the
experimental results in this study, as well as from evaluation of some authors' work that different
levels of rejection will be obtained for the different ions present in a feed solution containing
mixture of electrolytes. The hydration numbers of the ions significantly affects the level of
106

rejection of the different ionSs i.e., higher ion rejection is obtained for ions with higher the
hydration number.
107

Chapter 5CONCLUSIONS
The results of the experiments in this research has established the following:
1. There was no evidence on the presence of fixed charge on NF membranes. The co-ion
rejection model, the model that explains separation of ions in charged membrane is not
sufficient to explain the lower rejection of Cl' than of its counterpart cation that were obtained
from this study.
2. The mechanism of separation of ions in NF membranes is based on the combination of sieve
effect and ion hydration effect. All single atomic ions, as well as some simple poly-atomic
ions have hydrated radii in the order of 10"10 of a meter (smaller than one nanometer by an
order of magnitude) [45], therefore each of these ions can pass through a NF membrane pore
by sieve effect. Different levels of rejection can be obtained for different ions from a feed
solution containing a mixture of electrolytes which is passed through a specific type of
membrane. The different levels of ion rejection can be attributed to the extent of hydration of
the different ions, which has been described in terms of a so-called hydration number [68],
i.e., the higher the hydration number of the ion, the higher is the ion rejection that can be
obtained.
3. Ion rejection remains almost the same at higher levels of feed solution concentration. At these
levels of feed concentration, the distances between hydrated ions are shorter, however limited
by number of water molecules surrounding each hydrated ion. This results to significant
effect of inter-ionic forces of attraction, i.e., the attraction between oppositely charged ions.
Some of these oppositely charged ions are held together, thus limiting the possibility of these
ions to pass through the membrane pores.
4. Ion rejection is lowest for both MPT-34 and TFC-SR at feed solution pH of 7. The rejection
of cation is increased by slightly acidifying (up to pH not lower than 4) the feed solution. The
rejections of both anion and cation are increased by making the feed solution slightly alkaline
(pH not greater than 8). These effects are found true for both MPT-34 and TFC-SR.
108

5. The additions of either acid or base to neutral electrolyte solution results to a decrease in
permeate flux. This has been found true for both MPT-34 and TFC-SR.
6. Permeate flux obtained in passing solution of single electrolyte solute through a specific
nanofiltration membrane is significantly influenced by the type of salt. Higher permeate flux
can be obtained from chloride salts of univalent cation (NaCl, CsCl) than from chloride salt
of di-valent cation (CoCl2). Similarly, higher permeate flux can be obtained from sodium salt
of univalent anion (NaCl) than from sodium salt of di-valent anion (Na2SO4). Similar values
and trends of permeate fluxes can be obtained from 1:1 salts, i.e., combination of univalent
cation and univalent anion (NaCl, CsCl). Similarly, the values and trends of permeate fluxes
that can be obtained from 1:2, i.e., combination of univalent cation and di-valent anion
(Na2SC>4) and 2:1, i.e., di-valent cation and univalent anion (C0CI2) salts are similar.
7. Permeate fluxes from NF operation obey the osmotic pressure model. This may be helpful for
developing permeate flux-feed concentration relationships for prediction of NF membrane
performances in future research.
8. Each NF membrane has a characteristic hydraulic permeability (L), i.e., water flux per unit
pressure difference. The values of L determined from this study for MPT-34, NF-70, and
TFC-SR membranes are 0.0277, 0.1613, and 0.181, respectively.
Other useful findings on separation of electrolyte solutions by NF are:
1. The level of ion rejection in solution with single electrolyte solute is different from those
obtained from solution with multiple number of solutes. The existence of the forces of
attraction between ions becomes significant to affect the rejection in multi-ionic solutions,
i.e., the rejection of an individual ion in a multi-ionic solution is of lower value than the
rejection of the same ion specie in a solution of single electrolyte solute.
2. Na+ from Na2SO4 is more rejected than Na+ from NaCl. The dissociation of Na2SO4 produces
more ions of Na+ than that of NaCl. SO4= which is more hydrated and has bigger size of
hydrated ion than Cl" have shown to be more rejected than Cl". The shorter distances between
the SO4= ions on the membrane surface possibly prevent the passage of Na+ through the
membrane resulting to its higher level of rejection.
109

By comparing the experimental results with other authors' findings in their previous studies on
RO, it is found that the separation of ions in UF, RO and NF are all based on the combination of
sieving effect and the hydration of ions. Since NF showed different rejection for different ions.
There is therefore a potential for selective ion separation in multi-ionic aqueous solution. This
possibility in NF makes it more advantageous over RO, which has shown very high rejection of
Na+. Moreover, ion rejection, which is obtained by passing multi-ionic solutions through RO are
expected to be of close range. Another advantage of NF over RO is that NF membranes require
less operating pressures than RO and are therefore more economical to use.
From this study, it was found possible to determine the effective pore size of NF membranes from
permeate flux and rejection data by using the hydrodynamic model. The model is based on the
assumption that the membrane is neutral and that the separation mechanism involved is sieving
effect. Since NF membranes were found to have no fixed charge and that sieve effect is a
separation mechanism involved the model can be applied in membrane pore size approximation.
In the application of the model, anion rejection data should be used to in fit into the values
calculated using the hydrodynamic model. The reason is that the anion rejection is found lower
than that of its counterpart cation which means that the forces that act as barrier in the separation
of ions has less effect on anion than on its counterpart cation. It is therefore reasonable to assume
that the size of the hydrated anion and the membrane pore size govern the passage of the anion
through the membrane pore.
The approximate effective pore sizes in nm determined by the use of the model are 0.526, 0.454,
and 0.553 for MPT-34, NF-70, and TFC-SR, respectively.
110

Symbols and Abbreviations
Symbols Meaning of Symbols
a reflection coefficient
^ equilibrium partition coefficient for spherical solute in spherical pore
6 osmotic coefficient
0 reflection coefficient
s charge to feed concentration ratio
X ratio of solute to pore radius
All difference in osmotic pressure
<j>Kd hindered diffusivity
AP difference in pressure
Ax is the membrane thickness
a,,, b n Bungay and Brenner (1973) constants
cm average solute concentration in membrane pore
Cf solute concentration in the feed
cm membrane surface concentration
cp permeate concentration in external solution
cs solute concentration in the pore
Dao bulk solution diffusion coefficient
Beg- effective diffusion coefficient
Ds s o l u t e d i f f u s i v i t y ( = 2 R T w ° , . u 2 l { u t + u 2 ) )
ju electrochemical potential4 -1
/ Faraday constant [9.6485 x 10 coulombs • mol ]
F a function of volume flux in terms of solute permeability and reflection
coefficient
j . ion flux based on membrane pore areaJs solute flux based on membrane area
Jv volume flux through the membrane
k mass transfer coefficient
111

Symbols Meaning of Symbols
Kc
Kd
Ks, K,
L
Ls
NRe
Ns
Nsc
NSh
Pe
R
rP
rs
Sa
So
T
V
X
z
zi
Ax/Ak
a
V
convective hindrance factor
diffusive hindrance factor
hydrodynamic functions in Bungay and Brenner's analysis
hydraulic permeability
solute permeability
Reynolds number
sum of the convective and diffusive contributions
Schmidt number
Sherwood number
Peclet number
rejection (1 - c 1 c,)
pore radius
solute radius
asymptotic sieving coefficient
actual sieving coefficient (c// cw)
observed sieving coefficient (Cf/cb)
temperature
average solution velocity
distance across membrane
axis perpendicular to the membrane surface.
valence of ion
membrane thickness/porosiy
O 0 0
cation transport number ( u (. / (w ;. + u 2) )
electric potential
112

List of References
1. Wiley, D., Water purification with membranes, Australian Science Magazine, 3 (1985) 38-
43.
2. Rautenbach, R. and Albrecht, R., Membrane Processes, (1989), 2-6.
3. Fane, A. G. Membrane Technology in the Process Industries, UNSW CEIC 5341 Lecture
Notes (1997).
4. Petersen, R. J., Composite reverse osmosis and nanofiltration membranes, J. of Membrane
Science, 83, (1993)81-150.
5. Fane, A. G., Pressure-Driven Membrane Processes-Microfiltration, Ultrafiltration, and
Reverse Osmosis (1996)
6. European Society of Membrane Science and Technology, Terminology for pressure-driven
membrane operations, Desalination, 68 (1993) 77-92.
7. Fane, A. G., Ultrafiltration: Factors Influencing Flux and Rejection, Progress in Filtration and
Separation, (4), (1986).
8. S. Sourirajan and Takeshi Matsura, Reverse Osmosis and Ultrafiltration, Encyclopedia of
Fluid Mechanics, (5), (1986).
9. Cadotte, J., Forester, R., Kim, M., Petersen, R. and Stocker, T., Nanofiltration Membranes
Broaden the Use of Membrane Separation Technology, Desalination, 70(1-3), (1988), 77-88.
10. Macoun, R. G., Shen, Y. R., Fane, A. G. and C. D. Fell, Nanofiltration: Theory and
Applications to Ionic Separations, Chemeca, (1991) 398-405.
11. Rautenbach, R. and Groschl, A., Separation potential of nanofiltration membranes,
Desalination, 77, (1990) 73-84.
12. SelRO Membrane Products, Technical data, Kiryat Weizmann, Ltd., Israel
13. FILMTEC Membranes, A Guide to Products and Specifications, Dow Chemical U.S.A.
14. Akred, R., Fane A. G. and Friend, J. P., Negative rejections of cations in the ultrafiltration of
gelatine and salt solution, Proceedings, A.C.S. Symposium on Ultrafiltration Membranes and
Applications, 1979.
15. Nakao, S. and Kimura, S., Analysis of Solutes Rejection in Ultrafiltration, J. of Chemical
Engineering of Japan, 1(14), (1981) 32-37.
16. Battacharyya et al., Use of negatively-charged ultrafiltration membranes, Polymer Science
and Technology, (13), (1982) 605-608.
17. Jitsuhara and Kimura, S., Rejection of inorganic salts by charged ultrafiltration membranes
made of sulfonated polysulfone, J. of Chemical Engineering of Japan, 5(16), (1983) 394-399.
113

18. Nakao, S. et ah, Separation of proteins by charged ultrafiltration membranes, Desalination,
70,(1988)191-205.
19. Tsuru, T., Nakao, S. and Kimura, S., Effective charge density and pore structure of charged
ultrafiltration membranes, J. of Chemical Engineering of Japan, 5 (23), (1990) 604-610.
20. Senyo Opong, W. and Zydney, A. L., Diffusive and Convective Potein Transport through
Asymmetric Membranes, American Institute of ChE Journal, 10 (37), (1991)1497-1510.
21. Coster, H. G. L., Kim, K. J., Dahlan, K., Smith, J. R. and Fell, C. J. D., Characterisation of
ultrafiltration membranes by impedance spectroscopy. I. Determination of the separate
electrical parameters and porosity of the skin and sub layers, Journal of Membrane Science,
66,(1992) 19-26.
22. Coster, H. G. L., The double fixed charge membrane: solution-membrane ion partition &
effects and membrane potentials, Biophysical Journal, (13), (1973) 131-143.
23. Causserand et ah, Study of streaming potentials of clean and fouled ultrafiltration
membranes, J. of Membrane Science, 88, (1994) 211-222.
24. Basu, S. and Sharma, M., An improved space-charge model for flow through charged
microporous membranes, J. of Membrane Science, 124, (1997) 77-91.
25. Mita, G. et al., Matter transport due to concentration gradients in unselective porous
membranes: fundamental and experimental aspects, J. of Membrane Science, 115, (1996)
191-206.
26. Raridon, R. J., Dresner, L. and Kraus, K. A., Hyperfiltration studies V. Salt rejection of
membranes by a concentration polarization method, Desalination, 1, (1966) 210-224.
27. Kimura, S. and Sourirajan, S., Analysis of data in reverse osmosis with porous cellulose
acetate membranes used, American Institute of Chemical Engineers J., 3(13), (1967) 497-
502.
28. Hoffer, E. and Kedem, O., Hyperfiltration in charged membranes: the fixed charge model,
Desalination, 2, (1967) 21-24.
29. Dresner, L., Some remarks on the integration of the extended Nernst-Planck equations in the
hyperfiltration of multi-component solutions, Desalination, 10, (1972) 17-26.
30. Kurihara, M. et <ar/.,The thin-film composite low pressure reverse osmosis membranes,
Desalination, 54, (1985) 75- 88.
31. Ikeda, K., Nakano, T., Kubota, T. and Yamamoto, S., New Composite Charged Reverse
Osmosis Membrane, Desalination, 68, (1988) 109-119.
114

32. Tsuru, T., Nakao, S. and Kimura, S., Calculation of ion rejection by extended Nernst-Planck
equation with charged reverse osmosis membranes for single and mixed electrolyte solutions,
J. of Chemical Engineering of Japan, 4 (24), (1991) 511-517.
33. Tsuru, T., Masakatsu, M. and Nakao, S. I., Reverse osmosis of single and mixed electrolyte
solutions with charged membranes: experiment and analysis, J. of Chemical Engineering of
Japan, 4 (24), (1991) 518-524.
34. Starov, D. R. Lloyd, V. M., Gorski, V. G. and Hall, M. S., Separation of electrolyte mixtures
by reverse osmosis, IMSTEC '92 Proceedings-Extended Abstracts (1992).
35. Hall, M. S., Starov, V. M. and Lloyd, D. R., Reverse Osmosis of Multi-component
Electrolyte Solutions, Part I. Theoretical Development, Journal of Membrane Science 128,
(1997) 23-37.
36. Hall, M. S., Starov, V. M. and Lloyd, D. R., Reverse Osmosis of Multi-component
Electrolyte Solutions, Part II. Experimental Verification, Journal of Membrane Science 128,
(1997)39-53.
37. Nystrom, M. et al., Fouling and retention of nanofiltration membranes, J. of Membrane
Science, 98, (1995) 249-262.
38. Bowen, W. R. and Mukhtar, H., Characterisation and prediction of separation performance of
nanofiltration membranes, J. of Membrane Science, 112, (1996) 263-274.
39. Childress, E. and Elimelech, M., Effect of soluton chemistry on the surface charge of
polymeric reverse osmosis and nanofiltration, J. of Membrane Science, 119, (1996) 253-268.
40. Shaw, D. J., Electrophoresis, Academic Press, London, (1969).
41. Kunin, R. and Myers, R. J., Ion Exchange Resins, (1950) 7-36.
42. Wijmans, J. et a!., Hydrodynamic resistance of concentration polarization boundary layers in
ultrafiltration, J. of Membrane Science, (1985) 117-135.
43. Jonsson, G., Boundary layer phenomena during ultrafiltration of dextran and whey protein
solutions, Desalination, 51, (1984) 61-77.
44. Horvath, A., Handbook of aqueous electrolyte solutions, England, (1985).
45. Marcus, Y., Ion Solvation, (1985).
46. Kevan, L. and Webster, B. C, Electron-solvent and ion-solvent interactions, (1976).
47. Frank, H. S. and Wen, Discuss. Faraday Soc, 24, (1957) 133.
48. Deen, W. M., Hindered transport of large molecules in liquid-filled pores, AIChE Journal, 9
(33), (1987) 1409-1425.
49. Urairi, M., Tsuru, T., Nakao, S. and Kimura, S., Bipolar reverse osmosis membrane for
separating mono- and divalent ions, J. of Membrane Science, 70, (1992) 153-162.
115

50. Atkins, P. W., Physical Chemistry, Oxford University Press, (1990).
51. Barrow, G. M., Physical Chemistry, 5th edition, (1988) 303-340.
52. Berry, R. S., Rice, S. A. and Ross, J., Physical Chemistry, (1980) 383-484.
53. Del Castillo, L. F., Mason, E. A. and Viehland, L. A., Energy-barrier models for membrane
transport, Biophysical Chemistry, 9, (1979) 111-120.
54. Elimelech, M., Chen, W. H. and Waypa, J. J. Measuring the zeta (electrokmetic) potential of
reverse osmosis membranes by a streaming potential analyzer, Desalination, 95, (1994) 269-
286.
55. Fine, L. W. and Beall, H., Chemistry for Engineers and Scientists, (1990) 552-562.
56. Flory, Paul J., Principles of Polymer Chemistry, Ithaca, N.Y., (1953) 530-533.
57. Harned, H. S. and Owen, B. B., The Physical Chemistry of Electrolytic Solutions, American
Chemical Society Monograph Series, (1950).
58. Ion Chromatography, Proceedings of a Symposium Held at the UNSW, 21 November 1984.
59. Levitt, D. G., Kinetics of diffusion and convection in 3.2 D pores, Biophysical Journal, (13),
(1973) 187-206.
60. Malone, D. and Anderson, J., Diffusional boundary-layer resistance for membranes with low
porosity, American Institute of Chemical Engineers J., 2 (23), (1977) 177-184.
61. Maron, S. and Prutton, C , Principles of physical chemistry, 4th ed., U.S.A., (1969), 429.
62. Matsuura, T., Synthetic Membranes and Membrane Separation Processes, CRC Press, (1994)
225-240.
63. McDonogh, R. M., Fane, A. G. and Fell, C. J. D., Charge effects in the cross-flow filtration of
colloids and particulates, J. Membrane Sci., 43(1989)69-85.
64. Nakao, S., Determination of pore size and pore distribution 3. Filtration membranes, J. of
Membrane Science, 96, (1994) 131-165.
65. Nystrom, M., Pihlajamaki, A. and Ehsani, N., Characterisation of ultrafiltration membranes
by simultaneous streaming potential and flux measurements, J. of Membrane Sci., 87, (1994)
245-256.
66. Petrucci, S., Ionic Interactions, vol. 1 Equilibrium and Mass Transport, (1971).
67. Ricq, L., Pierre, A., Reggiani, J. and Pagetti, J., Streaming Potential and Ion transmissions
during Ultra- and Microfiltration on Inorganic Membranes, Desalination 114, (1997) 101-
109.
68. Samoilov, O. Y., Structure of Aqueous Electrolyte Solutions and the Hydration of Ions, N.
Y.; (1965) 74-96.
116

69. Sourirajan, S. and Takeshi Matsura, ) Ch. 25 Reverse Osmosis and Ultrafiltration,
Encyclopedia of Fluid Mechanics, (5), (1986).
70. Sourirajan, S., Reverse Osmosis, London, (1970).
71. Timmer, J. et ah, Transport of lactic acid through reverse osmosis and nanofiltration
membranes, J. of Membrane Science, 85, (1993) 205-216.
72. Tsapiuk, E. A., Calculation of the product composition and the retention coefficient by
pressure driven membrane separation of solutions containing one and two solutes, Journal of
Membrane Science, 124, (1997) 107-117.
73. Tsuru, T., Urairi, M., Nakao, S. and Kimura, S., Negative rejection of anions in the loose
Reverse osmosis separation of mono- and divalent ion mixtures, Desalination, 81, (1991)
219-227.
74. Tsuru, T., Urairi, M., Yabe, T., Nakao, S. and Kimura, S., Ion separation by reverse osmosis
with mono- and bipolar membranes, New Developments in Ion Exchange, ICIE '91
Proceedings, (1991).
75. Vilker, V. L., Reverse osmosis and ultrafiltration, AIChE Modular Instruction, Series B,
Stagewise and Mass Transfer Operation, Separation Process, (6), (1986) 62-63.
76. Welz, B., Atomic Absorption Spectrometry, 2nd ed., VCH, ISBN 0 89573 418 4.
77. Yukawa, H. et ai, Cross flow electro-ultrafiltration for colloidal solution of protein, J. of
Chemical Engineering of Japan, 4 (16), (1983) 306.
117

Appendices

Appendix A
Membrane Properties and Module Designs
119

Appendix A Section AlStructural Formula of the Repeating Unit in Some Polymers
Name of Polymer
Cellulose Acetate
Cellulose Acetate
Cellulose Acetate
Cellulose
Cellulose Triacetate
Cellulose AcetatePropionate
Aromatic Copolyamide
Aromatic Polyimide
Symbol
CA-398
CA-376
CA-383
CE
CTA
CAP-151
PA
PI
Structure of Repeating Unit
0II
(CH2)4(CH)2o(0)8(OH)2.19(OCCH3)9.81
0
II(CHj^CH^c^O^OH^ 05 (OCCH3}9 si
0||
(CHa)4(CH)ai(OMOH)2.78(OCCH3)9.22
( C H ^ C H J M C O M O H ) ^
0
II
0 OII II
o o
II II- N H - ^ - C-NH-^-C-
0 0
II x ? v II
O 0
120
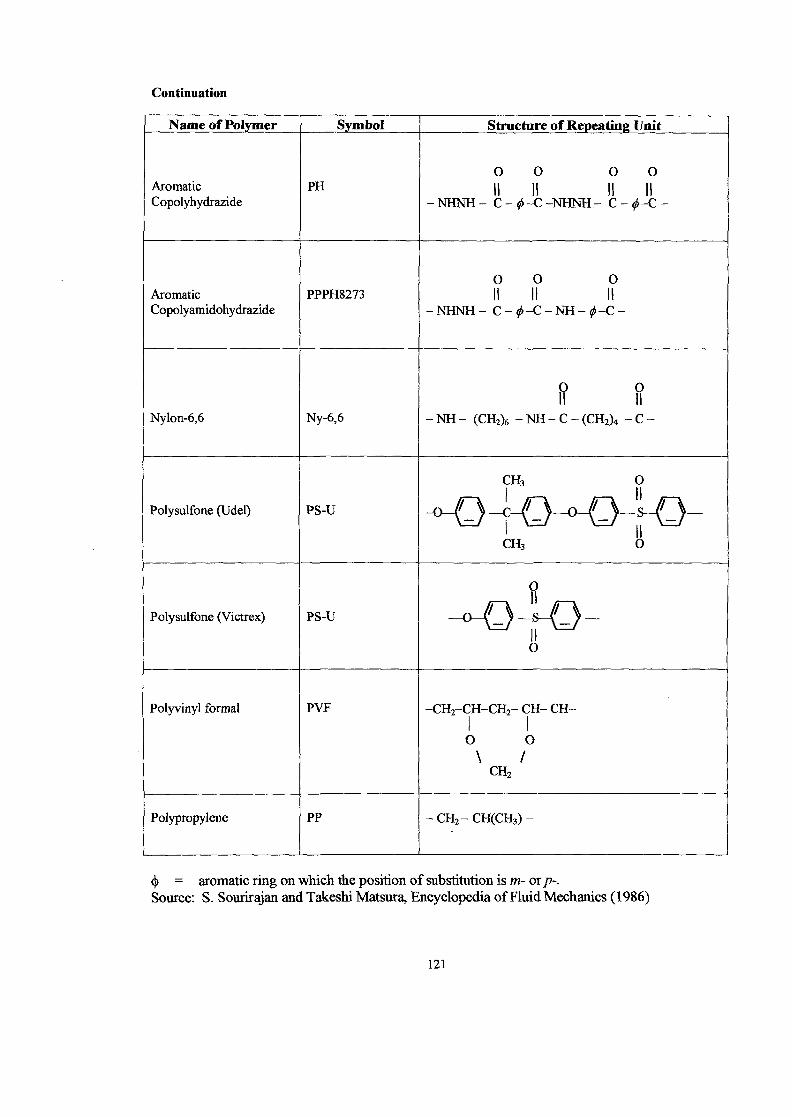
Continuation
Name of Polymer
AromaticCopolyhydrazide
AromaticCopolyamidohydrazide
Nylon-6,6
Polysulfone (Udel)
Polysulfone (Victrex)
Polyvinyl formal
Polypropylene
Symbol
PH
PPPH8273
Ny-6,6
PS-U
PS-U
PVF
PP
Structure of Repeating Unit
0 0 O OII II II II
-NHNH- C-f»-C-NHNH- C - ^ - C -
O 0 OII II II
-NHNH- C-$*-C-NH~i*-C-
í? IÍ- N H - (CH2)6 -NH-C-(CH 2 ) 4 - C -
CH3 01 H
1 IICH3 0
II0
- C H Î - C H - C H J - CH- CH-
O O\ /
CH2
-CH2-CH(CH3)-
<J> = aromatic ring on which the position of substitution is m- or p-.Source: S. Sourirajan and Takeshi Matsura, Encyclopedia of Fluid Mechanics (1986)
121

Section A2
Membrane Structure and Design
Membrane Module Designs:
RO and UF have to be mounted in appropriate pressure vessels in order to be useful in industrial
operations. Such vessels are modular in design and provisions are made to allow the membranes
to withstand high operating pressures.
Plate-and-Frame Module Design:
Figure A2.1 shows a typical example of a plate-and frame module with the different parts
identified. It is a closely spaced file of perforated support plates with channels for the flow of
permeate. The membranes are mounted on both sides of each plate. Feed solution flows outwards
and inwards alternately through the narrow spaces between the membrane surfaces.
Figure A2.1 Cross-sectional Diagram of a Plate and Frame Module Design
122

Spiral-Wound Module:
The spiral-wound configuration is the most popular among the module designs. It offers easy
membrane cleaning and large membrane area per unit volume of the module. In this module, Two
sheets of membrane are placed one on each side of a porous polyester fabric material which
serves as permeate carrier. They three pieces are sealed with epoxy around the edges of three
sides to form an envelope. The remaining open side is attached to a perforated product-water
collector tube. A woven mesh of polypropylene plastic sheet, which serves as space and also as
turbulence promoter for the feed solution is laid on one side of the membrane envelope. A single
leaf formed by the membrane envelope and the spacer is rolled to form a bundle constituting a
cartridge in the module. Three to six cartridges are connected together within a pressure vessel.
Pressurized feed water enters the module at one end and flows through the spacer channels in the
spiral windings of the first cartridge. A fraction of the product permeates through the membrane
and travels a spiral path to the product collection tube at the center of the cartridge. The
remaining feed flows through spacer regions to the end of the cartridge length after which it
encounters the next cartridge in the module. The process is then repeated. Figure A2.3 shows a
basic configuration of a spiral-wound module.
Figure A2.3 An example of Membrane with Spiral-Wound Module Design
123
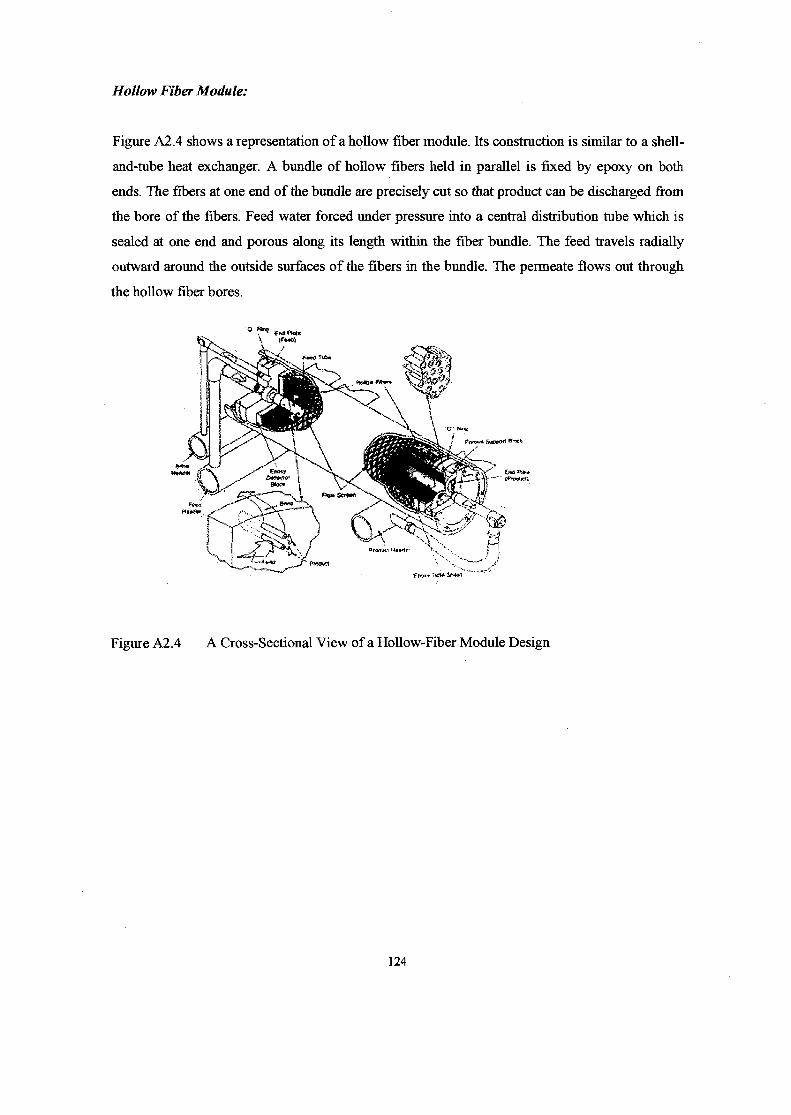
Hollow Fiber Module:
Figure A2.4 shows a representation of a hollow fiber module. Its construction is similar to a shell-
and-tube heat exchanger. A bundle of hollow fibers held in parallel is fixed by epoxy on both
ends. The fibers at one end of the bundle are precisely cut so that product can be discharged from
the bore of the fibers. Feed water forced under pressure into a central distribution tube which is
sealed at one end and porous along its length within the fiber bundle. The feed travels radially
outward around the outside surfaces of the fibers in the bundle. The permeate flows out through
the hollow fiber bores.
Figure A2.4 A Cross-Sectional View of a Hollow-Fiber Module Design
124

Tubular Module Design:
Tubular modules involve membranes that are cast integrally on the inside surfaces of support
tubes. These tubes are porous and made of high-density polyethylene.
Figure A2.2 shows an example of a tubular module with three integrally supported tubular UF
membranes. It consists essentially of a cylinder for housing the supported membranes through
appropriate end-plate connections. The cylinder has suitably spaced openings for the withdrawal
of permeates. To keep the membrane tube rigid within the cylinder, a spacer holding the
membrane tube in place is used at suitable space interval.
This module design is one of the oldest used in industry. Ease of cleaning is the greatest
advantage. The disadvantage is the smallest area per unit volume of module space, which is
roughly 50 tf/ft3. This type of module is primarily used in UF applications involving highly
viscous or highly turbid or particle-laden feed solutions.
125

Top View
Tube
Spacer
Front View
Figure A2.2 Top and Front View of a Tubular Module Design with 3 Tubes
Reference:1. S<>uriraj an and Takeshi Matsura, (1986).
2. Rautenbach and Albrecht (1989).
126

Appendix B
Computer Programs
127

Appendix BSection Bl
COMPUTER PROGRAM 1
REM PROGRAM TO CALCULATE THICKNESS/POROSITY OF NFREM MEMBRANES USING EXTENDED NERNST-PLANCK EQUATIONREM Prepared By: CORAZON M. GARCIAREM Language Used: BASIC
PRINT TAB (20); " * * * * * * * * * * * * * * * * * * * * * * * *
P R I N T T A B ( 2 0 ) ; "* W E L C O M E T O N E R N S T P L K . B AS * "
PRINT TAB(20); " * * * * * * * * * * * * * * * * * * * * * * * *
PRINT : PRINTOPEN "A:\EXTNP.DAT" FOR OUTPUT AS #1OPEN "A:\NPERES.DAT" FOR OUTPUT AS #2
K = 05 K = K + 1
PRINT "Run No. "; K10 PRINT : INPUT "Effective charge density [mol/cu.m] "; CHRGDN
INPUT "Feed Concentration [mol/cu.m.] "; CONSFEEDINPUT "Permeate Concentration [mol/cu.m.] "; CONSPERMINPUT "Molar mobility of Counterion x E+13 [mol-sq.m/J-sec] ";
MOBCATINPUT "Molar mobility of Coion x E+13 [mol-sq.m/J-sec] "; MOBANINPUT "Temperature [degrees Centigrade] "; CENTIGINPUT "Volume flux based on membrane area x E+6 [cu.m/sq.m-sec]
"; FLUXINPUT "Do you want to change your input data [Y/N] "; AN$IF AN$ = "Y" THEN 10
12 REM *******************************
REM * VALUES OF CONSTANTS *
REM R = GAS CONSTANT [J/mol-K]R = 8.31451
REM * CALCULATE PARAMETERS *
20 REM ***** CALCULATE CATION TRANSPORT NO. *****ALPHA = MOBCAT / (MOBCAT + MOBAN)PRINT "Alpha = "; ALPHAj EM ***** CALCULATE SOLUTE DIFFUSIVITY *****T = CENTI + 273DIFFUSE = (2 * R * T * MOBCAT * MOBAN / (MOBCAT + MOBAN)) * 10
A -13PRINT "DIFFUSIVITY = "; DIFFUSER E M ***** CALCULATE PARAMETERS A, B, AND Z(C) *****
128

CONSTA = (CHRGDN ~ 2) + (2 * ((2 * ALPHA) - 1) * CHRGDN *CONSPERM)
CONSTB = -(((CHRGDN - CONSPERM) A 2) + (4 * ALPHA * CHRGDN *CONSPERM) ) A . 5
PRINT "A = "; CONSTAPRINT "B = "; CONSTBZPERM = ((4 * CONSPERM A 2) + CHRGDN "2) A .5
PRINT "Z(PERMEATE) = "; ZPERMZFEED = ((4 * CONSFEED " 2) + CHRGDN " 2) A .5PRINT "Z(FEED) = "; ZFEED
25 REM ***** CALCULATE MAIN EQUATION *****TERMA = ZPERM ~ 2 - (2 * CONSPERM * ZPERM) - CONSTAPRINT "TERM A = "; TERMATERMB = ZFEED A 2 - (2 * CONSPERM * ZFEED) - CONSTAPRINT "TERM B = "; TERMBTERMAB = .5 * (LOG(TERMA / TERMB))PRINT "AB = "; TERMABTERMC = (ZPERM - CONSPERM - CONSB) / (ZPERM - CONSPERM +
CONSTB)PRINT "TERM C = "; TERMCTERMD = (ZFEED - CONSPERM + CONSTB) / (ZFEED - CONSPERM -
CONSTB)PRINT "TERM D = "; TERMDTERMCD = (CONSPERM / (2 * CONSTB)) * LOG(TERMC * TERMD)PRINT "CD = "; TERMCDCHFD = CHRGDN / CONSFEEDINTHPOR = DIFFUSE * (TERMAB - TERMCD) / (FLUX * 10 A -6)PORTHC = 1 / INTHPORREJECT = 1 - (CONSPERM / CONSFEED)PRINT "REJECTION = "; REJECTPRINT "THICKNESS/POROSITY = "; INTHPORPRINT "POROSITY/THICKNESS = "; PORTHCPRINT "EFFECTIVE CHARGE DENSITY/BULK CONCENTRATION: "; CHFD
PRINTINPUT "Do you want a print-out of results [Y/N] "; ANSW$IF ANSW$ = "n" THEN 95IF ANSW$ = "N" THEN 95IF ANSW$ = "No" THEN 95IF ANSW$ = "NO" THEN 95IF ANSW$ = "no" THEN 95PRINTINPUT "Do you want them tabulated [Y/N] "; ANS$
IF ANSW$ = "y" THEN 80IF ANSW$ = "Y" THEN 80IF ANSW$ = "Yes" THEN 80IF ANSW$ = "YES" THEN 80
50 REM ***** PRINT RESULTS *****PRINT #1,PRINT #1, "Run No. "; K
REM ***** PRINT INPUT DATA *****PRINT #1, : PRINT #1, TAB(22); "***** INPUT DATA *****"PRINT #1, : PRINT #1,
129

PRINT #1, TAB(6); "Effective charge density [mol/cu.m] : ";CHRGDN
PRINT #1, TAB(6); "Permeate Concentration [mol/cu.cra.] :";CONSPERM
PRINT #1, TAB(6); "Feed Concentration [mol/cu.m.] : "; CONSFEEDPRINT #1, TAB(6); "Molar mobility of cation [mol-sq.m/J-sec]
:"; MOBCATPRINT #1, TAB(6); "Molar mobility of anion [mol-sq.m/J-sec] :
"; MOBANPRINT #1, TAB(6); "Flux based on membrane area [cu.m/sq.m-sec]
"; FLUX
R E M ***** PRINT HANDBOOK DATA *****PRINT #1, : PRINT #1,PRINT #1, TAB{20); "***** HANDBOOK DATA *****"PRINT #1, : PRINT #1,PRINT #1, TAB (6); "Gas Constant [J/mol-K] :"; R
R E M ***** PRINT CATION TRANSPORT NO. *****PRINT #1, : PRINT #1,PRINT #1, TAB(20); ****** RESULTS OF CALCULATIONS *****"PRINT #1, : PRINT #1,PRINT #1, TAB(6); "Cation Transport No. :"; ALPHAPRINT #1, TAB(6); "Solute Diffusivity :"; DIFFUSEPRINT #1, TAB(20); "***** CONSTANTS DEFINED BY THE EXTENDED
NERNST-PLANCK EQ.*****"PRINT #1, TAB(6)PRINT #1, TAB(6)PRINT #1, TAB (6)PRINT #1, TAB(6)PRINT #1, : PRINTPRINT #1, TAB(6)PRINT #1, TAB (6)PRINT #1, TAB (6)PRINT #1, TAB(6)PRINT #1, TAB (6)PRINT #1, TAB (6)
"Constant A: "; CONSTA"Constant B: "; CONSTB"Conctant Z based on Feed: "; ZFEED"Conctant Z based on Permeate: "; ZPERM
"TERM A = "; TERMA"TERM B = "; TERMB"AB = "; TERMAB"TERM C = "; TERMC"TERM D = "; TERMD"TERM CD = "; TERMCD
PRINT #1, TAB (20) ; IH
PRINT #1, TAB(6); "membrane thickness/surface porosity: ";INTHPOR
PRINT #1, TAB{6); "rejection: "; REJECTPRINT #1, TAB(6); "effective charge density/bulk concentration:
"; CHFDPRINT #1, TAB(6); "porosity/thickness: "; PORTHCPRINT #1, : PRINT #1,GOTO 90
80 REM PRINT
130

IF K <> 1 THEN 85PRINT #2, TAB(28); "INPUT DATA:"PRINT #2, : PRINT #2, TAB(22); "***** INPUT DATA *****"PRINT #2, : PRINT #2,PRINT #2, TAB(6); "Molar mobility of cation [mol-sq.m/J-sec]
: "; MOBCATPRINT #2, TAB(6); "Molar mobility of anion [mol-sq.m/J-sec] :
"; MOBANPRINT #2, TAB(6); "Flux based on membrane area [cu.m/sq.m-sec]
"; FLUXPRINT #2,
PRINT #2, TAB(6)PRINT #2,PRINT #2, TAB(6)PRINT #2, TAB(6)PRINT #2, TAB (6)PRINT #2,PRINT #2, TAB(6)PRINT #2, TAB(6)
"CALCULATED PARAMETERS:'
"T emperature :"; CENTIG"Cation Transport No. :"; ALPHA"Solute Diffusivity :"; DIFFUSE
"RESULTS:""REJECTION"; TAB(18); "FEED CONC'N.";
TAB (32); "CHARGE/FEED CONC'N.";PRINT #2, TAB(52); "POR./THICK."
85 PRINT #2, TAB(6); REJECT; TAB(18); CONSFEED; TAB(32); CHFD;TAB(52); PORTHC
90
95
INPUT "Want another run [Y/N] ?
IF AN$ = "Y" THEN 5IF AN$ = "YES" THEN 5IF AN$ = "Yes" THEN 5IF AN$ = "yes" THEN 5
AN$
PRINT : PRINT TAB(21); "***** END OF PROGRAM *****"PRINT #1, : PRINT #1, : PRINT #1, TAB(20); "***** END OF
PROGRAM *****"PRINT #2, : PRINT #2, : PRINT #2, TAB(20); "***** END OF
PROGRAM *****"CLOSE #1CLOSE #2
100 END
131

Section B2Computer Program 2
REM PROGRAM TO CALCULATE FLUX & SIEVING COEFFICIENTREM RELATIONSHIP USING HYDRODYNAMIC PARAMETERSREM Prepared By: CORAZON M. GARCIAREM Language Used: BASICPRINT TAB(20); " * * * * * * * * * * * * * * * * * * * "PRINT TAB(20); " ^ W E L C O M E T O HYDROMOD.BAS *"PRINT T A B ( 2 0 ) ; " * * * * * * * * * * * * * * * * * * * "PRINT : PRINT
OPEN "A:\HYDRO.DAT" FOR OUTPUT AS #13 K = 0
PRINT TAB(13); "CALCULATION BY HYDRODYNAMIC MODEL"PRINT : INPUT "Membrane Type "; MEMBRAN$PRINT #1, TAB(20); "CALCULATION BY HYDRODYNAMIC MODEL FOR ";
MEMBRAN$5 K = K + 1
10 INPUT "Mass Transfer Coefficient "; SHINPUT "Peclet No. "; PEINPUT "Assymptotic Sieving Coefficient "; SIEVEMINPUT "Flux [cu.m/sq.m.s] "; FLUXINPUT "Do you want to change your input data [Y/N] "; AN$IF AN$ = "Y" THEN 10
]_5 REM ***************************************
REM * CALCULATE SIEVING COEFFICIENT *REM ***************************************
SIEVEA = (SIEVEM / (SIEVEM + PE)) * (EXP(FLUX * PE / K))50 REM ***** PRINT ON SCREEN *****
PRINT : PRINT "Run No. "; K60 PRINT TAB(25); "*** INPUT DATA ***"
PRINTPRINT "Flux [cu.m/sq.m.s] : "; FLUXPRINT "Assymptotic Sieving Coefficient : "; SIEVEMPRINT "Peclet Number : "; PEPRINT "Mass Transfer Coefficient : "; SHPRINT : PRINT , TAB(22); "*** CALCULATED RESULTS ***"PRINT : PRINT "Actual Sieving Coefficient : "; SIEVEPRINT
80 REM *** PRINT OUT OF RESULTS ***
PRINTPRINT #1, "Run No. "; KPRINT #1, "INPUT DATA :"PRINT #1, "Membrane Type; "; MEMBRAN$PRINT #1, "Flux [cu.m/sq.m.s] : "; FLUXPRINT #1, "Assymptotic Sieving Coefficient : "; SIEVEMPRINT #1, "Peclet Number : "; PE
132

PRINT #1, "Mass Transfer Coefficient : "; SHPRINT #1, : PRINT #1, "CALCULATED RESULTS :"PRINT #1, : PRINT #1, "Actual Sieving Coefficient : "; SIEVEPRINT #1,INPUT "Do you want to have another run [Y/N] "; N$IF N$ = "Y" THEN 5IF N$ = "YES" THEN 5IF N$ = "yes" THEN 5IF N$ = "Yes" THEN 5IF N$ = "y" THEN 5
PRINT TAB(25); "*** END OF RUN ***"PRINT #1, TAB(22); "*** END OF RUN ***"CLOSE #1
100 END
133

Appendix C
Equipment and Instruments in Membrane Experiments
134

Section ClNanofiltration Operation Based on Membrane Cell Model
Figure Cl.l Stirred Flow Cell Model
Figure Cl.l A Cross-flow Cell Model
135

Section C2Analytical Equipment
Figure C2.1 Waters Ion Chromatography
Figure C2.2 Varian Atomic Absorption Spectrometer
136