ionizing radiation: sources and biological effects€¦ · ionizing radiation: sources and...
TRANSCRIPT
IONIZING RADIATION: SOURCES AND BIOLOGICAL
EFFECTS United Nations Scientific Committee on the Effects of Atomic Radiation
1982 Report to the General Assembly, with annexes
UNITED NATIONS New York, 1982
NOTE
The report of the Committee without its annexes appears as Official Records of the General Assembly, Thirtyseventh Session, Supplement No. 45 (A/37/45).
The designations employed and the presentation of material in this publication do not imply the expression of any opinion whatsoever on the part oft he Secretariat of the United Nations concerning the legal status of any country, territory. city or area, or of its authorities, or concerning the delimitation of its frontiers or boundaries.
UNITED NATIONS PUBLICATION Sales No. E.82.IX.8
06300P
Scientific Annexes
ANNEX A
Dose assessment models
CONTENTS
!NTRODUCTJON ....................... .
I. THE PURPOSE OF DOSE ASSESS-l\1ENTS ........................... . A. IndMdual-related assessments ..... . B. Source-related assessments ........ .
II. DOSIMETRIC MODELS ............ .
A. Indh'idual-related assessments ..... . 1. External irradiation ......... . 2. Internal irradiation ......... .
B. Source-related assessments ........ .
III. ENVIRONMENTAL MODELS ...... .
A. General ....................... . B. Uncertainty of predictions from
models ........................ .
IV. ATMOSPHERICTRANSPORT MODELS .......................... .
A. Models for local and regional transport from a defined point of release ..
B. Global models .................. .
C. Dose calculation ................ . 1. Direct irradiation from the
cloud ..................... .
Introduction
Paragraphs
1-9
10-13 10-12
13
14-56 23-44 23-28 29-44 45-56
57-78 57-69
70-78
79-113
81-93 94-97 98-113
100-103
1. As stated in the main text of the UNSCEAR 1977 report [Ul], the Committee reviews data on human exposure to radiation for several purposes. One purpose is to assess the levels of exposure to which individuals are subjected, another is to assess the levels of exposure to populations resulting from identified sources of radiation, a third is to provide basic data.
2. The relationship between the levels of exposure to
2. Direct inhalation from the cloud ..................... .
3. Direct inhalation from resus-pended material ............ .
4. Population distribution models
V. TERRESTRIAL MODELS ........... .
A. External irradiation from deposited radionuclides ..........•....•.••.
B. Dietary transfer models and dose cal-culations .•............•.......•.
C. Models for transport under the ground surface ...•...............
VI. AQUATIC MODELS ................ .
A. Isolated water bodies ............. . B. Rivers ......................... . C. Seas and oceans ................. . D. Global models .................. . E. Dose calculation ................ .
1. Direct consumption of water .. 2. Consumption of fish and other
aquatic flora and fauna ...... . 3. Consumption of agricultural
products .................. . 4. Other pathways ............ .
VII. CONCLUSIONS ................... .
References .............................. .
Paragraphs
104-105
106-109 110-113
114-138
120-128
129-137
138
139-161 140-141 142-145 146-150 151-155 156-161
158
159
160 161
162-171
Page
79
an individual and the probability of induction of a health effect which is presumed to result from the exposure is a matter of great complexity. There are certain effects which occur above some threshold dose and for which the clinical severity is dependent on dose. These effects have been called "non-stochastic" by the ICRP [12). For another class of effects there seems to be no evidence of a threshold dose and no relationship between dose and clinical severity, such as cancer induction. These effects have been called "stochastic" by the ICRP [12]. At the present state of
43
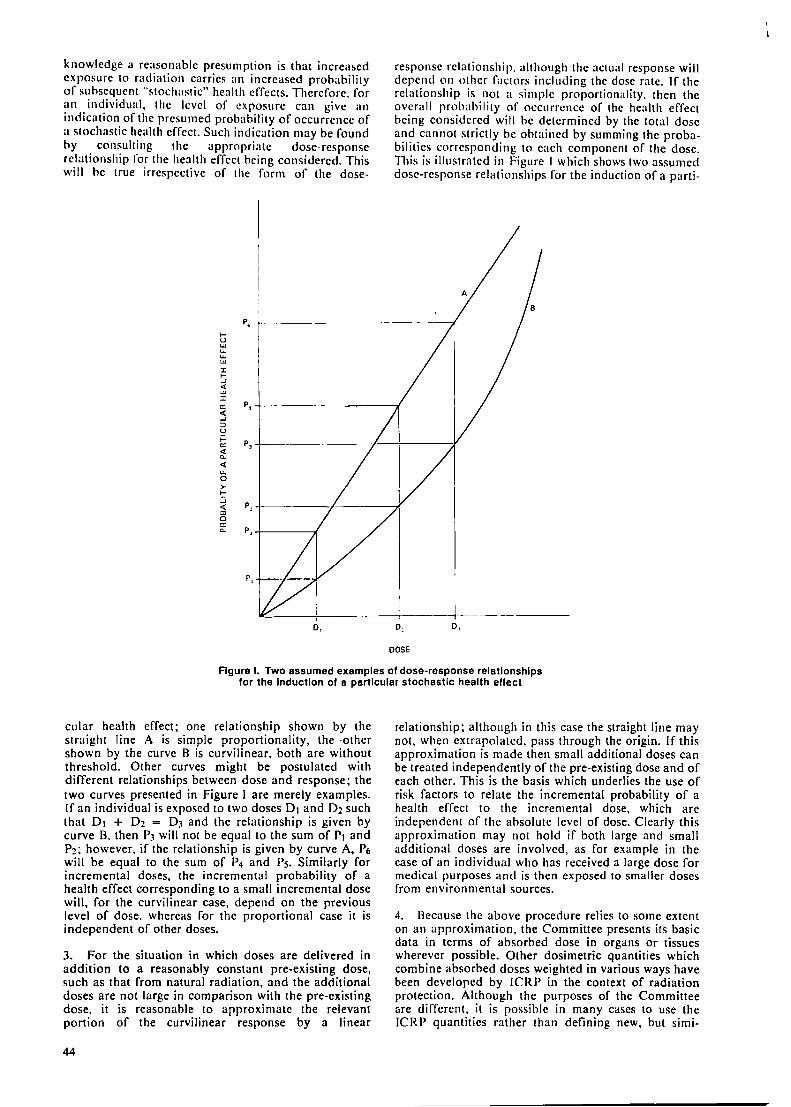
knowledge a reasonable presumption is that increased exposure to radiation carries an increased probability of subsequent "stochastic" health effects. Therefore, for an individual, the level of exposure can give an indication of the presumed probability of occurrence of a stochastic health effect. Such indication may be found by consulting the appropriate dose-response relationship for the health effect being considered. This will be true irrespective of the form of the dose-
P,
1-u w u.. u.. UJ
I ... _, <( w I
response relationship, although the actual response will depend on other factors including the dose rate. If the relationship is not a simple proportionality, then the overall probability of occurrence of the health effect being considered will he determined by the total dose and cannot strictly be obtained by summing the probabilities corresponding to each component of the dose. This is illustrated in Figure I which shows two assumed dose-response relationships for the induction of a parti-
c:: P,-+------------,r <( _, ::::) u ~ P3 -+----------r-+-----r <( c.. <( u. a >... ::; ;ii P, +--------,-----,,; a C: c.. p' -+------L
------+--------,!----,,---------o,
DOSE
D,
Figure I. Two assumed examples of dose-response relatlonshlps for the Induction of a particular stochastic health effect
cular health effect: one relationship shown by the straight line A is simple proportionality, the -other shown by the curve 8 is curvilinear, both are without threshold. Other curves might be postulated with different relationships between dose and response: the two curves presented in Figure I are merely examples. If an individual is exposed to two doses D1 and D2 such that D1 + D2 = D3 and the relationship is given by curve 8, then PJ will not be equal to the sum of P1 and P2: however. if the relationship is given by curve A, P6 will be equal to the sum of P4 and Ps. Similarly for incremental doses, the incremental probability of a health effect corresponding to a small incremental dose will, for the curvilinear case, depend on the previous level of dose, whereas for the proportional case it is independent of other doses.
3. For the situation in which doses are delivered in addition to a reasonably constant pre-existing dose, such as that from natural radiation, and the additional doses are not large in comparison with the pre-existing dose, it is reasonable to approximate the relevant portion of the curvilinear response by a linear
44
relationship; although in this case the straight line may not, when extrapolated, pass through the origin. If this approximation is made then small additional doses can be treated independently of the pre-existing dose and of each other. This is the basis which underlies the use of risk factors to relate the incremental probability of a health effect to the incremental dose, which are independent of the absolute level of dose. Clearly this approximation may not hold if both large and small additional doses arc involved, as for example in the case of an individual who has received a large dose for medical purposes and is then exposed to smaller doses from environmental sources.
4. Because the above procedure relies to some extent on an approximation, the Committee presents its basic data in terms of absorbed dose in organs or tissues wherever possible. Other dosimetric quantities which combine absorbed doses weighted in various ways have been developed by ICRP in the context of radiation protection. Although the purposes of the Committee are different, it is possible in many cases to use the ICRP quantities rather than defining new, but simi-
Jar. quantities. To avoid confusion. therefore, the ICRP quantities have been adopted by the Committee for use in the appropriate circumstances. These other dosirnetric quantities contain further assumptions; for example, dose equivalent includes assumptions as to the relative risk factors for different types of radiation. and takes the risk factors as constants for a given organ; effective dose equivalent introduces further assumptions as to the relative risk factors for irradiation of different organs or tissues.
5. When assessing exposures to populations. although in principle these may be expressed as the distribution of individual doses, it is necessary in practice to carry out some procedure such as totalling or averaging to convey these exposures in a manageable way. If there are not many individuals in the population who receive very high doses from medical treatments, and the other doses are comparable with or less than the dose from natural radiation, then the conditions for the approximation referred to earlier hold and the collective dose obtained by summing individual incremental doses from any source can be related to the mathematically expected number of health effects using the appropriate constant risk factor. This relationship will hold irrespective of the distribution of individual doses; indeed in many cases the procedure may be carried out without knowledge of the individual dose distribution.
6. In a few cases in which individuals are being considered it may be possible to estimate the levels of exposure from direct measurements. This is normally the situation for occupational exposure to external and to some forms of internal irradiation. In most other cases involving exposure to members of the public. whether considered as individuals or collectively. it will be necessary to estimate the levels of exposure indirectly, using models to connect the known or measured quantity of activity released or in the environment with the level of exposure to humans. The purpose of this Annex is to collect together and explain the dosimetric and environmental transport models used by the Committee in this report.
7. The models used have been separated into two general categories: environmental transport models which describe the movement of radioactive materials through all sectors of the environment after their release, and dosimetric models to calculate the absorbed dose following an intake of radioactive materials or exposure to external irradiation. Dosimetric models for intakes obtain the absorbed dose from calculations of the residence of radionuclides in the body after intake. In the later Annexes environmental transport models are used first to assess the radionuclide distributions which then form the input to dosimetric models. In this Annex. however, since the quantities involved in the dosimetric models contain many basic ideas and definitions, the order is reversed. The dosimetric models are presented in chapter II. followed by the environmental models in chapters I 11 to VI.
8. A specialized model which does not fall into either of the above categories is used in Annex H (Occupational exposures). This is based on the observation that the distribution of annual occupational doses appears to be log-normal in a number of cases. Dose distributions on which there are insufficient data for direct calculations are then analysed using the assumption that the distribution is log-normal. Other specialized
models, often tailored to particular irradiation conditions. are used in Annex G (Medical exposures).
9. To introduce some consistency into the use of symbols and terms for defined quantities, the Committee has used the SI system [P4], but additionally based its terminology in this report on the recommendations of the International Commission on Radiation Units and "Measurements [19] and of the International Commission on Radiological Protection [12] where appropriate. Standard terminology used in areas other than radiation dosimetry has been retained where possible [113]. In some cases, however. it has been necessary for consistency to use unfamiliar symbols. For this reason the quantity name. quantity symbol, unit name and unit symbol for most of the quantities used in the physical Annexes are given in Tables 1 and 2 of this Annex. Table 1 gives the basic and derived units for some of the quantities of interest in this report: Table 2 gives derived units for some other quantities. along with the quantity and unit symbols. Symbols are also given in Table 2 for terms used as designators or indices. There are a few terms indicated by multiple letter symbols that are included because they are generally recognized acronyms. The symbols used in Table 2 are those selected for use by the Committee in the physical Annexes (A to H) of this report; some may be used for different purposes by other bodies. The biological Annexes (I to L) did not lend themselves to such a consistent treatment as the physical ones, since many references are made to nomenclature introduced by different authors, which may be inconsistent with each other. The terms "radioactivity", "activity" and "radioactive material" are often confused and interchanged although they are not synonymous. ''Radioactivity" is the phenomenon of spontaneous decay, while •·activity'' is the number of nuclear transitions per unit time. Some of the confusion arises because the activity of a sample used to be a measure of the ''quantity" of that sample. It was then permissible to refer to the "release of activity", etc. However, with the present definitions by the ICRU [19], this is no longer correct. The Committee has therefore tried to avoid the use of "activity" as a synonym for "radioactive material"; some unintentional misuse may have been carried on because of previous practices.
I. THE PURPOSE OF DOSE ASSESSMENTS
A. INDIVIDUAL-RELATED ASSESSMENTS
10. The important quantities to assess when considering individuals are the absorbed doses associated with exposure during a year or over a lifetime. The magnitudes of both these quantities may be used to assess the probability of harmful consequences to the health of individuals exposed to radiation in a given year or over a lifetime.
11. Considerations of external irradiation are relatively simple as the absorbed dose is delivered at the time of the irradiation. Thus there is no problem of protraction of dose beyond the period of exposure.
12. Internal irradiation following an intake of radioactive materials whether by inhalation, ingestion or other means is, however, protracted to some extent and the absorbed dose in the organs or tissues of any individual after an intake will depend on conditions particular to the individual such as metabolism. age and life expectancy as well as on more general determinants
45
such as the half-life of the radionuclide. While it is possibl~ to make estimates for particular individuals, and t~1s may be done for medical purposes, the Committee assesses the mean absorbed dose in each organ or tissue, usually taking representative values for the various conditions, either for complete populations or for particular subgroups in the population.
D. SOURCE-RELATED ASSESSMENTS
13. The source-related assessments carried out by the Committee estimate the total human irradiation resulting from the source. practice or event. This total human _irradiation is obtained by considering all the population groups exposed to radiation in different geographical locations and at different times. This is generally obtained by integrating in an appropriate fashion to cover the spatial and temporal distributions of radiation or radionuclides from the source. The parameters used in the calculations and the models are generally applicable to representative characteristics of large population groups. Source-related assessments are used by the Committee for comparisons of sources in terms of their presumed total health impact.
II. DOSIMETRIC MODELS
14. For the reasons given in the Introduction (paragraph 7), dosimetric models are described before environmental transport models, although in practical calculations the order is reversed. Dosimetric models are used by the Committee to assess the absorbed doses and weighted absorbed doses resulting from exposure to radiations of different types or from intakes of radioactive materials. The models include those for predicting the behaviour of radioactive materials in the body after intake and those making an allowance for the risk of induction of particular health effects after exposure to radiation. In some cases the model is not described explicitly but is part of the background underlying the choice of a particular quantity for use in characterizing the impact of radiation exposure of man. For the quantities used here to quantify the effect of irradiation of people, it is assumed that there is proportionality between the absorbed dose to an individual and the probability of occurrence of stochastic health effects. as discussed in the Introduction (paragraph 3). Other possible assumptions are discussed in Annexes I. J. K and L (Genetic effects of radiation. Non-stochastic effects of irradiation. Radiation-induced life shortening, and Biological effects of radiation in combination with other physical. chemical and biological agents, respectively).
15. The fundamental quantitative assumption describing the interaction of radiation with matter is that the relevant measure of the interaction is the mean energy deposited per unit mass. This energy deposition can result from all types of radiation and the quantity used to measure it is the absorbed dose, D, defined by
[I9J as D = :! where dE is the mean energy imparted
by ionizing radiation to matter of mass dm.
16. It soon becomes apparent that the biological effects do not depend solely on the energy deposition per unit mass, or absorbed dose, but also on other factors, notably the type of radiation. The additional factor needed to relate the observed effects to the
46
absorbed dose is known as the relative biological effectiveness (RBE). This is the ratio of the absorbed dose of the radiation being studied needed to produce a specified biological effect to the absorbed dose of the reference radiation which produces the same number of the sam.e effect. This reference radiation is usually penetratmg x- or gamma-radiation. The RBE depends on the radiation type, the energy and all the circumstances of radiation delivery, which should be quoted. The RBE is thus obtained experimentally. If the doseresponse relationship is linear with no 1hreshold. the probability of occurrence of a given biological effect after exposure lo radiation may be obtained from the absorbed dose multiplied by the RBE appropriate to the circumstances of the irradiation. As the RBE is a relative number, any change in the observed number of effects of a given type produced by a given absorbed dose of !he reference radiation will cause a change in the R B,E for that effect for all other radiation types .. If the dose-response relationship for either radiation is non-linear. or if there is a threshold dose below which effects do not occur. a single value of RBE cannot be used as a weighting factor for biological response.
17. For many purposes there is a need for a well defined quantitative relationship between the radiation dose and the presumed number of resultant biological effects. The RBE is an experimentally determined quantity, and the best estimate of it for any particular radiation will change from time to time as better data are obtained. The amount of data on which RBE can be determined is limited and no functional relationships with dose are established. In radiological protection proportionality between absorbed dose and effect has been assumed for small values of absorbed dose and dose rates for all radiation types and energies. Given this assumption, the ICRP has defined the quantity dose equivalent, H, which is intended to indicate for radiation protection purposes the biological implications of the radiation exposure at the low levels of absorbed dose encountered. H is defined by H = DQN, where Q is the quality factor and N is the product of all other modifying factors specified by the ICRP. For the present the ICRP has assigned a value of unity to N. The quality factor is defined as a function of the collision stopping power for radiation at the point of interest, increasing from 1 for collision stopping powers of less than 3.5 keV µm-1 to 20 at collision stopping powers exceeding 175 keV µm-1. When the precise distribution of collision stopping powers throughout the mass of interest is unknown or unimportant because the values of dose equivalent are small, it is permissible for radiation protection purposes to use approximate values of the quality factor related to the various types of primary radiation. The ICRP has recommended the following approximate values of Q for both external and internal radiation:
x rays, gamma rays and electrons 1 Neutrons and protons of unknown
energy 10 a-particles and other multiply charged
particles of unknown energy 20
These values of Q and hence values of H are intended only for use at levels of exposure within or near dose equivalent limits as defined by the ICRP. The values are independent of the effect. the organ or tissue exposed or other variables. For the general purposes of comparison between sources and assessment of individual dose equivalent levels, these approximate values are appropriate for use by the Committee for most radiation types. However, since they may not be
appropriate for other purposes, the Committee is presenting its basic data in terms of absorbed dose. For some special cases, such as the assessment of dose equivalents from cosmic radiation. the Committee has used other values of quality factors based on specific calculations.
18. It is assumed in the dosimetric model that the probability of occurrence of a stochastic effect in a particular organ or tissue is proportional to the mean dose equivalent in the organ or tissue. The constant of proportionality differs for the various organs or tissues of the body. If the dose equivalents are sensibly uniform for all organs or tissues of the body, then a single overall risk factor can be used to describe the probability of induction of health effects for the individual. Assessments and comparisons can then be made solely on the basis of the dose equivalent to the whole body. However, if different organs or tissues are irradiated to different dose equivalent levels, then a further procedure is necessary to evaluate the overall probability.
19. The ICRP has recommended a system which allows for the different probabilities of mortality associated with the same dose equivalent delivered to different organs or tissues and the probability of hereditary effects in the first two generations. Th~ system uses the effective dose equivalent: Herr = T WT HT where WT is a weighting factor representing the proportion of the probability of stochastic effects resulting from irradiation of organ or tissue T to the probability when the whole body is irradiated uniformly and HT is the mean dose equivalent in organ or tissue T.
20. The values of reference risk coefficients and corresponding weighting factors recommended by the ICRP [I2] are shown in Table 3. They are averaged over age and sex and are therefore considered by the Commission to be appropriate for protection of individuals of all ages and both sexes. The value for gonads includes an allowance for serious hereditary effects expressed in the first two generations (i.e .. the children and grandchildren of a pair of individuals). Numerically equivalent reference risk coefficients per unit collective dose equivalent can also be used to assess the expected number of the same health effects in populations.
21. The effective dose equivalent therefore is an indicator of the probability of occurrence of a health effect, which is either death from somatic effects or the induction of serious hereditary effects in the first two generations, assumed to result from any irradiation, whether uniform or non-uniform, from both external and internal sources. The effective dose equivalent does not include hereditary effects in generations after the first two, nor any allowance for non-fatal somatic effects such as in most cases of thyroid or skin cancer: to this extent it will underestimate the overall probability of induction of all health effects. Where appropriate, therefore. the dose equivalents in the tissues of interest can be used directly to give an indication of the likely incidence of non-fatal tumours. The risk coefficients to be used to give the probability of induction of non-fatal tumours, which exclude the probability of induction of fatal tumours in the same organ or tissues, are 0.15 10-2 Sv-1 for breast, and 10-2 Sv-t for both thyroid and skin [U9]. The figures for the latter are a sufficient approximation whether the fatal tumours are included or not.
22. It is possible to define different sets of weighting factors which include some or all of these additional health effects or which deal separately with each health effect [CJ]. For the present the Committee has decided to carry out comparisons in terms of the quantities defined in this chapter.
A. INDIVIDUAL-RELATED ASSESSMENTS
1. External irradiation
23. The primary assessment of radiation exposure of individuals should be carried out in terms of absorbed dose. Conceptually, the assessment of the distribution of absorbed doses in body tissues from external irradiation requires knowledge of the energy and angular distribution of the nuence rate of each component of the electromagnetic and charged particle radiation field. These differential distributions can be obtained by spectrometric measurements, but in general only calculated values, for known source distributions, are available. In practice most assessments of absorbed doses from external irradiation are based on simpler measurements.
24. Most measurements describe the field in the absence of an exposed person in "receptor-free" conditions. The absorbed dose rate in air Da is used to describe environmental exposure situations resulting from gamma-emitting nuclides, and it is unambiguously specified if full secondary electron equilibrium exists in air. From the environmental quantity, the absorbed dose in the human organ or tissue of interest can be assessed. This inv.olves a number of assumptions about factors which affect the results of depth dose calculations and about the periods of time during which the person is exposed to the various radiation fields. The latter factor is discussed further in section Y.A.
25. When the receptor is located in the region of interest, the assessment of absorbed doses in tissues based on absorbed dose in air involves knowledge of the following parameters: the mass energy absorption, the depth transmission, the backscatter and the degree of isotropy. The mass energy absorption factor is the ratio of the mass energy absorption coefficients for tissue and for air. A value of 1.10 was used in Annex A of the 1977 report [Ul] and is retained in this report. The other factors are to some extent interrelated. Backscattered radiation may increase the dose rate at the surface, but the body will also act as a shield and reduce the dose rate to deeper tissues. The overall effect will depend on the location of the tissue of interest. and the energy and angular distribution of the radiation.
26. Except for the rare case where the radiation field is monodirectional and the irradiated person is not moving, the apparent depth of an organ or tissue is determined from the weighted average absorption through the body that would be experienced by rays entering from different directions. The difference between monodirectional and isotropic fields will also be expressed in terms of a difference in absorbed dose rate at any depth for fields which produce the same absorbed dose rate in air under receptor-free conditions. The ratio of the absorbed dose rates cannot exceed 2 for points near the surface of the body, and it approaches 1 near the centre of the body. These problems have been discussed in detail by Kramer [K3] and by Kramer and Drexler [K4. K5] who have applied a Monte-Carlo method 10 a mathematical represen-
47
tation of ICRP Reference Man [16] to calculate conversion ratios for a range of tissues, photon energies and irradiation geometries.
27. In Annex A of the 1977 report [Ul], the Committee has adopted a value of 0.82, which includes all the factors mentioned, for the ratio between the absorbed dose rate in the body and the absorbed dose rate in air outdoors [Ul, U2] based on the work of lknnctt [BI] and a value of 0.69 indoors based on Spiers and Overton [SI]. A value of about 0.7 Sv Gy-1 has :1lso been derived as the quotient of effective dose equivalent to absorbed dose in air [N1] based on calculations for clouds of gamma emitters of about t MeV [C 1, Pl ]. This is compatible with the values derived by Kramer and Drexler [K4]. The values for individual organs are more sensitive to energy and to the field characteristics: for example, the ratio of absorbed dose in gonads to absorbed dose in air is about 0.6 for a semi-infinite cloud [Cl, Pl], 0.7 for an isotropic field (01, 02, Sl] and 0.8 for a normal field [B1, Jt]. It now appears that the most appropriate average value of the quotient of effective dose equivalent rate to absorbed dose rate in air for males and females for use in this report is 0.7 Sv Gy-1 for environmental exposures to gamma rays. For medical exposures, specific conversion factors are discussed in Annex G (Medical exposures).
28. Another quantity which can be used to describe receptor-free conditions is the absorbed dose index, D1. This has been defined by ICRU [19] as the maximum absorbed dose that can occur in a 30-cm diameter tissue equivalent sphere located with its centre at the point of interest. This quantity is used, for example, to describe irradiation due to cosmic radiation. It is assumed that the absorbed dose index represents, sufficiently well, the absorbed dose in tissue at the location of interest.
2. Internal irradiation
29. For internal irradiation, the mean absorbed doses in the organs or tissues of interest of a given individual may be estimated from one or more of the following:
(a) Measurements of activity concentrations in the environment and in diet components, leading to estimates of the intake and, by use of appropriate metabolic models, to estimates of the uptake and residence time of the radionuclide in the organs or tissues of interest;
(b) Assessments of the activity concentrations in the relevant organs or tissues, by measurement of the radiation emitted from the body or of the activity concentration in tissue sam pies;
(c) Measurements of the activity concentrations in excreta or exhaled air leading, by the use of appropriate metabolic models, to estimates of the activity concentration in the relevant organs or tissues of the body.
30. The use of this information to calculate absorbed doses in organs or tissues requires models to describe the transfer of radionuclides between tissues and their eventual elimination from the body as a function of time. It is also necessary, given the radionuclide distribution between the various tissues as a function of time, to have further models to calculate the dose rate in any tissue of interest from the activity in any tissue, including the tissue of interest. The general concept of the mean absorbed dose per unit of time integrated
48
activity is that used by MIRO [Ll, 82], by ICRP (14] and by ICRU [110].
31. The general equation for absorbed dose calculations from internally deposited radionuelides is
12
D (Yq) = LL I Ak(t) dt E; <l>; (Yq -Vk) (I) k i 11
where D(V q) is the mean absorbed dose in a target volume Yq; Ak(t) is the activity of the radionuclide considered in source tissue, k, as a function of time. E; is the mean energy emitted per unit of time integral of activity through ionizing particles of type, i; <l>;(V q-Vk) is the specific absorbed fraction, i.e., for the type of radiation i, the energy imparted to a target volume Yq from a source volume Vk divided by the energy emitted by soUI;ce volume Vk and the mass of the target volume. It should be noted that, for the general calculation. the biological parameters are assumed to be independent of age.
32. Usually approximations to obtain the activity in an organ or tissue as a function of time A(t) are made; the most common is a sum of exponential terms:
A (t) = LA (m) exp (- (i. + Ab [ml) t) (2) m
where A(m) is the value of the mth exponential component at time t = O; i. is the physical decay constant of the radionuclide; 4(m) is the biological elimination rate constant for the mth exponential component.
33. The function A(t) is sometimes determined empirically from retention measurements; it can also be derived from compartment models in which the activity contents of the compartments are described in terms of rate constants for transfers between compartments and in terms of input functions. These methods are used for example by ICRP in calculating the integrated activities in body tissues following ingestion or inhalation of material [14, I 11].
34. For some radionuclides such as 3H or 14c which are continuously produced naturally or which have been uniformly distributed in the environment after release it is possible to use a simplified procedure based on the assumption that the activity concentration of the nuclide in tissue is constant. Activity concentration in tissue may also be assumed, under many circumstances, to be equal to the activity concentration in an appropriate environmental material such as water. Under these circumstances the formulation given in equation (1) can be replaced by a time independent expression using constant quotients to relate the absorbed dose rate in any organ or tissue directly to the activity concentration in that organ or tissue. This procedure is used for these radionuclides in Annex B (Exposures to natural radiation sources) and in Annex E (Exposures resulting from nuclear explosions).
35. In general, the Committee has not found it necessary to calculate directly the matrices of values of A(t) and <I>i which are needed for assessment of absorbed doses in tissues. The absorbed dose rate in an organ or tissue is related as shown above to the activity concentrations in all organs or tissues in the body. This absorbed dose rate may be integrated over various
times for various purposes. An integration time of 50 years has been used by ICRP (12) to derive the committed dose equivalent Hso. This is relevant in the control of internal doses to workers as the annual dose equivalent at the end of the period at work. taken to be 50 years. cannot exceed the maximum annual committed dose equivalent. Detailed tabulations of the committed dose equivalent per unit activity intake of all radionuclides of interest to the Committee have been published by ICRP [14, 111).
36. Jn calculating the dose equivalent from intakes by populations. the Committee requires an appropriate average relationship. The relationships will be different for infants, young children and adults because of differences in metabolism and dosimetry. Nonetheless, when developing an appropriate average, it is necessary to recognize that most individuals in a population will be adults or older children for whom adult values are a very close approximation. Since a population contains individuals of all ages, the appropriate time over which to integrate the dose equivalent following an intake is the average remaining life expectancy which is just under 50 years. In the same way. for continuing intakes by an average individual with an anticipated lifetime of 70 to 80 years the appropriate integration time will decrease from 70 to 80 years for intakes in infancy and early childhood to a few years for intakes in the last years of life; again the appropriate average over a lifetime is less than 50 years. The Committee therefore considers it appropriate for populations in both situations to use the conveniently tabulated ICRP values of committed dose equivalent per unit activity intake based on a 50-year integration period. The dose equivalent commitment from intakes by a population can then be obtained from the infinite time integral of the rate of activity intake by an average individual in the population multiplied by the committed dose equivalent per unit activity intake.
37. As indicated earlier, the Committee feels it is reasonable to use the dose equivalent for comparison purposes, modifying the absorbed dose by the appropriate quality factor. For individuals the effective dose equivalent is also regarded as a reasonable approximation, implying use of further modifying factors as needed. These modifications will be made in some cases at a late stage in the calculations; in other cases it is more orderly to carry the modifications out at an early stage. In the latter cases it will be reasonable to use tabulations of effective dose equivalent per unit of activity intake such as those produced by ICRP [14) or by Adams [Al], together with such additional calculations as may be needed for specific purposes; similar procedures have been carried out in Annex G (Medical exposures).
38. There are special problems connected with the dosimetric models for certain radionuclides which are dealt with in detail in the appropriate Annexes. An example is the dosimetry of radon and its daughters for the activity concentrations of which a special quantity, Cpot, has been defined as the potential alpha energy concentration in air of any combination of the shortlived radon daughters. This particular quantity is defined to allow for situations where the daughters are not in equilibrium. It can of course be expressed in units of J m-3, but use is still made of the empirically determined unit, the working level, WL, which corresponds to a potential alpha energy concentration of 1.3 1Q5 MeV per litre of air. Further problems concerning the dosimetry of radon and a discussion of the more
complex models of the lung which have been developed mainly for use in the dosimetry of radon are covered in Annex D (Exposures to radon and thoron and their decay products).
39. In previous reports of the Committee, for absorbed dose rate assessments from maintained activity concentrations in the body, calculations have been carried out using a similar procedure to that underlying the formulation in equation (1 ). The details of these calculations, given in Annex B (Natural sources of radiation) of the 1977 report [Ul], will not be repeated here. It should be noted that certain of the parameters used in the calculations and aspects of the models differed from those used by ICRP in the most recent reports on this subject [14, 111 ], although the principles are the same. In its previous reports, the Committee has estimated, on the basis of measurements, the average activity intakes of radionuclides and the average activity concentrations of these radionuclides in tissue. On the other hand. lCRP (14} provides a series of models which give the dose equivalent in tissue per unit intake of activity of a radionuclide as a function of the aerosol size and of the chemical forms of the radionuclide considered. Another part of the series of models enables the dose equivalent rate in tissue to be calculated per unit activity concentration in tissue.
40. The major differences between the ICRP and the Committee occurred in the calculation of dose equivalent in bone tissues. Both the Committee and ICRP calculated dose equivalents in the same tissues, namely red bone marrow and bone lining cells in a 10-µm layer on the surface. For the purposes of the calculations, radionuclides were considered to be either uniformly distributed throughout each bone tissue or distributed on the bone surface. The difference between the calculational methods used by the Committee and ICRP stemmed mainly from which components of bone were considered to be source regions. A comparison of the two methods is outlined in Table 4 for a-emitters from which it can be seen that the Committee generally calculated in its 1977 report [Ul] the dose equivalent in the target region from activity in trabecular bone and red bone marrow based on the treatment of Spiers [S14]. whereas ICRP ignored activity in red bone marrow but included activity in cortical bone in the calculation of dose in bone lining cells [14). A further difference was that the coefficient used by the Committee in assessing the dose equivalent from activity in trabecular bone was in most cases a function of energy. However, this only led to differences in that component of the calculation of a factor of from 0.5 to 2 for a-energies from 4 to 8 MeV. The differences resulting from inclusion of the other source regions depend on the radionuclide under consideration and the relative distribution of activity between the bone tissues.
41. In all cases the calculational methods used by the Committee in 1977 gave higher estimates than ICRP of dose equivalent in red bone marrow from a given activity concentration of an a-emitter. This difference was generally about a factor of 2, for example the ratio of the results of the Committee to ICRP dose equivalent calculation for the nuclides in the 23KU and 232Th series varied from 1.1 to 3. For bone lining cells the ICRP method gives the average dose equivalent in cells on trabecular and cortical bone. whereas the earlier Committee method obtained the dose equivalent only in cells on trabecular bone surfaces, but included the
49
effect of red bone marrow as a source region. In this case either calculation may give the higher result, depending on the distribution of activity between the bone tissues. For example, the Committee model gave close equivalents higher than ICRP by factors from 1.1 to 1.7 for the nuclides in the 232Th series and dose equivalents lower than ICRP by factors of from 0.7 to 0.9 for the nuclides in the 238U series (with the exception of HOTh for which the factor is 1.7).
42. In this report, the Committee has modified its previous treatment to include the source regions used by ICRP and the red bone marrow, as shown in Table 4. The doses to the bone tissues are then calculated using the ICRP conversion factors. The only difference arises from the calculation by the Committee of the contribution due to the activity present in red bone marrow; for most radionuclides, that contribution to the total dose in bone tissues is very small.
43. Another aspect of the comparison between the treatments used by the Committee and by ICRP occurs when assessments of doses are based on estimates of intake and transfer through the body of radionuclides, rather than on measured activity concentrations in tissues. In general, the Committee has based its assessments of doses from naturally-occurring radionuclides and of doses arising from atmospheric weapons testing on measurements of activity concentrations in tissues. However, in assessing dose equivalents from radionuclides released from nuclear power establishments, this is not usually possible. Thus calculations are based on assessed intakes and make use of ICRP methods. Further differences are introduced between these two situations which can be traced to the additional assumptions needed about the transfer of activity from lung or through the gut wall and on its subsequent distribution in tissues. These differences depend on the radionuclide under consideration and on its physical and chemical form; they are thus specific to the circumstances considered.
44. The results of individual-related assessments may be expressed as the risk to an average individual. This risk is the probability of occurrence of a health effect and may be obtained using the appropriate reference risk coefficients from Table 3 if the organ or tissue dose equivalents are known. Otherwise the probability of induction of a fatal tumour or an hereditary effect in the first two generations is obtained by applying the overall reference risk coefficient of 1.65 10-2 Sv-1 to the effective dose equivalent.
B. SOURCE-RELATED ASSESSMENTS
45. Although, as explained in paragraph 13, for source-related assessments the emphasis is on the expected number of radiation-induced effects rather than on the probability of effects for each individual, nonetheless the basic information will still be expressed in terms of average absorbed doses in the organs and tissues of the individuals making up the irradiated population. For reasons expressed in paragraph 17, the Committee finds it reasonable to modify the absorbed dose by means of the quality factor and thus to give the irradiation in terms of dose equivalent.
46. As discussed in the Introduction to this Annex (paragraph 2), there is considerable uncertainty in the dose-response relationship for radiation-induced tumours. This matter has recently been reviewed in
50
detail [N4]. Although accepting the uncertainty, the Committee nevertheless needs quantities which can be used to derive the number of radiation-induced health effects which may be expected from radiation sources that give a wide range of doses in large mqnbers of people. For intercomparisons it would be too cumbersome to deal always with the distribution of absorbed doses or dose equivalents in the irradiated populations. The Committee has therefore decided to express this summation in terms of collective quantities which arc weighted sums of the absorbed doses in each irradiated individual. Implicit in most uses of these collective quantities is the assumption that the doseresponse relationships are linear for additional doses which are not large in comparison with pre-existing doses for irradiation of any tissue with radiation of any type.
47. Tile collective dose equivalent rate, S. is defined as the integral of the product of the dose equivalent rate resulting from the source and the number of individuals in the exposed population receiving that dose equivalent. It is defined by S = f H N (H) dH where N (H) dH is the number of individuals receiving a dose equivalent rate between H and H + dH. The integral expression can often be approximated in practice by a summation over population subgroups receiving dose equivalent rates that can be sensibly averaged.
48. The collective dose equivalent rate can be integrated as a function of time. The integration may be continued to infinity. The quantity resulting has been called the collective dose equivalent commitment from the source, st defined by: S~ = fo' St (t) dt. This is always related to a specific source, k. It is also often useful to present the pattern of accumulation of the collective dose equivalent commitment with time. This pattern may be presented graphically or by giving stages in the integration. It is also possible to define a truncated or incomplete integral in which the integration is terminated at time,-, The main purpose of truncation is to derive the maximum future dose equivalent rate from a practice which is assumed to continue for a time period ,-.
49. Average or per caput quantities can be defined by dividing the collective quantity by the population size such that
H (t) = s <t> N (t)
(3)
where H (t) is the per caput dose equivalent rate and :"J(t) is the population size at time t. It may be more convenient under some circumstances to evaluate per caput quantities rather than collective quantities. The dose equivalent commitment, He, is delined as the infinite time integral of the per caput dose equivalent rate.
50. These average quant1t1es are sometimes used to refer to individuals in the per caput sense. Insofar as these are not real individuals and the dose equivalents are usually assessed on the basis of the effect of a particular source, it is considered that these are more properly treated as source-related quantities. The quantity related to a source, k, will be the dose equivalent commitment Ht There is however one instance in which information on individuals can be derived. This is because the annual dose equivalent to an average individual in the future from one year of release of a radionuclide into the environment does not exceed the
dose equivalent commitment resulting from that release. Thus a calculation of the dose equivalent commitment per unit practice enables at least a rough estimate to be made of the maximum future annual average dose equivalent per unit practice.
51. Where the collective effective dose equivalent is used for populations, care must be taken that the circumstances of the irradiation arc not such that the omission of certain portions of the total health effects can lead to a substantially erroneous estimate of the expected number of health effects. This can occur, for example. if the irradiation were confined to specific organs such as skin or thyroid and it is felt that the total incidence of malignancies is relevant, even though the majority will not prove fatal. As stated earlier, the effective dose equivalent as defined by ICRP does not take into account hereditary effects after the first two generations, nor does it include non-fatal somatic effects. Although these omissions may not be sufficiently serious to affect the general level of probability of occurrence of a health effect for an individual. when considering irradiation of populations in a sourcerelated manner, it seems to the Committee necessary to give further consideration to these effects. Clearly the various effects are not of equivalent importance; attempts have been made to assess the relative importance of each type of health effect with respect to the others [15]. However, the Committee has decided not to attempt such analyses now but to separate and compare the somatic and hereditary health effects in populations. This requires the assignment of the appropriate sets of weighting factors for the irradiation of particular organs or tissues in a manner analogous to those used in the definition of effective dose equivalent. The Committee has chosen to follow the format of its earlier definition of genetically significant dose equivalent for consistency with earlier reports.
52. The genetically significant dose equivalent. GSD, is defined as the per caput gonad dose equivalent which. if given uniformly to the irradiated population, would result in the same number of hereditary effects as those from the actual distribution of dose equivalents in the population. It is thus the gonad dose equivalent distribution modified by those factors which affect the outcome, namely the age and sex distribution of the irradiated population. The formal definition is
LL H1,s N1.s Vs
GSD = -1-'-=,----L Ns vs s
(4)
where N1,s is the number of people of age/sex class s, irradiated within dose equivalent band I to an average gonad dose equivalent level of H1,s: v5 is the expected number of children for an individual of age/sex class s; N 5 is the number of people of age/sex class s.
53. From the above definition, the information needed to compute the GSD is the distribution of gonad dose equivalent in the population as a function of age and sex. This information. together with the child expectancy as a function of age and sex which is readily available in most countries, can be obtained by observation or by statistical methods. It is therefore practically possible in a large number of cases to carry through the computation of GSD based on the formal definition. The total number of hereditary effects is then obtained by multiplying the GSD by the population size and the appropriate collective risk
coefficient. taken as 0.8 10-2 (man Sv)-1, to include effects in all subsequent generations.
54. By analogy with the GSD. it is possible to define a somatically significant dose equivalent, SSD. This is the per caput whole-body dose equivalent which, if given uniformly to the irradiated population, would result in the same number of fatal tumours as those from the actual distribution of dose equivalents in the tissues of the irradiated population. The formal definition is
LLI: H1.s,T N1,s Ws,T SSD = -'1'---'sc...,,;·1,,..· -=-----
L L Ns w,. T s T
(5)
where N1,s is the number of people of age/sex class s, whose tissue. T. is irradiated within a dose equivalent band I to an average tissue dose equivalent level of H1.s,T; Ws,T is the number of fatal tumours per unit dose equivalent for irradiation of tissue T in a subgroup of age/sex class s; Ns is the number of people of age/sex class s. Although the total number of fatal tumours predicted will be the same for the SSD as for the actual distribution of dose equivalent, the tissues in which they are predicted and the type of tumour will not necessarily be the same.
55. The information needed to compute the SSD includes the distribution of dose equivalents in the tissues of the population as a function of age and sex, which together with the incidence of fatal tumours for irradiation of a particular tissue at a particular age for each sex, is in principle obtainable by observation or by statistical methods. This incidence should include allowance for the induction rate of tumours which may vary with age and sex. together with a further allowance for the expression of the effect which will also depend on age and sex, taking into account the latent period of the effect. This information is not in general available at present in the detail required for computation of SSD based on the formal definition.
56. An approximation to SSD can be made using weighting factors for the incidence of somatic effects which are averaged over the age and sex distribution of a normal population. This approximation is so close to the definition of effective dose equivalent derived by ICRP that it does not seem useful to derive a separate set of weighting factors. The per caput effective dose equivalent, although containing a genetic component, may be taken as a reasonable approximation to the SSD, using the weighting factors in Table 3. The total number of health effects (fatal tumours and genetic effects in the first two generations) is then obtained by multiplying by the population size and by the appropriate collective risk coefficient. taken as 1.65 10-2 (man Sv)-1 (12].
III. ENVIRONMENT AL MODELS
A. GENERAL
57. If it is possible to measure the absorbed dose rate in air from radionuclides in the air or deposited on the ground at a sufficient number of places and O\'er a sufficient time, then the absorbed doses to individuals and populations from external radiation can be assessed without the need for environmental transfer
51
models to describe the manner in which the airborne contamination or deposition resulted from the source of radionuclides. Similarly, if the activity concentrations in organs or tissues of the radionuclides concerned can be measured in a sufficient number of people, the absorbed doses from incorporated radionuclides can be assessed using only dosimetric models and without the need for environmental transfer models. In many situations, especially for naturallyoccurring radionuclides and for those produced from nuclear explosions, such measurements have been carried out in sufficient numbers, in different places and over long enough periods of time to enable the Committee to estimate doses directly from them.
58. Slightly less direct estimates of internal doses can be made from measurements of activity concentrations of radionuclides in the air or in foodstuffs. In this case the additional inform<1tion required is of the intake rates of the radionuclides from air or from the foodstuff concerned and the appropriate dosimetric models to calculate the absorbed doses in organs and tissues following intake. These less direct methods are used for some radionuclides from nuclear explosions, often to supplement a more limited measurement programme on people. They are also used in assessing absorbed doses to critical groups of the population exposed as a result of deliberate releases of radionuclides from nuclear installations, for a limited number of radionuc· )ides. A difficulty in placing too much reliance on such measurements is that there has to be a great deal of preliminary effort to ensure that the foodstuff being monitored is the only, or the major, route of intake of the radionuclide concerned. When dealing with a mixed diet and a large number of radionuclides this becomes extremely laborious. For radionuclides which are not evenly distributed in the environment, it is not a feasible method to establish the collective dose.
59. Sometimes direct measurements may not be practicable. This may be due to technical difficulties in measuring the activity concentration of the radionuclide concerned in an appropriate medium, or to the difficulty of obtaining samples, or to the number of radionuclides and pathways being too large. Direct measurements may also be impracticable because predictions of dose rates are required, for example to derive collective dose commitments, whereas measurements have to be carried out after or during the delivery of the dose. In these cases models are required in order to derive doses and dose distributions from data on the quant1t1es of radionuclides released into the environment and the rates of release. The relationship will depend on other factors such as the conditions of the release, the physicochemical form of the radionuclide, whether the release is into the atmosphere, a water body or the ground and the characteristics of the receiving environment. In general, the environmental models with which the Committee is concerned are simplified mathematical representations of actual transfer processes. Some of those processes are well understood and can be described reasonably precisely by mathematical models which are based upon detailed measurements. The transfer of fallout radionuclides such as 90Sr through food chains is an example. Other processes may be only partially known and the time scales or other aspects may render the models very difficult to check directly by measurement, as in the case of the long-term stability of sorption of actinides on soils or sediment particles. It is not the intention to review all types of transfer models but to concentrate on those used by the Committee in this report.
52
60. The type of mo<:lel used depends on the information required, on the characteristics of the radionuclide concerned and on its mode of introduction into the environment. Of particular importance is whether the radionuclide can be considered as uniformly distributed and whether the activity concentration is approximately constant with time. If both these conditions are satisfied, as they are for certain naturally-occurring radionuclides. then the simplest form of environmental model is adequate to assess the collective absorbed dose rate in the world population. This model relates directly the assumed activity concentration in body organs or tissues with the measured activity concentration in a suitable environmental medium, such as the circulating waters of the hemisphere or the air of the troposphere. It is often referred to as a "specific activity model". If the activity concentrations in the environment result from continuous production, as for natural tritium and 14C, ai,1 empirical relationship can be developed between the production rate and the activity concentrations. Very simple models of this type are used in Annex B (Exposures to natural radiation sources) for assessment of collective absorbed dose rates from natural radionuclides and in Annex E (Exposures resulting from nuclear explosions) for the same radionuclides which are widely distributed as a result of production in the atmosphere by nuclear explosions. The results of such models are compared with more complex time varying environmental models for appropriate radionuclides in Annex F (Exposures resulting from nuclear power production).
61. The information required by the Committee in the past has varied but has generally been directed towards assessment of the dose commitment, particularly in the treatment of the doses from fallout of debris from nuclear explosions in the atmosphere. The Committee developed a procedure for dealing with these calculations which was based on the idea of time-independent transfer coefficients [U2, U3]. These transfer coefficients have been defined in Annex A (Concepts and quantities in the assessment of human exposures) of the 1977 report [Ul] in terms of the quotients of the infinite time integral of the appropriate quantity in compartment n of a sequence to the infinite time integral of the appropriate quantity in the preceding compartment m. For example:
Pmn = },, Cn (t) dt / _l Cm (t) dt (6)
where Pmn is the transfer coefficient from compartment m (diet) to compartment n (bone); Cm(t) and C0 (t) are the appropriate activity concentrations in diet and bone. respectively, at time t. The models were developed in a form which was appropriate to the results required and are used again in Annex E (Exposures resulting from nuclear explosions).
62. These transfer models are examples of the type of model in which the chain of events is represented by a series of compartments and the transfer processes occur between compartments: these will be called "compartment models". In some cases the compartments have some physical attribute such as representing a given volume of water but this is not an essential requirement of the technique. Other examples of such models are food chain models and some oceanic models. Some compartment models are better suited to predicting time-independent results although many give dynamic results.
63. A simple example of a compartment model is one which has been used to estimate the global dispersion of 85Kr introduced into the northern hemisphere [NI]. Two compartments are assumed. corresponding to the tropospheres of the northern and southern hemispheres. Exchange takes place between the two compartments with a transfer coefficient in each direction of 0.5 a-1. Input is into the northern hemisphere compartment which is assumed to be instantaneously uniformly mixed: the results arc expressed in terms of the activity concentration in air as a function of time after the start of a continuous input. The transfer of material between the compartments is described by a set of two equations
dXN Ao, N k k , dt = v;; - NS XN + 0
SN Xs - 11.XN
(7)
where Ao,N is the rate of input of activity of the radionuclide into the northern hemisphere compartment; VN is the volume of the northern hemisphere compartment; XN and xs are the instantaneous activity concentrations of the radionuclides in air at time t after the start of the input; A is the physical decay constant: k:,,is is the transfer coefficient from the northern to the southern hemisphere compartment; and ksN is the reverse transfer coefficient between the two compartments.
64. The general solution of compartment models of this type depends on the assumption that the transfer rate of materials between compartments is proportional to the inventory of material in the source compartment and that the rate is governed by a transfer coefficient specific to the two compartments being considered. These relationships can be expressed by the sets of equations
dAm ,l!., -d- = 2..., knm An -
t n - I
which apply for two or more compartments; where Am.An are the instantaneous activities in compartments m.n at time t; kmn is the transfer coefficient from compartment m to n; Am is an effective transfer coefficient out of the system from compartment m which is used to describe loss of material, e.g., by radioactive decay or transfer to a stable sink; Ao,m is the rate of input of activity into compartment m; and p is the total number of compartments connected directly to m. These equations can be solved analytically for simple systems or numerically for larger systems.
65. Another type of model is that in which an attempt is made to represent the physics of a real transfer process. Examples of such models are diffusion and advection models in the seas. sediment transfer models in rivers, and trajectory models for airborne dispersion. Although these models are often used to produce results for an eventual equilibrium situation, many of them are inherently capable of producing time-varying outputs.
66. In general the model used should be the simplest type which will produce the required answer and is appropriate to the radionuclide, its mode of release and
its environmental behaviour. For natural radionuclides in equilibrium in the environment, where the answer required is the collective absorbed dose rate, then the specific activity model is adequate. For mixtures of artificial radionuclides released to atmosphere and water from nuclear installations, answers are required on maximum absorbed doses to individuals resulting from the combination of all the radionuclides via all the pathways, together with collective absorbed dose rates in different groups of the population and integration of these collective dose rates over both space and time. In that case quite complex models may be needed which are capable of accepting time-varying inputs and giving dose distributions as a function of space and time. It is requirements such as this and the need to predict results well into the future which have led to the recent development of more complex and comprehensive models.
67. In principle all models are based on experimental observa"tions and should be subject to experimental verification, if not of the model form at least of the parameter values. The conclusions of a workshop on the evaluation of models [HI] are that complex models may, because of the descriptive detail incorporated. be accepted as being more realistic and thus more defensible than simpler models. However, without adequate validation, there is no assurance that the predictions of these complex models are any closer to the real situation than those produced by simpler ones.
68. Since the purpose of models is to provide a simulation of reality and the real environment may be conveniently separated into sectors, the various types of models appropriate to each sector of the environment will be described together. In each case the models used by the Committee are described. The sectors of the environment considered are the atmosphere, the land and the waters. These are not isolated because, for example, a discharge into the atmosphere will, for many radionuclides, lead to an eventual input to both other sectors.
69. A problem in reviewing models is the large number of computer programmes in use. A survey by Hoffman et al. in 1977 [H2] identified 83 programmes for the assessment of accidental or routine releases of radionuclides to the environment from nuclear power facilities. Most of the programmes appear to have been developed in relative isolation and only in recent years have there been compilations which attempt to take into account all sectors of the environment. Examples of such compilations are the United States Nuclear Regulatory Commission guides [U4. US. U6] which are very formal sets of general equations; the models used in the Federal Republic of Germany [F1]; and the comprehensive reports by Killough and McKay [Kl] and by the National Radiological Protection Board of the United Kingdom in cooperation with the Commissariat a l'Energie Atomique of France [NI).
B. UNCERTAINTY OF PREDICTIONS FROM MODELS
70. All models are based on knowledge of the real systems being simulated and where possible use data determined empirically. The reliance to be placed on the predictions emerging from models depends on the knowledge of the system and the reliability of data used. Both of these aspects are felt by the Committee to be reasonably satisfactory for modelling of radionuclide behaviour. It is because these models for the
53
transport of radionuclides in the environment are developed more fully than those for other potential contaminants that it is possible to try to determine the uncertainty in their predictions. In simple situations direct verification of model predictions may be possible. but in many cases this will only be practicable for some portions of the model output and for some of the radionuclides being studied. Under these circumstances two techniques are available to investigate the variability of the results. These techniques consist of changing the form of model used and evaluating the differences in predicted results; or varying the input data over a range and evaluating the resultant changes in the prediction. The first technique can only be employed for particular problems where alternative ways of describing the situation can be found; it is not described further here. The second technique can and should be applied to all predictive models and has been insufficiently utilized up to now. This can be used to establish the inherent uncertainty in a prediction based on the model using the empirically determined ranges of input data and to identify those portions of the input data for which variations have the largest effect on the prediction and which therefore should be studied further if there is a need to reduce the overall uncertainty.
71. A particular method of carrying out sensitivity analyses of this type has been developed as part of a general assessment of models [H8, H9, M3, S12]. This technique can be applied to simple multiplicative chain models such as those used by the United States Nuclear Regulatory Commission [U4] and relies on the observation that the central part of the distribution of observed values for many environmental variables follows a log-normal form. In this case the log-normal statistics can be simply propagated through the model [S13]. The results of such studies cannot usually be expressed in a simple form; in general they indicate the probability that actual values will exceed the predictions based on a particular set of data [H9]. The most common method. and the simplest, of carrying out sensitivity analysis is to change the value of one input variable while holding all others constant [HlO]. This procedure will not, however, give a complete range of variation in the output from the entire model and requires a very large number of individual calculations for complex models. Methods have been suggested for carrying out analyses in which several variables are changed together; see for example the suggestions by McKay and Bruckner [M4], which rely on some method of sampling output while changing all input variables simultaneously. The results from all such studies are useful in assessing the overall reliability of the model system predictions in comparison with direct observations.
72. In order to assess the collective dose equivalent rate as a function of time after the initiating event it is necessary to make a number of assumptions. Some of these assumptions are of parameters which are predictable with more or less precision depending on the present state of knowledge; an example is the long-term behaviour of radionuclides in the environment. Other assumptions are in principle unknowable and unpredictable as they depend on the presence and on the habits of human populations in the future; examples of such assumptions are population distributions and the uses made of flora and fauna as foodstuffs. Accordingly. the uncertainty of predictive calculations of collective dose equivalent rates in future populations will increase with the length of the time over which the predictions are made.
54
73. A further source of uncertainty is the relationship between the calculated collective dose rate in the future and the number and severity of health effects presumed to result. It is unlikely that the state of medical knowledge will remain constant and future populations may well have the ability to prevent or at least cure radiation-induced tumours which now prove fatal. This comment may also apply to radiation-induced hereditary effects. For these reasons predictions over tens, hundreds or even thousands of years may be useful guides as to the consequences of present actions but predictions over hundreds of thousands or millions of years are of very little use, except possibly by sensitivity analysis to indicate the range of potential consequences.
74. Although there has been no systematic effort to assess the accuracy of the models used by the Committee. some aspects of certain models have been studiei For example, the atmospheric dispersion model has been assessed by comparison with observed ground level concentrations after releases from elevated sources [C2]. The emphasis was on the accuracy of the prediction of mean values and it was concluded that typically the ratio of the standard deviation of concentrations about the mean, for a given dispersion category, to the overall mean lies in the range of 0.5 to 0.7. The larger ratio refers to conditions dominated by convection and the smaller one to conditions dominated by mechanical turbulence. It was concluded that the most likely error in calculations of the overall mean would come from an incorrect choice of wind speed and stability conditions. Under these circumstances a simple measure of the likely spread in results could be obtained by carrying out calculations for adjacent categories.
75. The models used for assessment of contamination from nuclear explosions are firmly based on observed data and have largely been derived through successive approximations to measurements obtained over a period of decades. These models therefore can be expected to give good predictions of the results of such contamination. There will sometimes be substantial uncertainties in the models for aspects of the environmental transport, especially close to the source, but if these local aspects make only a small contribution to the collective dose commitment the overall prediction will still be reliable. A similar comment applies to globally dispersed radionuclides from nuclear power such as 85Kr.
76. The dietary transfer models described in chapter V are more difficult to verify, are more variable in time and space and have a more tenuous link with direct measurements. Sensitivity analyses of these models are being carried out but are not yet available. Some comparisons of portions of the model with observed values have been reported, for example the comparison of the predictions of the soil migration model with measurements of the migration of single deposits of plutonium in various soils [N 1 ]. The results of this limited comparison showed agreement within a factor of two.
77. The models used for aquatic dispersion are all very much simplified even for restricted systems such as rivers. The general tendency of physical processes in aquatic systems is towards the well mixed average concentration. which is the same tendency as exhibited by the models. The major departures are in the processes which tend to perturb this situation and parti-
cularly affect the radionuclide transfer to man, such as sorption onto sediments or bioconcentration.
78. There has been a tendency to accept the values generated by complex modelling techniques uncritically and ascribe more accuracy to the predictions than is justified. This is now being challenged and the Committee recommends that wherever possible some suitable technique should be used to assess the overall uncertainty associated with predicted results from all types of models and that this uncertainty be reported together with the prediction.
IV. ATMOSPHERIC TRANSPORT MODELS
79. The transport of radioactive material released into the atmosphere is controlled by the normal atmospheric mixing processes. If the material is in the form of large particles which fall rapidly under gravity then most will settle close to the production point: small particles will move with the air masses, as will gases. The major mixing and transport processes which arc incorporated into mathematical models are diffusion and advection. These large-scale mixing processes give rise to the distribution in the atmosphere of naturally-occurring cosmogenic radionuclides and of radionuclides released by atmospheric nuclear explosions. They are described briefly in Annex E (Exposures resulting from nuclear explosions).
80. For releases from positions near ground level models have been developed using two main approaches: trajectory tracing. in which discrete releases arc followed along the wind direction; and statistical models, in which the activity concentration in the airborne plume containing the radionuclides released is described as a function of distance in the direction of the wind. While the trajectory models such as those in which successive very short duration releases are individually traced through a time-varying wind velocity field [H3. S3] are capable of treating complex situations and even operating in real time, the main concern of the Committee is with the relatively Jong-term average results of routine releases to the atmosphere. For these calculations the statistical models are adequate. As the plume containing the radionuclides travels downwind, the population will be exposed to direct radiation from the plume and to intake of radionuclides by inhalation. For radioactive materials other than gases both wet and dry deposition processes will result in radionuclides being deposited on the ground and on vegetation. These deposited radionuclides will cause external irradiation, enter food and drinking water supplies and become resuspended to cause a further airborne hazard. Comprehensive models need to take account of all these routes, which are described in chapter V.
A. MODELS FOR LOCAL AND REGIONAL TRANSPORT FROM A DEFINED POINT OF RELEASE
81. There are some circumstances in which it is necessary to assess the local transport of radionuclides released into the atmosphere from a defined point. This occurs in particular when dealing with releases from known nuclear sites such as reactors or reprocessing plants of which there are only a small number.
82. It is sometimes possible to derive an empirical relationship between the average or integrated activity concentration in air at particular locations and the discharge rates or total discharges in a given time of radionuclides. These relationships are sometimes referred to as empirically determined dispersion coefficients and arc used for some well-characterized nuclear sites. This procedure is used, for example. in deriving doses to local populations around the Pickering reactor in Canada. referred to in Annex F (Exposures resulting from nuclear power production).
83. The dispersion of materials released into the atmosphere is controlled by atmospheric diffusion, a process that depends on the state of the atmospheric turbulence over any area and at the relevant time. It has been found useful in practice to develop empirically based turbulence classification schemes using easily observed quantities for characterization such as cloud cover, wind speed and insolation. The most widely used systems are based on the one proposed by Pasquill [P2, P3] in which seven weather categories, A to G, are defined in order of increasing atmospheric stability, as shown in Table 5. Category A represents the most unstable conditions, B and C Jess unstable. D neutral, E and F stable. and G very stable. Rainfall is only considered possible in categories C and D. The results of the dispersion calculations described later in this section are normally generated for a series of release heights, for each stability category and for the situations C + rain and D + rain. These results are then combined in the appropriate frequencies observed at the place of interest. Many other methods for determining the category or defining stability categories have been proposed and are in use: these are reviewed. for example, by Gifford [Gl] and by Hoffman [Hl].
84. The most useful and commonly used statistical model is the Gaussian plume equation initially proposed by Sutton [S4]. This is based on an analytical solution of the diffusion equation under the assumptions of constant wind speed and direction, no wind shear, flat topography and Fickian diffusion. The basic equation in a generalized form, taking into account the reflection from the ground. can be expressed as [Nl]:
Xa (x, y, z) = _ exp --, Ao (-y2) 2nay cr2 v 2cry
[ - (z - h)2 - (z + h)2]
exp 2
+ exp 2 2cr 2 2cr 2
(9)
for the activity concentration corresponding to a given release rate; the integrated activity concentration from a release is obtained by substituting ia for Xa and Ao for Ao in equation (9), where Xa(x,y,z) and ia(x,y.z) are the activity concentration and the time integrated activity concentration per unit volume of air at the point (x,y,z): ay and O"z are the standard deviations of the plume horizontally and vertically; Ao is the activity released: v is the average wind velocity at 10 m above the ground: h is the effective height of release; x is the downwind distance; and z is the height above the ground of the sampling position. The origin of the co-ordinate system is at ground level beneath the discharge point. In the derivation of equation (9) it is assumed that diffusion in the x-direction can be ignored compared with transport
55
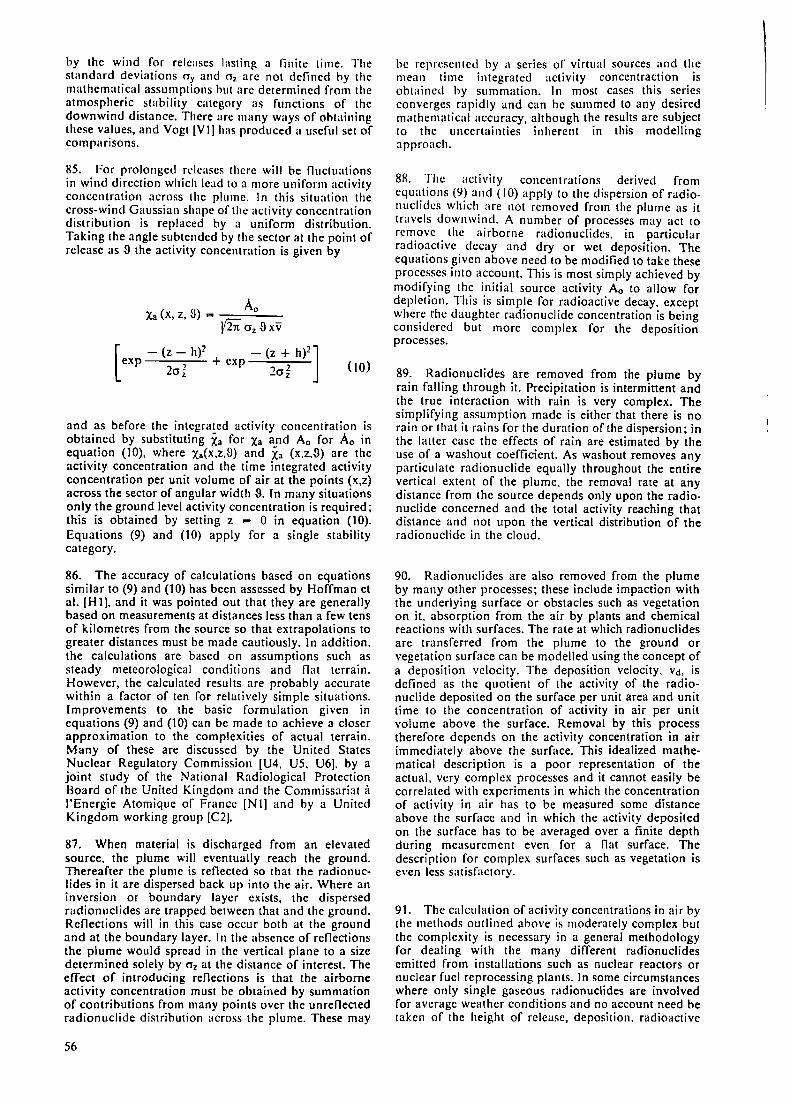
by the wind for releases lasting a finite time. The standard deviations CTy and o, arc not defined by the mathematical assumptions hut arc determined from the atmospheric stability category as runctions or the downwind distance. There arc many ways or obtaining these values, and Vogt [VI] has produced a useful set or comparisons.
85. For prolonged releases there will be nuctuations in wind direction which lead to a more uniform activity concentration across the plume. In this situation the cross-wind Gaussian shape of the activity concentration distribution is replaced by a uniform distribution. Taking the angle subtended by the sector at the point of release as 3 the activity concentration is given by
Ao Xa (x, z, S) = ----
l'2n Oz 3xv
[ - (z - h)2
- (z + h)2]
exp , + exp 2 2crz 2crz (10)
and as before the integrated act1v1ty concentration is obtained by substituting Xa for Xa and A0 for Ao in equation (10), where Xa(x,z,B) and Xa (x.zA)) are the activity concentration and the time integrated activity concentration per unit volume of air at the points (x,z) across the sector of angular width 3. In many situations only the ground level activity concentration is required; this is obtained by setting z = 0 in equation (10). Equations (9) and (10) apply for a single stability category.
86. The accuracy of calculations based on equations similar to (9) and (10) has been assessed by Hoffman et al. [Hl), and it was pointed out that they are generally based on measurements at distances less than a few tens of kilometres from the source so that extrapolations to greater distances must be made cautiously. In addition. the calculations are based on assumptions such as steady meteorological conditions and Oat terrain. However, the calculated results are probably accurate within a factor of ten for relatively simple situations. Improvements to the basic formulation given in equations (9) and (10) can be made to achieve a closer approximation to the complexities of actual terrain. Many of these are discussed by the United States Nuclear Regulatory Commission [U4. U5, U6]. by a joint study of the National Radiological Protection Board of the United Kingdom and the Commissariat a I'Energie Atomique of France [Nl] and by a United Kingdom working group [C2).
87. When material is discharged from an elevated source. the plume will eventually reach the ground. Thereafter the plume is reflected so that the radionuclides in it are dispersed back up into the air. Where an inversion or boundary layer exists, the dispersed radionuclides are trapped between that and the ground. Renections will in this case occur both at the ground and at the boundary layer. In the absence of renections the plume would spread in the vertical plane to a size determined solely by a, at the distance of interest. The effect of introducing reflections is that the airborne activity concentration must be obtained by summation of contributions from many points over the unreflected radionuclide distribution across the plume. These may
56
be repre~ented by a series of virtual sources and the mean t11nc integrated activity concentraction is obtained hy summation. In most cases this series converges rapidly and can be summed to any desired mathematical accuracy, although the results are subject to the uncertainties inherent in this modelling approach.
88. The act1v1ty concentrations derived from equations (9) and (10) apply to the dispersion of radionuclidcs which are not removed from the plume as it tr.ivels downwind. A number of processes may act to remove the airborne radionuclides, in particular radioactive decay and dry or wet deposition. The equations given above need to be modified to take these processes into account. This is most simply achieved by modifying the initial source activity Ao to allow for depletion. This is simple for radioactive decay, except where the daughter radionuclide concentration is being considered but more complex for the deposition processes.
89. Radionuclides are removed from the plume by rain falling through it. Precipitation is intermittent and the true interaction with rain is very complex. The simplifying assumption made is either that there is no rain or that it rains for the duration of the dispersion; in the latter case the effects of rain are estimated by the use of a washout coefficient. As washout removes any particulate radionuclide equally throughout the entire vertical extent of the plume, the removal rate at any distance from the source depends only upon the radionuclide concerned and the total activity reaching that distance and not upon the vertical distribution of the radionuclide in the cloud.
90. Radionuclides are also removed from the plume by many other processes; these include impaction with the underlying surface or obstacles such as vegetation on it, absorption from the air by plants and chemical reactions with surfaces. The rate at which radionuclides are transferred from the plume to the ground or vegetation surface can be modelled using the concept of a deposition velocity. The deposition velocity, Vd, is defined as the quotient of the activity of the radionuclide deposited on the surface per unit area and unit time to the concentration of activity in air per unit volume above the surface. Removal by this process therefore depends on the activity concentration in air immediately above the surface. This idealized mathematical description is a poor representation of the actual. very complex processes and it cannot easily be correlated with experiments in which the concentration of activity in air has to be measured some distance above the surface and in which the activity deposited on the surface has to be averaged over a finite depth during measurement even for a flat surface. The description for complex surfaces such as vegetation is even less satisfactory.
91. The calculation of activity concentrations in air by the methods outlined above is moderately complex but the complexity is necessary in a general methodology for dealing with the many different radionuclides emitted from installations such as nuclear reactors or nuclear fuel reprocessing plants. In some circumstances where only single gaseous radionuclides are involved for average weather conditions and no account need be taken of the height of release, deposition. radioactive
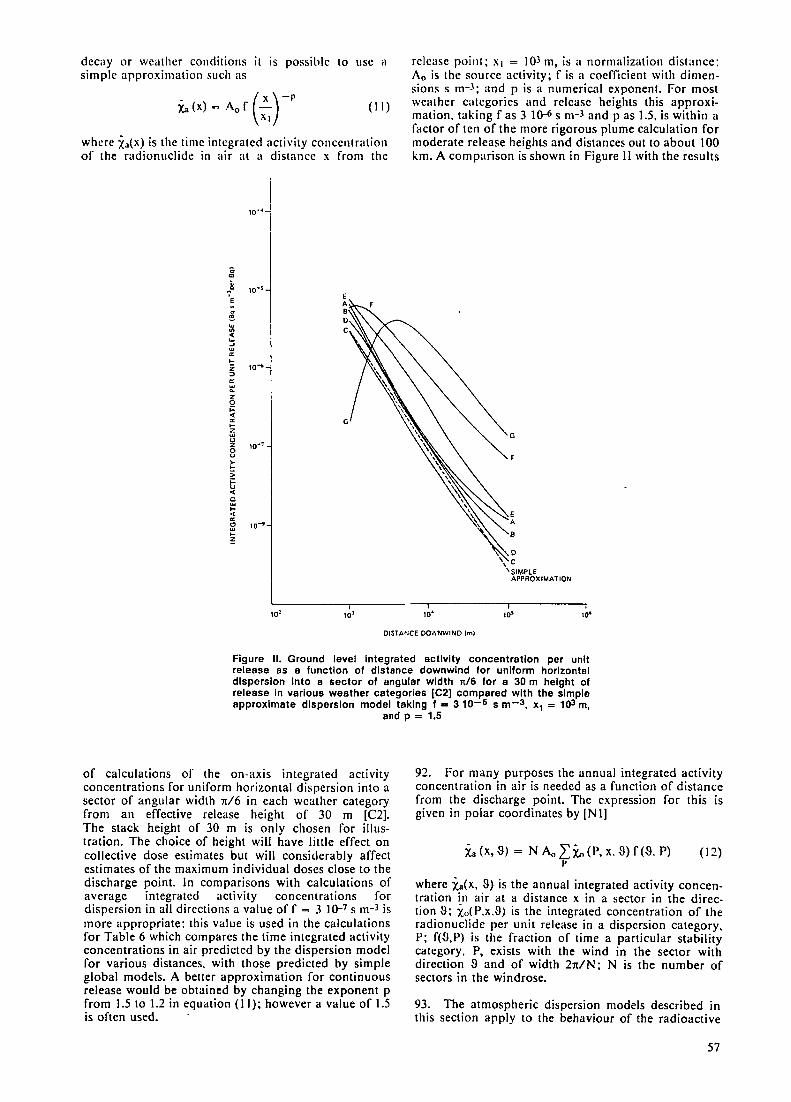
decay or weather conditions it is possible to use a simple approximation such as
(
X )-p Xa (x) = A0 f ~ (II)
where Xa(X) is the time integrated activity concentration or the radionuclide in air at a distance x from the
.; .,
l- 10-• E
E A
" B ~ 0 w ., :-5 ~ a: .. z 10-,. :, a: w ... z 0
~ a: .. z w u ,o-1 z 0 u > .. > t; <(
0 w .. <( a:
10 ... " w .. !,
10' 101
release point; x1 = 103 m, is a normalization distance; A0 is the source activity: f is a coerlicient with dimensions s m-3; and p is a numerical exponent. For most weather categories and release heights this approx imation. taking fas 3 1()-6 s m-3 and pas 1.5, is within a factor of ten of the more rigorous plume calculation for moderate release heights and distances out to about 100 km. A comparison is shown in Figure II with the results
G
F
10' 10•
DISTANCE OO'MffllNO 1ml
Figure II. Ground level Integrated activity concentration per unit release as a function of distance downwind for uniform horizontal dispersion Into a sector of angular width n/6 for a 30 m height of release In various weather categories [C2] compared with the simple approximate dispersion model taking f .. 3 10-6 s m-3, x1 = 103 m,
and p = 1.5
of calculations of the on-axis integrated act1V1ty concentrations for uniform horizontal dispersion into a sector of angular width n/6 in each weather category from an effective release height of 30 m [C2]. The stack height of 30 m is only chosen for illustration. The choice of height will have little effect on collective dose estimates but will considerably affect estimates of the maximum individual doses close to the discharge point. In comparisons with calculations of average integrated activity concentrations for dispersion in all directions a value off = 3 I 0-7 s m-3 is more appropriate: this value is used in the calculations for Table 6 which compares the time integrated activity concentrations in air predicted by the dispersion model for various distances. with those predicted by simple global models. A better approximation for continuous release would be obtained by changing the exponent p from 1.5 to 1.2 in equation (11); however a value of 1.5 is often used.
92. For many purposes the annual integrated activity concentration in air is needed as a function of distance from the discharge point. The expression for this is given in polar coordinates by [Nl]
ia (x, ~J) = N Ao _LX,, {P, x. S) f(3. P) (12) p
where Xu(x. 3) is the annual integrated activity concentration in air at a distance x in a sector in the direction 9; Xo(P.x,9) is the integrated concentration of the radionuclide per unit release in a dispersion category, P: f(-9,P) is the fraction of time a particular stability category, P, exists with the wind in the sector with direction 3 and of width 2n/N; N is the number of sectors in the windrose.
93. The atmospheric dispersion models described in this section apply to the behaviour of the radioactive
57
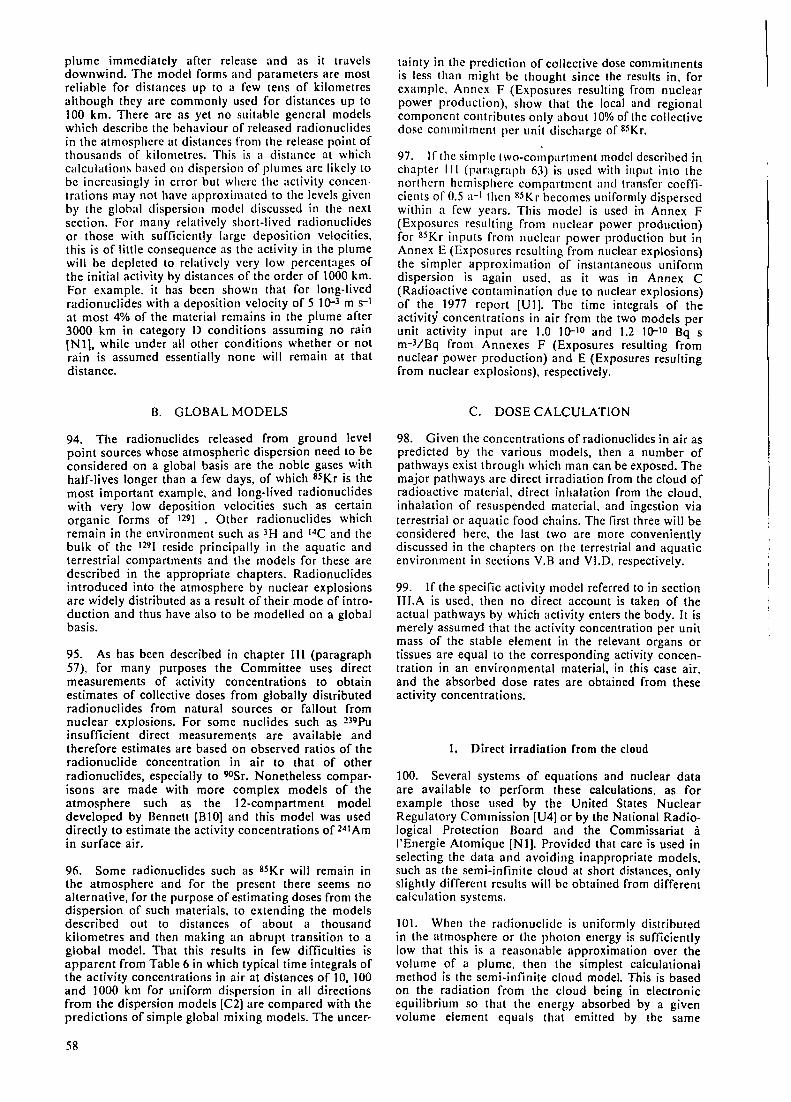
plume immediately after release and as it travels downwind. The model forms and parameters arc most reliable for distances up to a few tens of kilometres although they are commonly used for distances up to 100 km. There are as yet no suitable general models which describe the behaviour of released radionuclidcs in the atmosphere at distances from the release point of thousands of kilometres. This is a distance at which calculations based on dispersion of plumes are likely to be increasingly in error but where the activity concentrations may not have approximated to the levels given by the global dispersion model discussed in the next section. For many relatively short-lived radionuclides or those with sufficiently large deposition velocities, this is of little consequence as the activity in the plume will be depleted to relatively very low percentages of the initial activity by distances of the order of 1000 km. For example. it has been shown that for long-lived radionuclides with a deposition velocity of 5 10-3 m s-1
at most 4% of the material remains in the plume after 3000 km in category D conditions assuming no rain LNl], while under all other conditions whether or not rain is assumed essentially none will remain at that distance.
B. GLOBAL MODELS
94. The radionuclides released from ground level point sources whose atmospheric dispersion need to be considered on a global basis are the noble gases with half-lives longer than a few days, of which 85Kr is the most important example, and long-lived radionuclides with very low deposition velocities such as certain organic forms of 129) . Other radionuclides which remain in the environment such as 3H and 14C and the bulk of the 1291 reside principally in the aquatic and terrestrial compartments and the models for these are described in the appropriate chapters. Radionuclides introduced into the atmosphere by nuclear explosions are widely distributed as a result of their mode of introduction and thus have also to be modelled on a global basis.
95. As has been described in chapter III (paragraph 57). for many purposes the Committee uses direct measurements of activity concentrations to obtain estimates of collective doses from globally distributed radionuclides from natural sources or fallout from nuclear explosions. For some nuclides such as 239Pu insufficient direct measurements are available and therefore estimates are based on observed ratios of the radionuclide concentration in air to that of other radionuclides, especially to 90Sr. Nonetheless comparisons are made with more complex models of the atmosphere such as the 12-compartment model developed by Bennett [810] and this model was used directly to estimate the activity concentrations of 241Am in surface air.
96. Some radionuclides such as 85Kr will remain in the atmosphere and for the present there seems no alternative, for the purpose of estimating doses from the dispersion of such materials, to extending the models described out to distances of about a thousand kilometres and then making an abrnpt transition to a global model. That this results in few difficulties is apparent from Table 6 in which typical time integrals of the activity concentrations in air at distances of I 0, 100 and 1000 km for uniform dispersion in all directions from the dispersion models [C2] are compared with the predictions of simple global mixing models. The uncer-
58
tainty in the prediction of collective dose commitments is less than might be thought since the results in, for example. Annex F (Exposures resulting from nuclear power production), show that the local and regional component contributes only about I 0% of the collective dose commitment per unit discharge of 85Kr.
97. If the simple two-compartment model described in chapter III (paragraph 63) is used with input into the northern hemisphere compartment and transfer coefficients of 0.5 a-I then H5Kr becomes uniformly dispersed within a few years. This model is used in Annex F (Exposures resulting from nuclear power production) for 85Kr inputs from nuclear power production but in Annex E (Exposures resulting from nuclear explosions) the simpler approximation of instantaneous uniform dispersion is again used, as it was in Annex C (Radioactive contamination due to nuclear explosions) of the 1977 report [Ul]. The time integrals of the activity concentrations in air from the two models per unit activity input are 1.0 10-10 and 1.2 10-10 Bq s m-3/Bq from Annexes F (Exposures resulting from nuclear power production) and E (Exposures resulting from nuclear explosions), respectively.
C. DOSE CALCULATION
98. Given the concentrations of radionuclides in air as predicted by the various models, then a number of pathways exist through which man can be exposed. The major pathways are direct irradiation from the cloud of radioactive material, direct inhalation from the cloud, inhalation of resuspended material, and ingestion via terrestrial or aquatic food chains. The first three will be considered here, the last two are more conveniently discussed in the chapters on the terrestrial and aquatic environment in sections V.B and VI.D, respectively.
99. If the specific activity model referred to in section III.A is used, then no direct account is taken of the actual pathways by which activity enters the body. It is merely assumed that the activity concentration per unit mass of the stable element in the relevant organs or tissues are equal to the corresponding activity concentration in an environmental material, in this case air. and the absorbed dose rates are obtained from these activity concentrations.
1. Direct irradiation from the cloud
100. Several systems of equations and nuclear data are available to perform these calculations. as for example those used by the United States Nuclear Regulatory Commission [U4] or by the National Radiological Protection Board and the Commissariat a l'Energie Atomique [Nl]. Provided that care is used in selecting the data and avoiding inappropriate models, such as the semi-infinite cloud at short distances, only slightly different results will be obtained from different calculation systems.
101. When the radionuclide is uniformly distributed in the atmosphere or the photon energy is sufficiently low that this is a reasonable approximation over the volume of a plume, then the simplest calculational method is the semi-infinite cloud model. This is based on the radiation from the cloud being in electronic equilibrium so that the energy absorbed by a given volume element equals that emitted by the same
element. For a point located at ground level only half the space contributes to the dose, so that the energy absorbed is divided by two. The absorbed dose rate in air is then given by
(13)
where Da is the absorbed dose rate in air~ Xa is the average value of activity concentration of the radionuclide in the cloud; Pa is the mass density of air; F; is the fraction of photons of initial energy E; emitted per disintegration; and k is a conversion coefficient from energy deposition per unit mass and unit time to absorbed dose rate, which although strictly not needed if the energy is expressed in joules, is sometimes given as Gy h-l(MeV kg-1 s--1)-1. A modified version of this model is used for beta irradiation of the skin.
102. If the distribution of the activity concentration in the plume is sufficiently non-uniform to invalidate the above approach, then a finite cloud model must be used. This involves simulating the cloud by a number of small volume sources and integrating over these sources. The calculation proceeds by finding the photon flux density, scattered and unscattered, for a particular decay energy, summing over all the decay energies for the radionuclide of interest and then carrying out a conversion to absorbed dose. The basic expression for the photon fluence due to the fraction F; of photons of energy E; emitted per disintegration is [N1]
$;= d ~ Xv F; Ben (E;, µ;x) exp (-µ;x) V
4nx2 (14)
\"
where$; is the photon fluence; Xv is the concentration of the atoms of each radionuclide in volume element dV; µ; is the linear attenuation coefficient; x is the distance from the volume element dV; B00(E;,µ;x) is the energy absorption build-up factor at a distance, x, for a radiation of initial energy, E;, having an attenuation coefficient, µ;. The integration is carried out over all space. The integral is evaluated numerically, the calculations in Annex F (Exposures resulting from nuclear power production) being based on the computer code developed by Jones [J3).
103. The conversion from absorbed dose in air to dose equivalent in tissue has already been discussed in general terms in section II.A.1. When the absorbed dose in air is the result of a calculation such as described in this section, then there are sufficient data on the photon energy spectrum to use more precise conversions. These conversion coefficients have been derived for adults [Nl] from the work of Poston and Snyder [Pl] based on a semi-infinite cloud model and are given in Table 7. Similar conversion coefficients for electrons emitted by the radionuclides of interest have been derived assuming an inert layer thickness on the surface of the body of 70 µm and are given in Table 8. The imprecise nature of the estimation of the dose in skin from electrons must be stressed. This imprecision arises from theoretical difficulties associated with the estimation of electron absorption in the epidermis and also from practical considerations such as absorption by clothing or nearby objects [Nl].
2. Direct inhalation from the cloud
104. Calculation of doses from direct inhalation from the cloud only depend upon data concerning the integrated activity concentration in air over the period of exposure, the breathing rate and the committed absorbed dose per unit activity inhaled. The first depends on the circumstances (i.e., whether the exposure is to an isolated plume or to an annual average concentration) and is assessed as described earlier in this chapter. The breathing rates chosen by the Committee are normally taken to be similar to those specified by the ICRP [16]; for example. a mean adult breathing rate B of 20 ml d-1 is taken in Annex F (Exposures resulting from nuclear power production). The committed absorbed dose per unit activity inhaled is generally obtained from the tabulations given by ICRP [14. 111].
105. A 'very simple model is used in Annex C (Technologically modified exposures to natural radiation) to estimate the contribution of the inhalation pathways to the collective dose commitments resulting from the atmospheric release of a given radionuclide. The relationship between the activity Ao associated with the release of the radionuclide concerned and the collective dose commitment M~ in organ or tissue q is given by the expression
(15)
where AolvdS is the integrated activity concentration of the radionuclide in ground level air, obtained simply as the activity released divided by the area of the deposition region S and by the deposition velocity vd; SON is the population affected, which is the product of the area of the deposition region S and of the population density ON. The areal dependence is removed by the product of the quantities A0 /vdS and SON; B is the individual adult breathing rate: Dq/l;h is the committed absorbed dose in organ or tissue q per unit activity inhaled.
3. Direct inhalation from resuspended material
106. The resuspension of materials from surfaces depends on many conditions such as the physical characteristics of the surface, the age of the deposit. the strength of the wind and other disturbances. For a given radionuclide, the real relationship between the activity concentration in air per unit volume and the activity per unit surface area is extremely complex and many models of varying degree of complexity have been proposed. The simplest of them is the model implicit in the use of the ··resuspension factor" which is defined as the quotient of the resuspended activity concentration in air per unit volume to the activity per unit area in the surface layer. If this factor is taken as a constant, it implies a time-independent relationship between those two quantities irrespective of the other parameters referred to earlier or that the model is only valid at one specific time; it further implies that the concentration of activity in air results only from the activity on the surface in the immediate neighbourhood. The problems involved in using this model have been reviewed by Linsley [L2].
59
107. As the deposited material weathers, it becomes more closely associated with the soil and the activity concentration profile gradually extends down into the soil. Only the top layers of soil are available to be resuspended and the net effect is that the activity concentration in air from resuspension falls off with time following a given deposition event. Such behaviour can be represented mathematically by a time-dependent resuspension factor, which then has to be defined in terms of the instantaneous values of the relevant quantities. This approach has been used with some success [A2, U7] in models which assume different initial resuspension factors in the range from 104 to 1 o--6 m-1, but all converge to a value of the order of 10-S to 10-9 m-t for times longer than about 20 years after deposition. Healy [H4] has suggested that the activity concentration in air declines at a slower rate and to a lesser extent than the previously cited models would imply, but this suggestion appears to be based on very conservative interpretations of the observed results. Comparison of models with observations is complicated by inconsistency of those reporting data in assessing the depth of soil over which the contamination is averaged and which is assumed to be available for resuspension.
108. The Committee has decided that the most appropriate model at present is a time-dependent resuspension factor and has applied this in Annex F (Exposures resulting from nuclear power production). The value of the resuspension factor immediately after deposition is uncertain and will depend on the precise conditions of the land surface, whether it is desert or pasture, wet or dry, etc.; a value intermediate in the reported range of 10-s m-1 is adopted. This initial resuspension factor is assumed to decline exponentially over about 2 years to a value typical of an aged deposit of 10-9 m-1. Direct observations of the time dependence of resuspension factors are limited to about a 20-year period after deposition and therefore any estimates of the subsequent behaviour must be tentative. Nonetheless it seems likely that there will be some further decline in availability and a second exponential decrease with a half-life of about 100 years is assumed. The resuspension model is therefore given by
K(t) = K1 exp [- 0,1 + 11.2 + 11.) tf + + K2 exp [- (11.2 + 11.) t] (16)
where K(t) is the resuspension factor defined as the quotient of the activity concentration in air to the activity concentration in the top 1 cm of soil at time t; Kt and K2 are the initial and intermediate values of the resuspension factors taken as 1 o-s and 10-9 m-t. respectively; J..1 and 1i.2 are the decay constants for the initial and longer term decline in the resuspension factor; A is the physical decay constant of the radionuclide of interest. The values taken for 11.1 and 11.2 are 1.46 10-7 s-t (4.6 a-1) and 2.2 10-10 s-1 (0.007 a-1), respectively. More complex models have been developed which take into account such factors as the size of the contaminated area, the surface roughness and the wind speed [ HS, H6]. At present, however, they can only be applied if there is site-specific information while no generally applicable model taking account of such factors is yet available.
109. Another simple approach to the modelling of resuspension is to assume that particulates in air and surface soil contain the same proportion of the contaminant. Then, given a knowledge of the average parti-
60
culate content of the air and the specific a~tivity of the surface soil, the concentration of activity per unit mass or volume of air can be derived [A2, U8]. The main problem with this model is the assumption that the contaminant and the soil are resuspended equally. This is almost certainly untrue for fresh deposits and even for aged deposits requires empirical correction factors [U8]. However, for material which is uniformly mixed in the surface soil, such as long-lived naturallyoccurring radionuclides, these problems do not arise, therefore the model is used in Annex B (Exposures to natural radiation sources) for natural radionuclides such as uranium. The particulate content of air is taken as 50 µg m-3; this is a representative global value for ground level air and corresponds to a resuspension factor of about 3 10-9 m-t. There may, however, be some enrichment of the activity concentration of certain radionuclides in resuspended material; this should be taken into account if it is found to occur. Subsequent calculations of doses are carried out as in section IV.C.2 for direct inhalation from the cloud.
4. Population distribution models
110. To calculate the distribution of individual doses from radionuclides dispersed in the air it is necessary to know or to assume the population density as a function of position or distance from the source. If the distribution of individual doses is not needed, and only the collective dose is required without any indication of its distribution among the exposed population then it may be calculated directly from the total deposition, assuming some fraction of it is inhaled or ingested by the total exposed population. The simplest assumption which can be made of the population distribution is that it is uniform and a population density of 100 km-2 has been taken for some purposes in Annex C (Technologically modified exposures to natural radiation).
111. Population distribution weighting has also been used to modify the physical distribution of radionuclides in calculating dose commitments from fallout. This procedure was described by the Committee [U2] and consists of weighting the integrated deposit of a radionuclide in a latitude band by the percentage of the world population in that latitude band. The population distribution is given in Table 9 and is used in Annex E (Exposures resulting from nuclear explosions). The resultant has been referred to as the populationweighted deposition of the radionuclide.
112. For calculations of local and regional doses. particularly if they are to yield the numbers of people receiving doses within given ranges as well as the collective dose, the population distributions may need to be fairly detailed as are those taken in Annex F (Exposures resulting from nuclear power production) around some model sites. Two examples are shown in Table 10 for the distribution around a model reactor site and a model uranium mining and milling site. The total population out to 2000 km is in each case about 2.5 108 but the average population density up to 100 km is only 3 km-2 for the mining site compared with 300 km-2 for the reactor site. The average population density out to 2000 km is 20 km-2 for both sites. Another example of this type of data generation is the placing of the population distribution of the countries of the European Community into a computer programme on an approximate 10 km square grid, using census data [N 1 ).
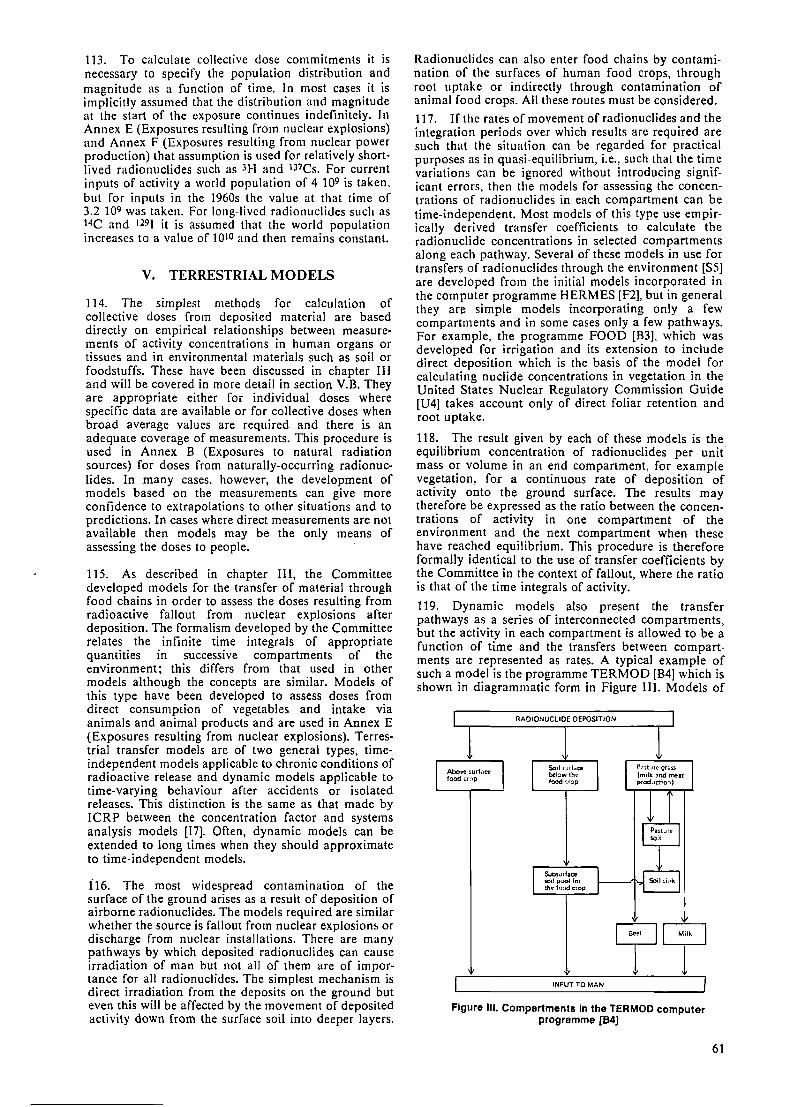
113. To calculate collective dose commitments it is necessary to specify the population distribution and magnitude as a function of time. In most cases it is implicitly assumed that the distribution and magnitude at the start of the exposure continues indefinitely. In Annex E (Exposures resulting from nuclear explosions) and Annex F (Exposures resulting from nuclear power production) that assumption is used for relatively shortJived radionuclides such as 3H and 137Cs. For current inputs of activity a world population of 4 109 is taken, but for inputs in the 1960s the value at that time of 3.2 109 was taken. For long-lived radionuclides such as 14C and 1291 it is assumed that the world population increases to a value of 1010 and then remains constant.
V. TERRESTRIALMODELS
114. The simplest methods for calculation of collective doses from deposited material are based directly on empirical relationships between measurements of activity concentrations in human organs or tissues and in environmental materials such as soil or foodstuffs. These have been discussed in chapter I II and will be covered in more detail in section V.B. They are appropriate either for individual doses where specific data are available or for collective doses when broad average values are required and there is an adequate coverage of measurements. This procedure is used in Annex B (Exposures to natural radiation sources) for doses from naturally-occurring radionuclides. In many cases, however, the development of models based on the measurements can give more confidence to extrapolations to other situations and to predictions. In cases where direct measurements are not available then models may be the only means of assessing the doses to people.
115. As described in chapter III, the Committee developed models for the transfer of material through food chains in order to assess the doses resulting from radioactive fallout from nuclear explosions after deposition. The formalism developed by the Committee relates the infinite time integrals of appropriate quantities in successive compartments of the environment; this differs from that used in other models although the concepts are similar. Models of this type have been developed to assess doses from direct consumption of vegetables and intake via animals and animal products and are used in Annex E (Exposures resulting from nuclear explosions). Terrestrial transfer models are of two general types, timeindependent models applicable to chronic conditions of radioactive release and dynamic models applicable to time-varying behaviour after accidents or isolated releases. This distinction is the same as that made by ICRP between the concentration factor and systems analysis models [17]. Often, dynamic models can be extended to long times when they should approximate to time-independent models.
i16. The most widespread contamination of the surface of the ground arises as a result of deposition of airborne radionuclides. The models required are similar whether the source is fallout from nuclear explosions or discharge from nuclear installations. There are many pathways by which deposited radionuclides can cause irradiation of man but not alJ of them are of importance for all radionuclides. The simplest mechanism is direct irradiation from the deposits on the ground but even this will be affected by the movement of deposited activity down from the surface soil into deeper layers.
Radionuclides can also enter food chains by contamination of the surfaces of human food crops, through root uptake or indirectly through contamination of animal food crops. All these routes must be considered.
117. If the rates of movement of radionuclides and the integration periods over which results are required are such that the situation can be regarded for practical purposes as in quasi-equilibrium. i.e., such that the time variations can be ignored without introducing significant errors, then the models for assessing the concentrations of radionuclides in each compartment can be time-independent. Most models of this type use empirically derived transfer coefficients to calculate the radionuclide concentrations in selected compartments along each pathway. Several of these models in use for transfers of radionuclides through the environment [S5] are developed from the initial models incorporated in the computer programme HERMES [F2], but in general they are simple models incorporating only a few compartments and in some cases only a few pathways. For example, the programme FOOD [83], which was developed for irrigation and its extension to include direct deposition which is the basis of the model for calculating nuclide concentrations in vegetation in the United States Nuclear Regulatory Commission Guide [U4] takes account only of direct foliar retention and root uptake.
118. The result given by each of these models is the equilibrium concentration of radionuclides per unit mass or volume in an end compartment, for example vegetation, for a continuous rate of deposition of activity onto the ground surface. The results may therefore be expressed as the ratio between the concentrations of activity in one compartment of the environment and the next compartment when these have reached equilibrium. This procedure is therefore formally identical to the use of transfer coefficients by the Committee in the context of fallout, where the ratio is that of the time integrals of activity.
119. Dynamic models also present the transfer pathways as a series of interconnected compartments, but the activity in each compartment is allowed to be a function of time and the transfers between compartments are represented as rates. A typical example of such a model is the programme TERMOD [B4] which is shown in diagrammatic form in Figure III. Models of
Above wrl,,ce food r:rop
RADIONUCLIDE DEPOSITION
Soil rnrface btlow the food crop
Subsurf1ce soil p,:iol for thl' food crop
TT INPUT TO MAN I
Figure Ill. Compartments In the TERMOD computer programme f84J
61
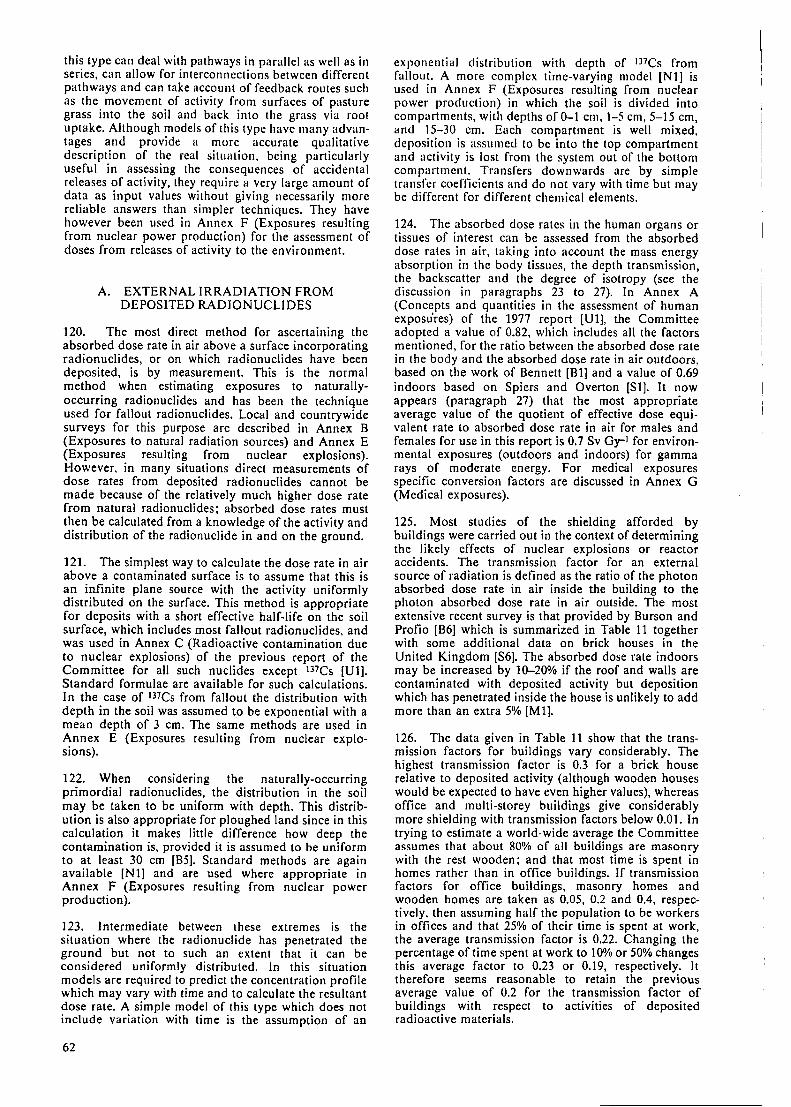
this type can deal with pathways in parallel as well as in series, can allow for interconnections between different pathways and can take account of feedback routes such as the movement of activity from surfaces of pasture grass into the soil and back into the grass via root uptake. AJthough models of this type have many advantages and provide a more accurate qualitative description of the real situation, being particularly useful in assessing the consequences of accidental releases of activity, they require a very large amount of data as input values without giving necessarily more reliable answers than simpler techniques. They have however been used in Annex F (Exposures resulting from nuclear power production) for the assessment of doses from releases of activity to the environment.
A. EXTERNAL IRRADIATION FROM DEPOSITED RADIONUCLIDES
120. The most direct method for ascertaining the absorbed dose rate in air above a surface incorporating radionuclides, or on which radionuclides have been deposited, is by measurement. This is the normal method when estimating exposures to naturallyoccurring radionuclides and has been the technique used for fallout radionuclides. Local and countrywide surveys for this purpose are described in Annex B (Exposures to natural radiation sources) and Annex E (Exposures resulting from nuclear explosions). However, in many situations direct measurements of dose rates from deposited radionuclides cannot be made because of the relatively much higher dose rate from natural radionuclides; absorbed dose rates must then be calculated from a knowledge of the activity and distribution of the radionuclide in and on the ground.
121. The simplest way to calculate the dose rate in air above a contaminated surface is to assume that this is an infinite plane source with the activity uniformly distributed on the surface. This method is appropriate for deposits with a short effective half-life on the soil surface, which includes most fallout radionuclides, and was used in Annex C (Radioactive contamination due to nuclear explosions) of the previous report of the Committee for all such nuclides except mes [Ul]. Standard formulae are available for such calculations. In the case of 137Cs from fallout the distribution with depth in the soil was assumed to be exponential with a mean depth of 3 cm. The same methods are used in Annex E (Exposures resulting from nuclear explosions).
122. When considering the naturally-occurring primordial radionuclides, the distribution in the soil may be taken to be uniform with depth. This distribution is also appropriate for ploughed land since in this calculation it makes little difference how deep the contamination is, provided it is assumed to be uniform to at least 30 cm [B5]. Standard methods are again available [Nl) and are used where appropriate in Annex F (Exposures resulting from nuclear power production).
123. Intermediate between these extremes is the situation where the radionuclide has penetrated the ground but not to such an extent that it can be considered uniformly distributed. In this situation models are required to predict the concentration profile which may vary with time and to calculate the resultant dose rate. A simple model of this type which does not include variation with time is the assumption of an
62
exponential distribution with depth of mes from fallout. A more complex time-varying model [NI] is used in Annex F (Exposures resulting from nuclear power production) in which the soil is divided into compartments, with depths of0-1 cm, 1-5 cm, 5-15 cm, and 15-30 cm. Each compartment is well mixed, deposition is assumed to be into the top compartment and activity is lost from the system out of the bottom compartment. Transfers downwards are by simple transfer coefficients and do not vary with time but may be different for different chemical elements.
124. The absorbed dose rates in the human organs or tissues of interest can be assessed from the absorbed dose rates in air, taking into account the mass energy absorption in the body tissues, the depth transmission, the backscatter and the degree of isotropy (see the discussion in paragraphs 23 to 27). In Annex A (Concepts and quantities in the assessment of human exposures) of the 1977 report [Ul], the Committee adopted a value of 0.82, which includes all the factors mentioned, for the ratio between the absorbed dose rate in the body and the absorbed dose rate in air outdoors. based on the work of Bennett [81] and a value of 0.69 indoors based on Spiers and Overton [Sl]. It now appears (paragraph 27) that the most appropriate average value of the quotient of effective dose equivalent rate to absorbed dose rate in air for males and females for use in this report is 0.7 Sv Gy-1 for environmental exposures (outdoors and indoors) for gamma rays of moderate energy. For medical exposures specific conversion factors are discussed in Annex G (Medical exposures).
125. Most studies of the shielding afforded by buildings were carried out in the context of determining the likely effects of nuclear explosions or reactor accidents. The transmission factor for an external source of radiation is defined as the ratio of the photon absorbed dose rate in air inside the building to the photon absorbed dose rate in air outside. The most extensive recent survey is that provided by Burson and Profio (86] which is summarized in Table 11 together with some additional data on brick houses in the United Kingdom [S6]. The absorbed dose rate indoors may be increased by 10-20% if the roof and walls are contaminated with deposited activity but deposition which has penetrated inside the house is unlikely to add more than an extra 5% [Ml].
126. The data given in Table 11 show that the transmission factors for buildings vary considerably. The highest transmission factor is 0.3 for a brick house relative to deposited activity (although wooden houses would be expected to have even higher values), whereas office and multi-storey buildings give considerably more shielding with transmission factors below 0.01. In trying to estimate a world-wide average the Committee assumes that about 80% of all buildings are masonry with the rest wooden; and that most time is spent in homes rather than in office buildings. If transmission factors for office buildings, masonry homes and wooden homes are taken as 0.05, 0.2 and 0.4, respectively, then assuming half the population to be workers in offices and that 25% of their time is spent at work, the average transmission factor is 0.22. Changing the percentage of time spent at work to 10% or 50% changes this average factor to 0.23 or 0.19, respectively. Jt therefore seems reasonable to retain the previous average value of 0.2 for the transmission factor of buildings with respect to activities of deposited radioactive materials.
127. A further important consideration is the amount of time spent outdoors compared with that within buildings. This will obviously vary greatly for different areas of the world, being as low as 10% in the United Kingdom and the United States [S7, Rl] but probably much greater in warmer or less urbanized countries. The Committee has previously taken, as a world-wide average, that 20% of time is spent outdoors and there seems no reliable data on which to base any change to this estimate. Combining the transmission and occupancy factors, the overall conversion factor to apply to the calculated or measured absorbed dose rates in air from deposited radioactivity would now be strictly 0.25. This factor includes allowance for conversion to absorbed dose in tissue as discussed in section I I.A. I (paragraph 27), and for the proportion of time spent outdoors or indoors in various buildings. Changing the percentage of time spent outdoors to 10% or 30% changes this overall conversion factor to 0.20 or 0.31, respectively; for consistency, the Committee has decided to continue to use the overall factor of 0.3 adopted in Annex A (Concepts and quantities in the assessment of human exposures) of the 1977 report [U1].
128. In Annex C (Technologically modified exposures to natural radiation) account is also taken of the contribution to the dose rate indoors from natural radionuclides in the building materials themselves. A very simple model is used assuming the indoor space is a cavity in an infinite mass of the building material, so that the dose rate is proportional to the gamma-ray emission constants of the radionuclides of interest. The value obtained is only an index allowing comparison between building materials and not an estimate of the doses that would be received in houses constructed with those building materials. In many cases, adequate indoor measurements are available for assessment of actual doses.
B. DIETARY TRANSFER MODELS AND DOSE CALCULATIONS
129. Probably the simplest model is that which has become known as the specific activity model. This does not attempt to describe the environmental transfer behaviour of the radionuclide under study. It is based on the assumption that activity is dispersed so as to result in a uniform concentration in a defined receptor medium. In this situation the radionuclide will be present in the environment at a particular specific activity with respect to some stable analogue. The concentration of the radionuclide in body tissues is then assumed to bear the same relationship to the concentration of the stable analogue in the body. Given the knowledge of the mass of the stable analogue, then the activity of the radionuclide in the body can be found. This method is used for example in Annex B (Exposures to natural radiation sources) and in Annex E (Exposures resulting from nuclear explosions) to assess doses from tritium and carbon-14.
130. As described in the introduction to chapter V, models of several types can be used to describe the transfer of deposited radionuclides through vegetable and animal food chains to man. For the situation in which the integration periods over which results arc required are relatively long, as when dealing with the long-term contamination from nuclear explosions, models have been developed by the Committee and used in Annex C (Radioactive contamination due to
nuclear explosions) of the 1977 report [Ul] and in earlier reports [U2, U3]. The same models are used in Annex E (Exposures resulting from nuclear explosions). As described in the introduction to chapter III, the results of transfer models are expressed as the relationships between appropriate time-integrated quantities in two compartments of the environment.
131. This formulation is used in Annex E (Exposures resulting from nuclear explosions) with regard to the most important radionuclides in fallout which enter dietary food chains. The transfer coefficients of concern for this aspect of the modelling are from deposition to human diet and from human diet to tissue, denoted as P23 and P34, respectively. The transfer coefficient from deposition to diet is given by
00
i C (t) dt P23 = _o ___ _
00 (17)
I o et> dt 0
where C(t) is the act1v1ty concentration of the considered radionuclide in the diet at time t and O(t) is the deposition density rate. For values of C(t) and U(t) assessed on a yearly basis, the integrations can be replaced by summation
00
I CCi) i = I
P23 = -00--- (18)
L O(i) . i = I
In the case of 90Sr and 137Cs, the following model is used to relate the activity concentrations in food groups or in the total diet to the annual deposition densities:
C (i) = b 1 0 (i) + b2 0 (i - I) + co
+ b3 L e-µm O (i - m) m - I
(19)
There are contributions to activity concentrations in diet from the annual deposition density in the year considered O(i), in the previous year O(i-1) and for all preceding years, expressed by the summation, with an exponential term describing the combined physical decay of the radionuclide considered and any decrease in availability to plants in soil. The values of b1, b2, b3, and As can be derived from measured data by regression analysis. The combination of equations (18) and (19) leads to
(20)
where n = 1 year, a constant in this case. A similar treatment is applied in calculating the transfer from diet to tissue (coefficient P34) for 90Sr. In some cases, a combined transfer coefficient P24 is used to directly relate the time-integrated concentration in human tissue to the integrated deposition density; this is the procedure used for deposited mes.
63
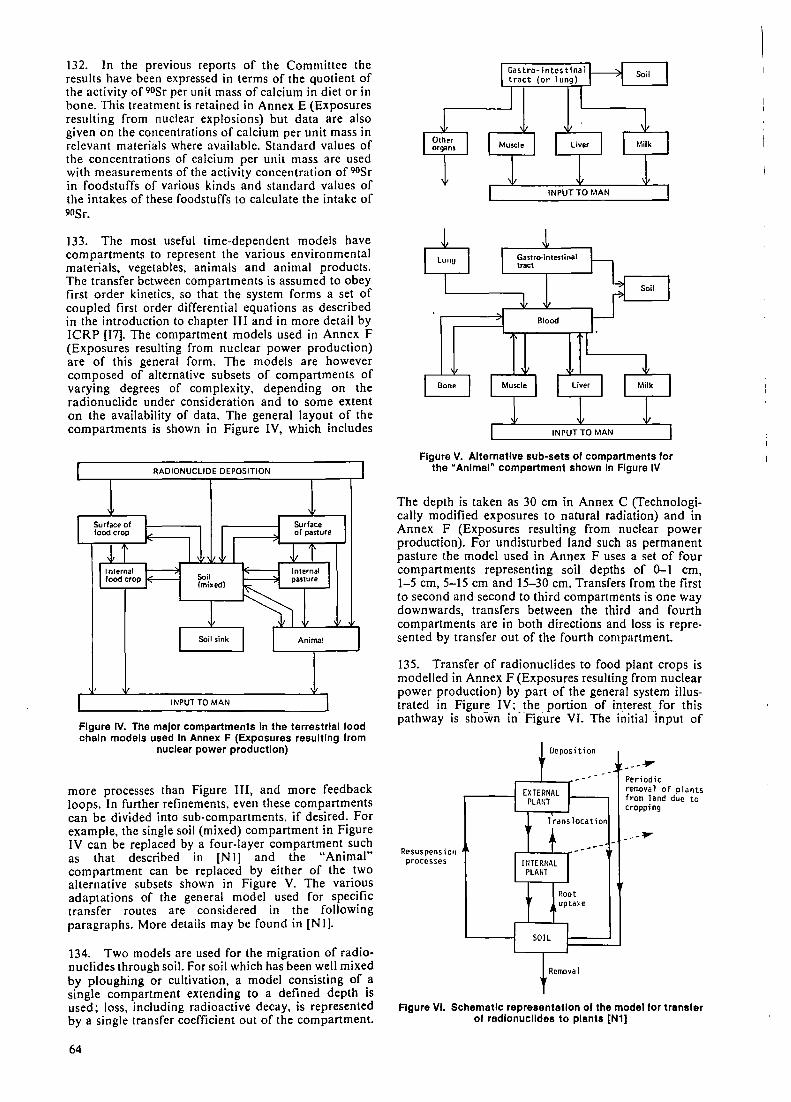
132. In the previous reports of the Committee the results have been expressed in terms of the quotient of the activity of 90Sr per unit mass of calcium in diet or in bone. This treatment is retained in Annex E (Exposures resulting from nuclear explosions) but data are also given on the concentrations of calcium per unit mass in relevant materials where available. Standard values of the concentrations of calcium per unit mass are used with measurements of the activity concentration of 90Sr in foodstuffs of various kinds and standard values of the intakes of these foodstuffs to calculate the intake of 90Sr.
133. The most useful time-dependent models have compartments to represent the various environmental materials, vegetables, animals and animal products. The transfer between compartments is assumed to obey first order kinetics, so that the system forms a set of coupled first order differential equations as described in the introduction to chapter III and in more detail by ICRP [17]. The compartment models used in Annex F (Exposures resulting from nuclear power production) are of this general form. The models are however composed of alternative subsets of compartments of varying degrees of complexity, depending on the radionuclide under consideration and to some extent on the availability of data. The general layout of the compartments is shown in Figure IV, which includes
RADIONUCLIDE DEPOSITION
INPUT TO MAN
Figure IV. The major compartments In the terrestrial food chain models used In Annex F (Exposures resulting from
nuclear power production)
more processes than Figure III, and more feedback loops. In further refinements, even these compartments can be divided into sub-compartments, if desired. For example, the single soil (mixed) compartment in Figure IV can be replaced by a four-layer compartment such as that described in [N1] and the "Animal" compartment can be replaced by either of the two alternative subsets shown in Figure V. The various adaptations of the general model used for specific transfer routes are considered in the following paragraphs. More details may be found in [N1].
134. Two models are used for the migration of radionuclides through soil. For soil which has been well mixed by ploughing or cultivation, a model consisting of a single compartment extending to a defined depth is used; loss, including radioactive decay, is represented by a single transfer coefficient out of the compartment.
64
Soil
Bone
INPUT TO MAN
Figure V. Alternative sub-sets of compartments for the "Animal" compartment shown In Figure IV
The depth is taken as 30 cm in Annex C (Technologically modified exposures to natural radiation) and in Annex F (Exposures resulting from nuclear power production). For undisturbed land such as permanent pasture the model used in Annex F uses a set of four compartments representing soil depths of 0-1 cm, 1-5 cm, 5-15 cm and 15-30 cm. Transfers from the first to second and second to third compartments is one way downwards, transfers between the third and fourth compartments are in both directions and loss is represented by transfer out of the fourth compartment.
135. Transfer of radionuclides to food plant crops is modelled in Annex F (Exposures resulting from nuclear power production) by part of the general system illustrated in Figure IV; the portion of interest for this pathway is shown in- Figure VI. The initial input of
Resuspens ior, processes
Deposition
[XTERNAL PLANT
Trans location
HITERNAL PLANT
SOIL
Root uptake
Remova 1
---
---~ Periodic removal of plants from land due to cropping
---~
Figure VI. Schematic representation of the model tor transfer of radlonuclldes to plants [N1]
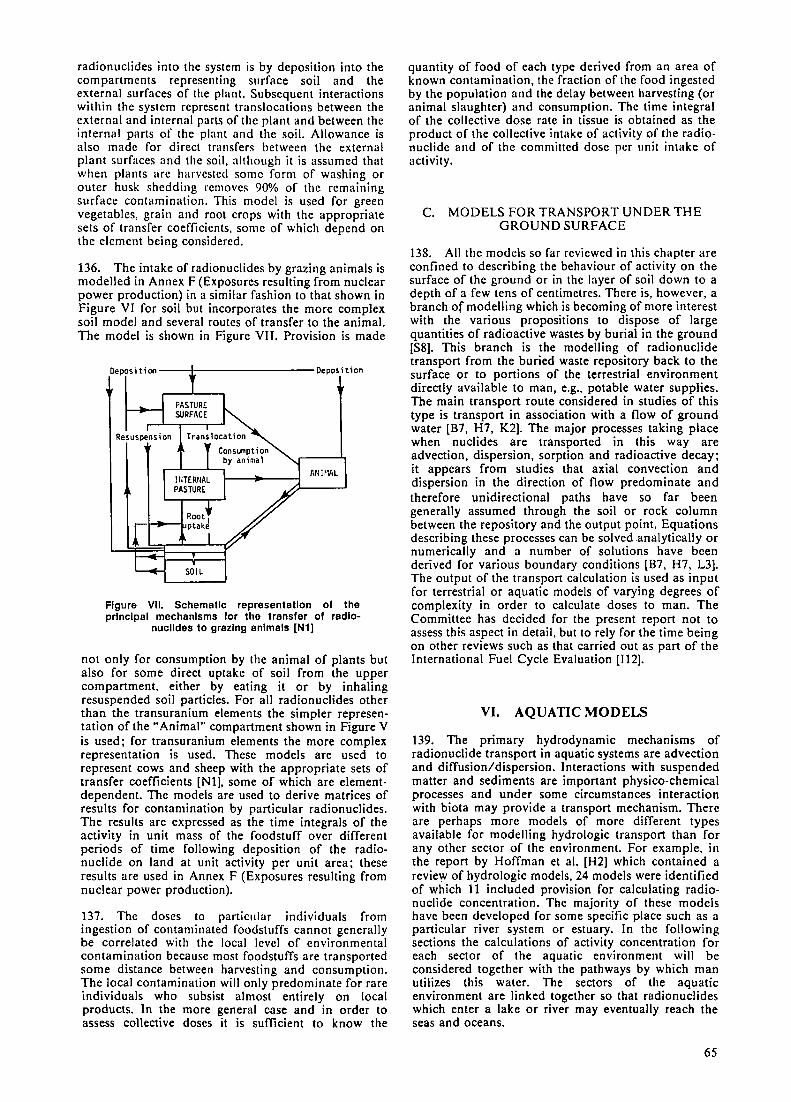
radionuclides into the system is by deposition into the compartments representing surface soil and the external surfaces or the plant. Subsequent interactions within the system represent translocations between the external and internal parts or the plant and between the internal parts of the plant and the soil. Allowance is also made for direct transfers between the external plant surfaces and the soil, although it is assumed that when plants arc harvested some form or washing or outer husk shedding removes 90% or the remaining surface contamination. This model is used for green vegetables, grain and root crops with the appropriate sets of transfer coefficients, some of which depend on the element being considered.
136. The intake of radionuclides by grazing animals is modelled in Annex F (Exposures resulting from nuclear power production) in a similar fashion to that shown in Figure VI for soil but incorporates the more complex soil model and several routes of transfer to the animal. The model is shown in Figure VII. Provision is made
Depositioo--·•---------Deposition
Resuspens ion
PASTURE SURF/ICE
ANIMAL
Figure VII. Schematic representation of the prlnclpal mechanisms for the transfer of radlo
nuclldes to grazing animals [N1]
not only for consumption by the animal of plants but also for some direct uptake of soil from the upper compartment, either by eating it or by inhaling resuspended soil particles. For all radionuclides other than the transuranium elements the simpler representation of the "Animal" compartment shown in Figure V is used; for transuranium elements the more complex representation is used. These models are used to represent cows and sheep with the appropriate sets or transfer coefficients [Nl], some of which are elementdependent. The models are used to derive matrices of results for contamination by particular radionuclides. The results are expressed as the time integrals of the activity in unit mass of the foodstuff over different periods of time following deposition of the radionuclide on land at unit activity per unit area; these results are used in Annex F (Exposures resulting from nuclear power production).
137. The doses to particular individuals from ingestion or contaminated foodstuffs cannot generally be correlated with the local level or environmental contamination because most foodstuffs are transported some distance between harvesting and consumption. The local contamination will only predominate for rare individuals who subsist almost entirely on local products. In the more general case and in order to assess collective doses it is sufficient to know the
quantity or food or each type derived from an area or known contamination, the fraction or the food ingested by the population and the delay between harvesting (or animal slaughter) and consumption. The time integral of the collective dose rate in tissue is obtained as the product of the collective intake or activity or the radionuclide and or the committed dose per unit intake of activity.
C. MODELS FOR TRANSPORT UNDER THE GROUND SURFACE
138. All the models so far reviewed in this chapter are confined to describing the behaviour of activity on the surface or the ground or in the layer of soil down to a depth of a few tens of centimetres. There is, however, a branch of modelling which is becoming of more interest with the various propositions to dispose of large quantities of radioactive wastes by burial in the ground [S8]. This branch is the modelling of radionuclide transport from the buried waste repository back to the surface or to portions or the terrestrial environment directly available to man, e.g., potable water supplies. The main transport route considered in studies of this type is transport in association with a flow of ground water [B7, H7, K2]. The major processes taking place when nuclides are transported in this way are advection, dispersion, sorption and radioactive decay; it appears from studies that axial convection and dispersion in the direction or flow predominate and therefore unidirectional paths have so far been generally assumed through the soil or rock column between the repository and the output point. Equations describing these processes can be solved .analytically or numerically and a number or solutions have been derived for various boundary conditions [B7, H7, L3]. The output of the transport calculation is used as input for terrestrial or aquatic models of varying degrees of complexity in order to calculate doses to man. The Committee has decided for the present report not to assess this aspect in detail, but to rely for the time being on other reviews such as that carried out as part of the International Fuel Cycle Evaluation [112].
VI. AQUATIC MODELS
139. The primary hydrodynamic mechanisms of radionuclide transport in aquatic systems are advection and diffusion/dispersion. Interactions with suspended matter and sediments are important physico-chemical processes and under some circumstances interaction with biota may provide a transport mechanism. There are perhaps more models of more different types available for modelling hydrologic transport than for any other sector or the environment. For example, in the report by Hoffman et al. [H2] which contained a revie~ or hydrologic models, 24 models were identified of which 11 included provision for calculating radionuclide concentration. The majority of these models have been developed for some specific place such as a particular river system or estuary. In the following sections the calculations or activity concentration for each sector of the aquatic environment will be considered together with the pathways by which man utilizes this water. The sectors or the aquatic environment are linked together so that radionuclides which enter a lake or river may eventually reach the seas and oceans.
65
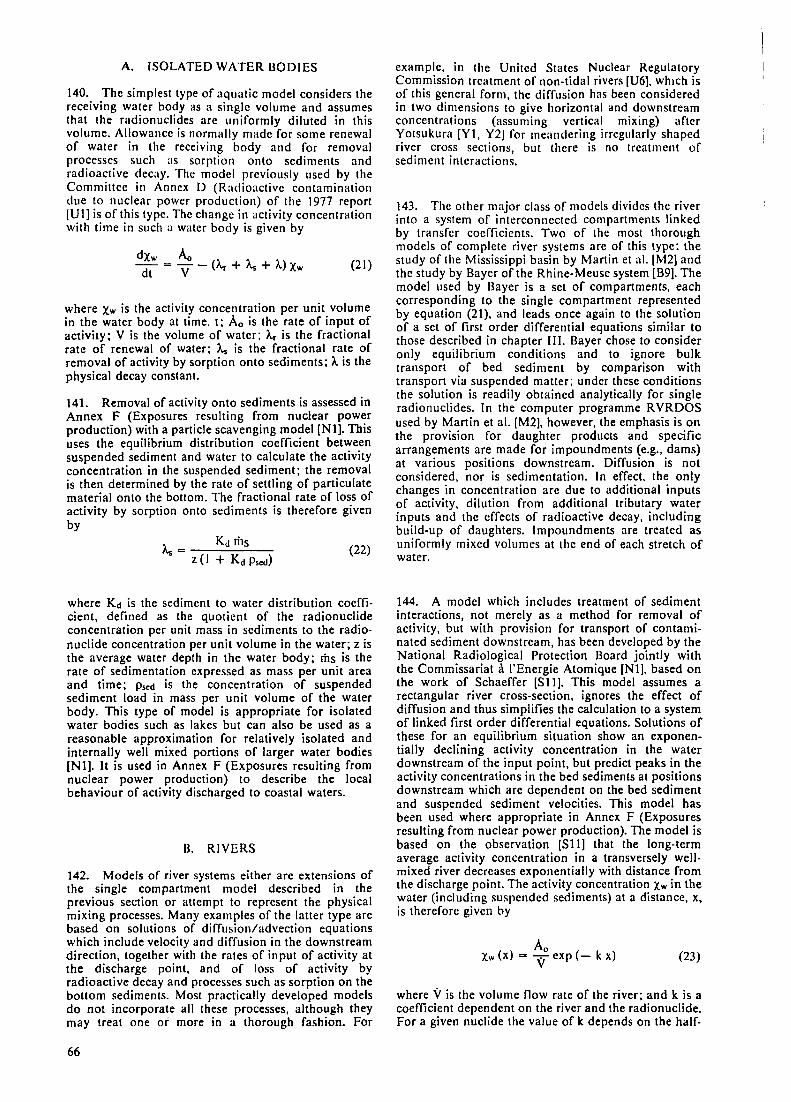
A. ISOLATED WATER BODIES
140. The simplest type of aquatic model considers the receiving water body as a single volume and assumes that the radionuclides are uniformly diluted in this volume. Allowance is normally made for some renewal of water in the receiving body and for removal processes such as sorption onto sediments and radioactive decay. The model previously used by the Committee in Annex D (Radioactive contamination due to nuclear power production) of the 1977 report [U I] is of this type. The change in activity concentration with time in such a water body is given by
where ).'.w is the activity concentration per unit volume in the water body at time. t; A0 is the rate of input of activity; V is the volume of water: At- is the fractional rate of renewal of water; As is the fractional rate of removal of activity by sorption onto sediments;).. is the physical decay constant.
141. Removal of activity onto sediments is assessed in Annex F (Exposures resulting from nuclear power production) with a particle scavenging model [Nl]. This uses the equilibrium distribution coefficient between suspended sediment and water to calculate the activity concentration in the suspended sediment: the removal is then determined by the rate of settling of particulate material onto the bottom. The fractional rate of loss of activity by sorption onto sediments is therefore given by
(22)
where Kd is the sediment to water distribution coefficient, defined as the quotient of the radionuclide concentration per unit mass in sediments to the radionuclide concentration per unit volume in the water; z is the average water depth in the water body; ms is the rate of sedimentation expressed as mass per unit area and time; Psed is the concentration of suspended sediment load in mass per unit volume of the water body. This type of model is appropriate for isolated water bodies such as lakes but can also be used as a reasonable approximation for relatively isolated and internally well mixed portions of larger water bodies [Nl]. It is used in Annex F (Exposures resulting from nuclear power production) to describe the local behaviour of activity discharged to coastal waters.
B. RIVERS
142. Models of river systems either are extensions of the single compartment model described in the previous section or attempt to represent the physical mixing processes. Many examples of the latter type are based on solutions of diffusion/advection equations which include velocity and diffusion in the downstream direction, together with the rates of input of activity at the discharge point, and of loss of activity by radioactive decay and processes such as sorption on the bottom sediments. Most practically developed models do not incorporate all these processes, although they may treat one or more in a thorough fashion. For
66
example, in the United States Nuclear Regulatory Commission treatment of non-tidal rivers [U6], which is of this general form, the diffusion has been considered in two dimensions to give horizontal and downstream concentrations (assuming vertical mixing) after Yotsukura [YI, Y2] for meandering irregularly shaped river cross sections, but there is no treatment of sediment interactions.
143. The other major class of models divides the river into a system of interconnected compartments linked by transfer coefficients. Two of the most thorough models of complete river systems are of this type: the study of the Mississippi basin by Martin et al. [M2] and the study by Bayer of the Rhine-Meuse system [B9]. The model used by Bayer is a set of compartments, each corresponding to the single compartment represented by equation (21), and leads once again to the solution of a set of first order differential equations similar to those described in chapter I I I. Bayer chose to consider only equilibrium conditions and to ignore bulk transport of bed sediment by comparison with transport via suspended matter: under these conditions the solution is readily obtained analytically for single radionuclides. In the computer programme RVRDOS used by Martin et al. [M2], however, the emphasis is on the provision for daughter products and specific arrangements are made for impoundments (e.g., dams) at various positions downstream. Diffusion is not considered, nor is sedimentation. In effect. the only changes in concentration are due to additional inputs of activity, dilution from additional tributary water inputs and the effects of radioactive decay, including build-up of daughters. Impoundments are treated as uniformly mixed volumes at the end of each stretch of water.
144. A model which includes treatment of sediment interactions, not merely as a method for removal of activity, but with provision for transport of contaminated sediment downstream, has been developed by the National Radiological Protection Board jointly with the Commissariat a l'Energie Atomique [Nl], based on the work of Schaeffer [Sll]. This model assumes a rectangular river cross-section, ignores the effect of diffusion and thus simplifies the calculation to a system of linked first order differential equations. Solutions of these for an equilibrium situation show an exponentially declining activity concentration in the water downstream of the input point, but predict peaks in the activity concentrations in the bed sediments at positions downstream which are dependent on the bed sediment and suspended sediment velocities. This model has been used where appropriate in Annex F (Exposures resulting from nuclear power production). The model is based on the observation [Sl 1] that the long-term average activity concentration in a transversely wellmixed river decreases exponentially with distance from the discharge point. The activity concentration X.w in the water (including suspended sediments) at a distance, x, is therefore given by
Ao Xw (x) "" V exp (- k x) (23)
where Vis the volume flow rate of the river: and k is a coefficient dependent on the river and the radionuclide. For a given nuclide the value of k depends on the half-
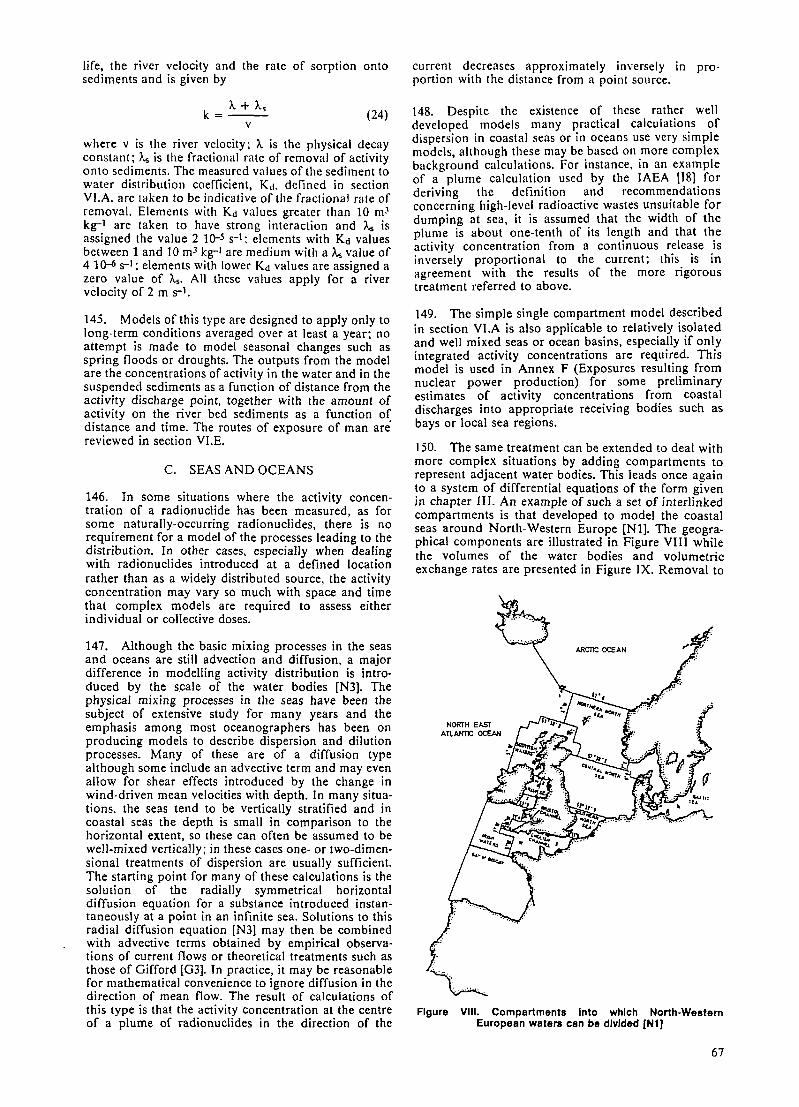
life, the river velocity and the rate of sorption onto sediments and is given by
k = A+ As V
(24)
where v is t~e river v~locity; A is the physical decay constant_; A.s 1s the fractional rate of removal of activity onto sediments. The measured values of the sediment to water distribution coefficient, Kd, defined in section VJ.A. are taken to be indicative of the fractional rate of removal. Elements with Kd values greater than to m3 kg-_1 are taken to have strong interaction and A.s is assigned the value 2 10-5 s-1; elements with Kd values between 1 and 10 m3 kg-1 are medium with a A.s value of 4 1 Q-6 s-1; elements with lower Kd values are assigned a zero value of A,s. All these values apply for a river velocity of 2 m s-1.
145. Models of .this type are designed to apply only to long-term cond1t1ons averaged over at least a year· no attempt is made to model seasonal changes such as spring lloods or droughts. The outputs from the model are the concentrations of activity in the water and in the suspended sediments as a function of distance from the activity discharge point, together with the amount of activity on the river bed sediments as a function of distance and time. The routes of exposure of man are' reviewed in section VI.E.
C. SEAS AND OCEANS
146. In some situations where the activity concentration of a radionuclide has been measured, as for some naturally-occurring radionuclides there is no r~qu)re~ent for a model of the processes'leading to the d1.stnbut1?n· I~ oth:r cases, especially when dealing with rad1onuchdes introduced at a defined location rather tha~ as a widely distributed source, the activity concentration may vary so much with space and time that complex models are required to assess either individual or collective doses.
147. Although the basic mixing processes in the seas a1_1d oceans. are still advection and diffusion, a major difference 10 modelling activity distribution is introduce? by ~h.e s.cale of th: water bodies [N3]. The physical m1xmg processes m the seas have been the subject of extensive study for many years and the emphasis among most oceanographers has been on producing models to describe dispersion and dilution processes. Many of these are of a diffusion type although some include an advective term and may even al~ow f~r shear effects. i~troduced by the change in 'Ymd-dnven mean veloc1ties with depth. In many situat10ns, the seas tend to be vertically stratified and in coastal seas the depth is small in comparison to the horizontal extent, so these can often be assumed to be well-mixed vertically; in these cases one- or two-dimensional treatments of dispersion are usually sufficient. The starting point for many of these calculations is the solution of the radially symmetrical horizontal diffusion equation for a substance introduced instantaneously at a point in an infinite sea. Solutions to this ra_dial diffu~ion equation [N3] may then be combined ~Ith advect1ve terms obtained by empirical observat10ns of current llows or theoretical treatments such as those of Gifford [G3]. In practice, it may be reasonable for mathematical convenience to ignore diffusion in the direction of mean flow. The result of calculations of this type is that the activity concentration at the centre of a plume of radionuclides in the direction of the
curr~nt ~ecreases. approximately inversely in proportion with the distance from a point source.
148. Despite the existence of these rather well developed models many practical calculations of dispersion in coastal seas or in oceans use very simple models, although these may be based on more complex background calculations. For instance, in an example of a plume calculation used by the IAEA [18] for deriving the definition and recommendations concerning high-level radioactive wastes unsuitable for dumping at sea, it is assumed that the width of the plume is about one-tenth of its length and that the activity concentration from a continuous release is inversely proportional to the current; this is in agreement with the results of the more rigorous treatment referred to above.
149. The simple single compartment model described in section VI .A is also applicable to relatively isolated and well mixed seas or ocean basins, especially if only integrated activity concentrations are required. This model is used in Annex F (Exposures resulting from nuclear power production) for some preliminary estimates of activity concentrations from coastal discharges into appropriate receiving bodies such as bays or local sea regions.
150. The same treatment can be extended to deal with more compl~x situations by adding compartments to represent adJacent water bodies. This leads once again ~o a system of differential equations of the form given in chapter III. An example of such a set of interlinked compartments is that developed to model the coastal se~s around North-Western Europe [Nl]. The geographical components are illustrated in Figure VIII while the volumes of the water bodies and volumetric exchange rates are presented in Figure IX. Removal to
NORTH EAST ATLANTIC OCEAN
ARCTIC OCEAN
Figure VIII. Compartments Into which North-Western European waters can be divided [N1]
67
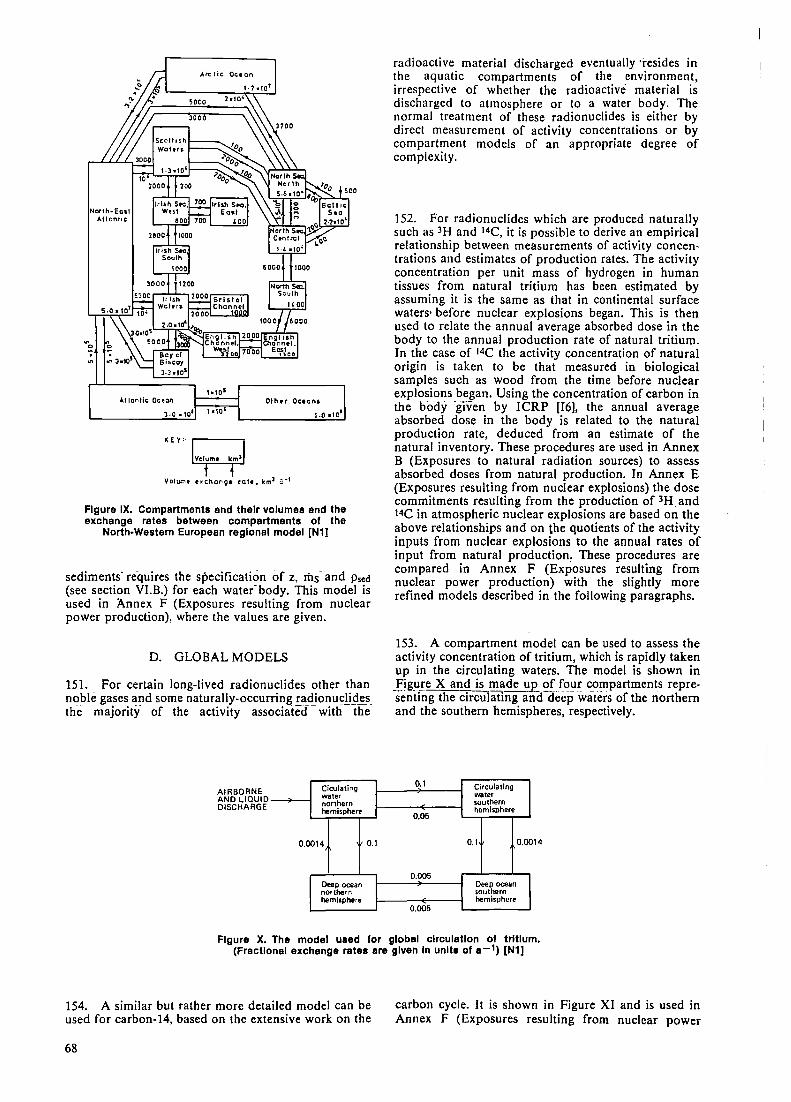
North-Ea51 Atlcn11c
. "'
Arc t le Oct an
Othrr Oceans
1.0 •to'
KEy,-.---~
Volum• e-xchon91 rate. km1 a-1
Figure IX. Compartments and their volumes and the exchange rates between compartments of the
North-Western European regional model [N1]
sediments· requires the specification of z, ms- and Psed (see section VI.B.) for each water.body. This model is used in Annex F (Exposures resulting from nuclear power production), where the values are given.
D. GLOBAL MODELS
151. For certain long-lived radionuclides other than noble gases and some naturally-occurring rad.ionu~li_d~s the majoritf of the activity assocfa"tecf . with the
AIRBORNE ANO LIOUIO-...;,---i DISCHARGE
Ciculating water northern hemisphera
0.0014
Deep oaan northern hemisphere
0.1
radioactive material discharged eventually ·resides in the aquatic compartments of the environment, irrespective of whether the radioactive material is discharged to atmosphere or to a water body. The normal treatment of these radionuclides is either by direct measurement of activity concentrations or by compartment models of an appropriate degree of complexity.
152. For radionuclides which are produced naturally such as 3H and 14C, it is possible to derive an empirical relationship between measurements of activity concentrations and estimates of production rates. The activity concentration per unit mass of hydrogen in human tissues from natural tritium has been estimated by assuming it is the same as that in continental surface waters• before nuclear explosions began. This is then used to relate the annual average absorbed dose in the body to the annual production rate of natural tritium. In the case of 14C the activity concentration of natural origin is taken to be that measured in biological samples such as wood from the time before nuclear explosions began. Using the concentration of carbon in the body ·given by ICRP [16], the annual average absorbed dose in the body is related to the natural production rate, deduced from an estimate of the natural inventory. These procedures are used in Annex B (Exposures to natural radiation sources) to assess absorbed doses from natural production. In Annex E (Exposures resulting from nuclear explosions) the dose commitments resulting from the production of 3H. and 14C in atmospheric nuclear explosions are based on the above relationships and on the quotients of the activity inputs from nuclear explosions to the annual rates of input from natural production~ These procedures are compared in Annex F (Exposures resulting from nuclear power production) with the slightly more refined models described in the following paragraphs.
153. A compartment model can be used to assess the activity concentration of tritium, which is rapidly taken up in the circulating waters. The model is shown in Fig~re X and is made up of four compartments representing the circulating anddeep waters of the northern and the southern hemispheres, respectively.
0.1
0.05
0.005
0.005
Circulating water southern hemisphere
0.1
Deep O<:San southern hemisphere
0.0014
Figure X. The model used for global circulation of tritium. (Fractional exchange rates are given In units of e-1) (N1]
154. A similar but rather more detailed model can be used for carbon-14, based on the extensive work on the
68
carbon cycle. It is shown in Figure XI and is used in Annex F (Exposures resulting from nuclear power
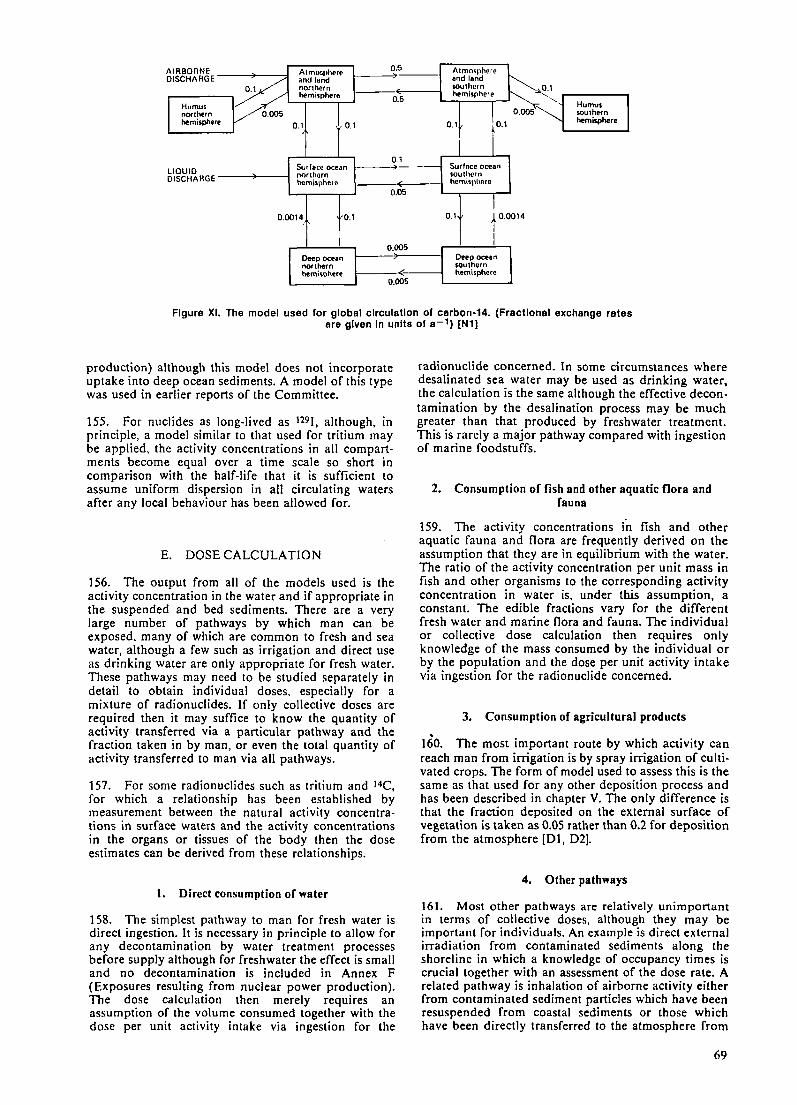
Hunws northern hemisphere
Atmotphere and land northern hemls1,here
0.1 0.1
0.5
0.5
0.1
Atmosphere and land sou1hcrn hemisphere
0.1
Humus southefn hemisphere
LIQUID DISCHARGE -----'.>----1
Surface ocean 1---4--~ northern
Surface ocean s,outhern hemiiphern hem\!aphcre
0.0014 '0.1 '
Deep ocean northern hemisphere
0.05
0.005
0.005
0.1
Deep ocean southern hemisphere
0.0014
Figure XI. The model used for global clrculotlon of cerbon-14. (Frectlonel exchange rates ere given In units of a-1) [N1]
production) although this model does not incorporate uptake into deep ocean sediments. A model of this type was used in earlier reports of the Committee.
155. For nuclides as long-lived as 1291, although, in principle, a model similar to that used for tritium may be applied, the activity concentrations in all compartments become equal over a time scale so short in comparison with the half-life that it is sufficient to assume uniform dispersion in all circulating waters after any local behaviour has been allowed for.
E. DOSE CALCULATION
156. The output from all of the models used is the activity concentration in the water and if appropriate in the suspended and bed sediments. There are a very large number of pathways by which man can be exposed, many of which are common to fresh and sea water, although a few such as irrigation and direct use as drinking water are only appropriate for fresh water. These pathways may need to be studied separately in detail to obtain individual doses. especially for a mixture of radionuclides. If only collective doses are required then it may suffice to know the quantity of activity transferred via a particular pathway and the fraction taken in by man, or even the total quantity of activity transferred to man via all pathways.
157. For some radionuclides such as tritium and 14C, for which a relationship has been established by measurement between the natural activity concentrations in surface waters and the activity concentrations in the organs or tissues of the body then the dose estimates can be derived from these relationships.
1. Direct consumption of water
158. The simplest pathway to man for fresh water is direct ingestion. It is necessary in principle to allow for any decontamination by water treatment processes before supply although for freshwater the effect is small and no decontamination is included in Annex F (Exposures resulting from nuclear power production). The dose calculation then merely requires an assumption of the volume consumed together with the dose per unit activity intake via ingestion for the
radionuclide concerned. In some circumstances where desalinated sea water may be used as drinking water, the calculation is the same although the effective decontamination by the desalination process may be much greater than that produced by freshwater treatment. This is rarely a major pathway compared with ingestion of marine foodstuffs.
2. Consumption of fish and other aquatic flora and fauna
159. The act1v1ty concentrations in fish and other aquatic fauna and flora are frequently derived on the assumption that they are in equilibrium with the water. The ratio of the activity concentration per unit mass in fish and other organisms to the corresponding activity concentration in water is, under this assumption, a constant. The edible fractions vary for the different fresh water and marine flora and fauna. The individual or collective dose calculation then requires only knowledge of the mass consumed by the individual or by the population and the dose per unit activity intake via ingestion for the radionuclide concerned.
3. Consumption of agricultural products .
160. The most important route by which activity can reach man from irrigation is by spray irrigation of cultivated crops. The form of model used to assess this is the same as that used for any other deposition process and has been described in chapter V. The only difference is that the fraction deposited on the external surface of vegetation is taken as 0.05 rather than 0.2 for deposition from the atmosphere [Dl, D2].
4. Other pathways
161. Most other pathways are relatively unimportant in terms of collective doses, although they may be important for individuals. An example is direct external irradiation from contaminated sediments along the shoreline in which a knowledge of occupancy times is crucial together with an assessment of the dose rate. A related pathway is inhalation of airborne activity either from contaminated sediment particles which have been resuspended from coastal sediments or those which have been directly transferred to the atmosphere from
69
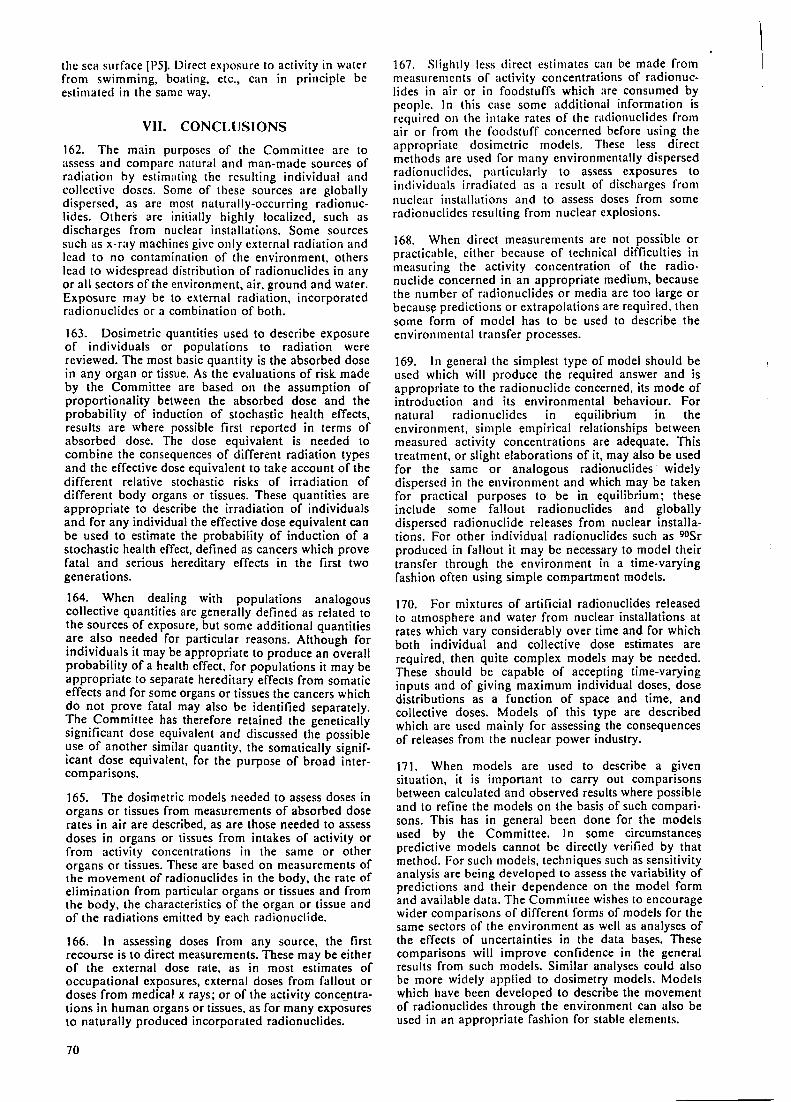
the sea surface [PS]. Direct exposure to activity in water from swimming, boating, etc., can in principle be estimated in the same way.
VII. CONCLUSIONS
162. The main purposes of the Committee are to assess and compare natural and man-made sources of radiation by estimating the resulting individual and collective doses. Some of these sources are globally dispersed, as arc most naturally-occurring radionuclides. Others are initially highly localized, such as discharges from nuclear installations. Some sources such as x-ray machines give only external radiation and lead to no contamination of the environment, others lead to widespread distribution of radionuclides in any or all sectors of the environment, air, ground and water. Exposure may be to external radiation, incorporated radionuclides or a combination of both.
163. Dosimetric quantities used to describe exposure of individuals or populations to radiation were reviewed. The most basic quantity is the absorbed dose in any organ or tissue. As the evaluations of risk made by the Committee are based on the assumption of proportionality between the absorbed dose and the probability of induction of stochastic health effects, results are where possible first reported in terms of absorbed dose. The dose equivalent is needed to combine the consequences of different radiation types and the effective dose equivalent to take account of the different relative stochastic risks of irradiation of different body organs or tissues. These quantities are appropriate to describe the irradiation of individuals and for any individual the effective dose equivalent can be used to estimate the probability of induction of a stochastic health effect, defined as cancers which prove fatal and serious hereditary effects in the first two generations.
164. When dealing with populations analogous collective quantities are generally defined as related to the sources of exposure, but some additional quantities are also needed for particular reasons. Although for individuals it may be appropriate to produce an overall probability of a health effect, for populations it may be appropriate to separate hereditary effects from somatic effects and for some organs or tissues the cancers which do not pro~e fatal may also be identified separately. ~he. Committee has. therefore retained the genetically s1gmficant dose equivalent and discussed the possible ~se of another .similar quantity, the somatically significant dose eqmvalent, for the purpose of broad intercomparisons.
165. The dosimetric models needed to assess doses in organs or tissues from measurements of absorbed dose rates in air are described, as are those needed to assess doses in organs or tissues from intakes of activity or from activity concentrations in the same or other organs or tissues. These are based on measurements of the movement of radionuclides in the body, the rate of elimination from particular organs or tissues and from the body, the characteristics of the organ or tissue and of the radiations emitted by each radionuclide.
166. In assessing doses from any source, the first recourse is to direct measurements. These may be either of the external dose rate, as in most estimates of occupational exposures, external doses from fallout or doses from medical x rays; or of the activity conce_ntrations in human organs or tissues, as for many exposures to naturally produced incorporated radionuclides.
70
167. Slightly less direct estimates can be made from measurements or activity concentrations of radionuclides in air or in foodstuffs which are consumed by people. In this case some additional information is required on the intake rates of the radionuclides from air or from the foodstuff concerned before using the appropriate dosimetric models. These less direct methods are used for many environmentally dispersed radionuclides, particularly to assess exposures to individuals irradiated as a result or discharges from nuclear installations and to assess doses from some radionuclides resulting from nuclear explosions.
168. When direct measurements arc not possible or practicable, either because of technical difficulties in measuring the activity concentration of the radionuclide concerned in an appropriate medium, because the number of radionuclides or media are too large or becaUS\! predictions or extrapolations are required, then some form of model has to be used to describe the environmental transfer processes.
169. In general the simplest type of model should be used which will produce the required answer and is appropriate to the radionuclide concerned, its mode of introduction and its environmental behaviour. For natural radionuclides in equilibrium in the environment, simple empirical relationships between measured activity concentrations are adequate. This treatment, or slight elaborations of it, may also be used for the same or analogous radionuclides widely dispersed in the environment and which may be taken for practical purposes to be in equilibrium; these include some fallout radionuclides and globally dispersed radionuclide releases from nuclear installations. For other individual radionuclides such as 90Sr produced in fallout it may be necessary to model their transfer through the environment in a time-varying fashion often using simple compartment models.
170. For mixtures of artificial radionuclides released to atmosphere and water from nuclear installations at rates which vary considerably over time and for which both individual and collective dose estimates are required, then quite complex models may be needed. These should be capable of accepting time-varying inputs and of giving maximum individual doses, dose distributions as a function of space and time, and collective doses. Models of this type are described which are used mainly for assessing the consequences of releases from the nuclear power industry.
171. When models are used to describe a given situation, it is important to carry out comparisons between calculated and observed results where possible and to refine the models on the basis of such comparisons. This has in general been done for the models used by the Committee. In some circumstances predictive models cannot be directly verified by that method. For such models, techniques such as sensitivity analysis are being developed to assess the variability of predictions and their dependence on the model form and available data. The Committee wishes to encourage wider comparisons or different forms of models for the same sectors of the environment as well as analyses of the effects of uncertainties in the data bases. These comparisons will improve confidence in the general results from such models. Similar analyses could also be more widely applied to dosimetry models. Models which have been developed to describe the movement of radionuclides through the environment can also be used in an appropriate fashion for stable elements.
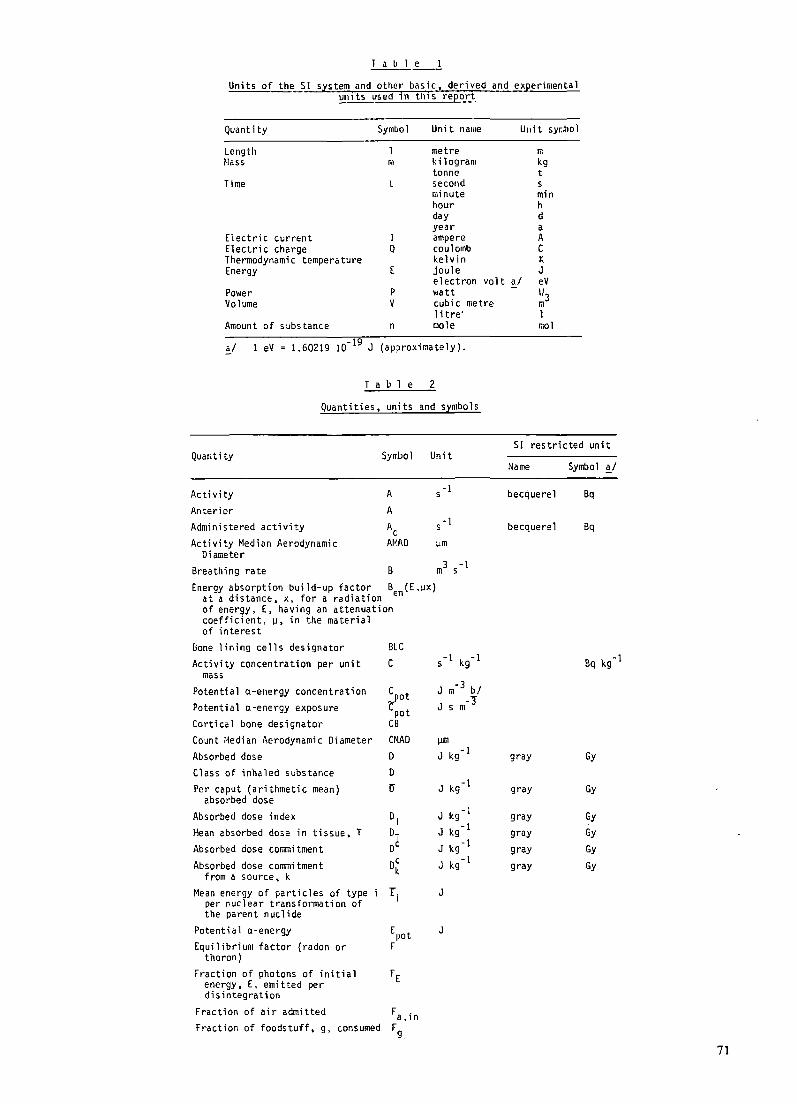
~-e __ l
Units of the SI sys tern and other basic, derived and experimental units used in this report
Quantity
Length Mass
Time
Electric current Electric charge Thermodynamic temperature Energy
Power Volume
Amount of substance
Symbol
m
t
I Q
E
p V
n
Unit name
metre kilogram tonne second minute hour day
Unit syr.;bol
m kg t s min h d
year a ampere A coulomb C kelvin K joule J electron volt a/ eV watt u3 cubic metre m 1 itre' 1 r.iole r.iol
a/ 1 eV = 1.60219 10-19 J (ap~roximately}.
T a b 1 e 2
Quantities, units and symbols
SI restricted unit Quantity Sy11.bol Unit
Activity A
Anterior A
Administered activity A 0
Activity Median Aerodynamic AMAD Diameter
Breathing rate B
Energy absorption build-up factor Ben(E,µx) at a distance, x, for a radiation of energy, E, having an attenuat'ion coefficient,µ, in the material of interest
Bone lining cells designator BLC
Activity concentration per unit C mass
Potential a-energy concentration Cpot Potential a-energy exposure 't'pot Cortical bone designator CB Count Medi an Aerodynamic Diameter Absorbed dose Class of inhaled substance Per caput (arithmetic mean)
absorbed dose
Absorbed dose index Mean absorbed dose in tissue, T Absorbed dose COlll11itment
Absorbed dose convnitment from a source, k
Mean energy of particles of type per nuclear transformation of the parent nuclide
Potential a-energy Equilibrium factor {radon or
thoron) Fraction of photons of initial
energy, E, emitted per disintegration
Fraction of air admitted Fraction of foodstuff, g, consumed
C~lAD D
D
IT
s·l
s·l
µm
m3 5-1
s-1 kg-1
J m- 3 b/ J s m-1
µm J kg-1
J kg-1
J kg-1 J kg-1
J kg-1
J kg-1
J
J
Name
becquerel
becquerel
gray
gray
gray gray
gray
gray
Symbol
Bq
Bq
Gy
Gy
Gy Gy Gy
Gy
a/
71
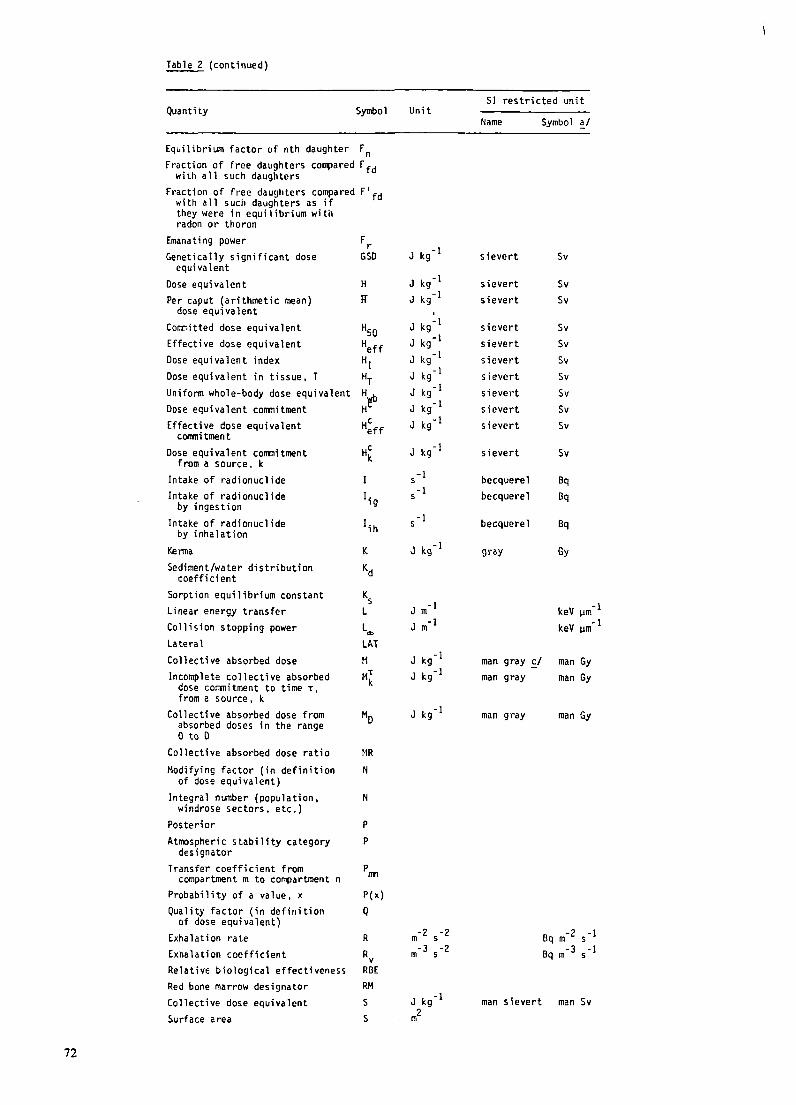
72
Table 2 (continued)
Quantity Symbol
Equilibrium factor of nth daughter Fn Fraction of free daughters compared Ffd
with all such daughters Fraction of free daughters compared F' fd
with all such daughters as if they were in equilibrium wi til radon or thoron
Emanating power Genetically significant dose
equivalent
Dose equivalent Per caput (arithmetic mean)
dose equivalent
Co11111itted dose equivalent Effective dose equivalent Dose equivalent index
Dose equivalent in tissue, T
Uniform whole-body dose equivalent Dose equivalent corrmitment Effective dose equivalent
commitment
Dose equivalent corrmitment from a source, k
Intake of radionuclide Intake of radionuclide
by ingestion
Intake of radionuclide by inhalation
Kerma
H
IT
K
Sediment/water distribution Kd coefficient
Sorption equilibrium constant Linear energy transfer Collision stopping power
La tera 1
Collective absorbed dose Incomplete collective absorbed
dose corrmitment to time,, from a source, k
Collective absorbed dose from absorbed doses in the range 0 to D
LAT
H
M' k
Collective absorbed dose ratio MR
Modifying factor (in definition N of dose equivalent)
Integral number (population, N windrose sectors, etc.)
Posterior P
Atmospheric stability category P designator
Transfer coefficient from Pl!Yl compartment m to compartment n
Probability of a value, x P(x) Quality factor (in definition Q
of dose equivalent) Exhalation rate R
Exhalation coefficient Rv Relative biological effectiveness RBE Red bone marrow designator
Collective dose equivalent Surface area
RM
s s
Unit
J kg-1
J kg -1
J kg-1
J kg-1 J kg-1
J kg-1
J kg-1 J kg-I J kg-1 J kg-I
J kg-1
J kg-1
J kg-I J kg-1
J kg-1
m2
SI restricted unit
Name Symbol a/
s ievert
sievert s ievert
sieve rt sievert s ievert
sieve rt sievert sieve rt sievert
sievert
becquerel becquerel
becquerel
gray
Sv
Sv Sv
Sv
Sv Sv Sv
Sv Sv Sv
Sv
Bq Bq
Bq
Gy
man gray ::/ man Gy man gray man Gy
man gray man Gy
Bq m-2 s-l Bq m- 3 s -l
man sievert man Sv
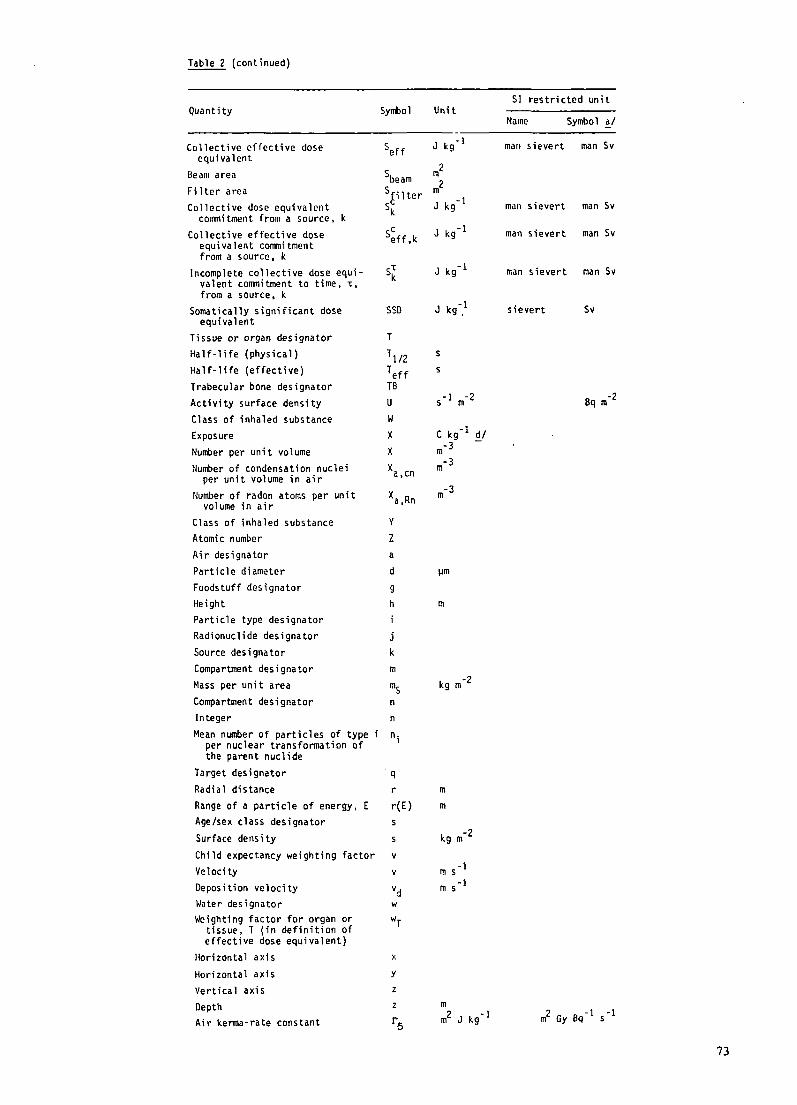
Table 2 (continued)
Quantity
Collective effective dose equivalent
Beam area Filter area Collective dose equivalent
commitment from a source, k
Collective effective dose equivalent colll!litment from a source, k
Incomplete collective dose equivalent commitment to time,,, from a source, k
Somatically significant dose equivalent
Tissue or organ designator Half-life (physical) Half-life (effective) Trabecular bone designator Activity surface density Class of inhaled substance Exposure Nunt>er per unit volume Number of condensation nuclei
per unit volume in air Number of radon atoms per unit
volume in air Class of inhaled substance Atomic number Air designator Particle diameter Foodstuff designator Height Particle type designator Radionuclide designator
Source designator Compartment designator Mass per unit area Compartment designator
Symbol
s• k
SSD
T
\12 Teff TB
u w X
X
y
z a d
g
h
j
k
m
Integer n
Mean number of particles of type ni per nuclear transfonnation of the parent nuclide
Target designator q Radial distance r Range of a particle of energy, E r(E) Age/sex class designator s
Surface density s Child expectancy weighting factor v Velocity v Deposition velocity vd Water designator w Weighting factor for organ or wT
tissue, T (in definition of effective dose equivalent)
Horizontal axis x
Horizontal axis Y Vertical axis z Depth Air kenna-rate constant
Unit
J kg-1
m2 m2 J kg-1
J kg-1
J kg-1
s s
µm
m
m
m
SI restricted unit
Name Symbol~/
man sievert man Sv
man sievert man Sv
man sievert man Sv
man sievert man Sv
s ievert Sv
73
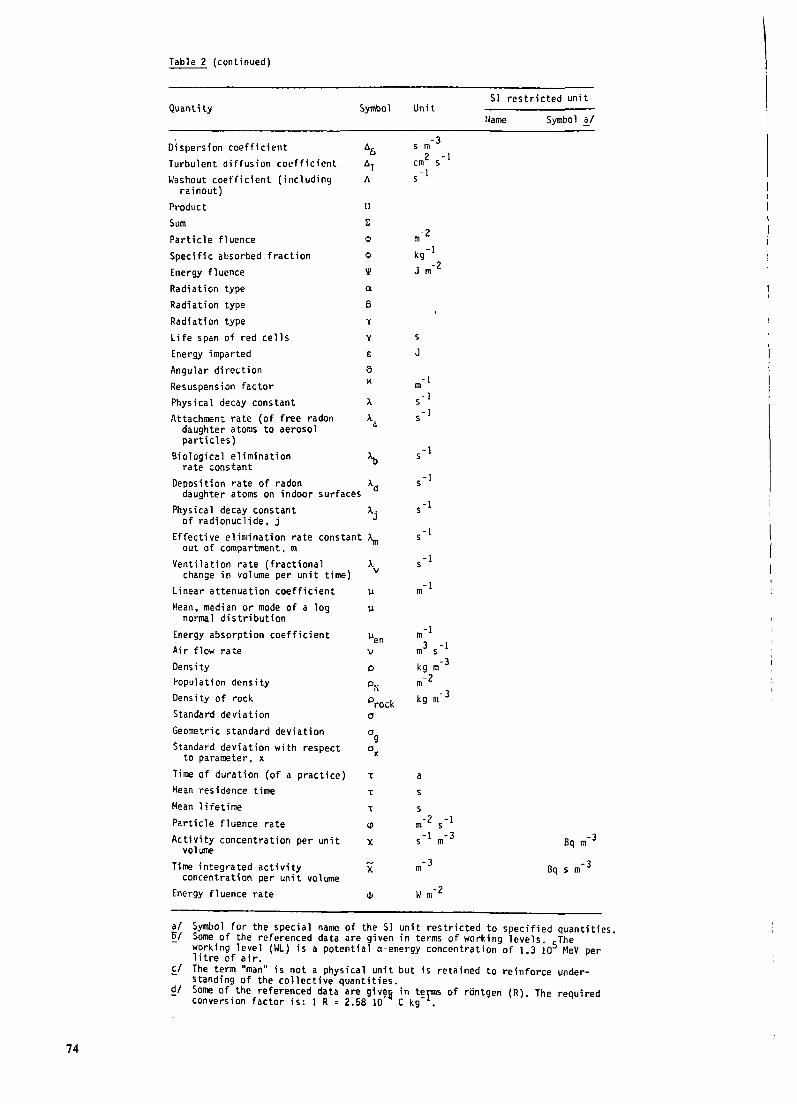
74
Table 2 (continued)
Quantity
Dispersion coefficient Turbulent diffusion coefficient Washout coefficient (including
rainout) Product Sum Particle fluence Specific absorbed fraction Energy f1 uence Radiation type Radiation type Radiation type Life span of red cells Energy imparted Angular direction Resuspension factor Physical decay constant Attachment rate (of free radon
daughter atoms to aerosol particles)
Biological elimination rate constant
Symbol
a
6 y
y
£
a l(
Deposition rate of radon Ad daughter atoms on indoor surfaces
Physical decay constant of radionuclide, j
Effective elimination rate constant Am out of compartment, m
Ventilation rate (fractional Av change in volume per unit time)
Linear attenuation coefficient u Mean, median or mode of a log u
normal distribution Energy absorption coefficient Air flow rate Density ropulation density Density of rock Standard deviation
Geometric standard deviation Standard deviation with respect
to parameter, x
Time of duration (of a practice) Mean residence time Mean lifetime Particle fluence rate Activity concentration per unit
volume
Time integrated activity concentration per unit volume
Energy fluence rate
T
T
T
(I)
X
X
Unit
s
J
-1 m 3 -1 m s
-3 kg m m-2
kg m- 3
a s
s -2
m s-1
-1 s -3 m
SI restricted unit
flame Symbol ~/
a/ Symbol for the special name of the SI unit restricted to specified quantities, TS/ Some of the referenced data are given in terms of working levels.
5The
working level (WL) is a potential a-energy concentration of 1.3 10 MeV per litre of air.
c/ The term "man" is not a physical unit but is retained to reinforce understanding of the collective quantities.
d/ Some of the referenced data are giv~ij in t~pns of rontgen (R). The required conversion factor is: 1 R = 2.58 ID C kg •
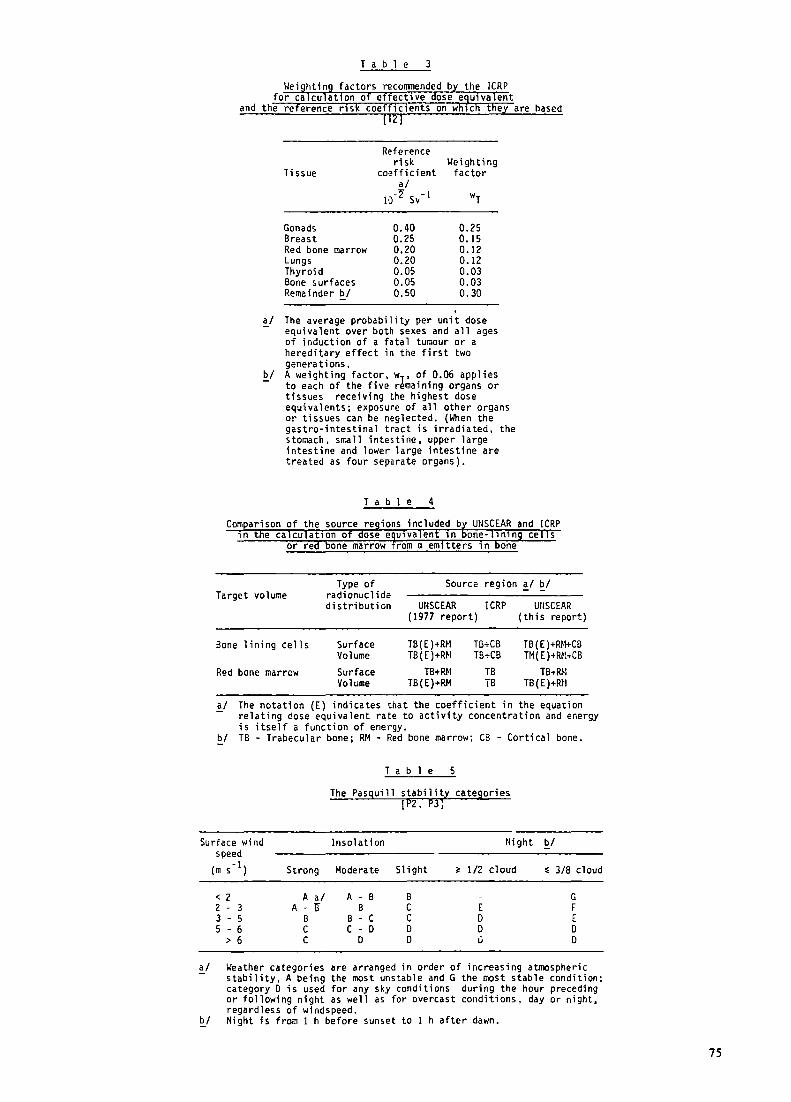
Table 3
Weighting factors recommended by the ICRP for calculation of effective dose e9uivalent
and the reference risk coefficients on whtch the are based
Tissue
Gonads Breast Red bone marrow Lungs Thyroid Bone surfaces Remainder b/
Reference risk
coefficient a/
1/2" Sv-l
0.40 0.25 0.20 0.20 0.05 0.05 0.50
Weighting factor
0.25 0.15 0.12 0.12 0.03 0.03 0.30
a/ The average probability per unit dose equivalent over both sexes and all ages of induction of a fatal tumour or a hereditary effect in the first two generations.
b/ A weighting factor, wT, of 0.06 applies to each of the five remaining organs or tissues receiving the highest dose equivalents; exposure of all other organs or tissues can be neglected. (When the gastro-intestinal tract is irradiated, the stomach, small intestine, upper large intestine and lower large intestine are treated as four separate organs).
Table 4
Comparison of the source regions included by UNSCEAR and ICRP ,n the calcuiat,on of dose e u,valent 1n bone-l1n1n cells
or re one marrow rom a em tters ,n one
Type of Source region a/ b/ Target volume radionuclide
distribution UHSCEAR ICRP UIISCEAR ( 1977 report) (this report)
9one lining cells Surface TB(E)+RM TB+CB TB(E)+RM+CB Volume TB(E)+RM TB+CB TM(E)+RM+CB
Red bone marrow Surface TB+RM TB TB-.RM Volume TB(E)+RM TB TB(E)+RII
a/ The notation (E) indicates that the coefficient in the equation relating dose equivalent rate to activity concentration and energy is itself a function of energy.
b/ TB - Trabecular bone; RM - Red bone marrow; CB - Cortical bone.
T a b 1 e 5
The Pasgui 11 stabi 1 ity categories [J:i2, 153]
Surface wind lnsolation Night £.I
a/
speed (m s- 1) Strong Moderate Slight ~ 1/2 cloud " 3/8 cloud
< 2 A a/ A - B B G 2 - 3 A - B B C E F 3 - 5 B B - C C D E 5 - 6 C C - D D D D
> 6 C D D IJ D
Weather categories are arranged in order of increasing atmospheric stability, A being the most unstable and G the most stable condition; category Dis used for any sky conditions during the hour preceding or following night as well as for overcast conditions, day or night, regardless of windspeed. Night is from 1 h before sunset to 1 h after dawn.
75
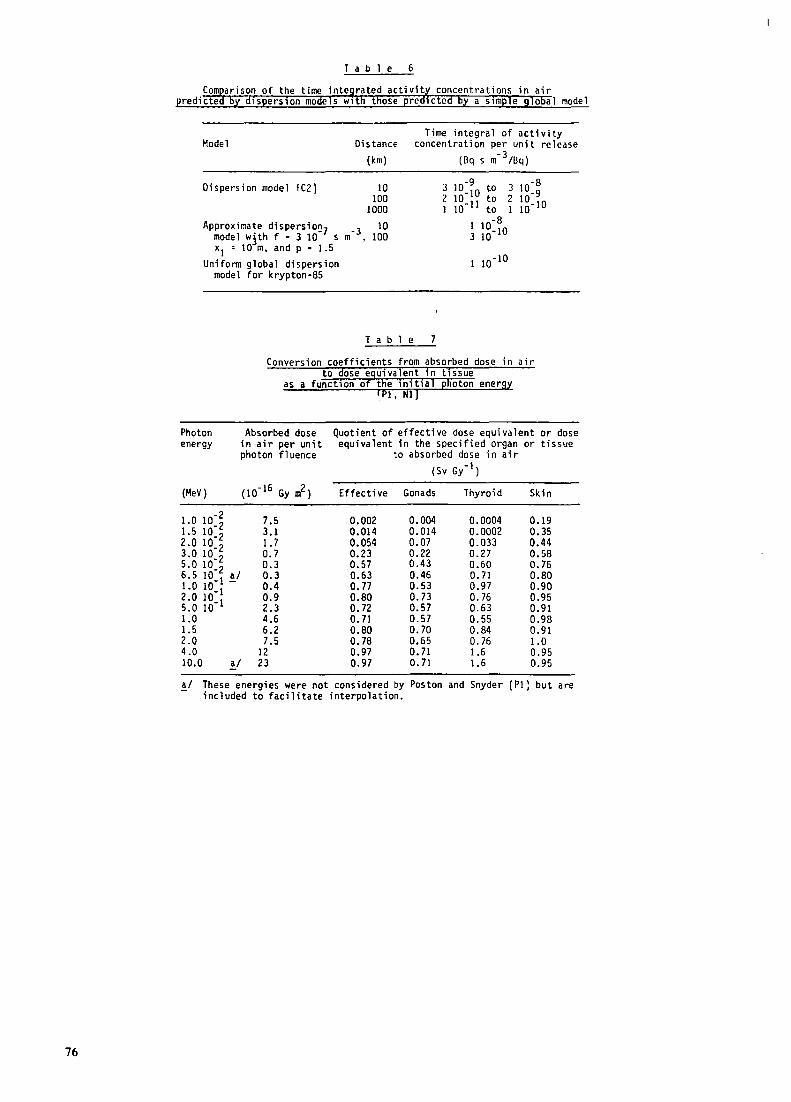
76
model
Hodel Time integral of activity
Distance concentration per unit release
Dispersion mode 1 IC2)
Approximate dispersion7 model w!th f = 3 10- s
x1 = 10 m, and p = 1 . 5 Uniform global dispersion
model for krypton-85
(km) (Bq s m- 3/Bq)
10 100
1000 10
m- 3 , 100
Table 7
-9 3 10_ 10 to 3 2 10 to 2 l 10- 11 to l
-8 1 10_10 3 10
10-10
Conversion coefficients from absorbed dose in air to dose equivalent in t1ssue
as a function of the 1n1t1al photon energy I P1. Nl l
Photon Absorbed dose Quotient of effective dose equivalent or dose energy in air per unit equivalent in the specified organ or tissue
photon f1 uence to absorbed dose in air (Sv Gy-l)
(MeV) {l0- 16 Gy m2) Effective Gonads Thyroid Skin
-2 7.5 0.002 0.004 0.0004 0.19 1.0 10_2 1.5 10_2 3.1 0.014 0.014 0.0002 0.35 2 .0 10_2 1. 7 0.054 0.07 0.033 0.44 3.0 10_2 0.7 0.23 0.22 0.27 0.58 5.0 10_2 0.3 0.57 0.43 0.60 0.76 6. 5 10 _ 1 2_/ 0.3 0.63 0.46 0. 71 0.80 1.0 10_ 1 0.4 0.77 0.53 0.97 0.90 2.0 10_1 0.9 0.80 0.73 0. 76 0.95 5.0 10 2.3 0.72 0.57 0.63 0.91 1.0 4.6 0.71 0.57 0.55 0.98 1.5 6.2 0.80 0.70 0.84 0.91 2.0 7.5 0.78 0.65 0. 76 1.0 4.0 12 0.97 0.71 1.6 0.95 10.0 a/ 23 0.97 0.71 1.6 0.95
a/ These energies were not considered by Poston and Snyder [P1: but are included to facilitate interpolation.
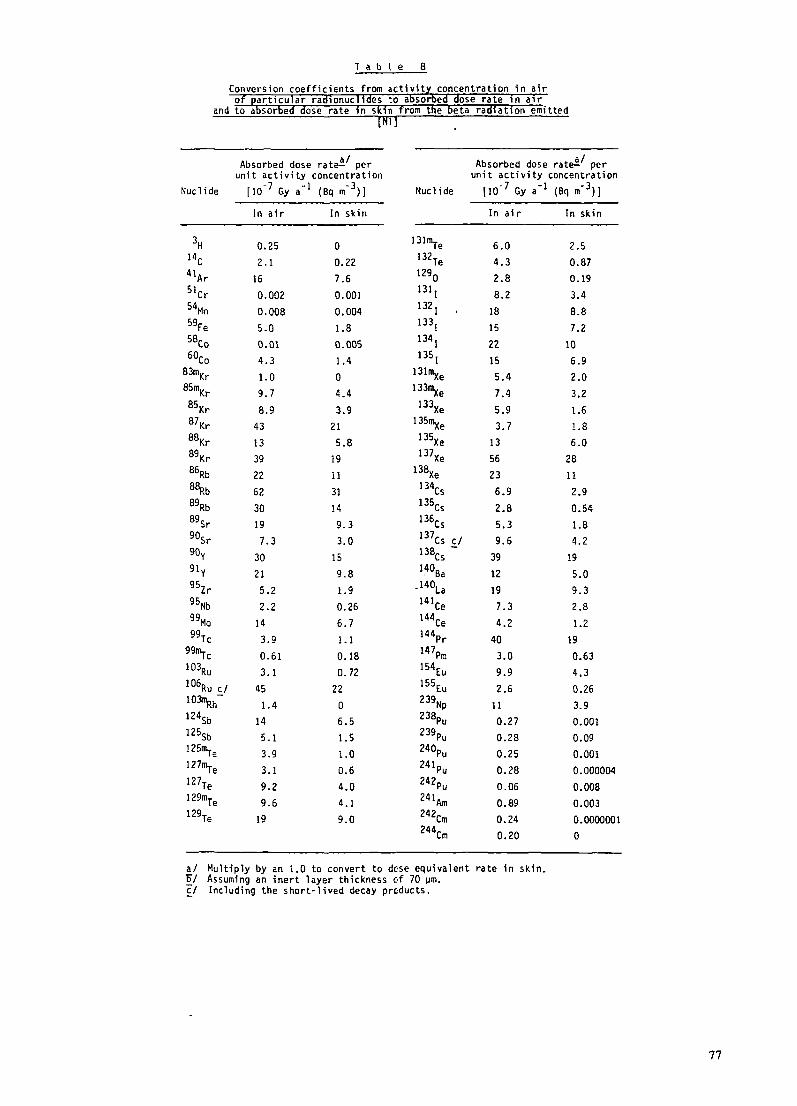
1 a b I e 8
raa{ation emitted
Absorbed dose rate~_/ per Absorbed dose rat~/ per unit activity concentration unit activity concentration
Nuclide [I0- 7 Gy a-I (Bq m- 3)] Nuclide (I0- 7 Gy a-l (Bq m- 3)]
In air In skin In air In skin
3H 0.25 0 131mTe 6.0 2.5 14c 2.1 0.22 132Te 4.3 0.87 41Ar 16 7.6 1290 2.8 0.19 51cr 0.002 0.001 1311 8.2 3.4 54Mn 0.008 0.004 132 r 18 8.8 59Fe 5.0 1.8 1331 15 7.2 58co 0.01 0.005 1341 22 10 60co 4.3 1.4 1351 15 6.9
83mKr 1. 0 0 13lrnxe 5.4 2.0 85mKr 9.7 4.4 133rnxe 7.4 3.2 85Kr 8.9 3.9 133Xe 5.9 1.6 87Kr 43 21 l 35f11xe 3.7 1.8 88Kr 13 5.8 135xe 13 6.0 89Kr 39 19 137Xe 56 28 86Rb 22 11 138xe 23 11 88Rb 62 31 134cs 6.9 2.9 89Rb 30 14 13Scs 2.8 0.54 89Sr 19 9.3 136cs 5.3 1.8 90sr 7.3 3.0 137cs sJ 9.6 4.2 90y 30 15 138Cs 39 19 9ly 21 9.8 140Ba 12 5.0 95zr 5.2 1.9 .140La 19 9.3 95Nb 2.2 0.26 14lce 7.3 2.8 99Mo 14 6.7 144ce 4.2 1.2 99Tc 3.9 1.1 144Pr 40 19
99",-c 0.61 0.18 147Pm 3.0 0.63 103Ru 3.1 0. 72 154Eu 9.9 4.3 106Ru c/ 45 22 155Eu 2.6 0.26 lO~h- 1.4 0 239Np 11 3.9 1245b 14 6.5 238Pu 0.27 0.001 125Sb 5.1 1. 5 239Pu 0.28 0.09 125~e 3.9 l.O 240Pu 0.25 0.001 127~e 3.1 0.6 241Pu 0.28 0.000004 127Te 9.2 4.0 242Pu 0.06 0.008 129mTe 9.6 4.1 241Am 0.89 0.003 129Te 19 9.0 242cm 0.24 0.0000001
244cm 0.20 0
a/ Multiply by an 1.0 to convert to dose equivalent rate in skin. 'fj/ Assuming an inert layer thickness of 70 µm. ""f./ Including the short-1 ived decay prc:ducts.
77
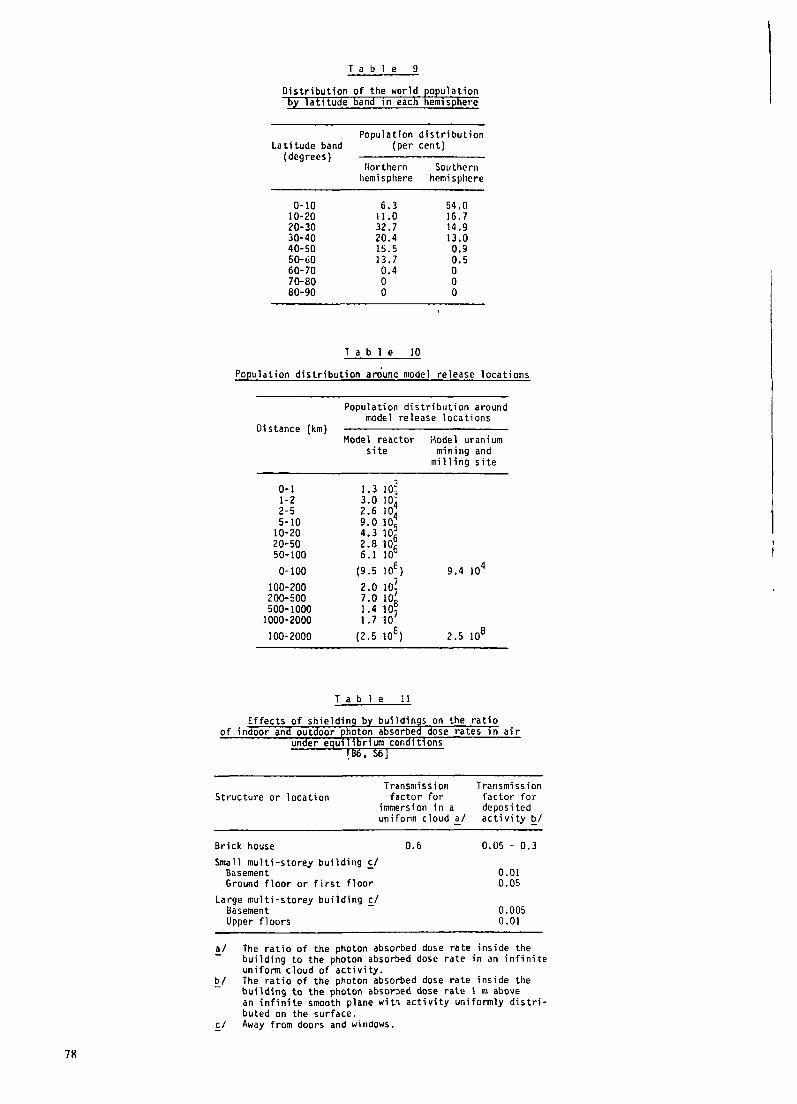
78
La ti tudc band (degrees)
0-10 10-20 20-30 30-40 40-50 50-60 60-70 70-80 80-90
Table 9
Population distribution (per cent)
llorthern hemisphere
6.3 11.0 32.7 20.4 15.5 13.7 0.4 0 0
T a b l e 10
Southern hemisphere
54.0 16.7 14 .9 13.0 0.9 0.5 0 0 0
Population distribution around model release locations
Distance (km)
0-1 1-2 2-5 5-10
10-20 20-50 50-100 0-100
100-200 200-500 500-1000
1000-2000
100-2000
Population distribution around model release locations
Model reactor Model uranium site m1n1ng and
I. 3 10; 3.0 104 2.6 104 9. 0 105 4. 3 106 2 .8 106 6.1 10
(9.5 106} i
2 .0 lOi 7.0 108 1.4 lOi 1. 7 10
(2.5 108)
Table 11
milling site
9 .4 104
2 .5 108
Effects of shielding by buildings on the ratio of indoor and outdoor ehoton absorbed dose rates 1n air
under egu1l1br1um conditions ~86. S6)
Structure or location Transmission
factor for immersion in a uniform cloud 2._/
Transmission factor for deposited activity~/
Brick house 0.6 0.05 - 0.3
0.01 0.05
Small multi-storey building c/ Basement Ground floor or first floor
Large multi-storey building c/ Basement -
a/
_t:/
c/
Upper fl oars 0.005 0.01
The ratio of the photon absorbed dose rate inside the building to the photon absorbed dose rate in an infinite unifonn cloud of activity. The ratio of the photon absorbed dose rate inside the building to the photon absor~ed dose rate 1 m above an infinite smooth plane wit~ activity unifonnly distributed on the surface. Away from doors and windows.
REFERENCES
Al Adams, N., Il.W. Hunt and J.A. Rcissland. Annual limits of intake of radionuclidcs for workers. NRPB-R82 (1978).
A2 A~spaugh, L.R., J.H. Shinn, P.L. Phelps et al. Resuspension and redistribution of plutonium in soils. Health Phys. 29: 571-582 (1975).
Bl Benne~ B.G. Estimation of gonadal absorbed dose due to environmental gamma radiation. Health Phys. 19: 757-767 (1970).
B2 Berman, M. Kinetic models for absorbed dose calculation. Medical Internal Radiation Dose Committee. MIRO Pamphlet No. 12. Society of Nuclear Medicine (1977).
B3 Baker, D.A., G.R. Hoenes and J.K. Soldat. FOOD: An interactive code to calculate internal radiation doses from contaminated food products. BNWL-B-452 (1976).
B4 Booth, R.S., S.V. Kaye and P.S. Rohwer. A systems analysis methodology for predicting dose to man from a radioactive contaminated terrestrial environment. Proceedings of the Third Symposium on Radioecology. CONF-710501 (1971).
B5 Beck, H.L. The physics of environmental gamma fields. p. 101-134 in: The Natural Radiation Environment II (J.A.S. Adams, W.M. Lowder and T.F. Gesell, eds.). CONF-720805-P2 (1972).
B6 Burson, Z.G. and A.E. Profio. Structure shielding in reactor accidents. Health Phys. 33: 287-299 (1977).
B7 Burkholder, H.C .. M.O. Cloninger, D.A. Baker et al. Incentives for partitioning high-level waste. BNWL-1927 (1975).
B9 Bayer, A. The radiological exposure of the population in the Rhine-Meuse region by nuclear installations during normal operation. CEC Doc. No. V/1647/77 (1978).
810 Bennett, B.G. Environmental aspects of americium. EML-348 (1978).
Cl Clarke, R.H. The relationship between doses to human body organs and exposure in a cloud of gamma emitting nuclides. RD/B/N 3862 (1976).
C2 Clarke, R.H. A model for short and medium range dispersion of radionuclides released to the atmosphere. First Report of a Working Group on Atmospheric Dispersion. NRPB-R91 (1979).
C3 Clarke, R.H. and H. Smith. Calculation of the incidence of stochastic health effects in irradiated populations. NRPB-R102 (1980).
01 Delmas, J., R. Disdier, A. Grauby, et al. Radiocontamination experimentale de quelques especes cultivees soumises a !'irrigation par aspersion. Proc. Int. Symp. on Radioecology. CEN, Cadarache, France, 1969.
D2 Delmas, J., A. Grauby and R. Disdier. Etudes experimentales sur le transfert dans Jes cultures de quelques radionucleides presents dans les efnuents des centrales electronucleaires. p. 321-322 in: Environmental Behaviour of Radionuclides Released in the Nuclear Industry. IAEA, Vienna, 1973.
Fl Federal Republic of Germany. General principles of calculation for the determination of radiation exposure resulting from the release of airborne radioactive efnuents. Recommendations of the Radiation Protection Commission. KOln, FRG, 1977.
F2 Fletcher, J.F. and W.L. Dobson. HERMES: A digital computer code for estimating regional radiological effects from the nuclear power industry. HEDL-TME-71-168 (1971).
G 1 Gifford, F.A. Turbulent diffusion-typing schemes: a review. Nucl. Saf. I: 68-86 (1976).
G3 Gifford, F.A. Statistical properties of a fluctuating plume dispersion model. Adv. Geophys. 6: 117-137 (1959).
HI Hoffman, F.O., D.L. Shaeffer, C.W. Miller et al. Proceedings of a Workshop on the Evaluation of Models Used for the Environmental Assessment of Radionuclide Releases. CONF-770901 (1977).
H2 Hoffman, F.O., C.W. Miller, D.L. Shaeffer et al. A compilation of documented computer codes applicable to environmental assessment of radioactivity releases. ORNL/TM-5830 (1977).
H3 Heffler, J.L. and A.O. Taylor. A regional-continental scale transport, diffusion and deposition model, part 1: Trajectory model. Air Resources Laboratories report ERL-ARL-50 (1975).
H4 Healy, J.W. A proposed interim standard for plutonium in soils. LA-5483-MS (1974).
HS Healy, J.W. Examination of the pathways from soil to man for plutonium. LA-6741-MS (1977).
H6 Horst, T. W. The estimation of air concentrations due to the suspension of surface contamination by wind. BNWL-2047 (1976).
1-:17 Hill, M.D. and P.D. Grimwood. Preliminary assessment of the radiological protection aspects of disposal of high-level waste in geologic formations. NRPB-R69 (1978).
H8 Hoffman, F.O., C.W. Miller, D.L. Shaeffer et al. An evaluation of uncertainties in radioecological models. Presented at 12th Annual Symposium of German-Swiss Fachverband filr Strahlenschutz. Nordemey, FRG, October 1978.
H9 Hoffman, F.O. and C.F. Baes. A statistical analysis of selected parameters for predicting food chain transport and internal dose of radionuclides. ORNL/NUREG/ TM-282 (1979).
HlO Hill, M.D. Analysis of the effect of variations in parameter values on the predicted radiological consequences of geologic disposal of high-level waste. NRPB-R86 (1979).
12 International Commission on Radiological Protection. Recommendations of the International Commission on Radiological Protection. ICRP Publication 26. Annals of the ICRP 1: No. 3 (1977).
14 International Commission on Radiological Protection. Limits for Intakes of Radionuclides by Workers. ICRP Publication 30, Part 1. Annals of the ICRP 2: No. 3/4 (1979).
15 International Commission on Radiological Protection. Problems Inolved in Developing an Index of Harm. ICRP Publication 27. Annals of the ICRP 1: No. 4 (1977).
16 International Commission on Radiological Protection. Report of the Task Group on Reference Man. A report prepared by a task group of Commitee 2. ICRP Publication 23. Pergamon Press, Oxford, 1975.
17 International Commission on Radiological Protection. Radionuclide Release into the Environment: Assessment of Doses to Man. ICRP Publication 29. Annals of the ICRP 2: No. 2 (1979).
18 International Atomic Energy Agency. The oceanographic basis of the IAEA revised definition and recommendations concerning high-level radioactive waste unsuitable for dumping at sea. IAEA Technical Document IAEA-210. Vienna, 1978.
19 International Commission on Radiation Units and Measurements. Radiation quantities and units. ICRU Report 33 (1980).
79
110 International Commission on Radiation Units and Measurements. Methods of assessment of absorbed dose in clinical use of radionuclides. ICRU Report 32 ( 1979).
111 International Commission on Radiological Protection. Limits for Intakes of Radionuclides by Workers. ICRP Publication 30, Part 2. Annals of the ICRP 4: No. 3/4 (1980).
112 International Nuclear Fuel Cycle Evaluation (JNFCE). Release consequence analysis for a hypothetical geological radioactive waste repository in hard rock. INFCE/DEP/WG7/21. IAEA, Vienna, 1979.
113 International Union of Pure and Applied Physics. Symbols, units and nomenclature in physics. Physica 93A: 1~0 (1978).
Jl Jones, A.R. Proposed calibration factors for various dosimeters at different energies. Health Phys. 12: 663~71 (1966).
J2 Jacobi, W. and K. Andre. The vertical distribution of radon-222, radon-220 and their decay products in the atmosphere. J. Geophys. Res. 68: 3799-3814 (1963).
J3 Jones, J.A. ESCLOUD: A computer programme to calculate the air concentration, desposition rate and external dose rate from a continuous discharge of radioactive material to atmosphere. NRPB-R10I (1980).
Kl Killough, G.C. and L.R. McKay. A methodology for calculating radiation doses from radioactivity released to the environment. Oak Ridge National Laboratory report ORNL-4992 (1976).
K2 Karnbranslesakerhet (KBS). Handling of spent nuclear fuel and final storage of vitrified high-level reprocessing waste. Karnbranslesakerhet Project, Sweden, 1977.
K3 Kramer, R. Ermittlung von Konversionsfaktoren zwischen Korperdosen und relevanten Strahlungskenngrossen bei externer Rontgen- und Gammastrahlung. GSF report S-556 (1979).
K4 Kramer, R. and G. Drexler. Determination of dose equivalent for external irradiation of occupationally exposed personnel. IAEA Regional Seminar on Reducing Occupational Exposures to the Lowest Reasonably Achievable Levels. Athens, Greece (1979).
KS Kramer R. and G. Drexler. Dose equivalent conversion factors for external photon irradiation. Vth International Congress of the JRPA, Jerusalem (1980).
Lt Loevinger, R. and M. Berman. A schema for absorbeddose calculations for biologically-distributed radionuclides. Medical Internal Radiation Dose Committee. MIRO Pamphlet No. 1. Society of Nuclear Medicine (1968).
L2 Linsley, G.S. Resuspension of the transuranium elements - a review of existing data. NRPB-R75 (1978).
L3 Lester, D.H.. G. Jansen and H.C. Burkholder. Migration of radionuclide chains through an absorbing medium. BNWL-SA-5079 (1974).
Ml Mcgaw, W.J. The penetration of iodine imo buildings. Int. J. Air and Water Pollution, 6: 121 (1962).
M2 Martin, J.A., Jr., C. Robbinson, C.B. Nelson et al. A computer code (RVRDOS) to calculate population doses from radioactive liquid efnuents and an application to nuclear power reactors on the Mississippi. ORP/EAD-76-4 (1976).
M3 Miller, C.W., D.E. Dunning, Jr., J.T. Ensminger et al. The evaluation of models used for the assessment of radionuclide releases to the environment. ORNL-5382 (1978).
M4 McKay, M.D. and L.A. Bruckner. On the statistical analysis of an output of a large computer code as a function of the inputs (W.L. Nicholson and J.L. Harris, eds.). BNWL-1986 (1976).
Nl National Radiological Protection Board jointly with Commissariat a J'Energie Atomique France. Methodology for evaluating the radiological consequences of radioactive eflluents released in normal operations. CEC Doc. No. V /3865/79 (1979).
80
N3 National Academy of Sciences. Radioactivity in the marine environment. Report of the Panel on Radioactivity in the Marine Environment of the Committee on Oceanography (1971).
N4 National Academy of Sciences. Committee on the Biological Effects of Ionizing Radiations (DEIR). The Effects on Populations of Exposure to Low Levels of Ionizing Radiation. National Academy Press, Washington, D.C., 1980.
01 O'Brien, K. and R. Sanna. The effects of the malefemale body size difference on absorbed dose rate distributions in humans from natural gamma rays. Health Phys. 34: 107-112 (1978).
02 O'Brien, K. and R. Sanna. The distribution of absorbed dose rates in humans from exposure to environmental gamma rays. Health Phys. 30: 71-78 (1976).
PJ Poston, J.W. and W.S. Snyder. A model for exposure to a semi-infinite cloud of a photon emitter. Health Phys. 26: 287-293 (1974).
P2 Pasquill, F. Atmospheric Diffusion, 2nd edition. Wiley, 1974.
P3 Pasquill, F. The estimation of the dispersion of windborne material. Meteorol. Mag. 90: 33-49 (1961).
P4 Page, C.H. and P. Vigoureux (eds.). SI, The International System of Units: Translation approved by the International Bureau of Weights and Measures. National Physical Laboratory (1977).
PS Pattenden, N.J., R.S. Cambray, K. Playford et al. Atmospheric measurements on radionuclides previously discharged to sea. p. 201-221 in: Impacts of Radionuclide Releases into the Marine Environment, Vienna, 1980.
Rl Robinson, J.P. and P.A. Convene. Summary of U.S. time use survey. Institute for Social Research, Ann Arbor, University of Michigan. 1966.
SI Spiers, F.W. and T.R. Overton. Attenuation factors for certain tissues when the body is exposed to nearly omni-directional gamma radiation. Phys. Med. Biol. 7: 35-43 (1962).
S3 Start, G.E. and L.L. Wendell. Regional effluent dispersion calculations considering spatial and temporal meteorological variation. Air Resources Laboratories report ERL-ARL-44 (1974).
S4 Sutton, K.J. A theory of eddy diffusion in the atmosphere. Proc. R. Soc. (London), Ser. A. 135: 143 (1932).
S5 Soldat, J.K., N.M. Robinson and D.M. Baker. Models and computer codes for evaluating environmental radiation doses. BNWL-1754 (1974).
S6 Stewart, N.G., J.M. Chisholm, R.N. Crooks et al. The shielding provided by a brick house against the gamma radiation from a uniformly deposited source. Experiments with Cobalt-60. AERE HP/R 1782 (1955).
S7 Stewart, N.G., R.N. Crooks and E.M.R. Fisher. The radiological dose to persons in the U.K. due to debris from nuclear test explosions. AERE HP/R 1701 (1955).
SS Schneider, K.J. and A.M. Platt (eds). High-level radioactive waste management alternatives. BNWL-1900 (1974).
Sl 1 Schaeffer, R. Consequences du deplacement des sediments sur la dispersion des radionucleides, p. 263-276 in: Impact of Nuclear Releases into the Aquatic Environment. IAEA Vienna, 1975.
SI2 Shaeffer, D.L. A model evaluation methodology appli-cable to environmental assessment models. ORNL-5507 (1979).
S13 Shaeffer, D.L. and F.O. Hoffman. Uncertainties in radiological assessments - a statistical analysis of radioiodine transport via the pasture-cow-milk pathway. Nucl. Technol. 45: 99-106 (1979).
S14 Spiers, F.W. Radioisotopes in the human body: physical and biological aspects. Academic Press, 1968.
S15 Spiers, F.W. Manual on Radiation Haematology. A joint undertaking by IAEA and WHO. !AEA Technical Report No. 123 (1971).
Ul United Nations. Sources and Effects of Ionizing Radiation. United Nations Scientific Committee on the Effects of Atomic Radiation 1977 report to the General
U2
U3
U4
U5
U6
Assembly, with annexes. United Nations publication (Sales No. E. 77. IX.I), New York, 1977.
United Nations. Report of the United Nations Scientific Committee on the Effects of Atomic Radiation to the General Assembly, with annexes. Volume I: Levels, Volume II: Effects. United Nations publication (Sales Nos. E.72.IX.17 and 18), New York, 1972.
United Nations. Report of the United Nations Scientific Committee on the Effects of Atomic Radiation. Official Records of the General Assembly, Twentyfourth Session, Supplement No. 13 (A/7613). New York, 1969.
United States Nuclear Regulatory Commission. Calculation of annual doses to man from routine releases of reactor effiuents for the purpose of evaluating compliance with 10 CFR Part 50, Appendix I. ~.S. Nuclear Regulatory Commission Regulatory Guide 1.109 (1977).
United States Nuclear Regulatory Commission. Methods for estimating atmospheric transport and dispersion of gaseous efnuents in routine releases from light-water-cooled reactor. U.S. Nuclear Regulatory Commission Regulatory Guide 1.111 (1977).
United States Nuclear Regulatory Commission.
U7
us
U9
Vl
YI
Y2
Estimating aquatic dispersion of effiuents from accidental and routine reactor releases for the purpose of implementing Appendix I. U.S. Nuclear Regulatory Commission Regulatory Guide 1.113 (1977).
United States Nuclear Regulatory Commission. Reactor safety study - an assessment of accidental risks in U.S. commercial nuclear power plants. WASH-1900, Appendix VI, E-13. (1975).
United States Environmental Protection Agency. Proposed guidance on dose limits for persons exposed to transuranium elements in the general environment. EPA 520/4-77-016 (1977).
United Nations Scientific Committee on the Effects of Atomic Radiation. Unpublished calculations (1981).
Vogt, KJ. Empirical investigations of the diffusion of waste air plumes in the atmosphere. Nucl. Technol. 34: 43-57 ( 1977).
Yotsukura, N. and E.D. Cobb. Transverse diffusion of solutes in natural streams. U.S. Geological Survey, Professional Paper 582-C (1972).
Yotsukura, N. and W.W. Sayre. Transverse mixing in natural channels. Water Resour. Res. 12: 695 (1976).
81