iop publishing methanol, ethanol and hydrogen sensing –pt) the
TRANSCRIPT
IOP PUBLISHING NANOTECHNOLOGY
Nanotechnology 23 (2012) 175501 (12pp) doi:10.1088/0957-4484/23/17/175501
Methanol, ethanol and hydrogen sensingusing metal oxide and metal (TiO2–Pt)composite nanoclusters on GaNnanowires: a new route towards tailoringthe selectivity of nanowire/nanoclusterchemical sensorsGeetha S Aluri1,2, Abhishek Motayed1,3, Albert V Davydov1,Vladimir P Oleshko1, Kris A Bertness4, Norman A Sanford4 andRao V Mulpuri2
1 Material Measurement Laboratory, National Institute of Standards and Technology, Gaithersburg,
MD 20899, USA2 Department of Electrical and Computer Engineering, George Mason University, Fairfax, VA 22030,
USA3 Institute for Research in Electronics and Applied Physics, University of Maryland, College Park,
MD 20742, USA4 Physical Measurement Laboratory, National Institute of Standards and Technology, Boulder,
CO 80305, USA
E-mail: [email protected] and [email protected]
Received 21 November 2011, in final form 6 March 2012
Published 5 April 2012
Online at stacks.iop.org/Nano/23/175501
AbstractWe demonstrate a new method for tailoring the selectivity of chemical sensors using
semiconductor nanowires (NWs) decorated with metal and metal oxide multicomponent
nanoclusters (NCs). Here we present the change of selectivity of titanium dioxide (TiO2)
nanocluster-coated gallium nitride (GaN) nanowire sensor devices on the addition of platinum
(Pt) nanoclusters. The hybrid sensor devices were developed by fabricating two-terminal
devices using individual GaN NWs followed by the deposition of TiO2 and/or Pt nanoclusters
(NCs) using the sputtering technique. This paper present the sensing characteristics of
GaN/(TiO2–Pt) nanowire–nanocluster (NWNC) hybrids and GaN/(Pt) NWNC hybrids, and
compare their selectivity with that of the previously reported GaN/TiO2 sensors. The
GaN/TiO2 NWNC hybrids showed remarkable selectivity to benzene and related aromatic
compounds, with no measurable response for other analytes. Addition of Pt NCs to GaN/TiO2
sensors dramatically altered their sensing behavior, making them sensitive only to methanol,
ethanol and hydrogen, but not to any other chemicals we tested. The GaN/(TiO2–Pt) hybrids
were able to detect ethanol and methanol concentrations as low as 100 nmol mol−1 (ppb) in
air in approximately 100 s, and hydrogen concentrations from 1 μmol mol−1 (ppm) to 1% in
nitrogen in less than 60 s. However, GaN/Pt NWNC hybrids showed limited sensitivity only
towards hydrogen and not towards any alcohols. All these hybrid sensors worked at room
temperature and are photomodulated, i.e. they responded to analytes only in the presence of
ultraviolet (UV) light. We propose a qualitative explanation based on the heat of adsorption,
ionization energy and solvent polarity to explain the observed selectivity of the different
hybrids. These results are significant from the standpoint of applications requiring
10957-4484/12/175501+12$33.00 c© 2012 IOP Publishing Ltd Printed in the UK & the USA
Nanotechnology 23 (2012) 175501 G S Aluri et al
room-temperature hydrogen sensing and sensitive alcohol monitoring. These results
demonstrate the tremendous potential for tailoring the selectivity of the hybrid nanosensors for
a multitude of environmental and industrial sensing applications.
S Online supplementary data available from stacks.iop.org/Nano/23/175501/mmedia
(Some figures may appear in colour only in the online journal)
1. Introduction
The development of reliable, portable gas sensors that can
detect harmful gases in real time with high sensitivity and
selectivity is extremely important [1, 2]. In the last few
decades significant advances have been made in the field
of thin film sensors. Recently, there has been a tremendous
interest in the development of nano-engineered materials,
such as nanowires and nanoclusters, for gas sensing because
of their high sensitivity [3–6]. Comprehensive reviews of
metal, semiconductor and metal oxide nanowire-based gas
sensors have been presented elsewhere [7, 8]. A detailed look
at such reviews reveals that poor selectivity of these chemical
sensors is still a major obstacle for commercializing nanoscale
semiconducting gas sensors. For real-world applications,
selectivity between different classes of compounds (such
as between aromatic compounds and alcohols) is highly
desirable. In fact, an ideal chemical sensor is one that
can distinguish between the individual analytes belonging
to a particular class of compounds, e.g. detection of the
presence of benzene or toluene in the presence of other
aromatic compounds. This is extremely challenging as most
semiconductor-based sensors use metal oxides (such as
SnO2 or In2O3, ZnO) as the active elements, which are
inherently limited due to the non-selective nature of the
surface adsorption sites.
Recently, a new class of nanowire-based gas sensors
has gained research interest. The nanowire–nanocluster
(NWNC)-based gas sensors represent a way of functionalizing
the surfaces of nanowires for selective adsorption and
detection of analytes. They also offer the potential of tuning
their sensitivity and selectivity by adjusting the composition,
size and density of the nanoparticles, which makes them a
good alternative to conventional metal-oxide-based thin film
sensors [9, 10]. In recent years, researchers have demonstrated
the potential of NWNC hybrids for sensing many different
chemicals [11–15]. However, most of the hybrid devices
developed so far require elevated working temperatures,
have long response/recovery times, and operate in inert
atmospheres, which limit their use in environmental, domestic
and industrial applications.
We have recently demonstrated metal oxide nanoclusters
(TiO2) on GaN nanowires as a new architecture for
highly selective gas sensing [16]. These hybrid sensors
were capable of selectively sensing benzene and related
aromatic compounds at the nmol mol−1 (ppb) level in air
at room temperature under UV excitation. In this paper,
we present a new strategy for tailoring the selectivity of
these nanowire–nanocluster (NWNC) hybrid sensors using
a multicomponent nanocluster design. Depositing catalytic
metals such as Pt, Pd and other transition metals onto the
surface of oxide photocatalysts is a well-known method for
enhancing their catalytic activity. Metal clusters on metal
oxide catalyst alter the behavior of the metal oxide catalyst
by any one, or a combination of, the following mechanisms:
(1) changing the surface adsorption behavior as metals often
have very different heat of adsorption values compared to the
metal oxides [17–19], (2) enabling catalytic decomposition of
certain analytes on the metal surface, which otherwise would
not be possible on the oxide surface [20], (3) transporting
active species to the metal oxide support by the spill-overeffect from the metal cluster [21], (4) generating a higher
degree of interface states, thus increasing reactive surface area
reaction area, (5) changing the local electronic properties of
the metal clusters, such as workfunction, due to adsorption
of gases [22] and (6) effectively separating photogenerated
carriers in the underlying metal oxide [23]. The effect of
transition metal loading such as Fe, Cu, Pt, Pd and Rh onto
TiO2 has also been extensively studied for photocatalytic
decomposition of various chemicals in both gas–solid and
liquid–solid regimes [24–26].
In this work we compare the sensing behavior of three
NWNC-based hybrid sensors: (1) GaN NW coated with TiO2
NCs (hereafter referred to as GaN/TiO2 NWNC hybrids),
(2) GaN NW coated with TiO2 and Pt multicomponent NCs
(i.e. GaN/(TiO2–Pt) NWNC hybrids) and (3) GaN NW coated
with Pt NCs (i.e. GaN/Pt NWNC hybrids). We found that
sensors with TiO2–Pt multicomponent NCs on GaN NW were
only sensitive to methanol, ethanol and hydrogen. Higher
carbon-containing alcohols (such as n-propanol, iso-propanol,
n-butanol) did not produce any sensor response. These sensors
have the highest sensitivity towards hydrogen. Prior to the
Pt deposition, the GaN/TiO2 NWNC hybrids did not exhibit
any response to alcohols: however, they detected benzene and
related aromatic compounds such as toluene, ethylbenzene,
xylene and chlorobenzene mixed with air. The GaN/Pt hybrids
only showed sensitivity to hydrogen and not to methanol or
ethanol. The sensitivity of GaN/Pt hybrids towards hydrogen
was lower compared to the GaN/(TiO2–Pt) hybrids.
Tables 1 and 2 compare the performance of our
sensor devices with the most recent literature in terms of
operational temperature, carrier gas, lower detection limit and
response/recovery times. Though the literature study is not
exhaustive, the comparison is intended to show that our sensor
devices have good response to very low concentrations of
analytes (100 ppb for ethanol and 1 ppm for hydrogen) at
room temperature, with air as the carrier gas. This testing
condition closely resembles the real-life conditions, which
2

Nanotechnology 23 (2012) 175501 G S Aluri et al
Table 1. Performance of GaN/(TiO2–Pt) NWNC hybrid sensors to ethanol in comparison with recent literature.
Response/recovery times Lower detection limit Carrier gas Temperature References
Our sensor 80/75 s 100 ppb with 1%sensitivitya
Air Roomtemperature(RT)
—
CNTb/SnO2 core–shellnanostructures
1/10 s 10 ppm Air 300 ◦C [27]
MWCNTsc/NaClO4/polypyrrole
20/20 s 18 000 ppm Air RT [28]
Metal–CNT hybrids ∼2 min/not-mentioned (NM) 500 ppb withsensitivity <1%
N2 in avacuum testchamber
RT [29]
V2O5 nanobelts 50/50 s 5 ppm Air 150–400 ◦C [30]ZnO nanorods 3.95/5.3 min 10 ppm Synthetic air 125–300 ◦C [31]ZnO nanowires 10/55 s 1 ppm Air 220 ◦C [32]
ITOd nanowires 2/2 s 10 ppm Air 400 ◦C [33]SnO2 nanowires 2/2 s 10 ppm Air 300 ◦C [34]
a We only compared the sensitivity values for sensors with the lowest detection limit similar to our result.b Carbon nanotubes.c Multi-wall carbon nanotubes.d Indium tin oxide.
Table 2. Performance of GaN/(TiO2–Pt) NWNC hybrid sensors to hydrogen in comparison with recent literature.
Response/recoverytimes Lower detection limit Temperature Reference
Our sensor 60/45 s 1 ppm with sensitivity of4%
RT —
CNT films 5 min/30 s 10 ppm RT [35]SWCNT/SnO2 2/2 s 300 ppm 250 ◦C [36]Pd/CNTs 5/5 min 30 ppm with sensitivity of
3%RT [37]
Pd/Si NWs 1 h/50 min 3 ppm RT [38]Pt-doped SnO2
NWs2/10 min 100 ppm 100 ◦C [39]
underlines the significance of this study. The response and
recovery times are also lower for our sensors compared to
most other sensors in tables 1 and 2.
The present results point towards the unique possibility
of tailoring the selectivity of NWNC chemical sensors. With
infinite combinations of metal and metal oxide composite
clusters available, there is a huge potential for sensor designs
targeted for a multitude of applications.
2. Experimental details
The GaN NWs used in this study were c-axis, n-type
(Si-doped), grown by catalyst-free molecular beam epitaxy
as described elsewhere [40]. Post-growth device fabrication
was done by dielectrophoretically aligning the nanowires
on 9 mm × 9 mm sapphire substrates. The details of the
device fabrication including the process flow diagram can
be found in our previous paper [16]. After fabrication of
two-terminal GaN NW devices, the TiO2 NCs were deposited
on the GaN NW surface using RF magnetron sputtering.
The deposition was done at 325 ◦C with 50 standard cubic
centimeters per minute (sccm) of Ar flow and 300 W RF
power. The nominal deposition rate was about 0.24 A s−1.
Thermal annealing of the complete sensor devices (GaN NW
with TiO2 nanoclusters) was done at 700 ◦C for 30 s in a rapid
thermal processing system. For TiO2–Pt composite NCs, the
Pt was sputtered using DC sputtering after annealing of the
TiO2 clusters on GaN NW. The Pt sputtering was done with
an Ar flow of 35 sccm, at a pressure of 1.3 Pa and power of
40 W for 10 s. For the Pt/GaN devices Pt was sputtered on
bare GaN NWs after annealing the ohmic contacts at 700 ◦C
for 30 s. Additional lithography was performed to form thick
metal bond pads with Ti (40 nm) and Au (200 nm). The device
substrates, i.e. the sensor chips, were wire-bonded on a 24-pin
ceramic package for the gas sensing measurements.
The microstructure and morphology of the sputtered TiO2
films used for the fabrication of the sensors were characterized
by high-resolution transmission and scanning transmission
electron microscopy (HRTEM/STEM), selected-area electron
diffraction (SAED) and field-emission scanning electron
microscopy (FESEM). For the TEM characterization, the GaN
NWs were dispersed on 10 nm thick carbon films supported
by Mo mesh grids, followed by the deposition of TiO2 NCs
and annealing, and subsequent Pt deposition. The samples
were analyzed in a FEI Titan 80-300 TEM/STEM microscope
operating at 300 kV accelerating voltage and equipped with
S-TWIN objective lenses, which provided 0.13 nm (STEM)
3
Nanotechnology 23 (2012) 175501 G S Aluri et al
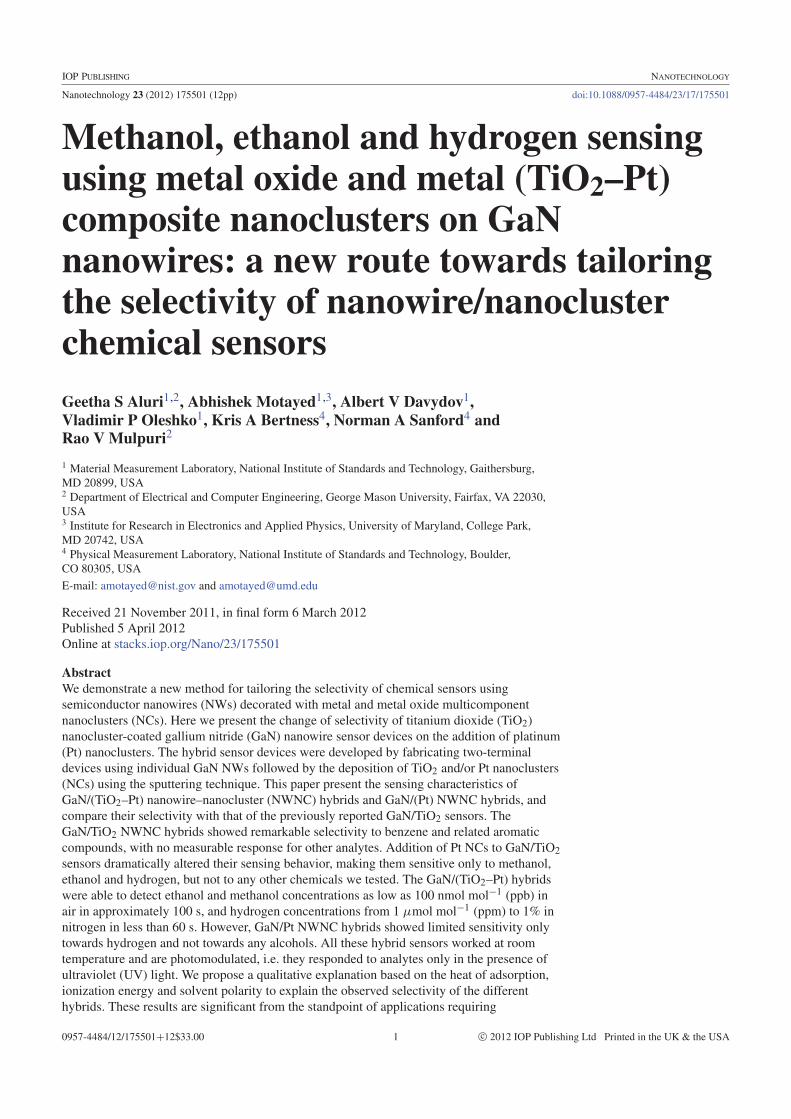
Figure 1. HRTEM image of a GaN NW with TiO2 sputtered on them: (a) before Pt and (b) after Pt deposition. White circles in (a) indicatepartially aggregated polycrystalline TiO2 particles on the NW surface and on the supporting carbon film. Blue arrows (image (b), top leftenlarged inset) mark Pt clusters decorating a 6 nm diameter particle of titania. The TiO2 particle exhibits 0.35 nm fringes corresponding to(101) lattice spacing of anatase polymorph. 2–5 nm thick amorphized surface film indicated by black arrows is also shown.
and 0.19 nm (TEM) resolution by points5. The instrument also
had a Gatan CCD image acquisition camera, bright-field (BF),
ADF and high-angle annular dark-field (HAADF) STEM
detectors to perform spot, line profile and areal compositional
analyses using an EDAX 300 kV high-performance Si/Li
x-ray energy dispersive spectrometer (XEDS).
The as-fabricated sensors were placed in a custom-
designed gas chamber for gas exposure measurements. De-
tailed description of the experimental set-up and experimental
conditions can be found in an earlier paper [16]. The device
characterization and the time-dependent sensing measure-
ments were done using an Agilent B1500A semiconductor
parameter analyzer. The gas sensing experiments have been
performed by measuring the electrical conductance of the
devices upon exposure to controlled flow of an air/chemical
mixture in the presence of UV excitation (25 W deuterium
bulb operating in the 215–400 nm range). For all the sensing
experiments with chemicals, breathing air (<9 μmol mol−1 of
water) was used as the carrier gas. For the hydrogen sensing
we used high-purity nitrogen as the carrier gas. After the
sensor devices were exposed to the organic compounds and
hydrogen, they were allowed to regain their baseline current
with the air–chemical mixture turned off, without purging or
evacuating the test chamber.
3. Results
3.1. Morphological and structural characterization ofNWNC hybrids
It is challenging to measure the sizes and shapes of small
TiO2 and Pt particles on the surface GaN NWs from
5 Certain commercial equipment, instruments or materials are identified
in this paper to foster understanding. Such identification does not imply
recommendation or endorsement by the National Institute of Standards and
Technology nor does it imply that the materials or equipment identified are
necessarily the best available for the purpose.
grayscale TEM images due to: (a) 270–300 nm thickness
of the NWs used in the devices and variations of thickness
and curvature across the structure; (b) diffraction contrast
induced particularly by bending of the wires: even similar
particles could appear as having different intensities, while
local thickness variations of the carbon support film could
result in variable contrast affecting the mean intensity
values of the particles; and (c) overwhelming domination
of electron diffraction in SAED from the GaN NW over
the diffraction from TiO2 and Pt nanoparticles. To overcome
these problems, TEM imaging was conducted under minimal
beam intensity conditions close to the Scherzer defocus at a
highest available accelerating voltage of 300 kV using both
stationary beam (bright-field TEM/SAED, phase-contrast
high-resolution TEM) and scanning beam (STEM/XEDS)
modes. Areas for analyses were selected near the wire’s edges
and on the amorphous carbon support film in the vicinity of
the NWs.
Figure 1 shows HRTEM micrographs of a GaN
NW on thin amorphous carbon support films with TiO2
coating, before and after the Pt deposition. The deposited
TiO2 layer formed an island-like film, where 10–50 nm
partially aggregated particles (see figure 1(a)) were often
interconnected into extended two-dimensional networks. This
was consistent with SAED and compositional analyses of
deposited TiO2 films, indicating a mixture of polycrystalline
anatase and rutile and of the same mixture plus fcc Pt
nanoparticles (figure 1(b)), respectively (see supplementary
data for details available at stacks.iop.org/Nano/23/175501/
mmedia). Pt crystalline particles with 1–5 nm size were
randomly distributed on the surfaces of TiO2 islands
and sometimes were partially coalesced forming elongated
aggregates. In the latter case, a significant thickness of the
GaN NWs made it difficult to visualize TiO2 deposits due to
the limited contrast difference between TiO2 and GaN and the
presence of multiple heavy Pt particles. In spite of these severe
limitations, detailed HRTEM and HR-STEM observations
4

Nanotechnology 23 (2012) 175501 G S Aluri et al
Figure 2. HAADF-STEM of a GaN NW coated with TiO2 and Pt. (a) 1–5 nm bright Pt nanoparticles (shown by blue arrows) decoratingsurfaces of a polycrystalline TiO2 island-like film and of a GaN nanowire. Medium gray aggregated TiO2 particles (outlined by dashedwhite line in (a)) are barely visible on a thin carbon support in image (a) near the edge of the nanowire. (b) High magnification image of thesupporting film near the edge of the nanowire exhibits 0.23–0.25 nm (111) and 0.20–0.22 nm (200) fcc lattice fringes belonging to Ptnanocrystallites; blue arrows indicate amorphous-like Pt clusters of 1 nm or less in diameter.
Figure 3. I–V characteristics of the hybrid sensor device at different stages of processing: (a) GaN/(TiO2–Pt) hybrids and (b) GaN/Pthybrids. Inset in (b) shows the plan-view SEM image of a typical GaN NWNC hybrid sensor. The scale bar in the inset is 4 μm.
revealed 0.35 nm (101) hcp lattice fringes belonging to
anatase (see figure 1(b), inset) and 0.23–0.25 nm (111)
and 0.20–0.22 nm (200) fcc lattice fringes belonging to Pt
nanocrystallites, respectively, as well as amorphous-like Pt
clusters with diameter around 1 nm or less (see figures 2(a)
and (b)).
In figure 2 HAADF-STEM image shows 1–5 nm
diameter bright Pt nanoparticles and barely visible TiO2
islands (medium gray) randomly distributed near the edge
of the nanowire. The presence of both TiO2 and Pt
nanocrystallites was confirmed by the analysis of selected
areas using XEDS nanoprobe capabilities (see supplementary
data available at stacks.iop.org/Nano/23/175501/mmedia).
3.2. Current–voltage (I–V) characteristics of NWNC hybridsin dark
Figure 3 shows the I–V characteristics of the GaN/(TiO2–Pt)
and GaN/Pt hybrid sensor devices at different stages of
processing. The plan-view SEM image of a typical sensor
device is shown in the inset of figure 3(b) for representationpurpose. The I–V curves of the as-fabricated GaN NWtwo-terminal devices were nonlinear and asymmetric (notclear in figure 3(a) due to scale resolution). A small increase inthe positive current after the deposition of TiO2 nanoclusters(curve 2) can be attributed to decreased surface depletionof the GaN NWs due to passivation of surface states and/orthe high-temperature deposition (325 ◦C) of the nanoclustersinitiating ohmic contact formation. The devices annealed at700 ◦C for 30 s after the deposition of TiO2 NCs showedsignificant change in their I–V characteristics with a majorityof the devices exhibiting linear I–V curves. Interestingly, PtNC deposition on TiO2-coated GaN NWs further increasedthe conductivity of the nanowire. This is probably due tothe fact that the Pt clusters depleted the TiO2 clusters byremoving free electrons; increased depletion in the TiO2
clusters due to Pt would decrease TiO2-induced depletionin the GaN NW, leading to an increase in the NW current.With the Pt/GaN hybrids, the current decreases followed bythe deposition of Pt (figure 3(b)), as expected due to the
5
Nanotechnology 23 (2012) 175501 G S Aluri et al
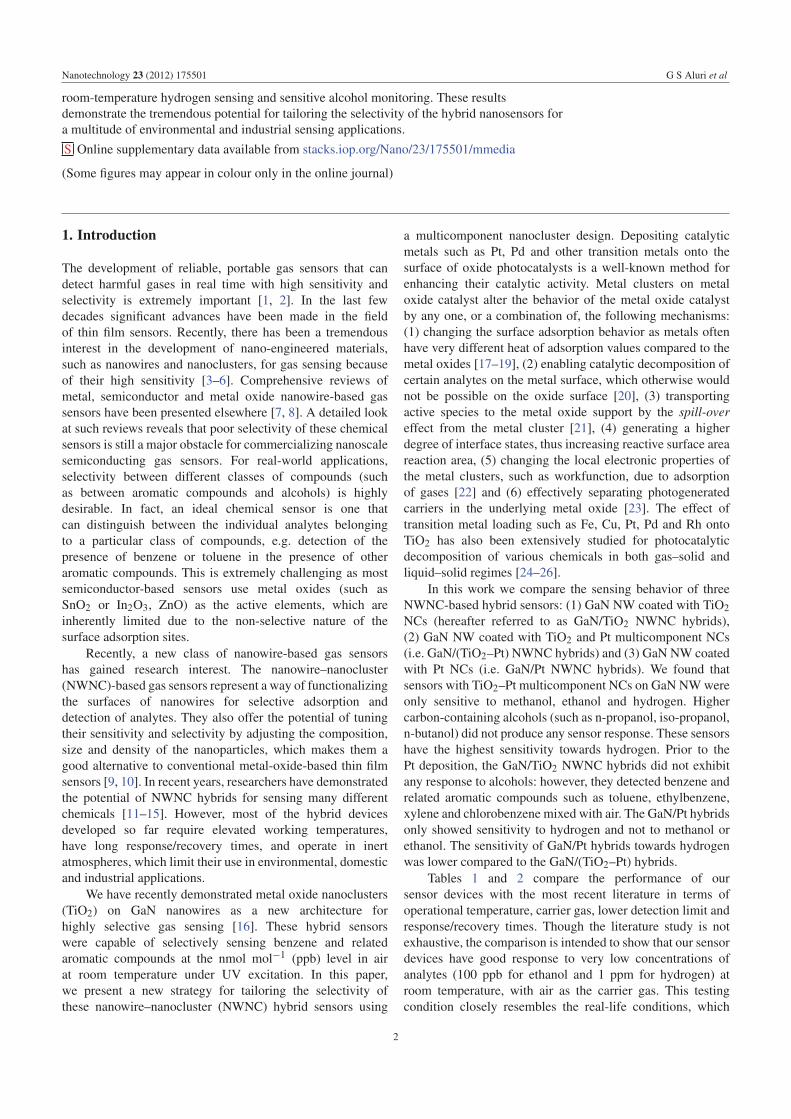
Figure 4. Depletion depth induced by Pt NCs on GaN and TiO2 ascalculated by equation (1).
depletion region formed in the NW under the metal clusters.
It is worthwhile to discuss the nature of the depletion region
formed by such nanosized metal clusters on a semiconductor.
It has been shown that the classical Schottky model depletion
theory cannot predict accurately the zero-bias depletion width
produced by metallic nanoclusters on a semiconductor [41].
According to Zhdanov’s model the depletion depth associated
with such metal nanoclusters on a semiconductor can be
estimated by the relationship [42]:
wd =(
3rcVbi
2πq2Nd
)1/3
(1)
where wd is the depletion width, rc is the radius of the
nanocluster, Vbi is the built-in voltage for the GaN–Pt
junction, q is the elementary charge and Nd is the dopant
concentration in the nanowire. Figure 4 shows the calculated
zero-bias depletion depth produced in GaN and TiO2,
respectively, as a function of the Pt cluster radius according to
equation (1). For calculating the depletion depth we assumed
the effective conduction band density of states in TiO2 as
3.0×1021 cm−3 and point-defect-related donor concentration
as 1.0×1018 cm−3 [43, 44]. The electron concentration in the
GaN NWs was measured to be 1 × 1017 cm−3 in a separate
experiment.
Figure 4 indicates that even a single Pt NC of 2 nm
radius can significantly deplete a 10 nm (average size) TiO2
cluster. The effect of TiO2 depletion on GaN NW is hard
to compute as it could be influenced by numerous factors
including interface states and the particle geometry. Given the
very high density of TiO2 clusters on the NW surface (see
figure 2(b)), it is clear that the Pt particles mostly reside on
the surfaces of TiO2 NCs. However, from figure 4 we can see
that, when Pt NCs are directly on GaN, they should deplete
the carriers in an even larger region in the GaN NW. This
qualitatively explains the relatively larger change in current
observed when Pt NCs were deposited on bare GaN NWs as
compared to the change in current when Pt NC were deposited
on the TiO2-coated NWs.
3.3. Comparative sensing behavior of GaN/(TiO2–Pt),GaN/Pt and GaN/TiO2 NWNC hybrid sensors
The photocurrent through the bare GaN NW devices did
not change when exposed to different chemicals mixed in
air, even for concentrations as high as 3%. In contrast, the
TiO2-coated hybrid devices responded even to the pulses
of 20 sccm airflow in the presence of UV excitation. The
response of the TiO2 NC-coated GaN nanowire hybrid sensors
to different concentrations of benzene, toluene, ethylbenzene,
chlorobenzene and xylene in air is illustrated in our earlier
paper and will not be discussed here [16]. The GaN/TiO2
hybrids showed no response when exposed to other chemicals
such as alcohols, ketones, amides, alkanes, nitro/halo-alkanes
and esters.
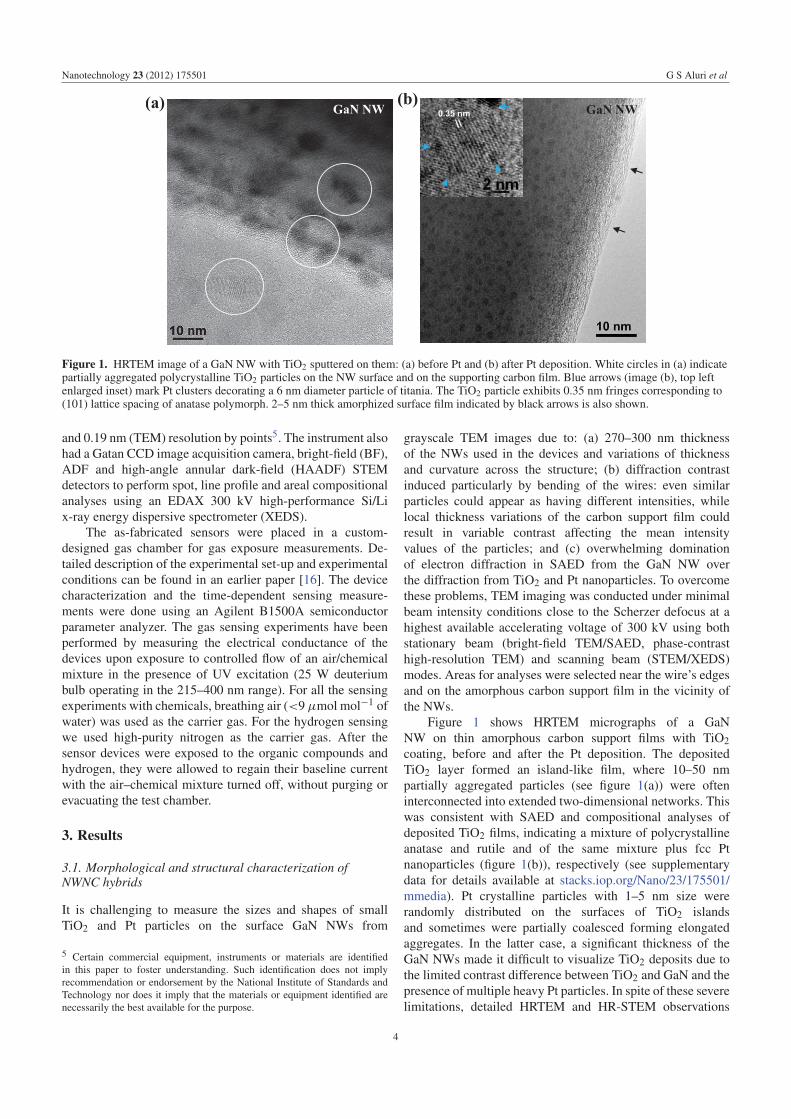
Remarkably, after the deposition of Pt nanoclusters
on the GaN/TiO2 hybrids, the sensors were no longer
sensitive to benzene and other aromatic compounds, but
responded only to hydrogen, methanol and ethanol. In
addition, the GaN/(TiO2–Pt) hybrids showed no response
when exposed to higher carbon-containing (C > 2) alcohols
such as n-propanol, iso-propanol and n-butanol. Figure 5
shows the change of photocurrent of a GaN/(TiO2–Pt) sensor
Figure 5. (a) UV photo-response of the GaN/(TiO2–Pt) hybrid device to 1000 μmol mol−1 (ppm) of methanol, ethanol and water in air,and hydrogen in nitrogen. The air–gas mixture was turned on at 0 s and turned off at 100 s. (b) Cyclic response of the GaN/(TiO2–Pt) hybriddevice when exposed to 2500 μmol mol−1 (ppm) of hydrogen in nitrogen. The bias voltage for all the devices was 5 V.
6
Nanotechnology 23 (2012) 175501 G S Aluri et al
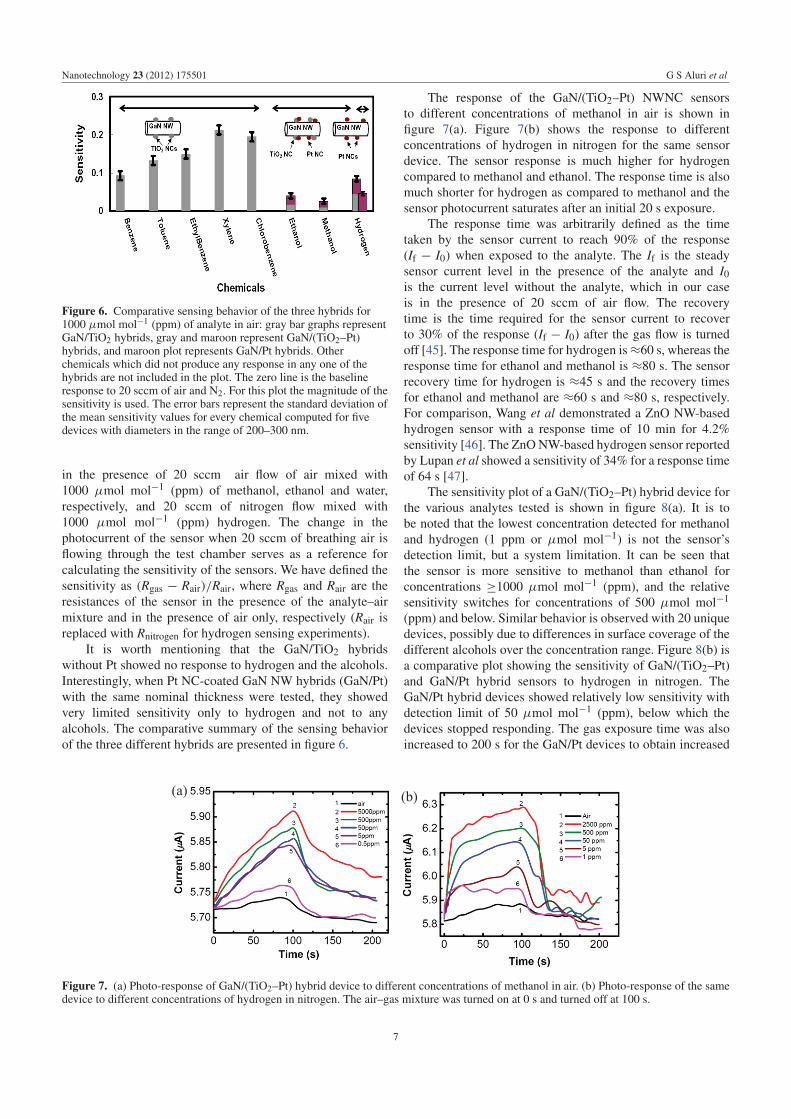
Figure 6. Comparative sensing behavior of the three hybrids for1000 μmol mol−1 (ppm) of analyte in air: gray bar graphs representGaN/TiO2 hybrids, gray and maroon represent GaN/(TiO2–Pt)hybrids, and maroon plot represents GaN/Pt hybrids. Otherchemicals which did not produce any response in any one of thehybrids are not included in the plot. The zero line is the baselineresponse to 20 sccm of air and N2. For this plot the magnitude of thesensitivity is used. The error bars represent the standard deviation ofthe mean sensitivity values for every chemical computed for fivedevices with diameters in the range of 200–300 nm.
in the presence of 20 sccm air flow of air mixed with
1000 μmol mol−1 (ppm) of methanol, ethanol and water,
respectively, and 20 sccm of nitrogen flow mixed with
1000 μmol mol−1 (ppm) hydrogen. The change in the
photocurrent of the sensor when 20 sccm of breathing air is
flowing through the test chamber serves as a reference for
calculating the sensitivity of the sensors. We have defined the
sensitivity as (Rgas − Rair)/Rair, where Rgas and Rair are the
resistances of the sensor in the presence of the analyte–air
mixture and in the presence of air only, respectively (Rair is
replaced with Rnitrogen for hydrogen sensing experiments).
It is worth mentioning that the GaN/TiO2 hybrids
without Pt showed no response to hydrogen and the alcohols.
Interestingly, when Pt NC-coated GaN NW hybrids (GaN/Pt)
with the same nominal thickness were tested, they showed
very limited sensitivity only to hydrogen and not to any
alcohols. The comparative summary of the sensing behavior
of the three different hybrids are presented in figure 6.
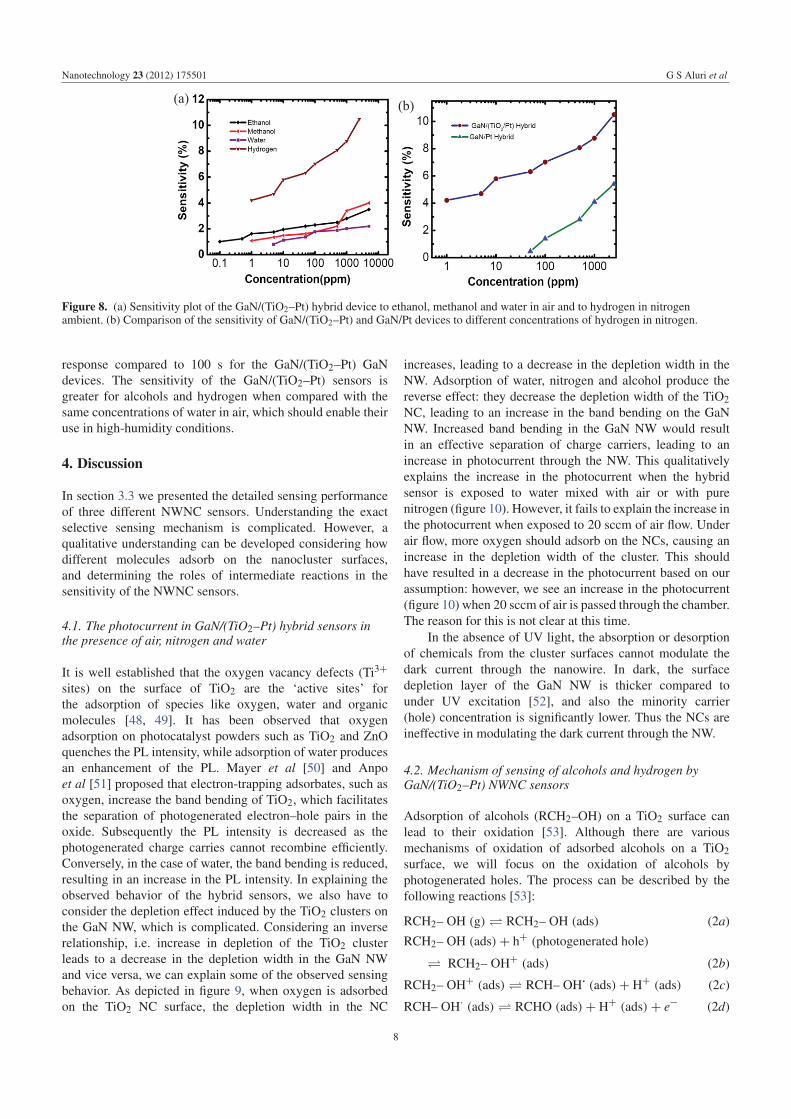
The response of the GaN/(TiO2–Pt) NWNC sensors
to different concentrations of methanol in air is shown in
figure 7(a). Figure 7(b) shows the response to different
concentrations of hydrogen in nitrogen for the same sensor
device. The sensor response is much higher for hydrogen
compared to methanol and ethanol. The response time is also
much shorter for hydrogen as compared to methanol and the
sensor photocurrent saturates after an initial 20 s exposure.
The response time was arbitrarily defined as the time
taken by the sensor current to reach 90% of the response
(If − I0) when exposed to the analyte. The If is the steady
sensor current level in the presence of the analyte and I0
is the current level without the analyte, which in our case
is in the presence of 20 sccm of air flow. The recovery
time is the time required for the sensor current to recover
to 30% of the response (If − I0) after the gas flow is turned
off [45]. The response time for hydrogen is ≈60 s, whereas the
response time for ethanol and methanol is ≈80 s. The sensor
recovery time for hydrogen is ≈45 s and the recovery times
for ethanol and methanol are ≈60 s and ≈80 s, respectively.
For comparison, Wang et al demonstrated a ZnO NW-based
hydrogen sensor with a response time of 10 min for 4.2%
sensitivity [46]. The ZnO NW-based hydrogen sensor reported
by Lupan et al showed a sensitivity of 34% for a response time
of 64 s [47].
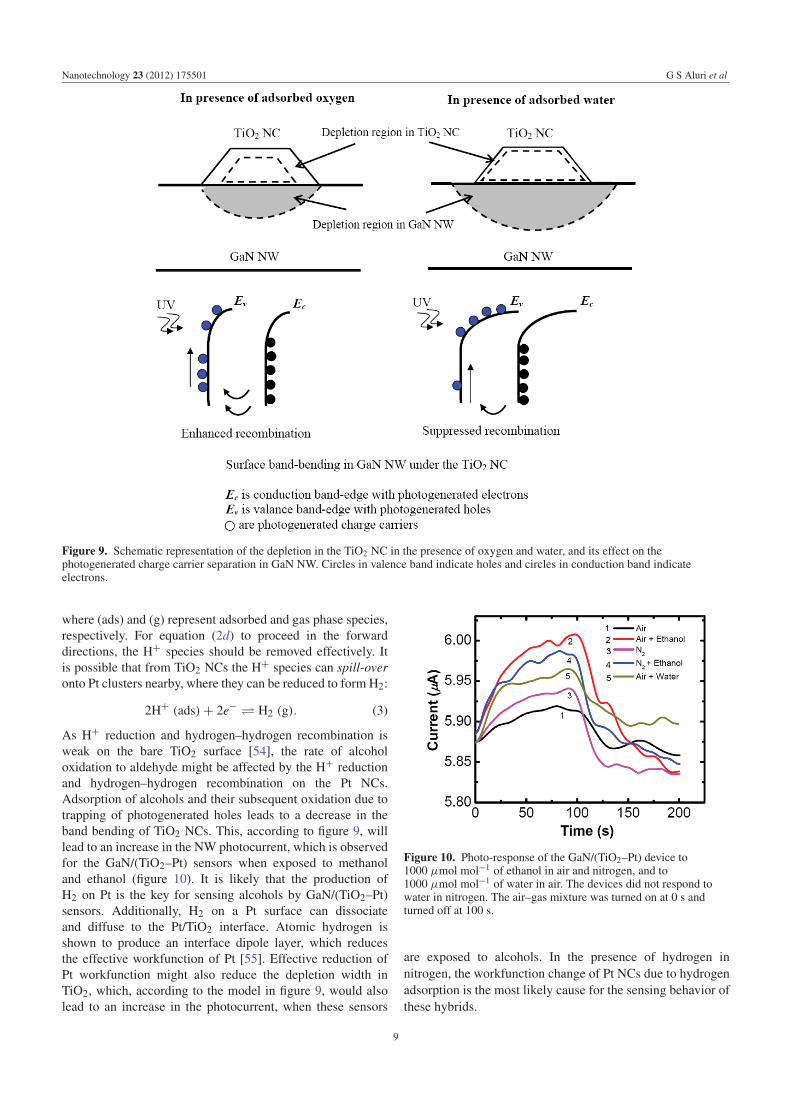
The sensitivity plot of a GaN/(TiO2–Pt) hybrid device for
the various analytes tested is shown in figure 8(a). It is to
be noted that the lowest concentration detected for methanol
and hydrogen (1 ppm or μmol mol−1) is not the sensor’s
detection limit, but a system limitation. It can be seen that
the sensor is more sensitive to methanol than ethanol for
concentrations ≥1000 μmol mol−1 (ppm), and the relative
sensitivity switches for concentrations of 500 μmol mol−1
(ppm) and below. Similar behavior is observed with 20 unique
devices, possibly due to differences in surface coverage of the
different alcohols over the concentration range. Figure 8(b) is
a comparative plot showing the sensitivity of GaN/(TiO2–Pt)
and GaN/Pt hybrid sensors to hydrogen in nitrogen. The
GaN/Pt hybrid devices showed relatively low sensitivity with
detection limit of 50 μmol mol−1 (ppm), below which the
devices stopped responding. The gas exposure time was also
increased to 200 s for the GaN/Pt devices to obtain increased
Figure 7. (a) Photo-response of GaN/(TiO2–Pt) hybrid device to different concentrations of methanol in air. (b) Photo-response of the samedevice to different concentrations of hydrogen in nitrogen. The air–gas mixture was turned on at 0 s and turned off at 100 s.
7
Nanotechnology 23 (2012) 175501 G S Aluri et al
Figure 8. (a) Sensitivity plot of the GaN/(TiO2–Pt) hybrid device to ethanol, methanol and water in air and to hydrogen in nitrogenambient. (b) Comparison of the sensitivity of GaN/(TiO2–Pt) and GaN/Pt devices to different concentrations of hydrogen in nitrogen.
response compared to 100 s for the GaN/(TiO2–Pt) GaN
devices. The sensitivity of the GaN/(TiO2–Pt) sensors is
greater for alcohols and hydrogen when compared with the
same concentrations of water in air, which should enable their
use in high-humidity conditions.
4. Discussion
In section 3.3 we presented the detailed sensing performance
of three different NWNC sensors. Understanding the exact
selective sensing mechanism is complicated. However, a
qualitative understanding can be developed considering how
different molecules adsorb on the nanocluster surfaces,
and determining the roles of intermediate reactions in the
sensitivity of the NWNC sensors.
4.1. The photocurrent in GaN/(TiO2–Pt) hybrid sensors inthe presence of air, nitrogen and water
It is well established that the oxygen vacancy defects (Ti3+sites) on the surface of TiO2 are the ‘active sites’ for
the adsorption of species like oxygen, water and organic
molecules [48, 49]. It has been observed that oxygen
adsorption on photocatalyst powders such as TiO2 and ZnO
quenches the PL intensity, while adsorption of water produces
an enhancement of the PL. Mayer et al [50] and Anpo
et al [51] proposed that electron-trapping adsorbates, such as
oxygen, increase the band bending of TiO2, which facilitates
the separation of photogenerated electron–hole pairs in the
oxide. Subsequently the PL intensity is decreased as the
photogenerated charge carries cannot recombine efficiently.
Conversely, in the case of water, the band bending is reduced,
resulting in an increase in the PL intensity. In explaining the
observed behavior of the hybrid sensors, we also have to
consider the depletion effect induced by the TiO2 clusters on
the GaN NW, which is complicated. Considering an inverse
relationship, i.e. increase in depletion of the TiO2 cluster
leads to a decrease in the depletion width in the GaN NW
and vice versa, we can explain some of the observed sensing
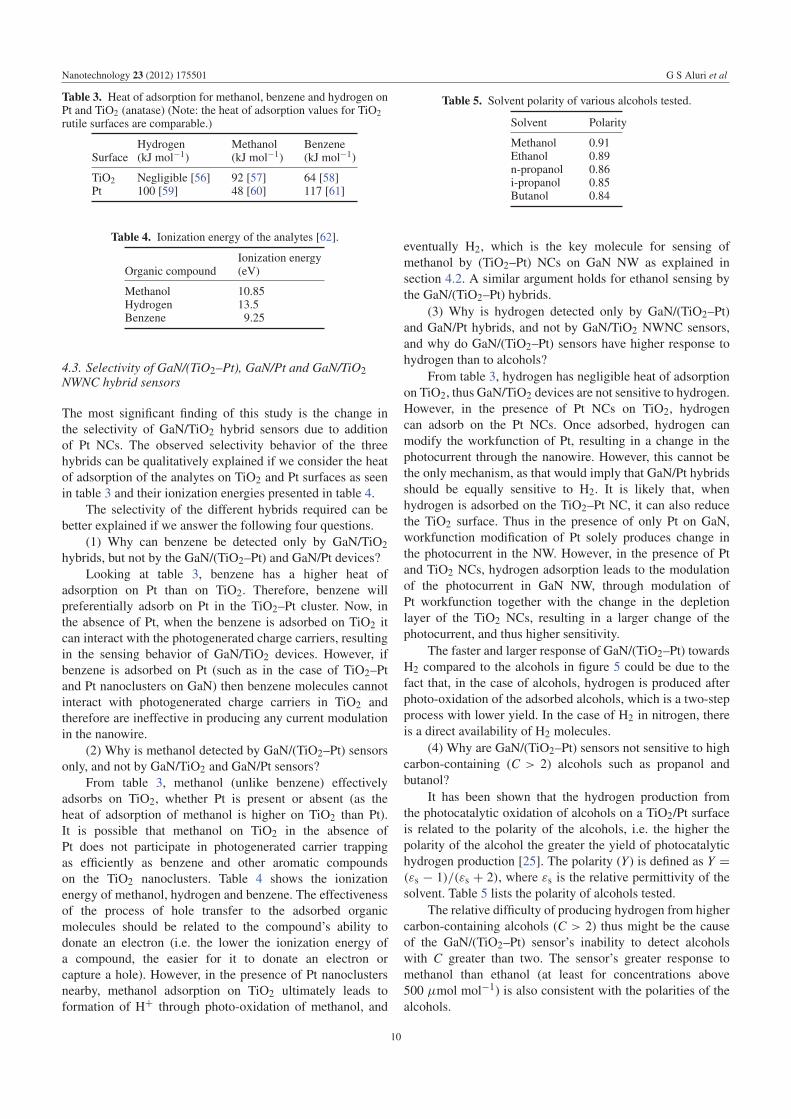
behavior. As depicted in figure 9, when oxygen is adsorbed
on the TiO2 NC surface, the depletion width in the NC
increases, leading to a decrease in the depletion width in the
NW. Adsorption of water, nitrogen and alcohol produce the
reverse effect: they decrease the depletion width of the TiO2
NC, leading to an increase in the band bending on the GaN
NW. Increased band bending in the GaN NW would result
in an effective separation of charge carriers, leading to an
increase in photocurrent through the NW. This qualitatively
explains the increase in the photocurrent when the hybrid
sensor is exposed to water mixed with air or with pure
nitrogen (figure 10). However, it fails to explain the increase in
the photocurrent when exposed to 20 sccm of air flow. Under
air flow, more oxygen should adsorb on the NCs, causing an
increase in the depletion width of the cluster. This should
have resulted in a decrease in the photocurrent based on our
assumption: however, we see an increase in the photocurrent
(figure 10) when 20 sccm of air is passed through the chamber.
The reason for this is not clear at this time.
In the absence of UV light, the absorption or desorption
of chemicals from the cluster surfaces cannot modulate the
dark current through the nanowire. In dark, the surface
depletion layer of the GaN NW is thicker compared to
under UV excitation [52], and also the minority carrier
(hole) concentration is significantly lower. Thus the NCs are
ineffective in modulating the dark current through the NW.
4.2. Mechanism of sensing of alcohols and hydrogen byGaN/(TiO2–Pt) NWNC sensors
Adsorption of alcohols (RCH2–OH) on a TiO2 surface can
lead to their oxidation [53]. Although there are various
mechanisms of oxidation of adsorbed alcohols on a TiO2
surface, we will focus on the oxidation of alcohols by
photogenerated holes. The process can be described by the
following reactions [53]:
RCH2– OH (g) � RCH2– OH (ads) (2a)
RCH2– OH (ads) + h+ (photogenerated hole)
� RCH2– OH+ (ads) (2b)
RCH2– OH+ (ads) � RCH– OH· (ads) + H+ (ads) (2c)
RCH– OH· (ads) � RCHO (ads) + H+ (ads) + e− (2d)
8
Nanotechnology 23 (2012) 175501 G S Aluri et al
Figure 9. Schematic representation of the depletion in the TiO2 NC in the presence of oxygen and water, and its effect on thephotogenerated charge carrier separation in GaN NW. Circles in valence band indicate holes and circles in conduction band indicateelectrons.
where (ads) and (g) represent adsorbed and gas phase species,
respectively. For equation (2d) to proceed in the forward
directions, the H+ species should be removed effectively. It
is possible that from TiO2 NCs the H+ species can spill-overonto Pt clusters nearby, where they can be reduced to form H2:
2H+ (ads) + 2e− � H2 (g). (3)
As H+ reduction and hydrogen–hydrogen recombination is
weak on the bare TiO2 surface [54], the rate of alcohol
oxidation to aldehyde might be affected by the H+ reduction
and hydrogen–hydrogen recombination on the Pt NCs.
Adsorption of alcohols and their subsequent oxidation due to
trapping of photogenerated holes leads to a decrease in the
band bending of TiO2 NCs. This, according to figure 9, will
lead to an increase in the NW photocurrent, which is observed
for the GaN/(TiO2–Pt) sensors when exposed to methanol
and ethanol (figure 10). It is likely that the production of
H2 on Pt is the key for sensing alcohols by GaN/(TiO2–Pt)
sensors. Additionally, H2 on a Pt surface can dissociate
and diffuse to the Pt/TiO2 interface. Atomic hydrogen is
shown to produce an interface dipole layer, which reduces
the effective workfunction of Pt [55]. Effective reduction of
Pt workfunction might also reduce the depletion width in
TiO2, which, according to the model in figure 9, would also
lead to an increase in the photocurrent, when these sensors
Figure 10. Photo-response of the GaN/(TiO2–Pt) device to1000 μmol mol−1 of ethanol in air and nitrogen, and to1000 μmol mol−1 of water in air. The devices did not respond towater in nitrogen. The air–gas mixture was turned on at 0 s andturned off at 100 s.
are exposed to alcohols. In the presence of hydrogen in
nitrogen, the workfunction change of Pt NCs due to hydrogen
adsorption is the most likely cause for the sensing behavior of
these hybrids.
9
Nanotechnology 23 (2012) 175501 G S Aluri et al
Table 3. Heat of adsorption for methanol, benzene and hydrogen onPt and TiO2 (anatase) (Note: the heat of adsorption values for TiO2
rutile surfaces are comparable.)
SurfaceHydrogen(kJ mol−1)
Methanol(kJ mol−1)
Benzene(kJ mol−1)
TiO2 Negligible [56] 92 [57] 64 [58]Pt 100 [59] 48 [60] 117 [61]
Table 4. Ionization energy of the analytes [62].
Organic compoundIonization energy(eV)
Methanol 10.85Hydrogen 13.5Benzene 9.25
4.3. Selectivity of GaN/(TiO2–Pt), GaN/Pt and GaN/TiO2
NWNC hybrid sensors
The most significant finding of this study is the change in
the selectivity of GaN/TiO2 hybrid sensors due to addition
of Pt NCs. The observed selectivity behavior of the three
hybrids can be qualitatively explained if we consider the heat
of adsorption of the analytes on TiO2 and Pt surfaces as seen
in table 3 and their ionization energies presented in table 4.
The selectivity of the different hybrids required can be
better explained if we answer the following four questions.
(1) Why can benzene be detected only by GaN/TiO2
hybrids, but not by the GaN/(TiO2–Pt) and GaN/Pt devices?
Looking at table 3, benzene has a higher heat of
adsorption on Pt than on TiO2. Therefore, benzene will
preferentially adsorb on Pt in the TiO2–Pt cluster. Now, in
the absence of Pt, when the benzene is adsorbed on TiO2 it
can interact with the photogenerated charge carriers, resulting
in the sensing behavior of GaN/TiO2 devices. However, if
benzene is adsorbed on Pt (such as in the case of TiO2–Pt
and Pt nanoclusters on GaN) then benzene molecules cannot
interact with photogenerated charge carriers in TiO2 and
therefore are ineffective in producing any current modulation
in the nanowire.
(2) Why is methanol detected by GaN/(TiO2–Pt) sensors
only, and not by GaN/TiO2 and GaN/Pt sensors?
From table 3, methanol (unlike benzene) effectively
adsorbs on TiO2, whether Pt is present or absent (as the
heat of adsorption of methanol is higher on TiO2 than Pt).
It is possible that methanol on TiO2 in the absence of
Pt does not participate in photogenerated carrier trapping
as efficiently as benzene and other aromatic compounds
on the TiO2 nanoclusters. Table 4 shows the ionization
energy of methanol, hydrogen and benzene. The effectiveness
of the process of hole transfer to the adsorbed organic
molecules should be related to the compound’s ability to
donate an electron (i.e. the lower the ionization energy of
a compound, the easier for it to donate an electron or
capture a hole). However, in the presence of Pt nanoclusters
nearby, methanol adsorption on TiO2 ultimately leads to
formation of H+ through photo-oxidation of methanol, and
Table 5. Solvent polarity of various alcohols tested.
Solvent Polarity
Methanol 0.91Ethanol 0.89n-propanol 0.86i-propanol 0.85Butanol 0.84
eventually H2, which is the key molecule for sensing of
methanol by (TiO2–Pt) NCs on GaN NW as explained in
section 4.2. A similar argument holds for ethanol sensing by
the GaN/(TiO2–Pt) hybrids.
(3) Why is hydrogen detected only by GaN/(TiO2–Pt)
and GaN/Pt hybrids, and not by GaN/TiO2 NWNC sensors,
and why do GaN/(TiO2–Pt) sensors have higher response to
hydrogen than to alcohols?
From table 3, hydrogen has negligible heat of adsorption
on TiO2, thus GaN/TiO2 devices are not sensitive to hydrogen.
However, in the presence of Pt NCs on TiO2, hydrogen
can adsorb on the Pt NCs. Once adsorbed, hydrogen can
modify the workfunction of Pt, resulting in a change in the
photocurrent through the nanowire. However, this cannot be
the only mechanism, as that would imply that GaN/Pt hybrids
should be equally sensitive to H2. It is likely that, when
hydrogen is adsorbed on the TiO2–Pt NC, it can also reduce
the TiO2 surface. Thus in the presence of only Pt on GaN,
workfunction modification of Pt solely produces change in
the photocurrent in the NW. However, in the presence of Pt
and TiO2 NCs, hydrogen adsorption leads to the modulation
of the photocurrent in GaN NW, through modulation of
Pt workfunction together with the change in the depletion
layer of the TiO2 NCs, resulting in a larger change of the
photocurrent, and thus higher sensitivity.
The faster and larger response of GaN/(TiO2–Pt) towards
H2 compared to the alcohols in figure 5 could be due to the
fact that, in the case of alcohols, hydrogen is produced after
photo-oxidation of the adsorbed alcohols, which is a two-step
process with lower yield. In the case of H2 in nitrogen, there
is a direct availability of H2 molecules.
(4) Why are GaN/(TiO2–Pt) sensors not sensitive to high
carbon-containing (C > 2) alcohols such as propanol and
butanol?
It has been shown that the hydrogen production from
the photocatalytic oxidation of alcohols on a TiO2/Pt surface
is related to the polarity of the alcohols, i.e. the higher the
polarity of the alcohol the greater the yield of photocatalytic
hydrogen production [25]. The polarity (Y) is defined as Y =(εs − 1)/(εs + 2), where εs is the relative permittivity of the
solvent. Table 5 lists the polarity of alcohols tested.
The relative difficulty of producing hydrogen from higher
carbon-containing alcohols (C > 2) thus might be the cause
of the GaN/(TiO2–Pt) sensor’s inability to detect alcohols
with C greater than two. The sensor’s greater response to
methanol than ethanol (at least for concentrations above
500 μmol mol−1) is also consistent with the polarities of the
alcohols.
10
Nanotechnology 23 (2012) 175501 G S Aluri et al
5. Conclusions
We have demonstrated that, by using metal and metal-oxide-
based multicomponent NCs on GaN NWs, we can tailor
the selectivity of GaN NW-based chemical sensors. We
compared the behavior of three different kinds of NWNC
hybrid sensor devices, i.e. GaN/(TiO2–Pt), GaN/TiO2and
GaN/Pt. It was shown earlier that GaN/TiO2 sensors
selectively detected aromatic compounds, such as benzene,
toluene, chlorobenzene, ethylbenzene and xylene. In this
study we found that, by adding Pt NCs to GaN/TiO2
sensors, we can completely inhibit their sensitivity to
the above-mentioned aromatic compounds. However, they
start responding to hydrogen, methanol and ethanol. The
GaN/Pt NWNCs on the other hand showed response only
to hydrogen. The GaN/(TiO2–Pt) hybrid sensors could be
used for room-temperature hydrogen sensing, in various
industrial production facilities, oil refineries and for hydrogen
monitoring in hydrogen-powered vehicles. Also, these
sensors could be used in alcohol monitoring systems for
various industrial and law-enforcement purposes, such as
in the production of alcohols-based bio-fuels and in breath
analyzers.
This study indicates the potential of multicomponent
NWNC-based sensors for developing the next generation of
ultrasensitive and highly selective chemical sensors. Through
combinations of metals and metal oxides available, we can
produce a library of sensors, each with precisely tuned
selectivity, on a single chip for detecting a wide variety of
analytes in many different environments.
Acknowledgments
The George Mason University portion of this work was
supported by the National Science Foundation under ECCS-
0901712 grant. The University of Maryland portion of the
work was partially supported by the Defense Threat Reduc-
tion Agency, Basic Research Award no. HDTRA1-10-1-0107,
to the University of Maryland. VPO gratefully acknowledges
the support from the NIST (contracts SB134110SE0579 and
SB134111SE0814). We thank Dr Kurt Benkstein of NIST
for sharing his design for the gas sensing set-up. We thank
Dr Sergiy Krylyuk of NIST for his assistance in assembling
the gas sensing setup. The nanowire devices were fabricated
at the Nanofab clean room of the NIST Center for Nanoscale
Science and Technology.
References
[1] Wilson D M, Hoyt S, Janata J, Booksh K and Obando L 2001IEEE Sensors J. 1 256–74
[2] Eranna G, Joshi B, Runthala D and Gupta R 2004 Crit. Rev.Solid State Mater. Sci. 29 111–88
[3] Cui Y, Wei Q, Park H and Lieber C M 2001 Science 293 1289[4] Sberveglieri G, Baratto C, Comini E, Faglia G, Ferroni M,
Ponzoni A and Vomiero A 2007 Sensors Actuators B121 208–13
[5] Offermans P, Crego-Calama M and Brongersma S H 2010Nano Lett. 10 2412
[6] Field C R, In H J, Begue N J and Pehrsson P E 2011 Anal.Chem. 83 4724–8
[7] XueX (ed) 2008 Nanowire Research Progress 1st edn (New
York: Nova Science Publisher)
[8] Ramgir N S, Yang Y and Zacharias M 2010 Small 6 1705–22
[9] Joshi R K and Kruis F E 2006 Appl. Phys. Lett. 89 153116
[10] Mubeen S, Zhang T, Chartuprayoon N, Rheem Y,
Mulchandani A, Myung N V and Deshusses M A 2010
Anal. Chem. 82 250–7
[11] Leghrib R, Pavelko R, Felten A, Vasiliev A, Cane C, Gracia I,
Pireaux J-J and Llobet E 2010 Sensors Actuators B
145 411–6
[12] Balazsi C, Sedlackova K, Llobet E and Ionescu R 2008
Sensors Actuators B 133 151–5
[13] Kuang Q, Lao C-S, Li Z, Liu Y-Z, Xie Z-X, Zheng L-S and
Wang Z L 2008 J. Phys. Chem. C 112 11539–44
[14] Zhang Y, Xu J, Xu P, Zhu Y, Chen X and Yu W 2010
Nanotechnology 21 285501
[15] Dobrokhotov V et al 2006 J. Appl. Phys. 99 104302
[16] Aluri G S, Motayed A, Davydov A V, Oleshko V P,
Bertness K A, Sanford N A and Rao M V 2011
Nanotechnology 22 295503
[17] Calatayud M, Markovits A, Menetrey M, Mguig B and
Minot C 2003 Catal. Today 85 125–43
[18] Royer S and Duprez D 2011 ChemCatChem 3 24–65
[19] Wang G C, Zhou Y H and Nakamura J 2005 J. Chem. Phys.122 044707
[20] Somorjai G A 2010 Introduction to Surface Chemistry andCatalysis (New York: Wiley)
[21] Conner W C, Pajonk G and Teichner S 1986 Chem. Rev.95 759
[22] Hiehata K, Sasahara A and Onishi H 2007 Nanotechnology18 084007
[23] Carp O, Huisman C and Reller A 2004 Prog. Solid StateChem. 32 33–177
[24] Morikawa T, Ohwaki T, Suzuki K, Moribe S and
Tero-Kubota S 2008 Appl. Catal. B 83 56–62
[25] Yang Y Z, Chang C-H and Idriss H 2006 Appl. Catal. B
67 217–22
[26] Ruiz A M, Cornet A, Shimanoe K, Morante J R and
Yamazoe N 2005 Sensors Actuators B 108 34–40
[27] Chen Y, Zhu C and Wang T 2006 Nanotechnology 17 3012
[28] Wu R-J, Huang Y-C, Yu M-R, Lin T H and Hung S-L 2008
Sensors Actuators B 134 213–8
[29] Brahim S, Colbern S, Gump R, Moser A and Grigorian L 2009
Nanotechnology 20 235502
[30] Liu J, Wang X, Peng Q and Li Y 2005 Adv. Mater. 17 764–7
[31] Ahn H, Park J-H, Kim S-B, Jee S H, Yoon Y S and
Kim D-J 2010 Electrochem. Solid-State Lett. 13 J125–8
[32] Wu W-Y, Ting J-M and Huang P-J 2009 Nanoscale Res. Lett.4 513
[33] Xue X Y, Chen Y J, Liu Y G, Shi S L, Wang Y G and
Wang T H 2006 Appl. Phys. Lett. 88 201907
[34] Chen Y J, Nie L, Xue X Y, Wang Y G and Wang T H 2006
Appl. Phys. Lett. 88 083105
[35] Sippel-Oakley J, Wang H-T, Kang B S, Wu Z, Ren F,
Rinzler A G and Pearton S J 2005 Nanotechnology16 2218–21
[36] Gong J, Sun J and Chen Q 2008 Sensors Actuators B
130 829–35
[37] Sun Y and Wang H H 2007 Adv. Mater. 19 2818–23
[38] Skucha K, Fan Z, Jeon K, Javey A and Boser B 2010 SensorsActuators B 145 232–8
[39] Shen Y, Yamazaki T, Liu Z, Meng D and Kikuta T 2009
J. Alloys Compounds 488 L21–5
11
Nanotechnology 23 (2012) 175501 G S Aluri et al
[40] Bertness K A, Roshko A, Mansfield L M, Harvey T E andSanford N A 2008 J. Cryst. Growth 310 3154–8
[41] Ioannides T and Verykios X E 1996 J. Catal. 161 560–9[42] Zhdanov V P 2002 Surf. Sci. 512 L331–4[43] Heimer T A, Bignozzi C A and Meyer G J 1993 J. Phys.
Chem. 97 11987–94[44] Tang H, Prasad K, Sanjines R, Schmid P and Levy F 1994
J. Appl. Phys. 75 2042–7[45] Garzella C, Comini E, Tempesti E, Frigeri C and
Sberveglieri G 2000 Sensors Actuators B 68 189–96[46] Wang H, Kang B, Ren F, Tien L, Sadik P, Norton D,
Pearton S and Lin J 2005 Appl. Phys. Lett. 86 243503[47] Lupan O, Ursaki V V, Chai G, Chow L, Emelchenko G A,
Tiginyanu I M, Gruzintsev A N and Redkin A N 2010Sensors Actuators B 144 56–66
[48] Yates J T Jr 2009 Surf. Sci. 603 1605–12[49] Bikondoa O, Pang C L, Ithnin R, Muryn C A, Onishi H and
Thornton G 2006 Nature Mater. 5 189–92[50] Meyer G J, Lisensky G C and Ellis A B 1988 J. Am. Chem.
Soc. 110 4914–8[51] Anpo M, Tomonari M and Fox M A 1989 J. Phys. Chem.
93 7300–2
[52] Mansfield L M, Bertness K A, Blanchard P T, Harvey T E,Sanders A W and Sanford N A 2009 J. Electron. Mater.38 495–504
[53] Kim K S and Barteau M A 1989 Surf. Sci. 223 13–32[54] Fujishima A, Zhang X and Tryk D A 2008 Surf. Sci. Rep.
63 515–82[55] Du X, Wang Y, Mu Y, Gui L, Wang P and Tang Y 2002
Chem. Mater. 14 3953–7[56] Islam M M, Calatayud M and Pacchioni G 2011 J. Phys.
Chem. C 115 6809–14[57] Henderson M A, Otero-Tapia S and Castro M E 1999 Faraday
Discuss. 114 313[58] Zalkind S, Yakshinskiy B V and Madey T E 2008 J. Vac. Sci.
Technol. B 26 2241[59] Norton P R and Richards P J 1974 Surf. Sci. 44 129[60] Sexton B A, Rendulic K D and Huges A E 1982 Surf. Sci.
121 181[61] Saeys M, Reyniers M-F, Marin G B and Neurock M 2002
J. Phys. Chem. B 10 7489–98[62] 2003 CRC Handbook of Chemistry and Physics 84th edn
(Boca Raton, FL: CRC Press)
12