iot based system for greenhouses remote monitoring and ... · in order to implement an iot-based...
TRANSCRIPT

Kasdi Merbah University – OUARGLA
Faculty of new technologies of information and communication
Department of Computing and Information Technology
ACADEMIC MASTER
Branch: Computer Science
Specialty:Industrial Computing
Presented by:
Charaf Eddine MECHALIKH
Rami BOUAFIA
Title:
Publicly discussed
on: 01/ 06/2017
Before the jury:
M. Abdelkader BENMIR MAA President University Kasdi Merbah -Ouargla
M. Bachir SAID MCB Supervisor University Kasdi Merbah -Ouargla
M. Hmida DJEDIAI MAA Co-supervisor University Kasdi Merbah -Ouargla.
Mlle Chahrazad TOUMI MAB Examiner University Kasdi Merbah -Ouargla
Academic year: 2016/2017
IoT Based System for Greenhouses Remote
Monitoring and Climate Control
II
Acknowledgements
Above all, we thank Allah, the all-powerful, for having given me courage and willingness to do this work.
We would like to thank our supervisors Mr. Bachir SAID and Mr. Hmida DJEDIAI for giving a very interesting subject and for advices, availability and for having the knowledge and their professional and human qualities.
Our respectful thanks to all members of the jury for the interest in our work.
We would like to express our recognition to Mr. Amor AIDOUD (Faculty of Natural Sciences and Life) that he finds here the expression of our gratitude for the interest he has to our work. And anyone who helped us reaches that point.

III
Dedication
I dedicate this modest work in the first place to my
parents who supported me to achieve all my objectives
and that they find here all therecognition and my
gratitude.
To my dearest fiancée
To my brother, my sister
to my great partner Rami
To my cousin Amel MECHALIKH (may her soul rest in
peace)
and the whole family
To all my teachers from the primary until now especially
our teachers
at the Department of Computer Science and Information
Technology
To all my comrades and friends, in particularAhmed
ABOUBOU, Mohamed Saleh BEKKOUCHE, Malek
KHANFER.
Charaf Eddine

IV
Dedication Before all, I thank God the all-powerful
for giving me courage and patience to achieve
this work despite all the difficulties encountered.
I dedicate this modest work:
To my dearest parents, my brother and my two sisters
may Allah preserve them and
protects them for their moral and financial support,
their encouragement and the sacrifices they
endured.
To my cousins and my big family
To my dear friends, especially my classmates
To all who I love and who love me
To all my colleagues of studies
To you……………
Rami

V
Table of Contents
List of Figures .................................................................................................................... VII
List of Tables....................................................................................................................... IX
General Introduction ............................................................................................................ 10
1st Part: State of The Art....................................................................................................... 11
1.1. Introduction .............................................................................................................. 11
1.2. Greenhouses Monitoring and Control ...................................................................... 11
1.2.1. Environmental Factors .................................................................................... 11
1.2.2. Existent Greenhouses Environment Control Techniques ............................... 13
1.3. Internet of things and Greenhouses .......................................................................... 15
1.3.1. Concepts .......................................................................................................... 15
1.3.2. Uses of IoT in the Greenhouses ...................................................................... 16
1.3.3. Current IoT Solutions for the Greenhouses .................................................... 17
1.4. Conclusion ................................................................................................................ 19
2nd
Part: Conception ............................................................................................................. 20
2.1. Introduction .............................................................................................................. 20
2.2. Architecture .............................................................................................................. 20
2.3. Greenhouses Automation ......................................................................................... 23
2.3.1. Environmental Factors and Possible Actions ................................................. 23
2.3.2. Automation Scenario ...................................................................................... 25
2.4. Risks and Failures Detection .................................................................................... 25
2.4.1. Failures and Actions ....................................................................................... 25
2.4.2. Failures Detection Scenario ............................................................................ 26
2.5. Remote Monitoring and Controlling ........................................................................ 27
2.5.1. Application Tasks ........................................................................................... 27
2.5.2. Application Scenario ....................................................................................... 28
2.5.3. Designing The User Interface (mobile and web applications) ....................... 29
2.6. Conclusion ................................................................................................................ 31
3rd
Part: Implementation ....................................................................................................... 32
3.1. Introduction .............................................................................................................. 32
3.2. Choosing The Plant .................................................................................................. 32
3.3. Hardware .................................................................................................................. 32
3.4. Choosing IoT Platform ............................................................................................. 33
3.4.1. IBM Bluemix ................................................................................................. 33
3.4.2. Microsoft Azure .............................................................................................. 34
3.4.3. Amazon Web Services .................................................................................... 34
3.4.4. Comparison ..................................................................................................... 35
3.5. Development Tools .................................................................................................. 36

VI
3.6. Communication Modes ............................................................................................ 37
3.7. Implementing The Solution ...................................................................................... 39
3.7.1. The Greenhouse Side ...................................................................................... 39
3.7.2. The Gateway Side ........................................................................................... 42
3.7.3. The Cloud Side ............................................................................................... 45
3.8. Mobile Application .................................................................................................. 51
3.8.1. Monitoring the Greenhouses ........................................................................... 51
3.8.2. Remote Controlling the Greenhouse ............................................................... 52
3.8.3. Weather Information ....................................................................................... 52
3.9. Web Application ...................................................................................................... 53
3.10. Prototyping .......................................................................................................... 54
3.11. Conclusion ........................................................................................................... 55
General Conclusion .............................................................................................................. 56
Bibliography ......................................................................................................................... 57

VII
List of Figures
Fig. 1: Evaporative cooling operation. ................................................................................. 14
Fig. 2: Passive cooling operation. ........................................................................................ 15
Fig. 3: GetSenso, How it works [27]. ................................................................................... 17
Fig. 4: Bitponics, how it works [11]. .................................................................................... 18
Fig. 5: Plantlink sensor and valve [45]. ................................................................................ 18
Fig. 6: HarvestGeek, monitoring and automation [37]. ....................................................... 19
Fig. 7: Greenhouse content. .................................................................................................. 22
Fig. 8: System architecture. .................................................................................................. 23
Fig. 9: Greenhouses automation sequence diagram. ............................................................ 25
Fig. 10: Failures detection sequence diagram. ..................................................................... 27
Fig. 11: Application use case diagram. ................................................................................ 28
Fig. 12: Greenhouse remote monitoring and controlling sequence diagram. ...................... 28
Fig. 13: Application activity diagram................................................................................... 29
Fig. 14: Mobile application wireframe. ................................................................................ 30
Fig. 15: Web application wireframe. .................................................................................... 31
Fig. 16: Growing sweet pepper in the greenhouse. .............................................................. 32
Fig. 17: Arduino Uno. .......................................................................................................... 32
Fig. 18: Arduino Nano.......................................................................................................... 33
Fig. 19: Raspberry pi 3 model B [47]. .................................................................................. 33
Fig. 20: Cloud Foundry [30]................................................................................................. 34
Fig. 21: ZigBee logo. ............................................................................................................ 37
Fig. 22: Wi-Fi logo. .............................................................................................................. 37
Fig. 23: Bluetooth logo. ........................................................................................................ 37
Fig. 24: Communication between the microcontrollers and the concentrator. .................... 39
Fig. 25: Attaching the sensors. ............................................................................................. 40
Fig. 26: Controlling an actuator with Arduino. .................................................................... 41
Fig. 27: Greenhouse Node-RED flows................................................................................. 41
Fig. 28: Sending greenhouses data to the IoT cloud. ........................................................... 43
Fig. 29: Receiving the command from the IoT cloud and send it. ....................................... 44
Fig. 30: Turning on the offline mode when losing the connection with the cloud. ............. 44
Fig. 31: The Complete Gateway Node-RED flow. .............................................................. 45
Fig. 32: IoT Cloud, Analyzing and storing greenhouses data. ............................................. 46
Fig. 33: IoT Cloud, supplemental lighting flow. .................................................................. 47
Fig. 34: Checking the connection between the IoT cloud and the greenhouses. ................. 47
Fig. 35: Remote controlling flow. ........................................................................................ 48
Fig. 36: Getting the greenhouse status. ................................................................................ 49
Fig. 37: Getting the greenhouses history. ............................................................................. 49

VIII
Fig. 38: Getting the weather and send it to the application. ................................................. 49
Fig. 39: Login Node-Red flow. ............................................................................................ 50
Fig. 40: Getting plant parameters values. ............................................................................. 50
Fig. 41: The complete IoT Cloud Node-RED flow. ............................................................. 51
Fig. 42: The greenhouses monitoring tab. ............................................................................ 51
Fig. 43: Controlling the greenhouses via the mobile application. ........................................ 52
Fig. 44: The weather information tab. .................................................................................. 53
Fig. 45: The web application UI. .......................................................................................... 53
Fig. 46: The prototype. ......................................................................................................... 54
Fig. 47: Some of the prototyping actuators. ......................................................................... 55

IX
List of Tables
Tab. 1: A comparison between network topologies [36]. .................................................... 20
Tab. 2: Factors values and the possible actions.................................................................... 25
Tab. 3: Failures detection. .................................................................................................... 26
Tab. 4: A comparison between three of well-known IoT platforms. ................................... 36
Tab. 5: Additional nodes to install in the Cloud Node-RED................................................ 37
Tab. 6: Wireless technologies comparison. .......................................................................... 38

General Introduction
GENERAL INTRODUCTION
10
Since the 1990s, the internet has become integrated and important in our everyday
lives. It has evolved since that time, from simple hypertext pages to internet of content (e-
mail, information...), to internet of services where services such as e-commerce were born,
to the internet of people or what we know as social media where people communicates
with one another, and finally, internet of things (IoT) [33] where things communicate and
interact (machine to machine).
While internet changes, the human population is also changing, the population will
reach 9.7 billion in 2050, which is 34% higher than today [60]. Growing enough food for a
booming world population as the climate changes are cited often as being among the
greatest challenges to face humanity [21].
To face this population growth, it's become a priority to increase food production.
With the increase of urbanization which is the shifting of people from rural to urban and
the growth of urban areas over agricultural lands, and the climate changing (floods, heat
waves, and droughts which are occurring with increasing frequency), these two factors
affects both cropyields and agricultural lands around the planet which reduces food
production and maylead to a food crisis, in this case the greenhouse appears to be the best
option as it allows to produce vegetables out of their cultivation seasons in a fully
controlled environment, and in small areas, like rooftops greenhouses for example that can
increase urban agriculture by making use of the buildings roofs.
Internet of Things (IoT) presents present an enormous opportunity and can solve many
problems. Smart Farming is among IoT applications, it helps farmers to increase
production with minimal losses and lower costs.
In this project, we will use the latest IoT technology, to get the best of Greenhouse
cultivation by reducing waste, and improving agricultural productivity, all this through the
greenhouse automation andremote monitoring. To do so, the project was divided into two
parts: the part of greenhousesremote monitoring and their climate control, and the part of
following plant development and growth.
This work is interested in the first part, and it is divided into three sections. In the first
section, we present the state of the art of greenhouse monitoring and IoT. A conception of
IoT-based greenhouse monitoring and climate control system is presented in the second
section. The last section describes the realization of an automated greenhouse prototype
and an implementation of the greenhouse monitoring and climate control system.

1st Part: State of The Art

1st PART STATE OF THE ART
11
1.1. Introduction
In order to implement an IoT-based solution for greenhouses monitoring and climate
controlling, first, we have to know the greenhouse climate factors that we need to manage,
and what the available techniques to control it are, then it is essential to know what IoT is
and what can it bring to the greenhouse agriculture.
1.2. Greenhouses Monitoring and Control
Greenhouse environmental control systems owe to the interaction of many
environmental variables affecting growth and production. The clear necessity of matching
food production to the needs of the world‟s population requires the accurate knowledge of
the factor limiting primary production. Therefore it is essential to identify and understand
these environmental factors that limit agricultural production and physiological responses
of plants to environmental stresses [46].
1.2.1. Environmental Factors
a. Temperature
Temperature plays an important role in plants growth, Plant growth requires heat. It
controls the rate of water and nutrient uptake, photosynthesis, and even cell division. Each
plant has different optimum temperature requirements, and different growth stages have
different optimums. Seedlings often benefit from warmer temperatures [52], where mature
plants tend to have smaller leaves and flowers, paler color, distorted stems and elongated
knots [40].
Soil temperatures are more crucial than air temperatures. When soil temperatures are
below 7°C, roots work slowly and have a harder time taking up water and nutrients.
When the air temperature begins to heat up, wilting can occur even though there is ample
moisture in the cold soil because of slow water uptake. Heating the soil, except for
seedling flats, may not be worth the effort [52]. In an unheated greenhouse, the main
source of heat during the daytime is solar radiation, part of which is stored in the soil.
During the night, the energy comes mainly from the soil, in the form of far IR radiation
[14].

1st PART STATE OF THE ART
12
b. Humidity
"Relative humidity" (RH) is the term used to describe the amount of water vapor
present in air expressed as a percentage of the amount needed for saturation at the same
temperature [43].
Plants have small openings in their leaves, from which gasses such as CO2 and
oxygen pass. Also, because plants do not use all the water they take, a large amount of
water vapor comes out through these openings. This vapor, along with the vapor already in
the air, causes high levels of humidity. In a greenhouse that has very little air infiltration
from the outside, heat is retained and relative humidity is often very high. Plants grow best
at a relative humidity between 45 and 60 percent. Higher humidity often may lead to more
diseases [52]. When the humidity in the greenhouse remains less than 45 percent for long
periods, plant growth suffers, because leaves lose water faster they can replace it.
Otherwise, if the humidity exceeds 80% for any length of time, the risk of leaf diseases
increases [40]. Low humidity can happen when much outside venting is going on and it
causes plants to wilt [52].
c. Light
All green plants need light so the process of photosynthesis can occur, but the intensity
and duration of the needs differ from one species to another. In general, flowering plants
need twice as much light as those grown for their leaves. The critical qualities for the light
of the greenhouse are how much plants receive (intensity) and how long it lasts. The
intensity is determined by the strength of the light source itself and its distance from the
plants [40].
When light hits the surface of the leaf, the energy of the sunlight combines with
carbon dioxide (CO2) in the air and water from the soil. By means of photosynthesis, these
elements are converted into oxygen and sugar. The oxygen is given off into the air as a
component of water vapor, while the sugar is oxidized (burned) in the plant to provide all
the energy it needs for growth [52].
d. Carbon Dioxide (CO2) and Oxygen (O2)
Carbon dioxide in the air is essential to photosynthesis. Its normal level in the air is
about 3% of the air we breathe. When CO2 is in short supply, plant growth slows. But
when the supply of CO2 increases up to and beyond 300 PPM, up to a certain point plant

1st PART STATE OF THE ART
13
growth (including food yield) increases as well. Plants use so much of the CO2 in the air
that in sealed environments like a greenhouse, the level of CO2 may be depleted from 300
PPM to 100 PPM by noon. This can easily slow plant growth by 60 percent [52].
All living things get the energy they need to live from a chemical reaction called
respiration. This process needs glucose as a starting point. In bright light photosynthesis
rate is bigger than respiration this mean CO2 is taken an Oxygen is given out, however in
dark there will be only respiration (no photosynthesis)which mean Oxygen is taken and not
given out [10].
1.2.2. Existent Greenhouses Environment Control Techniques
There are many used techniques, used to control greenhouse environment, these are
some of the popular techniques used to adjust the environmental factors:
a. Light
Supplemental lighting: Most vegetables require at least 8 hours of light per day to
produce satisfactorily. In short winter days, or if in very cloudy areas, supplemental
lighting will increase the production [52].
Increasing reflecting areas: Reflected light is a powerful concept that has enabled many
urban gardens to succeed. Reflected light is indirect sunlight that is bounced off reflective
or light-colored surfaces, and it can still bring a lot of energy to the plants. For growing
fruiting vegetables such as peppers or tomatoes, in a garden which only gets 3 or 4 good
hours of sunlight per day, reflected light might make up the difference [17].
Shading: when too much light is in the greenhouse [27].
b. Carbon dioxide
CO2enrichment (Dry Ice method): Commercial greenhouses commonly use CO2
generators to maximize production. While designing a CO2 system, yields will only
increase if CO2 is the „limiting factor‟. This means that if all other variables are not
optimal (light, fertilizer, temp/humidity, pH, etc.) the benefits of increased CO2 levels will
not be achieved [23].
CO2ventilation:The limited air movement hinders the supply of CO2 to the stomata of the
leaves for photosynthesis [14], creating an envelope of CO2 deficiency around leaves

1st PART STATE OF THE ART
14
which result in a decrease of photosynthesis rate [52]. The air movement affects the plant
growth, altering the energy transfers, the transpiration, and the CO2 absorption so that the
leaf size is affected, as well as the stem growth and the yield [14].The rate of
photosynthesis can be increased by 40 percent if the wind velocity increases from 10 to
100 centimeters per second [52].
c. Humidity
High humidity: Ventilating to the outside whenever the outside temperature is warm
enough, ventilate the moist air to the outside. This can also be done when the greenhouse is
running hot, even if it is not warm outside [52].
Low Humidity: Low Humidity may be increased by simply watering the floor and by
using swamp cooler type air conditioners. Another way is to use a misting system to spray
mist into the air. This will help cool the greenhouse while adding moisture to the air [52].
d. Temperature
Cooling
Evaporative cooling: The principle is simple.
As the exhaust fans blow air out of one end of
the greenhouse, they draw in moist air from
the other end. As the moist air moves through
the greenhouse, some of the water vaporizes,
absorbing heat in the process. Moisture is
supplied at the end opposite the fans with a
system that drips water through an absorbent
material such as cellulose or a synthetic fiber
(called “cool pads”). All incoming air passes through this wet fiber (Fig. 1)[53].
Shade cloth:The advantage of an internal shade curtain is that it can be pulled back on
cloudy days and spread out on sunny days as needed, either manually or with small
motors. The disadvantage of using an internal shade cloth is that light is converted to
heat inside the greenhouse, although plants receive less light, they don‟t get the same
reduction in heat. If the shade cloth is used outside the greenhouse, sunlight will be
converted to heat before entering the greenhouse [53].
Fig. 1: Evaporative cooling operation.

1st PART STATE OF THE ART
15
Passive cooling:Air movement is just as important as ventilation. As air warms it
rises, opening the roof (or using an extractor fan on the top of the greenhouse) while
opening the walls will encourage the warm air to leave. [16] (Fig. 2).
Fig.2: Passive cooling operation.
Heating
Electric greenhouse heaters: These are great if the greenhouse is having a power
supply and because they can be thermostatically controlled, heat is delivered only
when required so running costs need not be as high [2].
Gas heating: The heat came from a normal mains gas central heating border.
Wonderful system, but very expensive to install. The running costs were quite modest
though [2].
1.3. Internet of things and Greenhouses
The Internet of Things (IoT) paradigm is based on intelligent and self-configuring
nodes (things) interconnected in a dynamic and global network infrastructure [13]. These
things can be computing devices, mechanical and digital machines, objects, animals or
people that are provided with unique identifiers and the ability to transfer data over a
network without requiring human-to-human or human-to-computer interaction [58].
1.3.1. Concepts

1st PART STATE OF THE ART
16
The cloud computing: Cloud computing is an infrastructure in which computing power
and storage are managed by remote servers to which users connect via a secure Internet
connection using a computing device (PC, smartphone…) which become an access point to
view data or run application that is hosted on these servers [24]. It allows users to consume
a compute resource, such as a virtual machine, storage or an application, as a utility rather
than having to build and maintain computing infrastructures in house [51].
IoT platform: An Internet of Things (IoT) platform is the support software that connects
edge hardware, access points, and data networks to other parts of the value chain (generally
the end-user applications). IoT platforms typically handle ongoing management tasks and
data visualization, which allow users to automate their environment [48].
1.3.2. Uses of IoT in the Greenhouses
IoT is used in many different domains, from environment protection (forests trees
protecting, air monitoring...), energy (wind turbines, electricity meters...), public safety
(bridges, buildings, vehicles...), health (baby monitors, elderly monitors…), to agriculture
[15], especially in greenhouses where it can be used for:
a. Security
There are many ways where IoT can be used for security: infrared radiation for fire
or intrusion detection [13], Video surveillance [29], equipment tracking [35]…
b. Environmental monitoring
Some applications can be related to the continuous and long-term monitoring of gas
concentration in air, soil humidity, lighting conditions [13].
c. Climate control
Temperature, humidity and soil moisture can be monitored through various sensors.
These can then be linked to systems to trigger alerts or automate processes such as
water and air control [22].
d. Crop monitoring
Rosphere is a farm robot built by The Technical University of Madrid, which is
armed with sensors and can potentially monitor every single stalk in a field. These
robots can be configured to communicate to one another over a network. The data can

1st PART STATE OF THE ART
17
be collectively used to build information sets such as crop yield maps, and further
linked to information such as current crop prices [22].
1.3.3. Current IoT Solutions for the Greenhouses
Kaa: The Kaa open-source IoT Platform. By tying together different sensors, connected
devices, and farming facilities, it allows farmers and growers, to remote monitoring
climate, crop, and equipment, it also provides predictive analytics for crops [35].
GetSenso: Greenhouse monitoring with wireless sensor technology and IOT offers a low-
cost monitoring parameter within a greenhouse. By placing different sensors like light
sensor, humidity sensor etc. farmer can easily monitor it from a remote location. If the
farmer is unable to visit the greenhouse he can initiate an automation process like watering
or provide shade when too much of light is present [27].
With GetSenso application, the user can monitor the greenhouse parameters from its
device location through a remote desktop computer, a mobile phone or tablet. Using
GetSenso cloud application logging and monitoring of sensor data takes place in real time.
The application also provides input to set the automation values of the greenhouse (Fig. 3)
[27].
Fig. 3: GetSenso, How it works [27].
Bitponics: Is an open-source IoT gardening project that offers to growers and farmers plan
reminders which notify when they should take action, real-time sensor readings, also it

1st PART STATE OF THE ART
18
offers the ability to automatically turn connected devices on & off, to manage their garden
and to track progress over time from any web browser (Fig. 4)[11].
Fig. 4: Bitponics, how it works [11].
Plantlink: Plantlink is a soil moisture sensor that will send to the farmer a watering
reminder (push, email, text) when it‟s most convenient. This means watering precisely
when the plant needs it. If the farmer wasn‟t there, plant link sensors can notify the plant
link valve to automatically watering the plant (Fig. 5) [45].
Fig. 5: Plantlink sensor and valve [45].

1st PART STATE OF THE ART
19
HarvestGeek: An open-source, wireless, Internet of Things Greenhouse monitoring and
automation system for your farm or garden (Fig. 6). Once configured it will automatically
notify you based on the information being received from HarvestBot. You can choose to
receive notifications via SMS, Facebook, Twitter, or Email should your plants reach an
unhealthy situation that calls for your attention. You can also configure the Automation
Station to control equipment [37].
1.4. Conclusion
It is always important to make a preliminary study when starting any project, in order
to start on a strong basis.
Now after defining the important sides of our problem which are the greenhouse
climate factors, the techniques to control them, and the IoT uses in greenhouse, we're ready
to use them in the next phase which involves analyzing and designing the system.
Fig. 6: HarvestGeek, monitoring and automation [37].

2nd
Part: Conception

2nd
PART CONCEPTION
20
2.1. Introduction
The project aims to automate and to remote monitoring greenhouses using IoT
technology. So the farmer will not need to go every time to the greenhouses and check
their status.
This part is about the conception which is the method of analysis and design that aims
to formalize the preliminary stages of the development of a system in order to make this
development more faithful and answers the needs. To do this we will start with greenhouse
automation scenario by using the techniques from the previous part, then it is important to
talk about risks and failures detection and how to notify the user if something wrong
occurs, and the remote monitoring scenario which uses the previous two tasks.
2.2. Architecture
Network Topology is the schematic description of a network arrangement, connecting
various nodes (sender and receiver) through lines of connection [54]. The three main
topologies are: Bus, Ring and star topology, each of them has its advantages and
disadvantages, the following table (Tab. 1), represent a comparison between them:
Topology Installation Cable/node
failure
troubleshootin
g Performance
Bus Easy to setup
and modify
Whole network
fails fairly easy medium
Ring Hard to modify Whole network
fails difficult slow
Star Easy to setup
and modify
Only that
node is
affected
easy fast
Tab. 1: A comparison between network topologies [36].
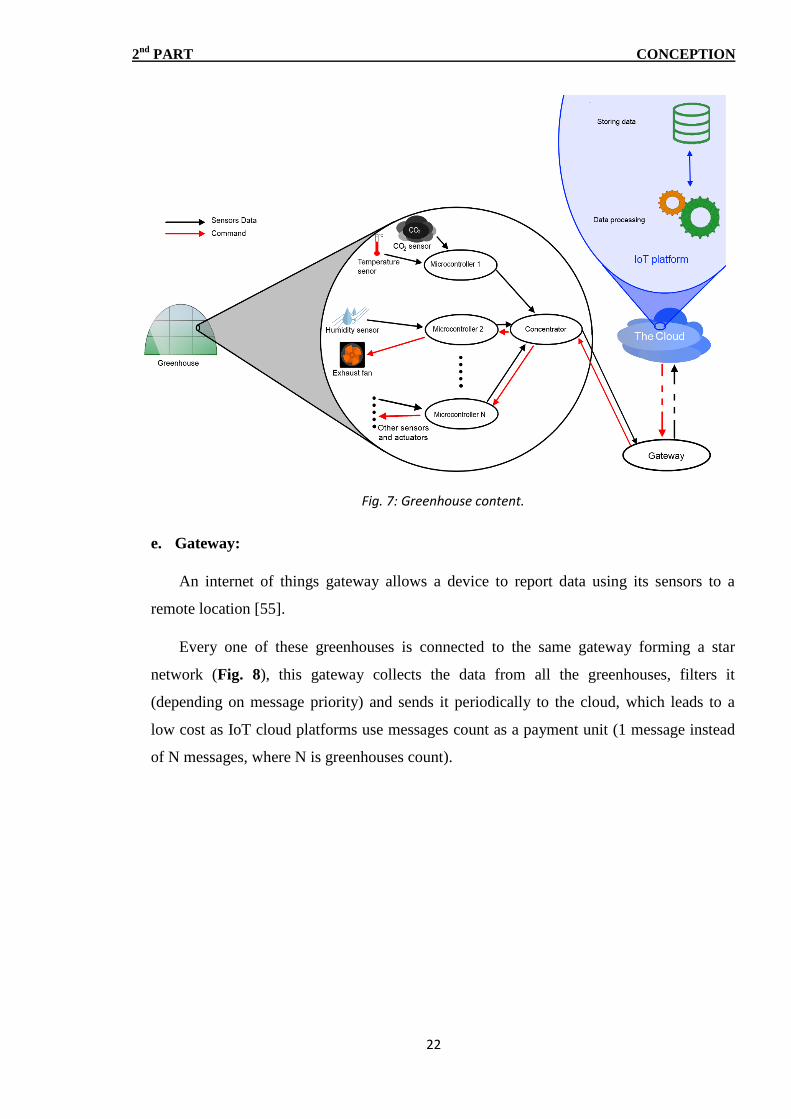
As a conclusion, the star topology is the best one to use in this case, in order to
connect the different greenhouses (Fig. 8) and to connect the different devices that a
greenhouse has (Fig. 7), and these devices are:

2nd
PART CONCEPTION
21
a. Sensors:
A sensor is a device that detects and responds to some type of input from the physical
environment. The specific input could be light, heat, motion, moisture, pressure, or any one
of a great number of other environmental phenomena. The output is generally a signal that
is converted to human-readable display [57]. These sensors send their output to
microcontrollers.
b. Actuators:
An actuator is a device consisting of a piece of machinery that has moving parts that
perform some function [61].
c. Microcontrollers:
A microcontroller is a self-contained system with peripherals, memory and a processor
that can be used as an embedded system. Some of them are more sophisticated, while
others have minimal requirements for memory and programming length and a low software
complexity. Input and output devices include solenoids, LCD displays, relays, switches
and sensors for data like humidity, temperature or light level, amongst others [25].
These microcontrollers send their output to a device that reads their output and process
it. In the greenhouse, microcontrollers read sensors data and send them to the concentrator
of that greenhouse, or they turn on/ off actuators, depending on the received command.
d. The concentrator:
A concentrator, in this case, is a credit card sized computer that link between the
greenhouse devices (sensors and actuators) and the gateway.
Among the advantages:
Collecting all greenhouse data.
It represents the greenhouse on the gateway side (it will send all greenhouse data
to the gateway, so the gateway will see it as a greenhouse).
2nd
PART CONCEPTION
22
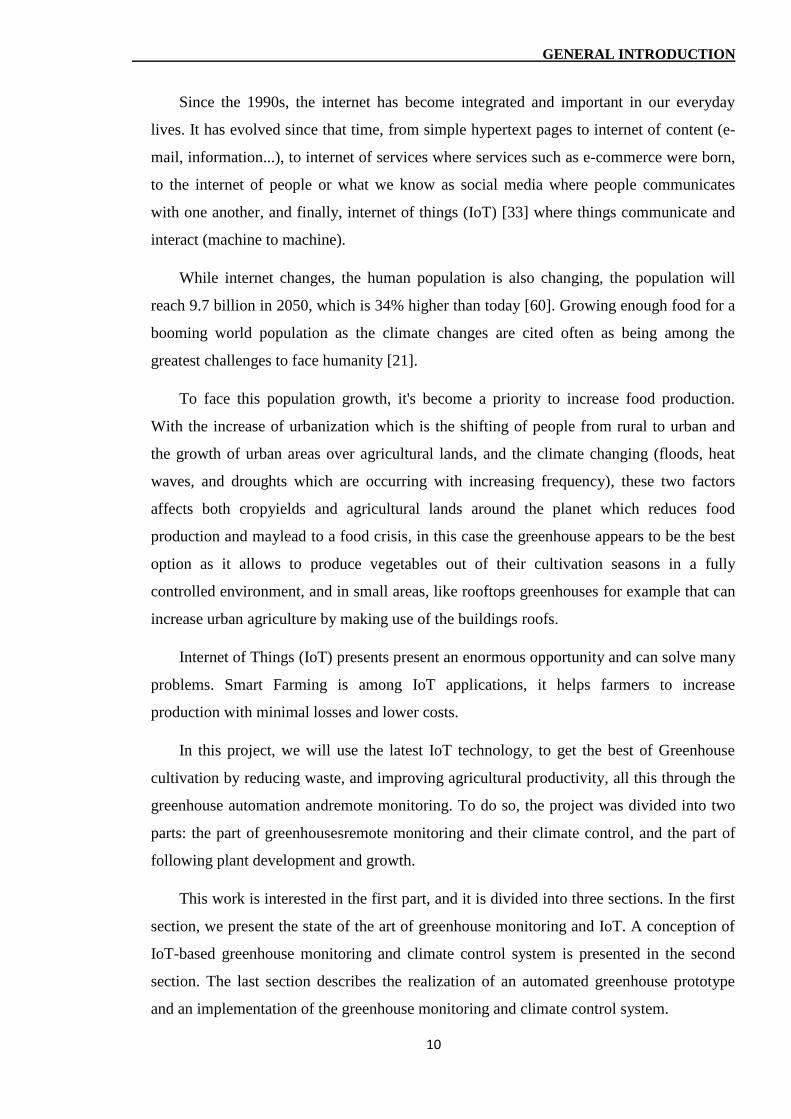
Fig. 7: Greenhouse content.
e. Gateway:
An internet of things gateway allows a device to report data using its sensors to a
remote location [55].
Every one of these greenhouses is connected to the same gateway forming a star
network (Fig. 8), this gateway collects the data from all the greenhouses, filters it
(depending on message priority) and sends it periodically to the cloud, which leads to a
low cost as IoT cloud platforms use messages count as a payment unit (1 message instead
of N messages, where N is greenhouses count).
2nd
PART CONCEPTION
23
Fig. 8: System architecture.
Since the project is about greenhouses remote monitoring and climate control, it can
be divided into three essential parts: greenhouses automation, remote monitoring and
controlling, and failures detection.
2.3. Greenhouses Automation
Automation is the linking of disparate systems and software in such a way that they
become self-acting or self-regulating [56]. In this case it is the linking of sensors and
actuators to get self-acting greenhouses.
2.3.1. Environmental Factors and Possible Actions
Every environmental factor has a max and min threshold that it has to stay in between,
the following table (Tab.2) describes the possible actions to do, to adjust a factor when it
crosses a threshold.

2nd
PART CONCEPTION
24
Factor Condition Possible actions Actuators
Temperature
> Max value
(very hot)
Evaporative cooling,
shading, opening the
roof.
Evaporative cooler,
Shade cloth, the roof
and the wall or fans.
< Min value
(very cold)
Heating by electric or
gas heater Heater
Humidity
> Max value
(High humidity)
Ventilating to the
outside Exhaust fan
< Min value
(very dry)
Watering the floor,
spraying mist,
Evaporative cooling.
Misting system
Light
Intensity > Max
value
Or
Exposure
duration > the
time needed
Shading. Shade cloth
Intensity < Min
value (Night,
cloudy day...)
Or
Exposure
duration < the
time needed
Supplemental lighting Bulbs
Carbon
dioxide < Min value CO2 enrichment
Dry ice + ventilating
Oxygen < Min value Aerate the greenhouse Open walls and roof, or
fans.
Wind High wind Close/don‟t open the
roof/ wall The roof/wall

2nd
PART CONCEPTION
25
Tab. 2: Factors values and the possible actions.
2.3.2. Automation Scenario
To automate the greenhouses using IoT, the sensors data will be transmitted through a
set of different devices,to the cloud where it get processed, if a measurement crossed the
threshold, the cloud sends a command to the specified greenhouse in order to perform the
suitable action.The diagram below (Fig. 9)describesgreenhouses automation scenario:
Fig. 9: Greenhouses automation sequence diagram.
2.4. Risks and Failures Detection
The idea here is to notify the farmer when a problem occurs in order to repair it. There
are several failures that the system can face, from which we can find:
Sensor failure: wrong output, this can damage the entire greenhouse.
Actuator failures.
Loosing connection with the cloud: this can occur often.
2.4.1. Failures and Actions

2nd
PART CONCEPTION
26
The following table (Tab. 3) shows the failures, how to detect them, and the best
action to do:
Tab. 3: Failures detection.
2.4.2. Failures Detection Scenario
The sequence diagram below represents the failures detection scenario (Fig. 10):
Failure Detection Actions
Actuators not
working properly
If an actuator is running for a
known period of time, but the
sensor results are not as
expected.
i.e.: cooling system is running
for 30min but temperature
didn‟t decrease.
Send an error message to the
user:
“the actuator <actuator id> is
not working properly/damaged”
Or
“the cooling, lighting or
heating…. system is not
working properly”
Sensors not
working properly
Using 3 sensors of same nature
and comparing their results, if
the results aren‟t same then a
sensor is not working properly
or damaged.
i.e.: two sensors give 28°C
while the third one gives 32°C,
so the third one don‟t work
properly.
Send an error message to the
user:
“The sensor <sensor id> is not
working properly/damaged”.
No internet
connection
If the cloud don‟t receive a
message for a known period of
time.
Send an error message to the
user/farmer “No connection
between Cloud and
greenhouses”.
If the gateway can‟t send
messages to the cloud.
Using the gateway instead of the
cloud until connecting again to
internet.
Device not
working
(microcontroller
…)
No messages coming from it.
Send a message to the
user/farmer
“The device <device id> not
working”.

2nd
PART CONCEPTION
27
Fig. 10: Failures detection sequence diagram.
2.5. Remote Monitoring and Controlling
The idea behind the remote monitoring and controlling is to allow the farmer to
consult the greenhouse status or history, and controlling it from anywhere with IoT, using a
mobile application or a website.
2.5.1. Application Tasks
By using the application, the user can monitor the greenhouse (view the environmental
factors current values and history, actuators state, and weather information), perform a
manual action (turn on or off an actuator), and view the notifications, the following
diagram describe the use case diagram of the application (Fig. 11).
2nd
PART CONCEPTION
28
Fig. 11: Application use case diagram.
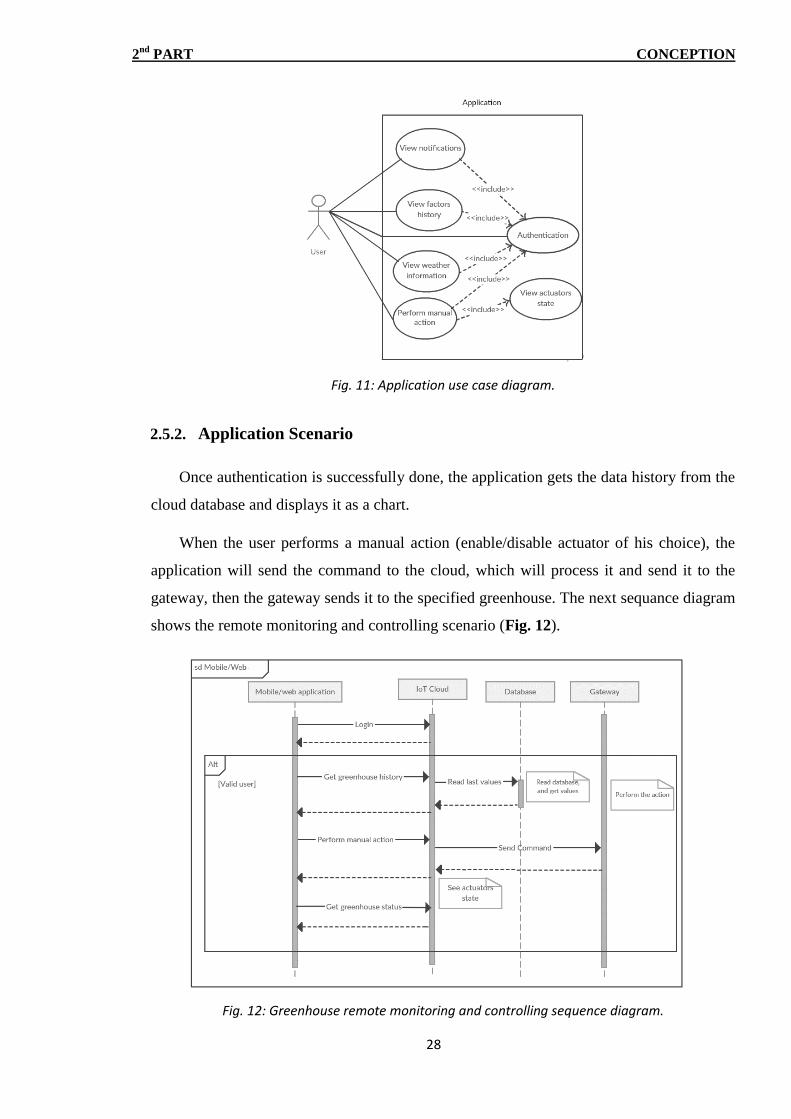
2.5.2. Application Scenario
Once authentication is successfully done, the application gets the data history from the
cloud database and displays it as a chart.
When the user performs a manual action (enable/disable actuator of his choice), the
application will send the command to the cloud, which will process it and send it to the
gateway, then the gateway sends it to the specified greenhouse. The next sequance diagram
shows the remote monitoring and controlling scenario (Fig. 12).
Fig. 12: Greenhouse remote monitoring and controlling sequence diagram.
2nd
PART CONCEPTION
29
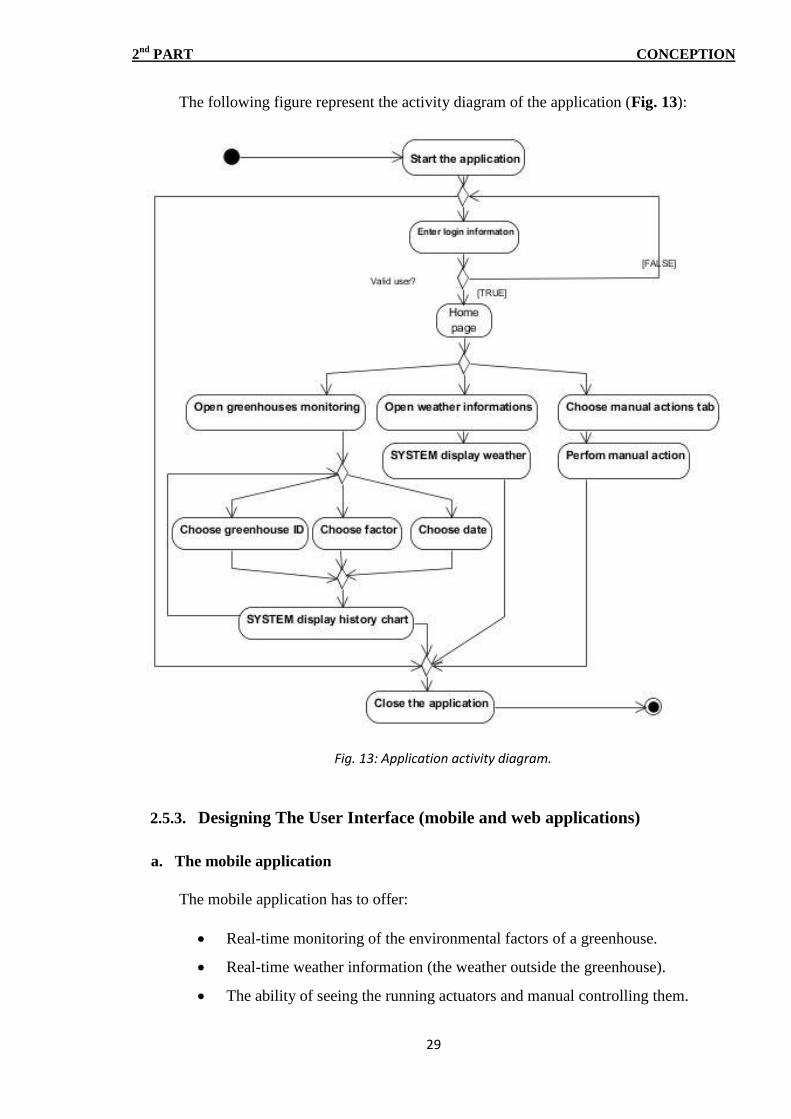
The following figure represent the activity diagram of the application (Fig. 13):
Fig. 13: Application activity diagram.
2.5.3. Designing The User Interface (mobile and web applications)
a. The mobile application
The mobile application has to offer:
Real-time monitoring of the environmental factors of a greenhouse.
Real-time weather information (the weather outside the greenhouse).
The ability of seeing the running actuators and manual controlling them.

2nd
PART CONCEPTION
30
Designing the mobile application
Because the application has three major goals, its user interface should have three tabs
each one for a specific goal. The following wireframe (Fig. 14) represent the result and
explains the different parts that the application will have.
Fig. 14: Mobile application wireframe.
b. The web application
Like the mobile application, the web application should offer a remote monitoring
ability, information about the weatheroutside the greenhouses, display the running
actuators and the ability to control them manually. This wireframe (Fig. 15) shows its
functionalities:

2nd
PART CONCEPTION
31
Fig. 15: Web application wireframe.
2.6. Conclusion
This part was about defining the architecture, the scenarios, and the work plan. With
the information that we had from the first part, now we can start the next phase, which is
about implementing and building a running product from this conception phase.

3rd
Part: Implementation

3rd
PART IMPLEMENTATION
32
3.1. Introduction
Implementation is the process of creating a finished product from a conception
document, it involves the analysis of requirements, installation, configuration, execution,
testing and more, depending on the nature of the project.
In this part we will talk about the implementation of the solution which includes the
plant we worked on, the chosen IoT platform, the software and the hardware we used, and
the node-red configuration.
3.2. Choosing The Plant
Since every plant has its specific needs, the solution
will depend on the plant species, so it is important to select
one to work on:
Selected plant species:Sweet pepper.
Botanical name:Capsicum annuum.
Family:Solanaceae.
Growing conditions:
Temperature between 20°C and 30°C during day,
and between 15°C and 20°C during night [31].
Humidity between 60% and 70% [31].
It requires 6-8 hours a day of direct sunlight [12], where the light must be superior
of 9000 lux [9].
3.3. Hardware
To implement the solution, we will use these following
devices:
a. Arduino Uno R3 (as microcontroller): Arduino
Uno R3 is the third version of Arduino Uno the
board (see Fig. 17) [26]. The Arduino Uno line, is
the best choice for getting started and prototyping
[26][5]. However for advanced users the compact
Fig. 16: Growing sweet pepper in the greenhouse.
Fig. 17: Arduino Uno.

3rd
PART IMPLEMENTATION
33
version called “Arduino Nano” will be the best option [4] (see Fig. 18).
b. Sensors: Humidity and temperature sensor
(DHT11), light sensor (Mini Photocell SEN-
09088), CO2 Meter and Oxygen sensor.
c. Actuators: Bulbs (for supplemental lighting),
heaters, misting system, retractable roof, walls,
fans…
d. Raspberry pi 3 model B (a credit card sized computer used in every greenhouse to
gather the data of sensors (concentrator Fig. 7) or used as a gateway between the
cloud and the greenhouses Fig. 8).
The raspberry pi 3 model (see Fig. 19) b comes with [47]:
▪ A 1.2GHz 64-bit quad-core ARMv8 CPU
▪ 1GB of RAM
▪ 4 USB ports
▪ 802.11n Wireless LAN
▪ Bluetooth 4.1
▪ Bluetooth Low Energy (BLE)
▪ HDMI port…and more.
3.4. Choosing IoT Platform
Nowadays, there are various IoT platforms available and can be used for developing
an IoT solution. In this section, we have covered three popular platforms that are widely
used for IoT solution building.
3.4.1. IBM Bluemix
IBM Bluemix is a platform as a service (PaaS) cloud which is developed by IBM. It
supports programing languages like java, php, Python, Node.js, Go and many more.
Integrated DevOps allows to build, run, deploy as well as to manage applications over IBM
Bluemix cloud [59].
Fig. 19: Raspberry pi 3 model B [47].
Fig. 18: Arduino Nano.

3rd
PART IMPLEMENTATION
34
Cloud Foundry is an open-standard, open-source PaaS framework and community,
funded and managed by IBM and other vendors. It runs on a broad range of cloud
infrastructure platforms, including OpenStack, VMware, and IBM SoftLayer. It also
supports a wide range of application programming language runtimes and frameworks,
including Java, Ruby, JavaScript, and Python (see Fig.20). Cloud Foundry has a large,
vibrant ecosystem of partners, vendors, and users, enabling enterprises to develop cloud-
centric applications based on its open standard without fear of vendor lock-in [30].
Fig. 20: Cloud Foundry [30].
3.4.2. Microsoft Azure
Microsoft Azure is a growing collection of integrated cloud services that developers
and IT professionals use to build, deploy, and manage applications through our global
network of datacenters. With Azure, you get the freedom to build and deploy wherever you
want, using the tools, applications, and frameworks of your choice [8].
3.4.3. Amazon Web Services
AWS IoT is a managed cloud platform that lets connected devices easily and securely
interact with cloud applications and other devices. AWS IoT can support billions of
devices and trillions of messages and can process and route those messages to AWS
endpoints and to other devices reliably and securely. With AWS IoT, your applications can

3rd
PART IMPLEMENTATION
35
keep track of and communicate with all your devices, all the time, even when they aren‟t
connected [3].
3.4.4. Comparison
The following table (Tab. 4) shows a comparison between the three well known IoT
platformsmentioned earlier [3][7][19]:
Microsoft Azure Amazon AWS IoT IBM Bluemix
Protocols
HTTP, AMQP,
MQTT and custom
protocols (using
protocol gateway
project)
HTTP,
MQTT,WebSocket
HTTP,
MQTT,Sockets/
WebSocket
SDK/languages .Net and UWP, Java,
C, NodeJS
C, NodeJS,JavaScript
and Arduino
programming
languages
Java, C#,php
C,Go,Swift,Ruby
Python,NodeJS and
more.
Authentication Per-device with SAS
token
X.509 certificate
client authentication,
IAM service, Cognito
service
Per-device with
token
Pricing
Free for up to 8,000
messages per month
or $50 per month for
400,000 messages.
$5 per million
messages
30 day trial for
free,1$
approximately for
every 1Gb of
messages ( 400,000
messages can cost
from 0.29$ to 49,90$
depending on
messages size)[32]
Registration Credit card required Credit card required No credit card

3rd
PART IMPLEMENTATION
36
Tab. 4: A comparison between three of well-known IoT platforms.
For the implementation of our system we have chosen IBM Bluemix IoT
platformsince it offers a miscellaneous service catalogue and a 30 day trial which is ideal
forthe application testing and also a very good pricing as our estimated message size will
be around 1Kb.
3.5. Development Tools
The development tools needed in order to implement the solution are:
Arduino IDE: The open-source Arduino Software (IDE) makes it easy to write
code and upload it to the board. It runs on Windows, Mac OS X, and Linux. It can
be used with any Arduino board [6]. The official IDE for programming the
Arduino Uno.
Android Studio: for building the mobile application (for Android OS) in Java
programming language.
Note-Pad++: recommended to write HTML, CSS and JavaScript web application
codes.
Node-RED: Node-RED is a programming tool for wiring together hardware
devices, APIs and online services in new and interesting ways. It provides a
browser-based editor that makes it easy to wire together flows using the wide
range of nodes in the palette that can be deployed to its runtime in a single-click
[42], it allows to write functions in JavaScript.
Additional nodes to install in the IoT cloud Node-RED:
Node Package name Description Graphic representation
Suncalc Node-RED-node-
suncalc
A node that provides
a signal at
sunrise/sunset
Splitter Node-RED-
contrib-splitter
A node that splits an
array and returns its
items one by one

3rd
PART IMPLEMENTATION
37
Openweatherm
ap
Node-RED-node-
openweathermap
A node that gets the
weather report and
forecast from
OpenWeatherMap.
Tab. 5: Additional nodes to install in the Cloud Node-RED.
3.6. Communication Modes
There is a multitude of wireless standards that address high data transport. Among them we
find the following standards:
a. ZigBee (IEEE 802.15.4)
ZigBee is a LP-WPAN (Low Power-Wireless Personal Area
Network) a wireless communication protocol designed by the
ZigBee Alliance based on the IEEE 802.15.4 standard that
defines the PHY (Physical) and Medium Access Control (MAC)
layers [38].
b. Wi-Fi (IEEE 802.11)
Wi-Fi is technically an industry term that represents a type of
wireless local area network (LAN) protocol based on the 802.11
IEEE network standard [44].
c. Bluetooth (IEEE 802.15.1)
Bluetooth is a wireless personal area network (WPAN)
technology that is a low-range wireless network technology. It
allows devices to be connected to each other without a wired
link[18].
d. Bluetooth Low Energy (IEEE 802.15.6)
Also known as Bluetooth Smart or BLE, it appeared in 2010
with the release of version 4.0 of the Bluetooth Core Specification. The Bluetooth Low
Energy is an alternative to conventional Bluetooth, with a reduction in cost and power
consumption while maintaining an equivalent range of communication[1].
Fig. 21: ZigBee logo.
Fig. 22: Wi-Fi logo.
Fig. 23: Bluetooth logo.
3rd
PART IMPLEMENTATION
38
e. Comparison
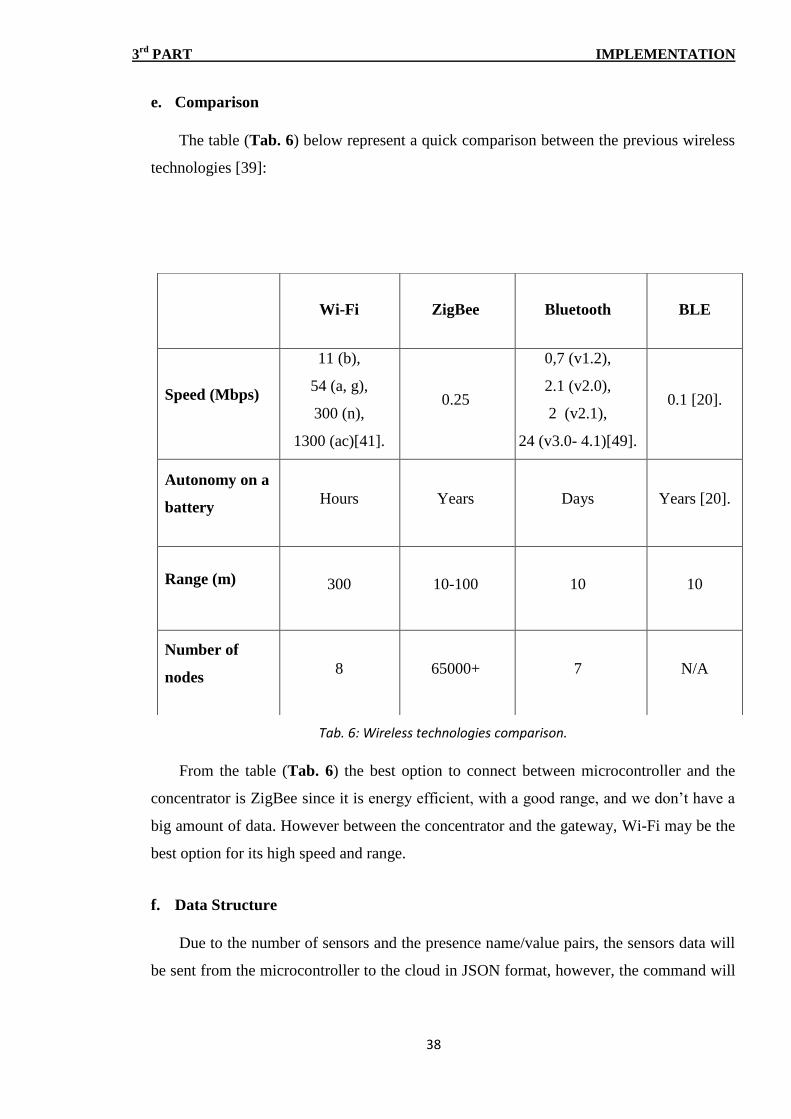
The table (Tab. 6) below represent a quick comparison between the previous wireless
technologies [39]:
Tab. 6: Wireless technologies comparison.
From the table (Tab. 6) the best option to connect between microcontroller and the
concentrator is ZigBee since it is energy efficient, with a good range, and we don‟t have a
big amount of data. However between the concentrator and the gateway, Wi-Fi may be the
best option for its high speed and range.
f. Data Structure
Due to the number of sensors and the presence name/value pairs, the sensors data will
be sent from the microcontroller to the cloud in JSON format, however, the command will
Wi-Fi ZigBee Bluetooth BLE
Speed (Mbps)
11 (b),
54 (a, g),
300 (n),
1300 (ac)[41].
0.25
0,7 (v1.2),
2.1 (v2.0),
2 (v2.1),
24 (v3.0- 4.1)[49].
0.1 [20].
Autonomy on a
battery Hours Years Days Years [20].
Range (m) 300 10-100 10 10
Number of
nodes 8 65000+ 7 N/A

3rd
PART IMPLEMENTATION
39
be sent from the cloud to concentrator in JSON but from the concentrator to the
microcontroller as a simple string in order to easily process it (see Fig. 24).
JSON: (JavaScript Object Notation) is a lightweight data-interchange format. It is a text
format that is completely language independent but uses conventions that are familiar to
programmers of the C-family of languages, including C, C++, C#, Java, JavaScript, Perl,
Python, and many others. These properties make JSON an ideal data-interchange language,
it is built on two structures [9]:
A collection of name/value pairs. In various languages, this is realized as an
object, record, struct, dictionary, hash table, keyed list, or associative array.
An ordered list of values. In most languages, this is realized as an array, vector,
list, or sequence.
Fig. 24: Communication between the microcontrollers and the concentrator.
3.7. Implementing The Solution
This section will be divided into three parts, the first one represents the greenhouse
(devices inside the greenhouse), the second is the gateway, and the last is IoT cloud.
3.7.1. The Greenhouse Side
A greenhouse designates a set of sensors, actuators, microcontrollers (Arduino Uno)
and a concentrator (Raspberry Pi). Where the sensors and the actuators are connected to
their microcontrollers, while the microcontrollers are connected to the concentrator.

3rd
PART IMPLEMENTATION
40
a. Microcontrollers (Arduino Uno)
Every Greenhouse will have three microcontrollers, two of them are just for
measurement and they‟re connected to the same set of sensors (Fig. 25), while the third
one is connected to actuators (Fig. 26).
Fig. 25: Attaching the sensors.
The first two, collect sensors data, and send it to the raspberry pi in JSON format, their
output result will be like:
{"Temp":"23",
"Hum":"55",
"co2":"330",
"Oxygen":"21",
"Light":"1200"}

3rd
PART IMPLEMENTATION
41
Fig. 26: Controlling an actuator with Arduino.
b. The Concentrator (The Raspberry Pi)
The following figure (Fig. 27)presents the Node-RED configuration of the
concentrator (the Raspberry Pi of a greenhouse) and its function:
Fig. 27: Greenhouse Node-RED flows.
Both microcontrollers 1 and 2 have same sensors, while microcontroller 3 have only
actuators.
3rd
PART IMPLEMENTATION
42
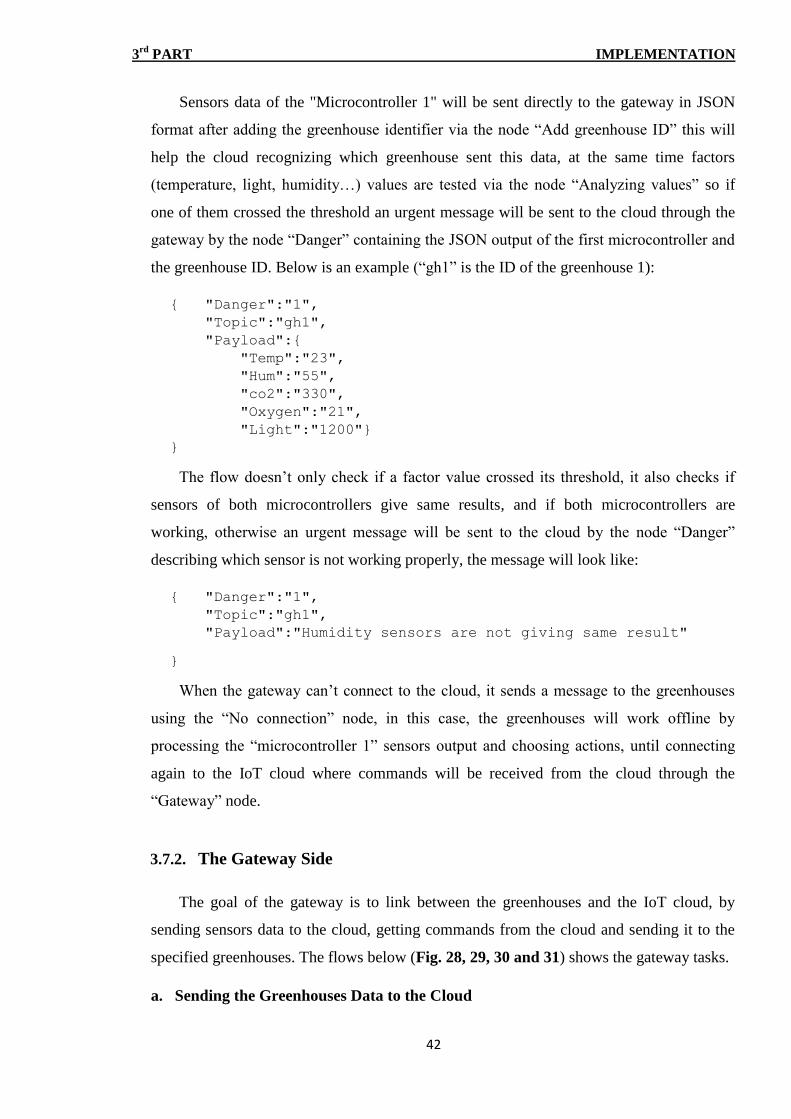
Sensors data of the "Microcontroller 1" will be sent directly to the gateway in JSON
format after adding the greenhouse identifier via the node “Add greenhouse ID” this will
help the cloud recognizing which greenhouse sent this data, at the same time factors
(temperature, light, humidity…) values are tested via the node “Analyzing values” so if
one of them crossed the threshold an urgent message will be sent to the cloud through the
gateway by the node “Danger” containing the JSON output of the first microcontroller and
the greenhouse ID. Below is an example (“gh1” is the ID of the greenhouse 1):
{ "Danger":"1",
"Topic":"gh1",
"Payload":{
"Temp":"23",
"Hum":"55",
"co2":"330",
"Oxygen":"21",
"Light":"1200"}
}
The flow doesn‟t only check if a factor value crossed its threshold, it also checks if
sensors of both microcontrollers give same results, and if both microcontrollers are
working, otherwise an urgent message will be sent to the cloud by the node “Danger”
describing which sensor is not working properly, the message will look like:
{ "Danger":"1",
"Topic":"gh1",
"Payload":"Humidity sensors are not giving same result"
}
When the gateway can‟t connect to the cloud, it sends a message to the greenhouses
using the “No connection” node, in this case, the greenhouses will work offline by
processing the “microcontroller 1” sensors output and choosing actions, until connecting
again to the IoT cloud where commands will be received from the cloud through the
“Gateway” node.
3.7.2. The Gateway Side
The goal of the gateway is to link between the greenhouses and the IoT cloud, by
sending sensors data to the cloud, getting commands from the cloud and sending it to the
specified greenhouses. The flows below (Fig. 28, 29, 30 and 31) shows the gateway tasks.
a. Sending the Greenhouses Data to the Cloud

3rd
PART IMPLEMENTATION
43
The following flow allows to send the greenhouses data to the cloud (Fig. 28):
Fig. 28: Sending greenhouses data to the IoT cloud.
The “Danger” node represents the urgent message received from a greenhouse, this
type of messages shouldn‟t wait and have to be sent directly to the cloud.
The “Join” node will join the greenhouses messages (data) into one message
represented as a JSON Array (each item of the array designate a greenhouse), and the
“Limit” node sends to the cloud only one message every 30 minutes. Below is an example
of the “Join” node output:
[
{"Topic":"gh1","Payload":{
"Temp":"23",
"Hum":"55",
"co2":"330",
"Oxygen":"21",
"Light":"1200"}},
{"Topic":"gh2","Payload":{…}},
{"Topic":"gh3","Payload":{…}},
{"Topic":"gh4","Payload":{…}}
]
b. Receiving Command From the Cloud
When receiving commands from the IoT cloud, the “switch” node, will send the
command to the specified greenhouse (see Fig. 29):

3rd
PART IMPLEMENTATION
44
Fig. 29: Receiving the command from the IoT cloud and send it.
The received command is a JSON object, containing the greenhouse ID and the action
name. If “gh1” is the greenhouse ID, and the “heateron” is the action name (to turn on the
heater) the command will be like:
{”topic”:”gh1”,”payload”:”heateron”}
c. Checking the Connection With the Cloud
If the gateway sends a message to the cloud(whether an urgent message via the
“Danger” node or a normal via the “limit” node), it waits for a feedback from the cloud to
confirm that the message was sent.
The concept here is to use the feedback to detect if the connection with the cloud was
lost, if there‟s no connection, the gateway will send the no connection command to the
greenhouses to enable the offline mode, the following Node-RED flow represents the way
used to detect this issue(see Fig. 30):
Fig. 30: Turning on the offline mode when losing the connection with the cloud.
Understanding the flow:
The “Greenhouse tag” node replaces the message with the keyword “Greenhouse”
indicating that the greenhouses sent a message to the cloud.

3rd
PART IMPLEMENTATION
45
The “delay” node will wait for 15 seconds before sending the “Greenhouse” keyword
to the “Feedback received?” node.
The “Cloud tag” node like “the greenhouse tag” replaces the message received from
the cloud with the “Cloud” keyword, indicating that a message was received from the
cloud.
The “Feedback received?” function checks if the feedback was received from the
cloud after sending a message within the delay of 15 sec. If no feedback received
then the connection with the cloud was lost, and the gateway will order the
greenhouses to work offline via the WebSocket node “No connection” (and vice-
versa).
The “reset” node, initialize the variables of the “Feedback received?” function.
d. The Complete Gateway Node-RED flow
Linking the previous flows together will result in the whole Node-RED flow of the
gateway showed in the figure below (see Fig. 31):
Fig. 31: The Complete Gateway Node-RED flow.
3.7.3. The Cloud Side
a. Analyzing and Storing Data
When the greenhouses data reach the IoT cloud, it will be stored in the cloud database
which will help later in getting the data history, at the same time it will be processed to get
the suitable action and then send it to the gateway (Fig. 32).

3rd
PART IMPLEMENTATION
46
Fig. 32: IoT Cloud, Analyzing and storing greenhouses data.
Thegateway message is received through the “IBM IoT” node, it can be a danger
message indicating that something is wrong, or the greenhouses sensors data represented as
a JSON array where each element of this array represents a greenhouse.
The message will be filtered via the function “Check whether danger or not”, if it is a
danger message the greenhouses status will be updated (the global variable), else (in this
case the message represents the greenhouses data) it will be processed and stored in the
cloud database (via the “Database” node) for later use.
Before getting processed, the greenhouses data will be tagged as “Data” with the
function “Tag as Data”, after that it will pass through the “Splitter” node which sends the
array elements one by one to the “Data analysis” node.
The “Data analysis” node uses two inputs: the first is the greenhouse data which is
tagged as “Data”, and because some factors thresholds changes from day to night the
second input tells the function whether it is day or night.It also checks the weather
information (Fig. 38) so if the weather outside the greenhouses matches the plant needs,
the greenhouses will be opened (walls and roof) and the humidity and temperature related
actuators will be turned off, which will help saving energy.
After processing, this function will choose the possible actions for every greenhouse
and send them to the function “Send and save command” which as the name says, it sends
the commands to the gateway through the “IBM IoT” output node, and saves it in the
global variable.
b. Supplemental Lighting
The goal of the following flow is to calculate when the system should turn on or off
the supplemental lighting (Fig. 33):

3rd
PART IMPLEMENTATION
47
Fig. 33: IoT Cloud, supplemental lighting flow.
The “Create the day/night variable” will create the variable where the system stores
day/night values and the sunrise time, this will allow to calculate the greenhouses
exposition to the sun, and if the exposition time is inferior to the plant needs supplemental
lighting will be activated.
The “if sunrise” function node, test if the sun rose, so it will start the timer (the delay
node) which will automatically disable the supplemental lighting if it was already enabled
(The 8 hours on the delay node, means that the plant needs about 8 hours of sunlight daily.
So no need for supplemental lighting after the 8 hours ends).
The function “check if it is sunrise”, will check if it is a sunrise or a sunset, calculates
the exposition time, and then decides if it should send turn on/off command of
supplemental lighting.
c. Checking the Connection Between the Cloud and the Greenhouses
The following Node-RED flow (Fig. 34) aims to notify the user when the connection
to the greenhouses is lost:
Fig. 34: Checking the connection between the IoT cloud and the greenhouses.
The greenhouses send their data to the cloud through the “IBM IoT node” every 30
min, so if no message was received after this delay, the cloud notifies the user that there is
no connection between it and the greenhouses.
The “Message received” function needs three inputs:

3rd
PART IMPLEMENTATION
48
a. The input tagged as “Reset”: this will initialize the variables of this function, so it
will start from the beginning.
b. The input tagged as “Greenhouse”: if the function receive this input before
receiving the “Cloud” called input, this means there is connection with the
greenhouses.
c. And The “Cloud” named input: when the function receives this as input, this means
the delay of 31 min has finished. So if no greenhouse data was received in the last
31 min, the function will save the error message “No connection to the
greenhouses” in the global variable to access it later via the mobile/web application.
Otherwise, it will remove the message (if greenhouse data was received).
d. Remote Controlling
Remote controlling is the ability to perform a manual action (send a turn on/off
command to a specified actuator of a greenhouse) from any location using the mobile/ web
application.
Fig. 35: Remote controlling flow.
The mobile/ web application sends the desired command to the cloud via the
WebSocket protocol.
The function “Check and send the command” get the command from the WebSocket
node “control”, analyses it, updates the global variable and sends the command to the
gateway (see Fig. 35).
e. Getting the greenhouse status
Besides the remote controlling, the application provides the ability to see the
greenhouses status (current values, error messages, and actuators states):

3rd
PART IMPLEMENTATION
49
Fig. 36: Getting the greenhouse status.
The mobile/web application sends the request via the WebSocket protocol (the
“Status” nodes, see Fig. 36), once the request received the “Get last status” function will
read the global variable and sends the actuators states and the errors messages to the
application.
f. Getting the history
The application should display the historyof environmental factors values, the
application sends the date of the requested values, and the cloud reads the database,
searches (via the “Search” function) for the values matching that date, and then it sends
them back to the application via the “Measures” WebSocket node (Fig. 37).
Fig. 37: Getting the greenhouses history.
g. Getting the Weather information
One of the Node-RED advantages, is the availability of many weather services nodes,
in this project we used OpenWeatherMap service, to get weather information from the
greenhouse location to the mobile and web applications. The figure below shows the Node-
RED flows responsible of getting and sending the weather information (Fig. 38):
Fig. 38: Getting the weather and send it to the application.

3rd
PART IMPLEMENTATION
50
h. Authentication
To ensure that only the specified user or users can access the data via the mobile or web
application, the following flow (Fig. 39) will compare the email and the password entered
by the user:
Fig. 39: Login Node-Red flow.
i. Getting the plant parameters
The flow below (Fig. 40) uses WebSocket protocol to get the plant information from
the plant grow monitoring project mentioned early in the introduction, the “Create plant…”
node initialize the variable declared in the function “Value of plant parameters”.
Fig. 40: Getting plant parameters values.
The plant parameters variable is a JSON
{"temp":{"maxnight":"20","maxday":"30","minnight":"15","minday":"20"
},"hum":{"maxnight":"70","maxday":"70","minnight":"60","minday":"60"
},…}
j. The complete Cloud Node-RED flow
Joining all the previous flows will result in the flowing Node-RED flow (Fig. 41):

3rd
PART IMPLEMENTATION
51
Fig. 41: The complete IoT Cloud Node-RED flow.
3.8. Mobile Application
3.8.1. Monitoring the Greenhouses
Once the application opened, the user will get in the
greenhouse monitoring area (item 1, Fig. 42), in case there is
an internet connection, and it will show directly the
temperature history of that day of the “Greenhouse 1”.
The user can change which environmental
factortodisplay (Item 3), of which greenhouse (item 2), and if
he wanted to explore the previous days, he can choose the
desired date (item 4).
Fig. 42: The greenhouses monitoring tab.

3rd
PART IMPLEMENTATION
52
The factors history is displayed as a chart, every point represents a value at a specific
time (item 5), also in the bottom right corner of the chart, the application shows the last
value of the selected factor and the time when it was sent to the cloud (items 6 and 7).
The application also shows the error message when something is not working fine
(item 8), so the user can check the greenhouse.
3.8.2. Remote Controlling the Greenhouse
The application offers to the user the ability to execute
actions manually, this can helps when the farmer checks the
greenhouses actuators for example, or when the weather
outside is too good and the user wants to open the
greenhouse. To do so, the application lists the available
actuators (item 3 Fig. 43), and provides two separated
options: manual mode (item 1) and on/off the actuator (item
5).
If the user wants to enable or disable an actuator, he
must enable the manual mode of that actuator first (manual
mode is enabled for the actuator “Fan», see item 2), and then
toggle the on/off to enable or disable that actuator (item 4).
Once the manual mode is enabled, a notification will be shown in the notification
drawer. So the user doesn‟t forget it.
3.8.3. Weather Information
The weather tab, in the mobile application, represents the weather information of
outside the greenhouses, the application show a quick weather description (item 1 Fig.44),
and the detailed weather information (item 2) which includes the outside temperature or
humidity, the wind speed and its direction, and cloud coverage which means how match is
that area covered with clouds (0% means a clear sky).
Fig. 43: Controlling the greenhouses via the mobile
application.

3rd
PART IMPLEMENTATION
53
Fig. 44: The weather information tab.
3.9. Web Application
The web application has the same options that the mobile application has, from
choosing the greenhouse, the environmental factor and the date, to display the chart, to the
manual control and the weather information (Fig. 45):
Fig. 45: The web application UI.

3rd
PART IMPLEMENTATION
54
3.10. Prototyping
To test how the system perform in real life, we managed to build a prototype (Fig. 46).
Dimensions:
Height: 115cm
Width: 77cm
Length: 102cm
Materials:
Built with wood
Covered with 1mm nylon sheet.
Actuators:
To test the system we used these actuators (Fig. 47):
A led light bulb: as a lighting system
PC Fans : as exhaust fans
Removable walls
Custom heater (consist of a 12v automotive light
bulb Klaxcar H4 + a PC fan) Fig. 46: The prototype.

3rd
PART IMPLEMENTATION
55
3.11. Conclusion
In this part, we successfully implemented the solution of using Internet of things
technology in monitoring and controlling the greenhouses environment.
We can't say that we didn't face any problem during this phase especially that we
couldn't realize all the possibilities with the sensors and the actuators we have which forced
us to only test one greenhouse with some actuators and simulate the other actuators and
greenhouses. We also wish that we had all the project requirements and more time to test it
in real conditions.
Fig. 47: Some of the prototyping actuators.

General Conclusion
GENERAL CONCLUSION
56
In this project, we worked onagriculture, preciselyin the greenhouse cultivation part.
We successfully employed Internet of Things technology in the automation of the
greenhousesand theremote monitoring with failures detection ability through mobile and
web applications. It is important to mention that here we were interested only about the
environmental factors and not about the plant growth which includes watering, treating
diseases, and grow monitoring which is the second part of the project.
The IoT cloud based platform we have used allowed the free access to many cloud
and web services (storage, processing, communication, notification...and so on) for
example a weather service is used instead of using to replace a hardware weather station.
We thought also about adding the video surveillance to this solution, but since we couldn‟t
get all the sensors and actuators needed, we simulate them by injecting the values as if they
were real sensors.
What‟s next? The project is only on its beginning and because “Program testing can
be used to show the presence of bugs, but never to show their absence!.” - Edsger W.
Dijkstra [28], it still needs more testing and -depending on test results- it may needs
improvement and bugs fixing.
To conclude, agriculture in general, is an extremely important field that we should
care more about, with urbanization growing over green areas. Today, a lot of studies are
focusing on increasing urban agriculture to benefit from wasted areas such as buildings
roofs for growing food in order to face the urban and population growth, but as Dennis
Dimick -National Geographic's Executive Editor- said: “Not only must we grow more
food, we must grow more people interested in growing more food” [21] and this is why we
think that an IoT based greenhouse system should be integrated in the smart buildingand
smart city ecosystems.

BIBLIOGRAPHY
57
Bibliography
[1] Abgrall, C. (2015). Le BLE (Bluetooth Low Energy) – Blog technique Groupe SII.
[online] Blog.groupe-sii.com. Available at: https://blog.groupe-sii.com/le-ble-bluetooth-
low-energy/ [Accessed 17 Apr. 2017].
[2] Allotment & Gardens. (n.d.). Greenhouse Heating Guide - Various Types Reviewed.
[online] Available at: http://www.allotment-garden.org/greenhouse-growing/greenhouse-
heating-guide-reviewed/ [Accessed 3 Feb. 2017].
[3] Amazon Web Services, Inc. (n.d.). AWS IoT Platform - Amazon Web Services. [online]
Available at: https://aws.amazon.com/iot-platform/ [Accessed 13 Apr. 2017].
[4] Arduino.cc. (n.d.). Arduino - ArduinoBoardNano. [online] Available at:
https://www.arduino.cc/en/Main/ArduinoBoardNano [Accessed 17 Apr. 2017].
[5] Arduino.cc. (n.d.). Arduino - ArduinoBoardUno. [online] Available at:
https://www.arduino.cc/en/main/arduinoBoardUno [Accessed 17 Apr. 2017].
[6] Arduino.cc. (n.d.). Arduino - Software. [online] Available at:
https://www.arduino.cc/en/Main/Software [Accessed 19 Apr. 2017].
[7] Azure.microsoft.com. (n.d.). Microsoft Azure: Cloud Computing Platform & Services.
[online] Available at: https://azure.microsoft.com/ [Accessed 14 Apr. 2017].
[8] Azure.microsoft.com. (n.d.). What is Azure—the Best Cloud Service from Microsoft |
Microsoft Azure. [online] Available at: https://azure.microsoft.com/en-
us/overview/what-is-azure/ [Accessed 13 Apr. 2017].
[9] Barakat, M., Al-laham, M., Arsan, W. and Saada, Y. (2014). انبزَايح اإلرشادي نهفهفم في 1st ed. The Palestinian .[Training Program For Growing Pepper in Palestine]فهسطيٍ
Ministry of Agriculture.
[10] Bbc.co.uk. (2017). BBC - KS3 Bitesize Science - Food chains: Revision, Page 4. [online]
Available at:
http://www.bbc.co.uk/bitesize/ks3/science/organisms_behaviour_health/food_chains/revi
sion/4/ [Accessed 3 Apr. 2017].
[11] Bitponics. (n.d.). Bitponics connects your garden to the world. [online] Available at:
http://www.bitponics.com [Accessed 29 Jan. 2017].
[12] Bonnie Plants. (n.d.). Growing Peppers - Bonnie Plants. [online] Available at:
https://bonnieplants.com/growing/growing-peppers/ [Accessed 17 Apr. 2017].
[13] Botta, A., Pescap, A., Persico, V. and de Donato, W. (2017). Integration of Cloud
Computing and Internet of Things: a Survey. University of Napoli Federico II (Italy).
[14] Castilla, N. Greenhouse technology and management. Translated by Esteban J. Baeza;
reviewed by A.P. Papadopoulos.
[15] Castro, D. and Misra, J. (2013). The internet of things. 1st ed. CENTER FOR DATA
INNOVATION.

BIBLIOGRAPHY
58
[16] Chamberlain, L. (2012). How to keep your greenhouse cool. [online] the Guardian.
Available at: https://www.theguardian.com/lifeandstyle/gardening-
blog/2012/mar/30/greenhouse-summer-shading [Accessed 14 Mar. 2017].
[17] Chelsea Green Publishing. (2009). How to Use Reflected Light to Boost Indoor Food
Production - Chelsea Green Publishing. [online] Available at:
http://www.chelseagreen.com/blogs/how-to-use-reflected-light-to-boost-indoor-food-
production/ [Accessed 2 Feb. 2017].
[18] CommentCaMarche. (2017). Bluetooth - Comment ça marche ?. [online] Available at:
http://www.commentcamarche.net/contents/108-bluetooth-comment-ca-marche
[Accessed 17 May 2017].
[19] Console.ng.bluemix.net. (n.d.). IBM Bluemix - Next-Generation Cloud App Development
Platform. [online] Available at: https://console.ng.bluemix.net [Accessed 14 Apr. 2017].
[20] Digikey.fr. (2014). Aller de l'avant avec Bluetooth® Low Energy | DigiKey. [online]
Available at: https://www.digikey.fr/fr/articles/techzone/2014/aug/moving-forward-with-
bluetooth-low-energy [Accessed 17 Apr. 2017].
[21] Dimick, D. (2014). Inside the Looming Food Crisis | Nat Geo Food. [online]
News.nationalgeographic.com. Available at:
http://news.nationalgeographic.com/news/2014/05/140522-food-crisis-vulnerable-
weather-climate-future/ [Accessed 3 Mar. 2017].
[22] Doknić, V. (2014). Internet of Things Greenhouse Monitoring and Automation System.
1st ed.
[23] Fifthseasongardening.com. (2014). Carbon Dioxide Enrichment | Managing CO2 in
Your Grow Space. [online] Available at: http://fifthseasongardening.com/regulating-
carbon-dioxide [Accessed 27 Apr. 2017].
[24] Futura. (n.d.). Cloud computing. [online] Available at: http://www.futura-
sciences.com/tech/definitions/informatique-cloud-computing-11573/ [Accessed 16 Mar.
2017].
[25] Futureelectronics.com. (n.d.). Microcontrollers, what is a microcontroller? 8 bit, 16 bit
& 32 bit microcontrollers - Future Electronics. [online] Available at:
https://www.futureelectronics.com/en/Microcontrollers/microcontrollers.aspx [Accessed
13 Mar. 2017].
[26] Génération Robots. (n.d.). Arduino UNO Rev3. [online] Available at:
https://www.generationrobots.com/fr/401867-arduino-uno-rev3.html [Accessed 21 Apr.
2017].
[27] GetSenso. (n.d.). Greenhouse Monitoring - GetSenso. [online] Available at:
http://www.getsenso.com/iot-solution/greenhouse-monitoring/ [Accessed 28 Jan. 2017].
[28] Goodreads.com. (2017). Edsger W. Dijkstra Quotes (Author of A Discipline of
programming). [online] Available at:
https://www.goodreads.com/author/quotes/1013817.Edsger_W_Dijkstra [Accessed 14
Apr. 2017].

BIBLIOGRAPHY
59
[29] Hugman, C. (2016). How Internet of Things (IoT) Releates to Surveillance. [online]
System Surveyor. Available at: http://systemsurveyor.com/iot_survellance/ [Accessed 5
Feb. 2017].
[30] IBM® Bluemix™ From Idea to Application. (2015). 1st ed. IBM Deutschland GmbH.
[31] Institut Technique Des Cultures Maraichères et Industrielles (2010). La culture du
PIMENT / POIVRON [The culture of hot/sweet pepper]. 1st ed. Algiers, Algeria.
[32] Iot-cost-calculator.ng.bluemix.net. (n.d.). Pricing Calculator - Internet of Things.
[online] Available at: http://iot-cost-calculator.ng.bluemix.net/customise [Accessed 18
Apr. 2017].
[33] Jadoul, M. (2015). The IoT: The next step in internet evolution. [online] Insight.
Available at: https://insight.nokia.com/iot-next-step-internet-evolution [Accessed 1 Mar.
2017].
[34] Json.org. (n.d.). Introducing JSON. [online] Available at: http://www.json.org/json-
fr.html [Accessed 20 Apr. 2017].
[35] Kaa. (n.d.). Solutions for Smart Farming - Agriculture IoT Solutions and Internet of
Things Technologies. [online] Available at: https://www.kaaproject.org/agriculture/
[Accessed 28 Jan. 2017].
[36] Katherine Lady Berkeley's School. (n.d.). Network Topologies - Star, Bus (Line) and
Ring. [online] Available at:
http://www.klbict.co.uk/gcse/theory/5_3/5_3_4_topologies.htm [Accessed 6 Apr. 2017].
[37] Kickstarter. (n.d.). HarvestGeek -- Brains for your garden. [online] Available at:
https://www.kickstarter.com/projects/2077260917/harvestgeek-brains-for-your-gardenv
[Accessed 3 Apr. 2017].
[38] Laurent. (2010). Généralités sur le ZigBee - News Domotiques by Domadoo. [online]
Available at: http://blog.domadoo.fr/guides/generalites-sur-le-zigbee/ [Accessed 17 Apr.
2017].
[39] Laurent. (2010). Généralités sur le ZigBee - News Domotiques by Domadoo. [online]
News Domotiques by Domadoo. Available at: http://blog.domadoo.fr/guides/generalites-
sur-le-zigbee/ [Accessed 17 Apr. 2017].
[40] McKinley, M. Ortho's all about greenhouses. (2001). 1st ed. Des Moines, Iowa:
Meredith Books. P. 65-66
[41] Mitchell, B. (2017). [online] Available at: http://.lifewire.com/wireless-standards-802-
11a-802-11b-g-n-and-802-11ac-816553 [Accessed 8 May 2017].
[42] Nodered.org. (n.d.). Node-RED. [online] Available at: https://nodered.org/ [Accessed 15
Apr. 2017].
[43] Oxford Dictionaries | English. (2017). relative humidity - definition of relative humidity
in English | Oxford Dictionaries. [online] Available at:
https://en.oxforddictionaries.com/definition/relative_humidity [Accessed 23 Jan. 2017].

BIBLIOGRAPHY
60
[44] Pinola, M. (2016). What Is Wi-Fi?. [online] Lifewire. Available at:
https://www.lifewire.com/what-is-wi-fi-2377430 [Accessed 17 Apr. 2017].
[45] PlantLink. (n.d.). PlantLink. [online] Available at: http://myplantlink.com/ [Accessed 13
Apr. 2017].
[46] Ponce Cruz, P., Molina, A., Cepeda, P., Lugo, E. and MacCleery, B. (2015). Greenhouse
design and control. 1st ed.
[47] Raspberry Pi. (n.d.). Raspberry Pi 3 Model B - Raspberry Pi. [online] Available at:
https://www.raspberrypi.org/products/raspberry-pi-3-model-b/ [Accessed 18 Apr. 2017].
[48] Ray, B. (2016). IoT Platforms: What They Are & How To Select One. [online] Link-
labs.com. Available at: https://www.link-labs.com/blog/what-is-an-iot-platform
[Accessed 16 Mar. 2017].
[49] Rfwireless-world.com. (2017). Difference between Bluetooth versions | v1.2 v2.0 v2.1
v3.0 v4.0 v4.1. [online] Available at: http://www.rfwireless-
world.com/Terminology/difference_between_bluetooth_v1_2_v2_v2_1_v3_v4_v4_1.ht
ml [Accessed 17 Apr. 2017].
[50] Royal Horticultural Society. (n.d.). Wind scorch/RHS Gardening. [online] Available at:
https://www.rhs.org.uk/advice/profile?PID=263 [Accessed 5 Feb. 2017].
[51] SearchCloudComputing. (n.d.). What is cloud computing? - Definition from WhatIs.com.
[online] Available at: http://searchcloudcomputing.techtarget.com/definition/cloud-
computing [Accessed 16 Mar. 2017].
[52] Smith, S. (1993). Greenhouse Gardener's Companion. 1st ed. New York: Fulcrum Pub.
[53] Snyder, R. (n.d.). Greenhouse tomato handbook. 1st ed.
[54] Studytonight.com. (n.d.). Types of Network Topology | Computer Network Tutorial |
Studytonight. [online] Available at: http://www.studytonight.com/computer-
networks/network-topology-types [Accessed 5 Apr. 2017].
[55] Techopedia.com. (n.d.). What is an Internet of Things Gateway (IoT Gateway)? -
Definition from Techopedia. [online] Available at:
https://www.techopedia.com/definition/32198/internet-of-things-gateway-iot-gateway
[Accessed 12 Mar. 2017].
[56] TechTarget- SearchITOperations. (n.d.). What is IT automation? - Definition from
WhatIs.com. [online] Available at: http://searchitoperations.techtarget.com/definition/IT-
automation [Accessed 6 Feb. 2017].
[57] TechTarget- WhatIs.com. (n.d.). What is sensor? - Definition from WhatIs.com. [online]
Available at: http://whatis.techtarget.com/definition/sensor [Accessed 7 Feb. 2017].
[58] TechTarget-IoT Agenda. (2016). What is Internet of Things (IoT)? - Definition from
WhatIs.com. [online] Available at:
http://internetofthingsagenda.techtarget.com/definition/Internet-of-Things-IoT [Accessed
3 Feb. 2017].

BIBLIOGRAPHY
61
[59] Tomala-Reyes, A. (2015). What is IBM Bluemix?. [online] Ibm.com. Available at:
https://www.ibm.com/developerworks/cloud/library/cl-bluemixfoundry/ [Accessed 13
Apr. 2017].
[60] Un.org. (2015). World population projected to reach 9.7 billion by 2050 | UN DESA |
United Nations Department of Economic and Social Affairs. [online] Available at:
http://www.un.org/en/development/desa/news/population/2015-report.html [Accessed 1
Mar. 2017].
[61] Vocabulary.com. (n.d.). Actuator - Dictionary Definition. [online] Available at:
https://www.vocabulary.com/dictionary/actuator [Accessed 11 Feb. 2017].

Abstract: Internet of Things is a new technology that allows objects, to interact and connect
with one another through the internet, it gives many opportunities and can be used in many
fields like in smart buildings, smart city, in health care, and more…
In this project we will use this technology in agriculture, precisely in greenhouse
cultivation, which should result in automating the greenhouses, remote monitoring,
controlling them, in order to maximize the production at a lower cost.
Keywords: Internet of things, greenhouse, automation, remote monitoring, control, cloud
computing.
Système base sur l’IoT pour la télésurveillance et le control climatique des serres
Résumé : Internet des Objets, est une nouvelle technologie qui permet aux objets, d'interagir
et de se connecter entre eux grâce à Internet, elle offre de nombreuses opportunités et peut
être utilisé dans de nombreux domaines comme dans les bâtiments intelligents, la ville
intelligente, le domaine de la santé et encore plus...
Dans ce projet, nous allons utiliser cette technologie dans l'agriculture, précisément dans
l‟agriculture sous serres, ce qui devrait nous permettre d'automatiser les serres, de les
surveiller à distance, et de les contrôler, afin de maximiser la production à moindre coût.
Mots-clés: Internet des Objets, serre, automation, télésurveillance, contrôle, informatique en
nuage.
البيوت البالستيكيةنظام يعتود على انترنث األشياء هن اجل الوراقبة عن بعد والتحكن في هناخ
نبؼض يٍ خالل شبكت اإلَخزَج، اضهاإَخزَج األشياء، هي حقُيت خذيذة حسًح نألشياء بانخفاػم وانخىاصم يغ بغ: هلخص
ػذيذ حىفز انؼذيذ يٍ انفزص، ويًكٍ اسخخذايها في انؼذيذ يٍ انًداالث يثم انًباَي انذكيت ،انًذٌ انذكيت، يدال انصحت وال
...يٍ انًداالث األخزي
، وانخي يُبغي أٌ انبيىث انبالسخيكيتفي هذا انًشزوع، سىف َسخخذو هذِ انخكُىنىخيا في يدال انزراػتححذيذا في
.، يزاقبخها ػٍ بؼذ وانخحكى بها، نخؼظيى االَخاج بأقم حكهفتنهبيىث انبالسخيكيتحسًح نُا بانخشغيم اآلني
.، حشغيم آني، يزاقبت ػٍ بؼذ، ححكى، حىسبت سحابيتبيىث بالسخيكيتإَخزَج األشياء، :الكلوات الدالة