iot scada software installation and user manual · 2019-09-23 · 2 iot scada software 2.1 general...
TRANSCRIPT

IOT SCADA SOFTWAREINSTALLATION AND USER MANUAL

ALL <THINGS> JOINED
ALL <THINGS> JOINED
3
1 Introduction ...............................................................6
2 IOT SCADA software .................................................72.1 General characteristics .....................................................................................72.2 Models ..............................................................................................................72.3 Software and Gateway .....................................................................................8
3 Physical world and IoT .............................................93.1 Analog inputs ....................................................................................................93.2 Digital inputs .....................................................................................................93.3 Ethernet ports ...................................................................................................93.4 RS232/485 port .................................................................................................9
4 Access .....................................................................104.1 First access to the software and related PC/gateway .....................................104.2 Wi-Fi access ...................................................................................................14
4.2.1 Access with local/corporate Wi-Fi ........................................................144.2.2 Wi-Fi Access Point Gateway .................................................................14
4.3 Ethernet LAN access ......................................................................................154.3.1 Local/corporate LAN .............................................................................154.3.2 Direct connection to a PC (LAN cable) .................................................17
4.4 Setting up your operating system ...................................................................174.4.1 Windows 7 ............................................................................................174.4.2 Windows 10 ..........................................................................................204.4.3 Connection to an existing LAN network................................................23
4.5 Software installation .......................................................................................244.5.1 Provided files ........................................................................................244.5.2 Installation procedure ..........................................................................244.5.3 Update procedure ................................................................................304.5.4 License activation .................................................................................314.5.5 Uninstallation process ..........................................................................33
5 Configuration ..........................................................345.1 Communication ...............................................................................................34
5.1.1 TCP/IP Configuration ............................................................................345.1.2 Connection to an existing Wi-Fi network ..............................................36
Index

ALL <THINGS> JOINED
4
5.1.3 Internet communication test .................................................................365.1.4 Port and communication parameters configuration .............................375.1.5 Modbus Gateway ..................................................................................38
5.1.5.1 Rules of automatic mapping ......................................................385.2 Installation ......................................................................................................39
5.2.1 System devices connection and configuration .....................................395.2.1.1 Adding new devices ...................................................................395.2.1.2 Removing a device ....................................................................415.2.1.3 Installation support manuals ......................................................42
5.2.3 Devices measures setup ......................................................................425.2.3.1 Measures offset .........................................................................445.2.3.2 Measures scaling .......................................................................44
5.2.4 General settings ...................................................................................455.2.5 Password change .................................................................................45
5.3 Customization .................................................................................................465.3.1 Logos and title ......................................................................................465.3.2 Custom measures ................................................................................465.3.3 Custom alarms .....................................................................................475.3.4 Synoptics configuration ........................................................................51
5.4 Interface and Cloud services ..........................................................................555.4.1 E-mail and SMS notifications ...............................................................555.4.2 Dropbox connection .............................................................................565.4.3 OneDrive account .................................................................................605.4.4 FTP Backup ..........................................................................................61
5.4.4.1 Details of the transferred files ....................................................625.4.5 Connection with Microsoft SQL Server ................................................625.4.6 Connection to Azure IoT Hub ...............................................................64
5.5 Information .....................................................................................................665.5.1 Device catalogue ..................................................................................665.5.2 License management ...........................................................................675.5.3 Informations .........................................................................................685.5.4 Logs ......................................................................................................68
6 User interface ...................................................................696.1 Synoptics ........................................................................................................696.2 Devices ...........................................................................................................70
6.2.1 System measures display ....................................................................706.2.1.1 Data and alarms display ....................................................................716.2.2 Graphs ..................................................................................................73
Index
ALL <THINGS> JOINED
5
6.2.3 Measure write ......................................................................................746.2.4 Exporting data to Excel ........................................................................75
6.3 Alarms ............................................................................................................756.4 Alarms history .................................................................................................766.5 Report .............................................................................................................776.6 Documents ......................................................................................................796.7 Favourites .......................................................................................................80
7 Troubleshooting – FAQ ...........................................817.1 Specific functions for Machine tools and Machining centres ..........................817.2 Remote part program transfer (machine instructions)....................................817.3 IOT SCADA SERVER does not switch on ........................................................867.4 Unable to complete Internet communication test ...........................................867.5 Communication problems with serial devices ................................................867.6 Unable to access IOT SCADA SERVER from the local network ......................867.7 Unable to access IOT SCADA SERVER from the Internet ..............................867.8 Auto start of the IOT SCADA system and the gateway at power-up of the machine ................................................................................................................867.9 System hotspot activation ...............................................................................87
8 Contacts ..................................................................88
Index

ALL <THINGS> JOINED
6
This manual is intended for installation, configuration and use of Alleantia’s IOT SCADA Software (product codes ISS_YY) on hardware with Windows OS. If the system comes already pre-installed on IoT gateway hardware (appliance), go to Paragraph 4.4.
ISC web software is a monitoring system of operational parameters of plants, machines and industrial equipment, with additional functions as creation of alarms, synoptic, sending instant messages (email, sms) for alarms, data export to Excel, creation of graphs, etc.
In addition, if the system has optional plug-ins, it is able to send data to third party applications both on premise and on cloud is configured with: SQL, Rest API, IOT HUB AZURE, Dropbox, etc.
Finally, there are optional modules available:
• Energy Pack - application to monitor energy production in solar PV plants and energy usage from many meters;
• Machining Pack - application to control and account for the energy usage in production and operations of machine tools, combined with energy meter (Energy KIT).
For further details on these optional modules, please, refer to the user manuals, available atwww.alleantia.com on Technical Documents page.
1 Introduction

ALL <THINGS> JOINED
7
2 IOT SCADA software
2.1 General characteristicsThe Alleantia ISC software license can be purchased and installed on a PC or a gateway with proper specifications on WINDOWS operating system, or it can be purchased already embedded on specific hardware (gateway DELL EG5000, Advantech UTX 3115, ISS Alleantia, etc.).
The last one is IOT Scada Server ISS (AL-ISS-XXX-YY products class).
There are different versions of software license depending on the following parameters: 1. Number of devices to connect to the software for monitoring and supervision;2. Number of variables to read.
For example, the ISC 4 license (AL-ISC-4 product code) from the different connected devices allows to monitor up to 4 devices and 200 variables.
The variables are to be considered as the monitored values: speed, temperature, power, voltage, etc.
Recommended system requirements (hardware) to install the license: • Windows 10 IoT 2016• Processor 2 GB RAM• Memory 32G SSD (4 GB suggested)
For the licenses that allow to monitor a large number of devices and variables (more than 15 devices and 1500 variables), it is recommended to increase the processor and memory capacity to improve the data processing capacity and system throughput. The software works also on Windows 7 and Windows 10 but, in this case, the operating system requires more hardware resources.
As mentioned in the previous paragraph, different versions are available, according to the variables and monitored devices.
2.2 Models
Code N°Variables N°Devices
AL-ISC-60 3000 60
AL-ISC-45 2250 45
AL-ISC-30 1500 30
AL-ISC-15 750 15
AL-ISC-7 350 7
AL-ISC-4 200 4
AL-ISC-2 100 2
AL-ISC-1 50 1

ALL <THINGS> JOINED
8
2.3 Software and Gateway
The devices include energy meters, PLC, CNC, inverter, etc.
The variables are the monitored values as speed, temperature, power, voltage, state, both cumulative alarms and specific alarms, etc.
As mentioned in Paragraph 2.1, the software licence can be installed on industrial gateway, to be deployed in plant, electric cabinet or machines, with various architectures, depending on the plant topology, number of connected devices, networking requirements, etc.
On the market, there are diverse kinds of gateways with different configurations of the processors and disk memory, with additional connection type (Wi-Fi, 3G, LAN), ports and inputs/outputs.
At the moment, Alleantia Srl certifies ISC software on the following devices:
1. ISS Alleantia: appliance equipped with analog and digital I/O terminal block. The documents can be downloaded from Alleantia website.
2. DELL Edge Gateway 5000 (for further details, visit DELL site and see Annex A);3. Advantech UTX 3115 (for further details, visit ADVANTECH site and see Annex B).
Before exploring installation and the functioning of the system, in the following section there are characteristics related to the physical world, which are useful for IoT Scada software use.
On the Alleantia web site the list of certified software is periodically updated.
2 IOT SCADA software
ALL <THINGS> JOINED
9
3.2 Digital inputs
3.3 Ethernet ports
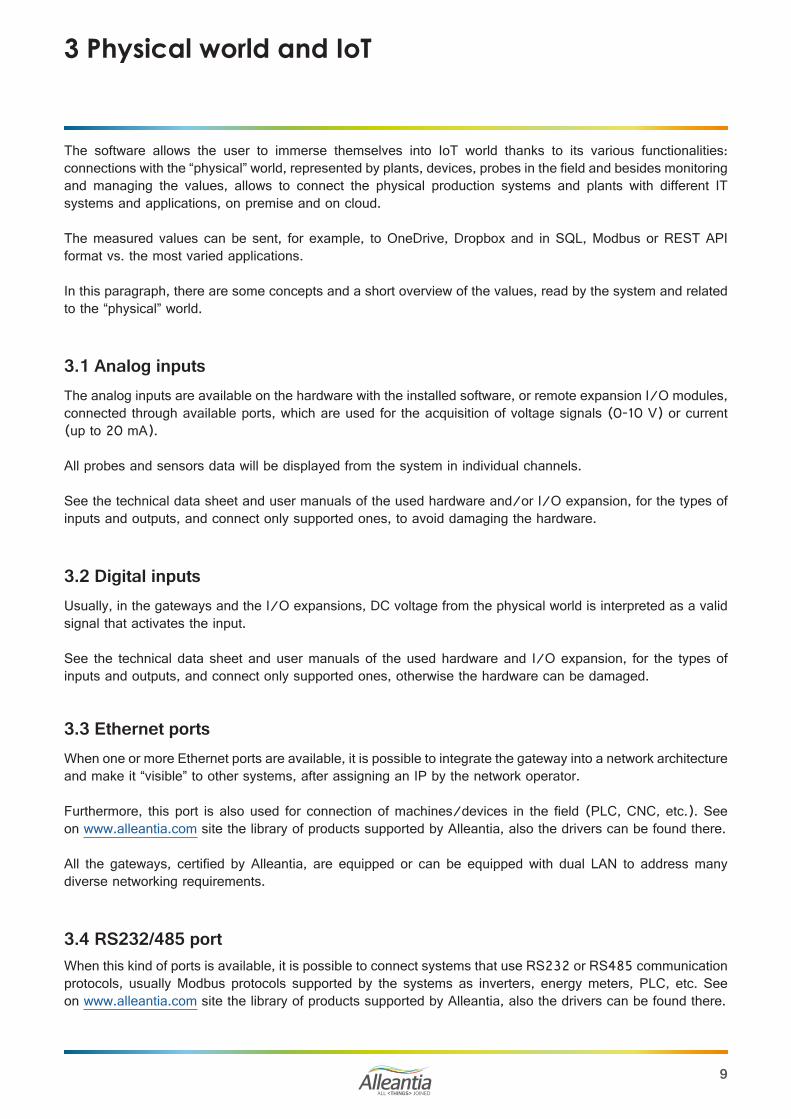
Usually, in the gateways and the I/O expansions, DC voltage from the physical world is interpreted as a valid signal that activates the input.
See the technical data sheet and user manuals of the used hardware and I/O expansion, for the types of inputs and outputs, and connect only supported ones, otherwise the hardware can be damaged.
When one or more Ethernet ports are available, it is possible to integrate the gateway into a network architecture and make it “visible” to other systems, after assigning an IP by the network operator.
Furthermore, this port is also used for connection of machines/devices in the field (PLC, CNC, etc.). See on www.alleantia.com site the library of products supported by Alleantia, also the drivers can be found there.
All the gateways, certified by Alleantia, are equipped or can be equipped with dual LAN to address many diverse networking requirements.
3 Physical world and IoT
3.4 RS232/485 portWhen this kind of ports is available, it is possible to connect systems that use RS232 or RS485 communication protocols, usually Modbus protocols supported by the systems as inverters, energy meters, PLC, etc. See on www.alleantia.com site the library of products supported by Alleantia, also the drivers can be found there.
The software allows the user to immerse themselves into IoT world thanks to its various functionalities: connections with the “physical” world, represented by plants, devices, probes in the field and besides monitoring and managing the values, allows to connect the physical production systems and plants with different IT systems and applications, on premise and on cloud.
The measured values can be sent, for example, to OneDrive, Dropbox and in SQL, Modbus or REST API format vs. the most varied applications.
In this paragraph, there are some concepts and a short overview of the values, read by the system and related to the “physical” world.
3.1 Analog inputsThe analog inputs are available on the hardware with the installed software, or remote expansion I/O modules, connected through available ports, which are used for the acquisition of voltage signals (0-10 V) or current (up to 20 mA).
All probes and sensors data will be displayed from the system in individual channels.
See the technical data sheet and user manuals of the used hardware and/or I/O expansion, for the types of inputs and outputs, and connect only supported ones, to avoid damaging the hardware.

ALL <THINGS> JOINED
10
4 Access
4.1 First access to the software and related PC/gateway
To access the software you must first do some gateway installation, such as suitable electrical connection and to connect mouse, keyboard and monitor.
When it is supplied with power (see gateway manual of the manufacturer and Annex), it can be switched on.
In the event that the device turns on automatically when supplied with power, it means that auto start and auto off functions were activated in the BIOS. Proceed with the following the steps:1. Connect the device to its electrical outlet (see gateway manual of the manufacturer and Annex), paying
attention to electrical protection.2. Connect the monitor to the video output port on the gateway (see manual).3. Connect a keyboard to the USB port on the gateway (see manual).4. Connect a mouse to the USB port on the gateway (see manual).5. Access to the desktop of Windows operating system and in the bottom right corner of the screen right click
on “Network and Internet”.

ALL <THINGS> JOINED
11
6. Select “Open Network and Sharing Center”.
7. A window will open: click “Ethernet” at the top right of the window.
8. Click “Properties”.
4 Access

ALL <THINGS> JOINED
12
9. Select “Internet Protocol Version 4 (TCP/IPv4)”, then click “Properties”.
10. The window with IP addresses will open. Type here the static IP address you wish to give to your hardware gateway. If you don’t know which IP address to set, ask your network administrator.
Fill in “Subnet mask”, “Default gateway”, “DNS” and other fields, to allow the device to access local networks, internet, etc. These addresses and parameters can be used, for example, to enable the system to send automatic email notifications (e.g. alarms, reports, etc.), to view the software on smartphone and tablet, or for the remote support.
4 Access
ALL <THINGS> JOINED
13
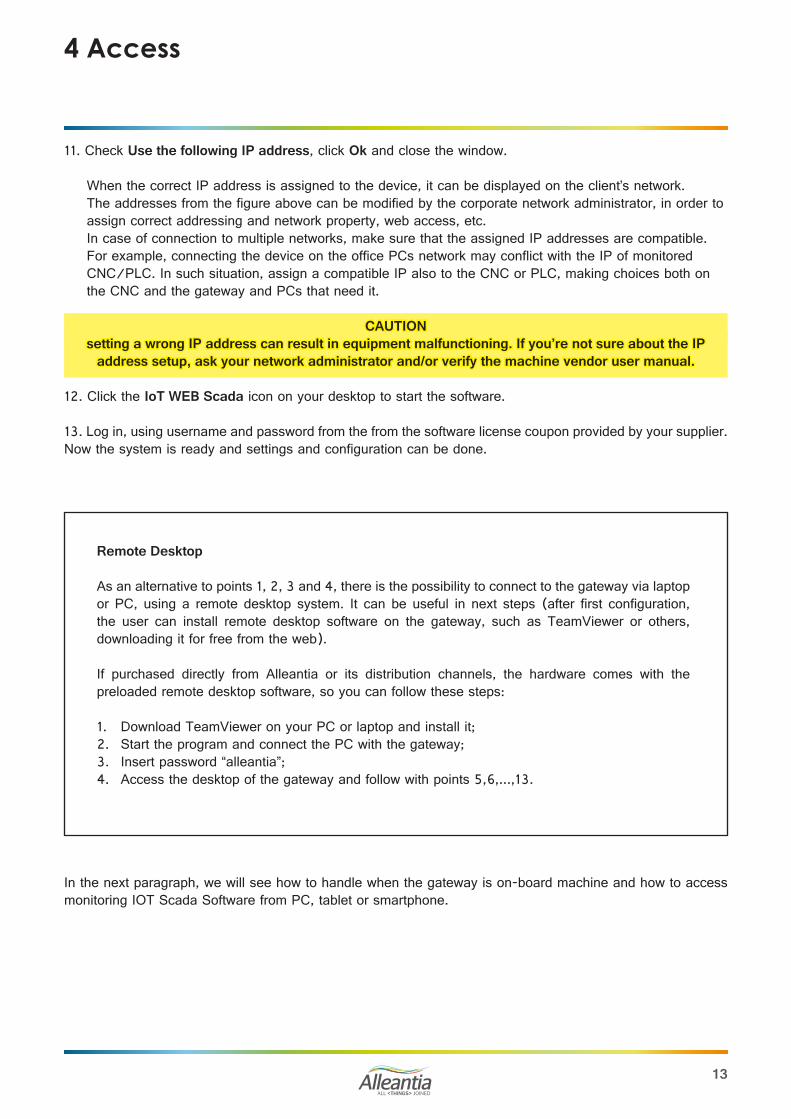
11. Check Use the following IP address, click Ok and close the window.
When the correct IP address is assigned to the device, it can be displayed on the client’s network. The addresses from the figure above can be modified by the corporate network administrator, in order to assign correct addressing and network property, web access, etc. In case of connection to multiple networks, make sure that the assigned IP addresses are compatible. For example, connecting the device on the office PCs network may conflict with the IP of monitored CNC/PLC. In such situation, assign a compatible IP also to the CNC or PLC, making choices both on the CNC and the gateway and PCs that need it.
CAUTIONsetting a wrong IP address can result in equipment malfunctioning. If you’re not sure about the IP
address setup, ask your network administrator and/or verify the machine vendor user manual.
12. Click the IoT WEB Scada icon on your desktop to start the software.
13. Log in, using username and password from the from the software license coupon provided by your supplier. Now the system is ready and settings and configuration can be done.
Remote Desktop
As an alternative to points 1, 2, 3 and 4, there is the possibility to connect to the gateway via laptop or PC, using a remote desktop system. It can be useful in next steps (after first configuration, the user can install remote desktop software on the gateway, such as TeamViewer or others, downloading it for free from the web).
If purchased directly from Alleantia or its distribution channels, the hardware comes with the preloaded remote desktop software, so you can follow these steps:
1. Download TeamViewer on your PC or laptop and install it;2. Start the program and connect the PC with the gateway;3. Insert password “alleantia”;4. Access the desktop of the gateway and follow with points 5,6,...,13.
In the next paragraph, we will see how to handle when the gateway is on-board machine and how to access monitoring IOT Scada Software from PC, tablet or smartphone.
4 Access
ALL <THINGS> JOINED
14
4.2 Wi-Fi accessThis option is available for gateways equipped with Wi-Fi and can be used in two cases:
1. Local/corporate Wi-Fi network: if you want to install the gateway in places with no wired network but Wi-Fi. In this case, connecting the gateway to the network you will be able to access the software from any PC, if this PC is connected to the same Wi-Fi network.
2. Connecting with your own device (laptop, tablet or smartphone) directly to the gateway, using not a local Wi-Fi network but access point function of the gateway. This function is available when the gateway has such characteristics, is correctly configured and is near enough to be able to connect.
4.2.1 Access with local/corporate Wi-Fi
Where there is a local/corporate Wi-Fi available, the gateway can be configured to connect to such Wi-Fi network. So you will be able to monitor without any additional cables.
To allow the gateway to use the Wi-Fi network, click the icon on your desktop and search for the available Wi-Fi networks.
Select the network and insert Wi-Fi security password. If you don’t know the password, ask your network administrator.
The gateway will connect to the network and you will be able to access it from any PC, tablet or smartphone connected to the same Wi-Fi network.
See previous paragraph about settings of the IP address to the gateway.
Use your favourite browser (Google Chrome is recommended), type the assigned IP address in the address bar, for example
http://192.168.1.29
4.2.2 Wi-Fi Access Point Gateway
For the direct access to the system via Wi-Fi access point mode when near the gateway, using a PC, smartphone or tablet (IOS or Android), follow the steps below.
Set the gateway in Access Point mode when the operating system starts, as described in the operating system manual (NOTE: not all Windows systems allow this option). Make sure that the Access Point is not already active (after switching on the gateway and waiting for some minutes, check if IoT Scada wireless network is available, written below in bold).
4 Access

ALL <THINGS> JOINED
15
4 Access
Once activation of the Access Point mode, as described in Windows operating system manual, and settings have been completed (for example, it might be useful to set auto-start of access point, every time the gateway starts), the system will automatically create a wireless network to assign the SSID parameters, security password and network address to. For example:
Wi-Fi (SSID) network name: IoT-SCADA
Password: IoTSCADAwifi
Connect to this network, generated by the gateway, using PC, tablet or smartphone with the same settings when you want to connect your device to a local Wi-Fi network. Once connected, use your favourite browser (Google Chrome is recommended) and type the default address for the gateway in the address bar:
http://10.10.0.1
CAUTION: the Wi-Fi network allows direct connection to the web software IOT SCADA and display of its monitoring interface, but not to the hardware’s operating system, managing its settings and other
devices, connected to the IOT SCADA via LAN.
Obviously, activation and configuration of gateway’s Access Point should be done connecting a monitor, keyboard and mouse to the gateway and making settings to the operating system.
4.3 Ethernet LAN access
4.3.1 Local/corporate LAN
In the case where the gateway is inserted in a LAN network and you want to access IOT SCADA for monitoring from a PC (smartphone or tablet).
LAN Ethernet default configuration of the IOT SCADA is shown below. After inserting the gateway into the LAN network (connecting the network cable to the device’s LAN port), ping the device by the IP address, shown below, to check if it responds. Then, copy this IP address in your browser’s address bar to access the system.
IP address: 192.168.1.29
Subnet mask: 255.255.255.0
Gateway: 192.168.1.1
DNS 1: 208.67.222.222
DNS 2: 208.67.220.220
If the device does not respond, check whether the default IP address is correct and coherent with the LAN network (the PC should have a static IP from the same family).

ALL <THINGS> JOINED
16
4 Accesso
Otherwise assign a correct IP.
User can assign an address to insert the gateway into the LAN network.
In this case, the network parameters and assigned IP address settings, provided by the administrator, will enable Internet access (for the software updates or upgrade by Alleantia), as well as to display the software on PC, tablet or smartphone. This function is supported as it is web based software and remote support by Alleantia or others (e.g. maintenance company).
NOTE: IP addresses and network
The IP address of the gateway should be compatible with the addresses of other devices, you want to connect with. Also user PC should have a compatible IP in order to make settings, configure and access the software via LAN. If the user’s IP address does not have compatible characteristics (same network), assign a compatible IP address (the user can reset the original IP on their PC after gateway setup).
If you do not want to modify your IP settings, you can access via remote desktop (this function is available with a direct purchase from Alleantia).
In the same way, IP of the monitored devices, connected to the gateway, should have a compatible IP address.
Then, assign IP addresses, meeting these requirements (see previous paragraphs).
For this purpose the gateway also has Dual LAN, which can be configured.
Verify that the monitored CNC or PLC, connected to the gateway, have a compatible IP address, ID and LAN port, see the document for the technical requirements for installation of “Machine 4.0”, which can be downloaded from the site www.alleantia.com.
For example, in the case of CNC, the communication should be enabled in its settings, and/or specific modules of the CNC’s software for communication with third parties. Refer to the manufacturers of the devices you want to connect (which can be downloaded from the site www.alleantia.com). Firstly, it is recommended to control Alleantia libraries to check the compatibility of protocols and the presence of drivers.
ALL <THINGS> JOINED
17
4.3.2 Direct connection to a PC (LAN cable)
This procedure requires a direct link (point to point) to a PC via an Ethernet cable, not necessarily twisted. The network configuration of the PC connecting to the IOT SCADA SERVER must be:• 192.168.1.nnn Static IP (with n between 2 and 254, with the exception of 29, which is already used by
IOT SCADA SERVER)• subnet mask 255.255.255.0
Otherwise, modify your PC configuration, following the indications in the next paragraphs.
Then, it will be possible to access the web interface of the IOT SCADA SERVER using the preferred internet browser and entering the following URL in the address bar:
http://192.168.1.29
4.4 Setting up your operating system
The gateway or PC with the installed system, as mentioned in the previous paragraphs, can be configured and installed in a corporate network, connecting it to CNC or PLC with IP addresses, etc.
4 Access
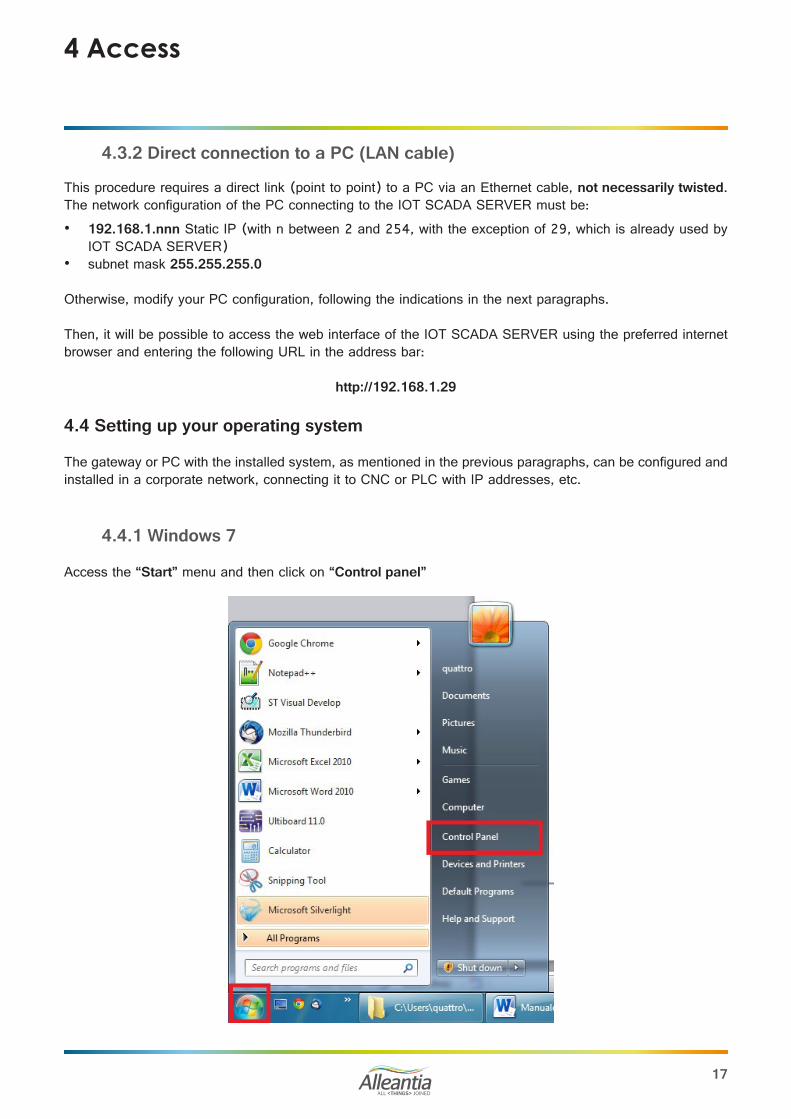
4.4.1 Windows 7
Access the “Start” menu and then click on “Control panel”
ALL <THINGS> JOINED
18
4 Access
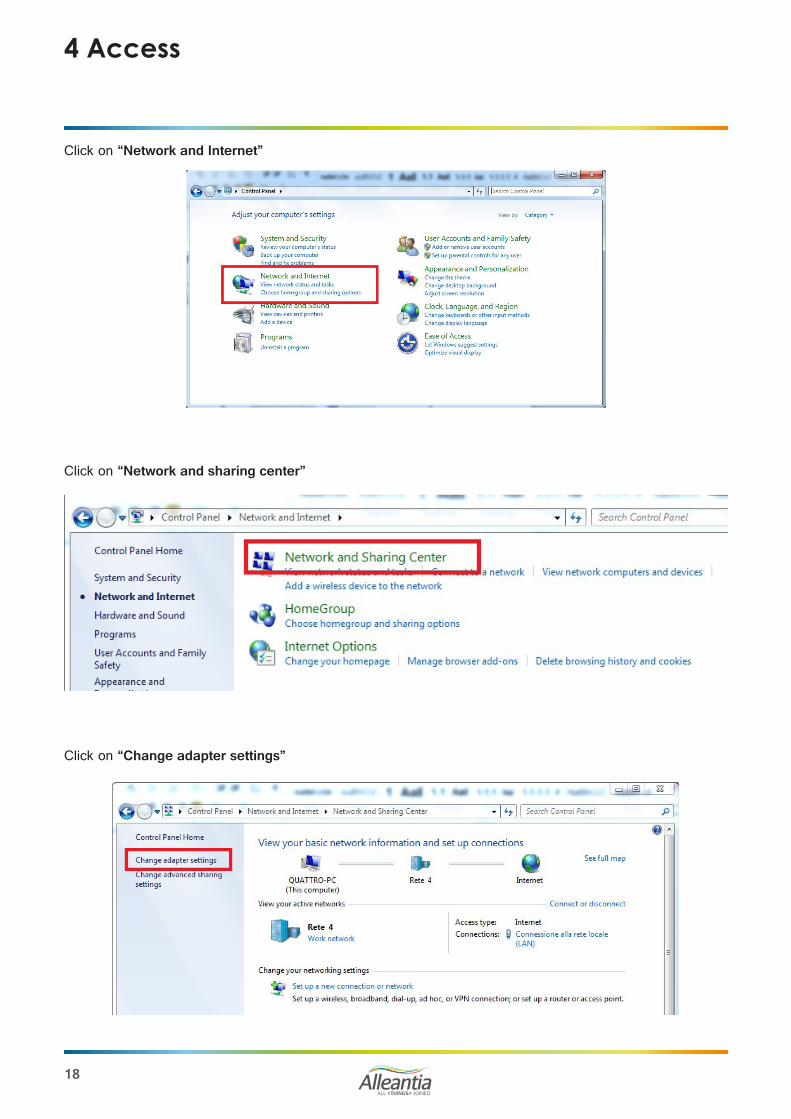
Click on “Network and Internet”
Click on “Network and sharing center”
Click on “Change adapter settings”

ALL <THINGS> JOINED
19
4 Access
Select the connection to be amended, usually “Local area connection (LAN)”. Click mouse right button and select “Properties”.
Select “Internet protocol version 4 (TCP/IPv4)” and click on “Properties”.

ALL <THINGS> JOINED
20
The addresses from the figure above can be modified by the corporate network administrator, in order to assign correct addressing and network property, web access, etc. In case of connection to multiple networks, make sure that the assigned IP addresses are compatible. For example, connecting the device on the office PCs network may conflict with the IP of monitored CNC/PLC. In such situation, assign a compatible IP also to the CNC or PLC, making choices both on the CNC and the gateway and PCs that need it.
4.4.2 Windows 10
1. On the Windows OS desktop, in the bottom right corner right click on “Network and Internet” icon.
4 Access
29
Set the network parameters as in the figure, namely:
IP address: 192.168.1.29Subnet mask: 255.255.255.0

ALL <THINGS> JOINED
21
4 Access
2. Select “Open Network and Sharing Center”.
3. A window will open: click “Ethernet” at the top right of the window.
4. Click “Properties”.

ALL <THINGS> JOINED
22
4 Access
5. Select “Internet Protocol Version 4 (TCP/IPv4)”, then click “Properties”.
6. The window with IP addresses will open. Type here the static IP address you wish to give your device. Fill in “Subnet mask”, “Default gateway”, “DNS” and other fields, to allow the device to access local networks, internet, etc. These addresses and parameters can be used, for example, to enable the system to send automatic email notifications (e.g. alarms, reports, etc.), to view the software on smartphone and tablet, or for the remote support.
ALL <THINGS> JOINED
23
4.4.3 Connection to an existing LAN networkAs mentioned in previous paragraphs (4.1, 4.2, 4.3 etc.), it is necessary that the default IP address of the purchased device is compatible with the devices in the existing network. If so, connect it directly to the switch/router, or modify the gateway network configuration. Follow the procedure described in Section 5.1.
The configuration of the network to assign to IOT SCADA SERVER cannot be determined beforehand. Please, contact your system administrator to obtain the necessary parameters.
Once you have obtained the network configuration for the IOT SCADA SERVER, modify it, accessing the web interface via one of the methods described in previous paragraphs, and then connect the IOT SCADA SERVER to the existing LAN.
If the LAN is equipped with a firewall to filter access to Internet, the following TCP and UDP ports used by IOT SCADA SERVER should be opened to outbound traffic, to ensure proper operation:
• 123 TCP (NTP) to synchronise the date and time• 53 UDP (DNS) for domain names resolution, which is essential for the connection to the remote support
VPN• 443 TCP and 1194 UDP for the connection to the VPN of Alleantia remote support• 21 TCP (FTP) for remote backup on FTP if enabled on a server not within the LAN network• 25 TCP (SMTP) to send email notifications if enabled by a server not within the LAN network. Some
SMTP servers may use a different TCP port. In this case open the specific port to traffic
If you want to remotely view the Web interface, enable the port to inbound traffic:• 80 TCP (HTTP)
The configuration includes the setup of IOT SCADA SERVER communication, connection to devices through different available interfaces and GUI customization.
4 Access
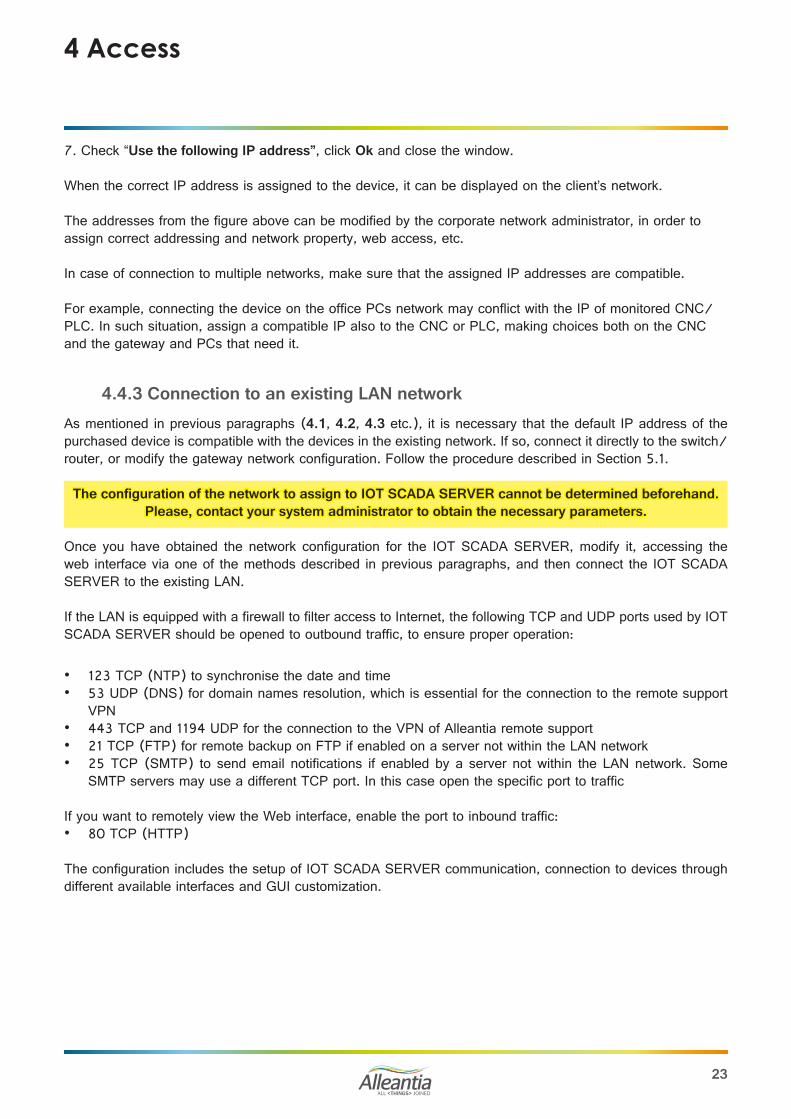
7. Check “Use the following IP address”, click Ok and close the window.
When the correct IP address is assigned to the device, it can be displayed on the client’s network. The addresses from the figure above can be modified by the corporate network administrator, in order to assign correct addressing and network property, web access, etc. In case of connection to multiple networks, make sure that the assigned IP addresses are compatible. For example, connecting the device on the office PCs network may conflict with the IP of monitored CNC/PLC. In such situation, assign a compatible IP also to the CNC or PLC, making choices both on the CNC and the gateway and PCs that need it.
ALL <THINGS> JOINED
24
4.5 Software installation
4 Access
If the IOT SCADA Server system is already installed on a device (PC, Gateway, etc.), to access and configure it, see paragraph 4.1.
Otherwise, if you need to install the software and license, follow these steps:
• Install the software;• Activate license.
4.5.1 Provided files
The IOT SCADA is supplied as .exe file to install on Windows systems. It creates web server that you can access via browser at http://localhost (80 port can be modified during installation). As regards the license, the provider sends a file with extension .lic that enables and activates the IOT SCADA.
4.5.2 Installation procedure
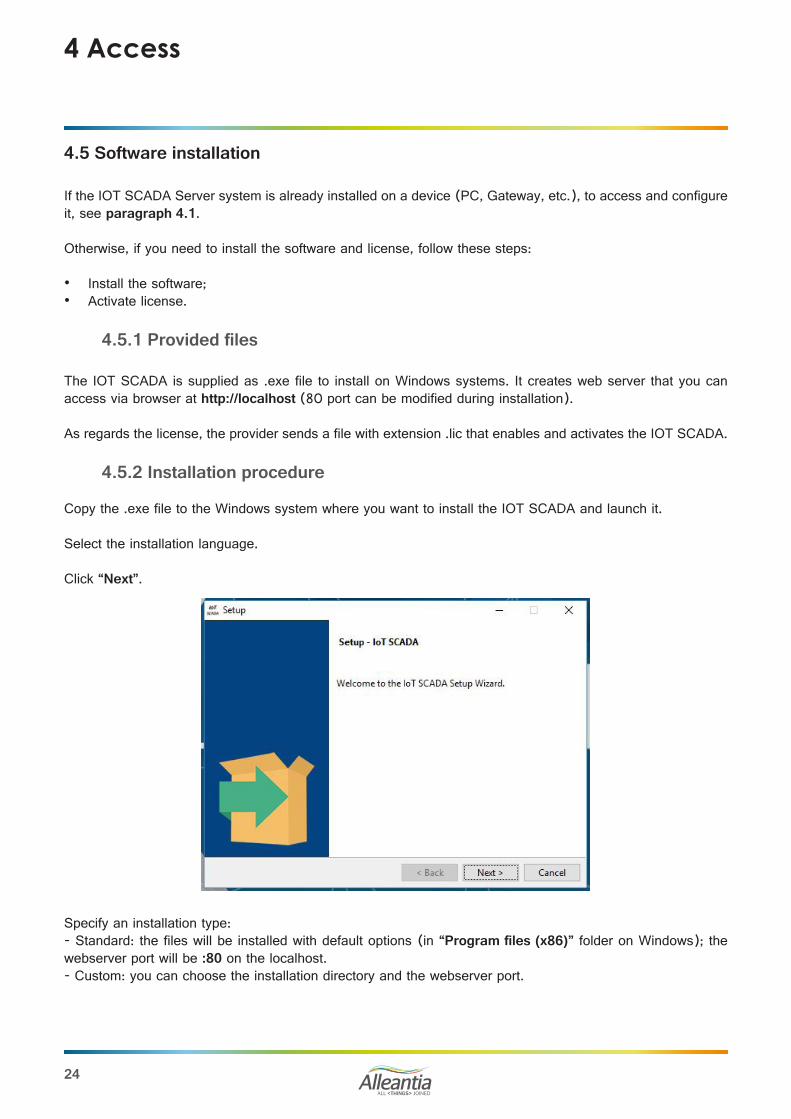
Copy the .exe file to the Windows system where you want to install the IOT SCADA and launch it.
Select the installation language.
Click “Next”.
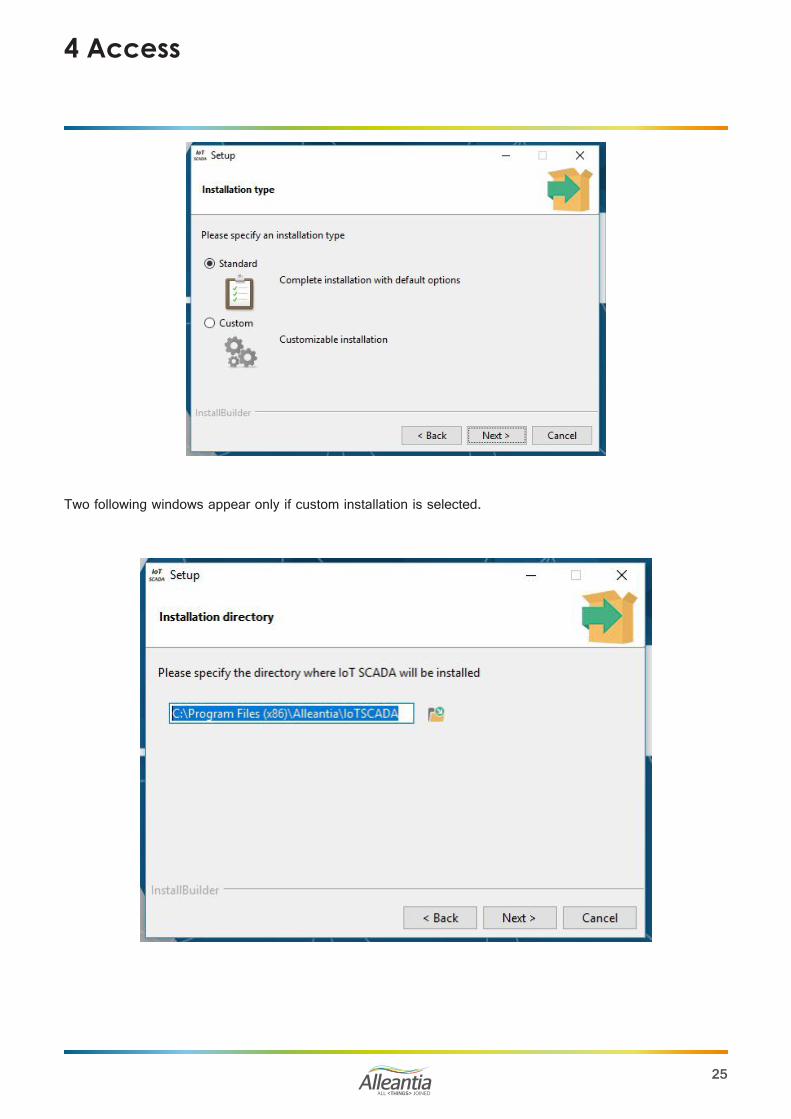
Specify an installation type: - Standard: the files will be installed with default options (in “Program files (x86)” folder on Windows); the webserver port will be :80 on the localhost. - Custom: you can choose the installation directory and the webserver port.
ALL <THINGS> JOINED
25
4 Access
Two following windows appear only if custom installation is selected.

ALL <THINGS> JOINED
26
4 Access
Click on “Next”.
In the end two icons will be created on the Desktop:
ALL <THINGS> JOINED
27
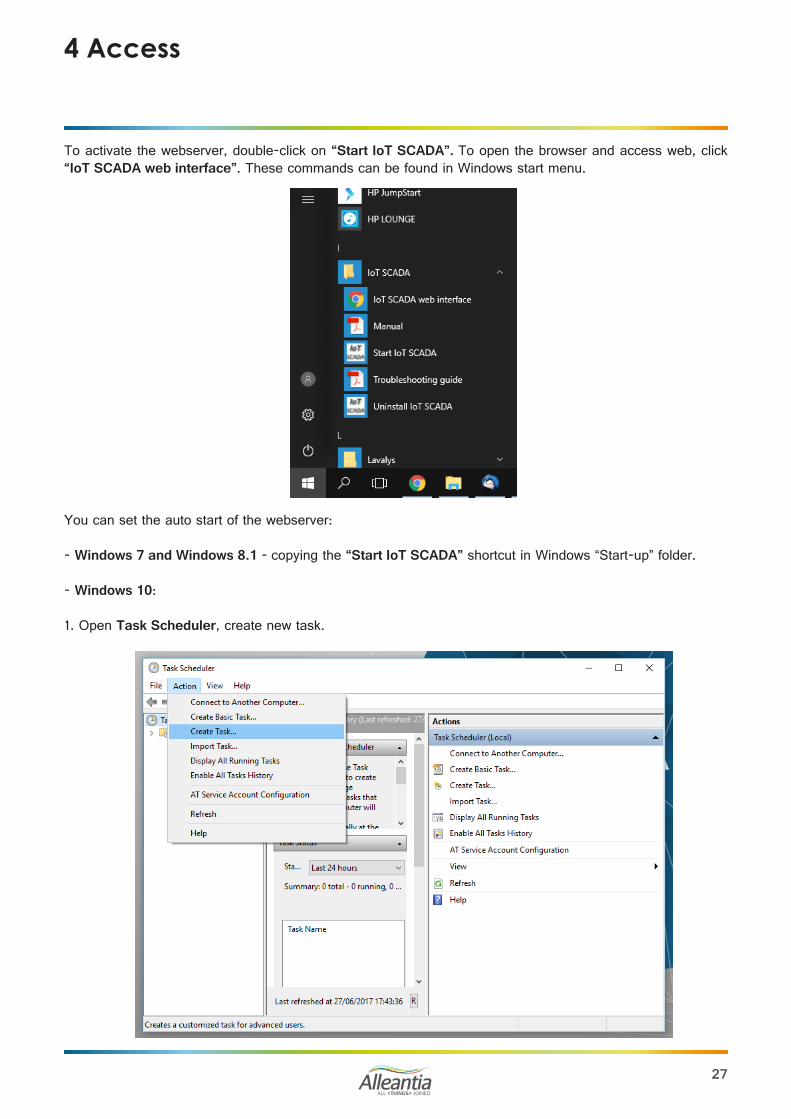
To activate the webserver, double-click on “Start IoT SCADA”. To open the browser and access web, click “IoT SCADA web interface”. These commands can be found in Windows start menu.
4 Access
You can set the auto start of the webserver:
- Windows 7 and Windows 8.1 - copying the “Start IoT SCADA” shortcut in Windows “Start-up” folder.
- Windows 10:
1. Open Task Scheduler, create new task.
ALL <THINGS> JOINED
28
4 Access
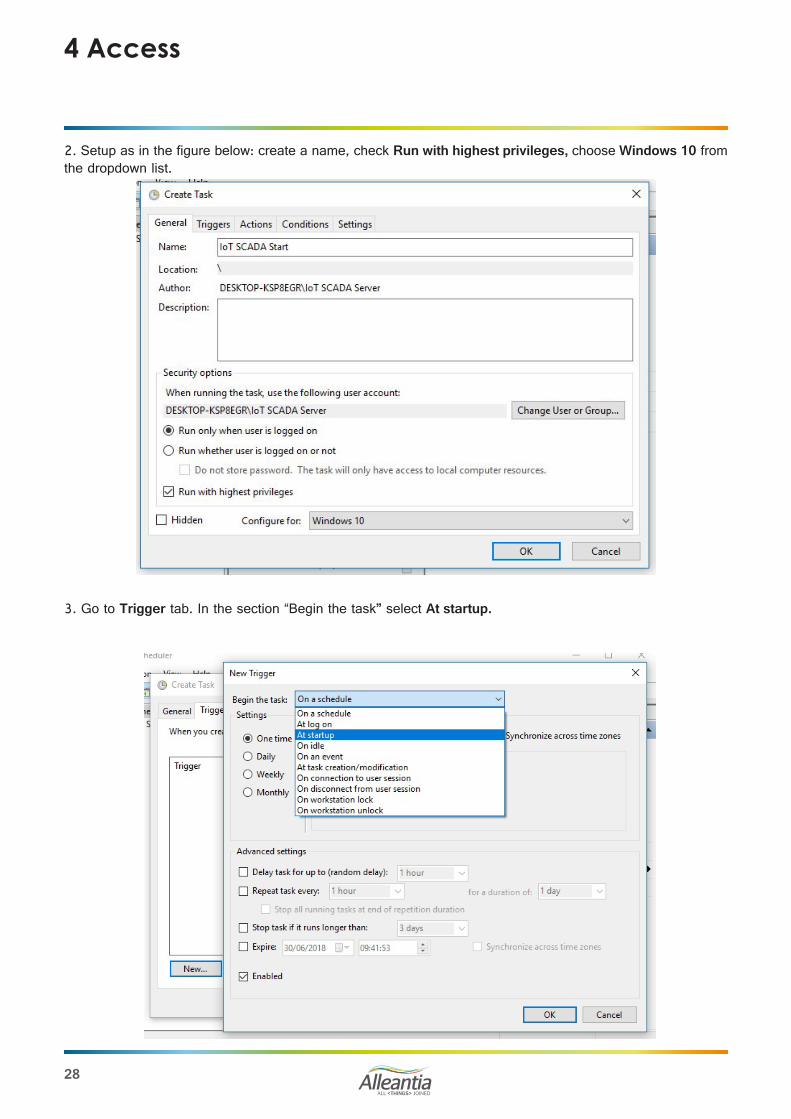
2. Setup as in the figure below: create a name, check Run with highest privileges, choose Windows 10 from the dropdown list.
3. Go to Trigger tab. In the section “Begin the task” select At startup.

ALL <THINGS> JOINED
29
4 Access
4. Go to Actions tab. Create new action. Browse the file C:\Program Files (x86)\Alleantia\IoTSCADA\yajsw\bat\runConsoleW.bat
5. In the Conditions tab, in Power section, uncheck Start the task only if the computer is on AC power.
ALL <THINGS> JOINED
30
4 Access
4.5.3 Update procedure
If the .exe file has been launched on the system where there is already an installed copy, it will be updated.
To stop/restart the active webserver, you can use “IoT SCADA” icon in Windows Task Bar.
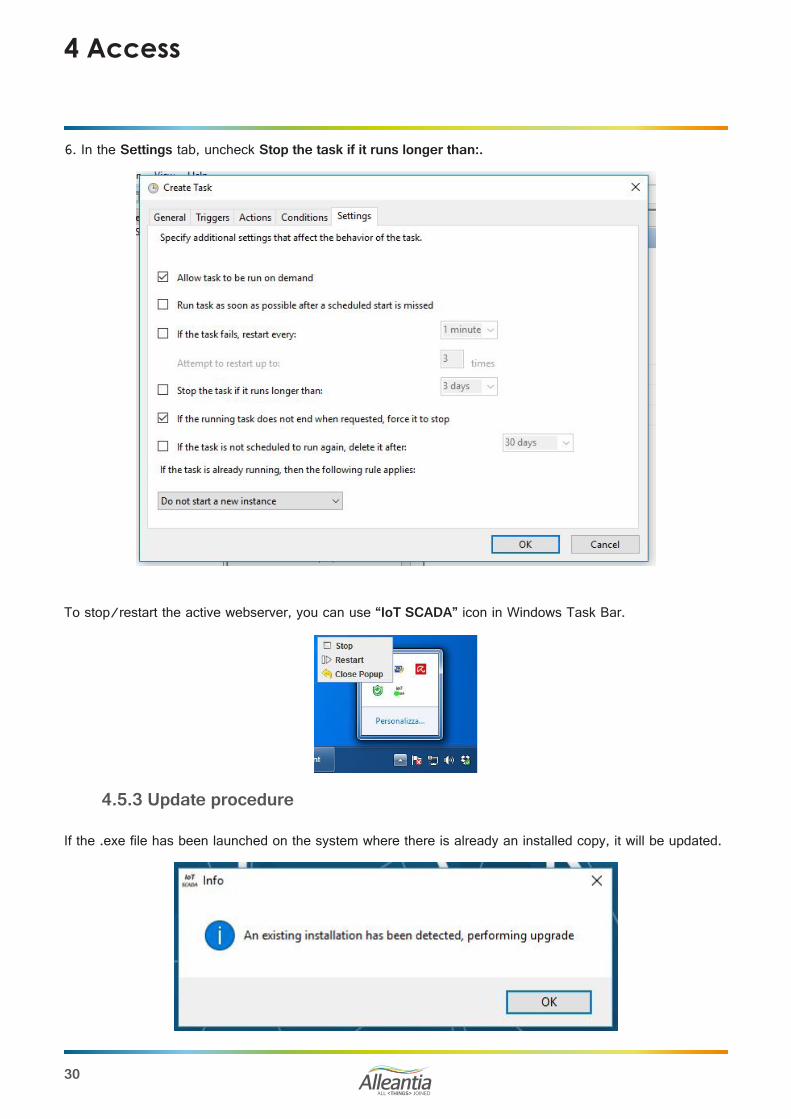
6. In the Settings tab, uncheck Stop the task if it runs longer than:.

ALL <THINGS> JOINED
31
Click “OK”, then “Next”.
4 Access
You will be asked to load new device mapping files, if in doubt, select “No”.
Click “Next” to start the update procedure.
4.5.4 License activation
Together with the product the activation code, consisting of xxxx numbers, is provided.
To activate the license, login to http://cloud.alleantia.com/login/login.zul
ALL <THINGS> JOINED
32
4 Access
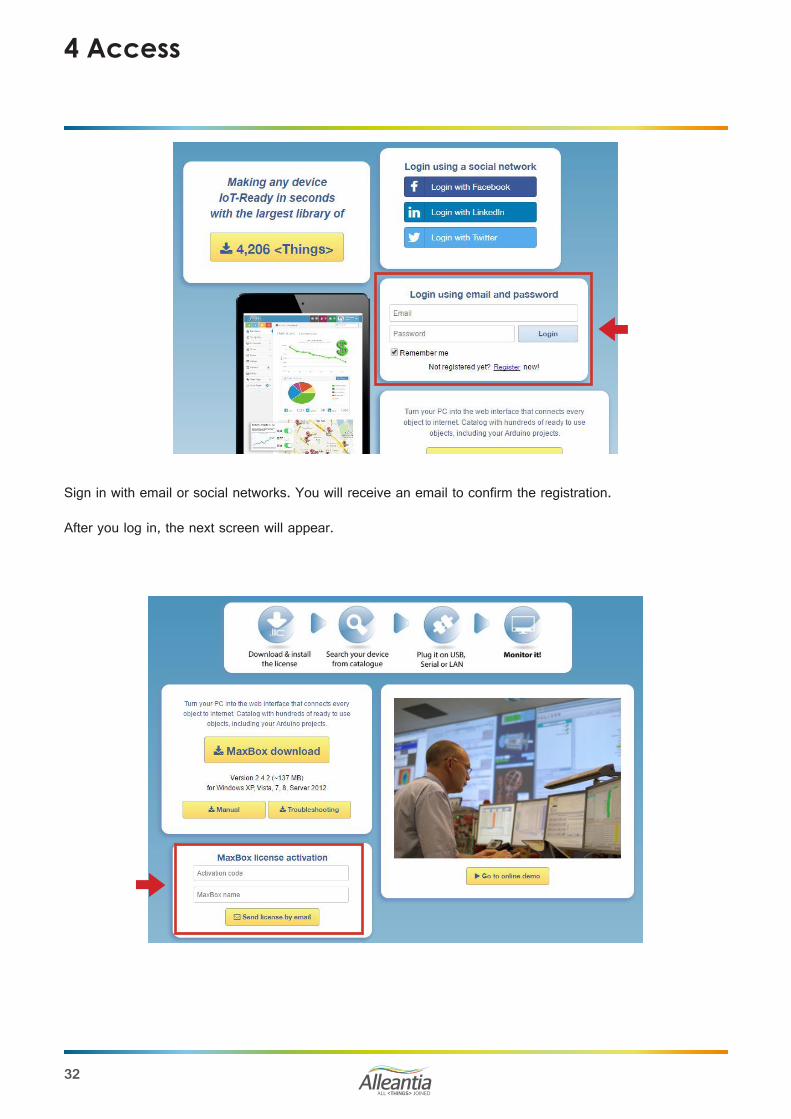
Sign in with email or social networks. You will receive an email to confirm the registration.
After you log in, the next screen will appear.

ALL <THINGS> JOINED
33
4 Access
Insert your activation code in “IOT SCADA license activation” field.File .lic will be automatically sent to your email for system activation.
4.5.5 Uninstallation process
To uninstall the program and delete the data, run “Uninstall IoT SCADA” from the Windows start menu.
CAUTION All data will be deleted without the possibility to recover
In the end of uninstallation, desktop icons and shortcuts from Windows menu will be removed.
ALL <THINGS> JOINED
34
5 Configuration
Access the “Configuration” section from the main navigation bar and enter the following credentials:
Username: adminPassword: webloggerSU
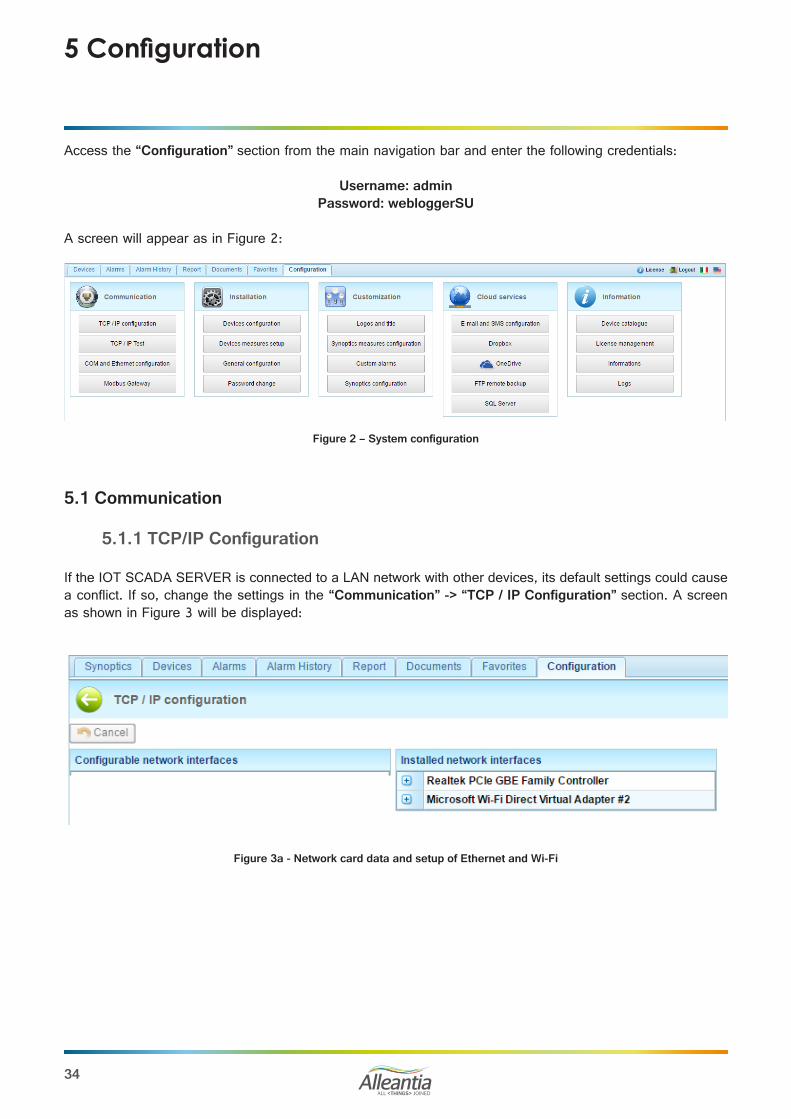
A screen will appear as in Figure 2:
Figure 2 – System configuration
5.1 Communication
5.1.1 TCP/IP Configuration
If the IOT SCADA SERVER is connected to a LAN network with other devices, its default settings could cause a conflict. If so, change the settings in the “Communication” -> “TCP / IP Configuration” section. A screen as shown in Figure 3 will be displayed:
Figure 3a - Network card data and setup of Ethernet and Wi-Fi

ALL <THINGS> JOINED
35
To modify the device’s IP addresses on Windows 10 OS, see paragraph 4.4.3. For other Windows versions refer to paragraphs 4.4.2 and 4.4.1.
If there is a DHCP server in the LAN network to which the IOT SCADA SERVER is connected, you can check the “Obtain an IP address automatically” and click Ok.
The IOT SCADA SERVER will lease the IP configuration directly from the DHCP server.
If the DHCP server is not available or you prefer to set the IP address manually, check the “Use the following IP address” and enter all the “IP Parameters” including the IP addresses of the DNS servers that may coincide with that of the gateway in simple network configuration.
5 Configuration
Figure 3b - Network card data and setup of Ethernet and Wi-Fi
ALL <THINGS> JOINED
36
The right area “Network Interface” displays the current network configuration for both the wired interface (LAN) as well as the Alleantia VPN (Virtual Private Network) through which the IOT SCADA SERVER communicates with any centralised server (optional service) and the remote support, where available.
If the network to which you are connected has internet access, refer to paragraph 5.1.3 to verify the correctness of the LAN configuration set.
If there is a Wi-Fi, you can easily connect the gateway in order to monitor without laying additional cables.
To connect to Wi-Fi, click the desktop icon and search for available networks.
Select the network and insert the password.
The device will connect to the network and it will be possible to query it from any device, connected to the same Wi-Fi.
To connect to the device, open the browser and insert the static IP, assigned to the gateway, for example
http://192.168.1.29
Refer to previous paragraphs for the assigning IP to the gateway.
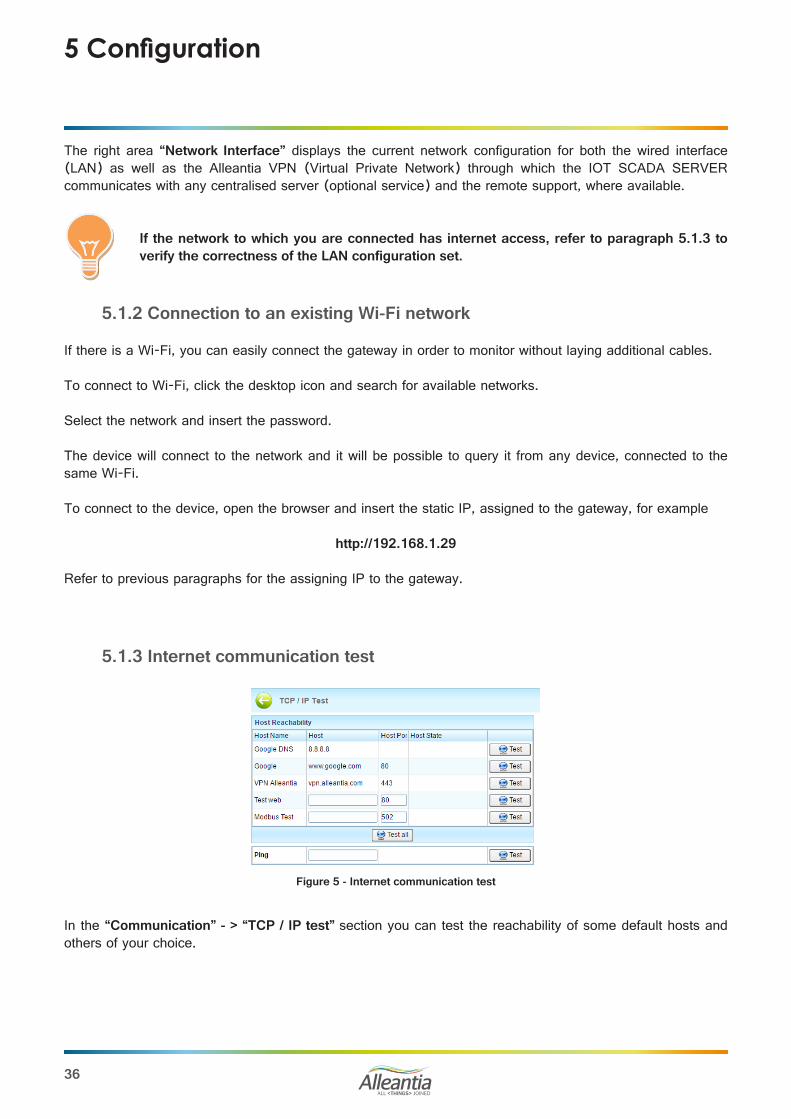
In the “Communication” - > “TCP / IP test” section you can test the reachability of some default hosts and others of your choice.
5 Configuration
5.1.2 Connection to an existing Wi-Fi network
Figure 5 - Internet communication test
5.1.3 Internet communication test
ALL <THINGS> JOINED
37
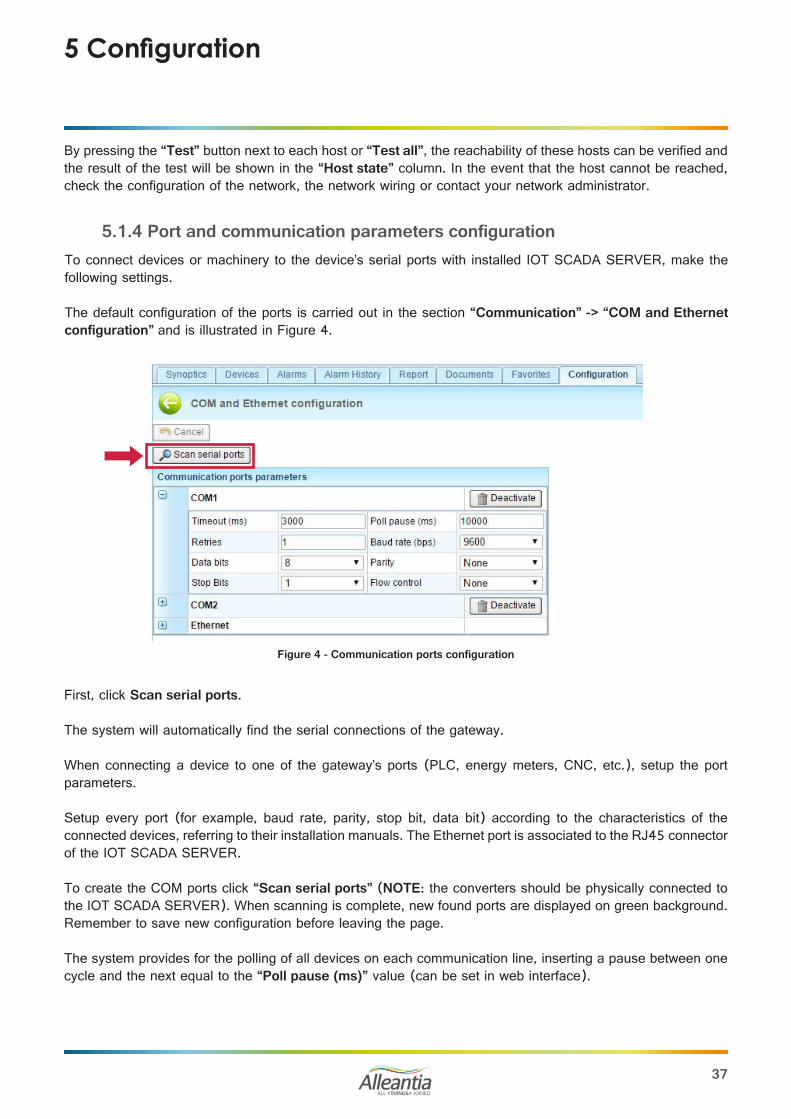
To connect devices or machinery to the device’s serial ports with installed IOT SCADA SERVER, make the following settings.
The default configuration of the ports is carried out in the section “Communication” -> “COM and Ethernet configuration” and is illustrated in Figure 4.
First, click Scan serial ports.
The system will automatically find the serial connections of the gateway.
When connecting a device to one of the gateway’s ports (PLC, energy meters, CNC, etc.), setup the port parameters.
Setup every port (for example, baud rate, parity, stop bit, data bit) according to the characteristics of the connected devices, referring to their installation manuals. The Ethernet port is associated to the RJ45 connector of the IOT SCADA SERVER.
To create the COM ports click “Scan serial ports” (NOTE: the converters should be physically connected to the IOT SCADA SERVER). When scanning is complete, new found ports are displayed on green background. Remember to save new configuration before leaving the page.
The system provides for the polling of all devices on each communication line, inserting a pause between one cycle and the next equal to the “Poll pause (ms)” value (can be set in web interface).
By pressing the “Test” button next to each host or “Test all”, the reachability of these hosts can be verified and the result of the test will be shown in the “Host state” column. In the event that the host cannot be reached, check the configuration of the network, the network wiring or contact your network administrator.
5 Configuration
5.1.4 Port and communication parameters configuration
Figure 4 - Communication ports configuration

ALL <THINGS> JOINED
38
5.1.5 Modbus Gateway
To create automatically the Modbus map with information and download it in Excel format, including the configured information set, click the Download Modbus map (Excel. XLSX) button, which is enabled when the gateway is enabled.
Figure 5 - Modbus Gateway
The mapping of the measures of the devices on the Modbus gateway follows the following rules:• For each IO SCADA SERVER serial port where devices are connected and configured, a TCP Modbus
slave is created on a different TCP port:o COM1 -> TCP 502 porto COM2 -> TCP 503 porto COM3 -> TCP 504 porto COM4 -> TCP 505 porto COM5 -> TCP 506 porto Ethernet -> TCP 565 port
• Within each Modbus slave the devices keep the address configured on the physical device. If, however, this address is greater than 247, the maximum permitted by the Modbus protocol, it will be arbitrarily reassigned.
• The Modbus devices maintain the same identical mapping of the original device, both in respect of the areas as well as the addresses, data types etc. Byte and word swaps will not be considered.
• Non-Modbus devices will show the Boolean types in the coil area and numeric types both in Holding as well
In the event that the polling of a device is not successful within the “Timeout (ms)”, the system performs a number of attempts equal to “Retries” before highlighting a communication error and moving on to the next device.
In the event of communication problems, increase this value by up to a few seconds in order to avoid under-performing electronic systems being overloaded by repeated polling.
The non-functioning device will be called up in each scan cycle. Press “Save” to apply changes when the configuration is complete.
5 Configuration
The Modbus gateway feature makes the system data accessible to external software via the Modbus protocol enabling, for example, the integration with SCADA systems, regardless of the protocol used by devices to which the IOT SCADA SERVER is connected upstream.
5.1.5.1 Rules of automatic mapping
ALL <THINGS> JOINED
39
as in Input. The number will be in 2-word float format. The register address will be calculated arbitrarily.• The bits within a word of the gateway are in Big-Endian format (More Significant Byte First) and the word
in data types in 32 or 64 bits are in Little Endian format (Less Significant Word First).• If a physical device goes offline, it will not respond when contacted through the gateway and the request
will time out.• If the value of a register containing a measure not read by IOT SCADA SERVER (see paragraph 5.2.3),
is requested, the gateway responds with a default value of 0 for numeric data types and false for Boolean• If the value of a non-existent Modbus register is requested, the gateway responds with the exception code
“2”, that is “Illegal Data Address”.• The gateway does not support writing, so if these are carried out by an external Modbus master, the
Modbus register values are immediately restored to the value prior to the writing.
5.2 Installation
5.2.1 System devices connection and configurationThis section describes how to add and remove new devices connected to the IOT SCADA SERVER via the RS485 serial interface or via Ethernet.
The examples below are valid for any kind of device or machinery you want to connect: PLC, inverter, CNC, remote modules with digital and analog input and outputs, etc. in the library or created new drivers.
5.2.1.1 Adding new devices
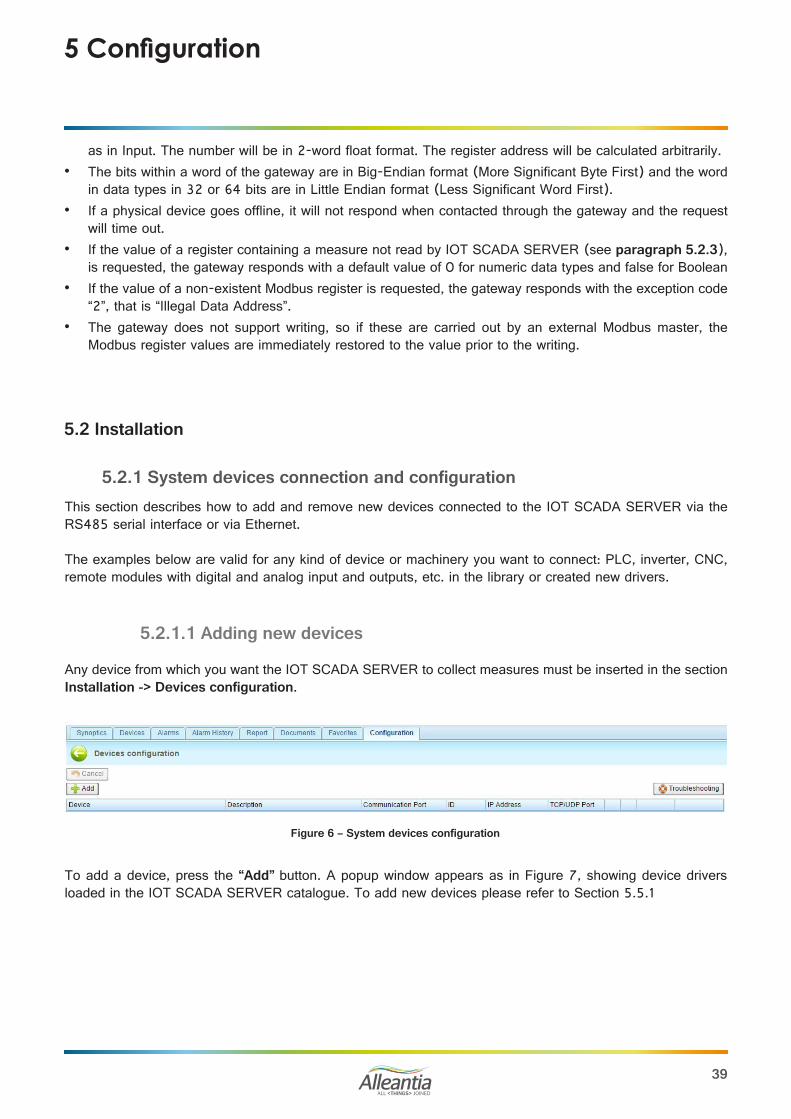
Any device from which you want the IOT SCADA SERVER to collect measures must be inserted in the section Installation -> Devices configuration.
Figure 6 – System devices configuration
To add a device, press the “Add” button. A popup window appears as in Figure 7, showing device drivers loaded in the IOT SCADA SERVER catalogue. To add new devices please refer to Section 5.5.1
5 Configuration
ALL <THINGS> JOINED
40
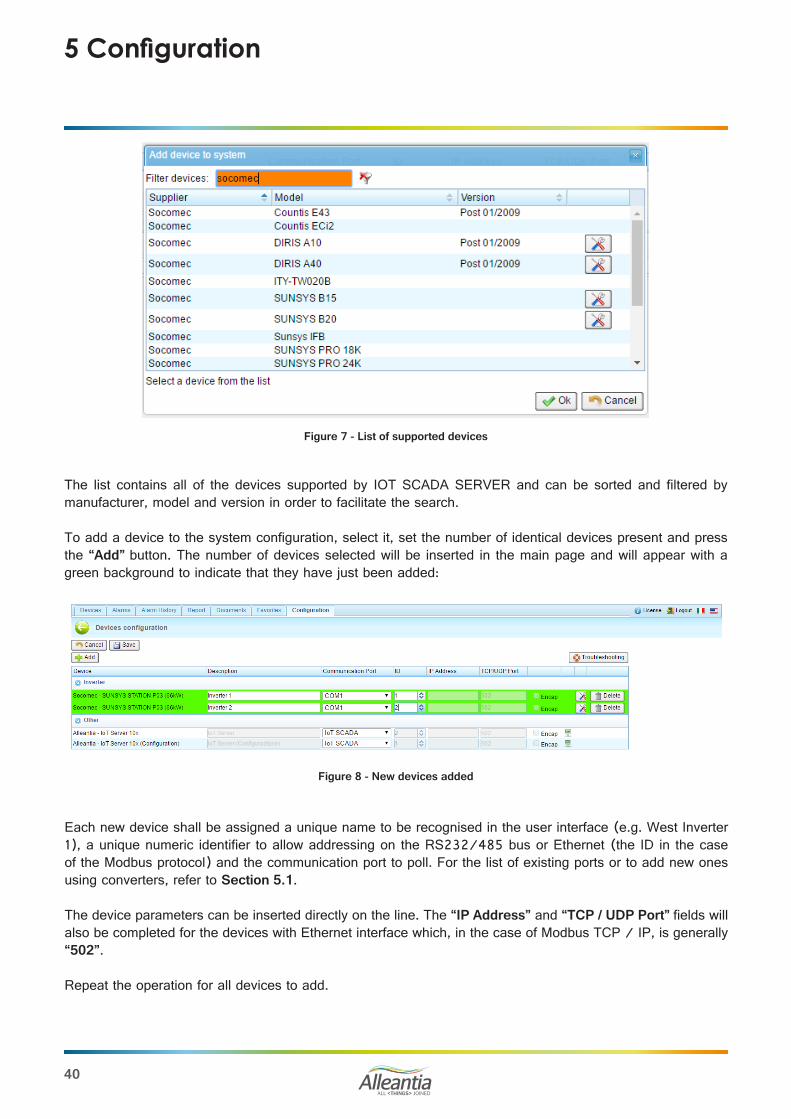
Figure 7 - List of supported devices
The list contains all of the devices supported by IOT SCADA SERVER and can be sorted and filtered by manufacturer, model and version in order to facilitate the search.
To add a device to the system configuration, select it, set the number of identical devices present and press the “Add” button. The number of devices selected will be inserted in the main page and will appear with a green background to indicate that they have just been added:
Figure 8 - New devices added
Each new device shall be assigned a unique name to be recognised in the user interface (e.g. West Inverter 1), a unique numeric identifier to allow addressing on the RS232/485 bus or Ethernet (the ID in the case of the Modbus protocol) and the communication port to poll. For the list of existing ports or to add new ones using converters, refer to Section 5.1.
The device parameters can be inserted directly on the line. The “IP Address” and “TCP / UDP Port” fields will also be completed for the devices with Ethernet interface which, in the case of Modbus TCP / IP, is generally “502”.
Repeat the operation for all devices to add.
5 Configuration
ALL <THINGS> JOINED
41
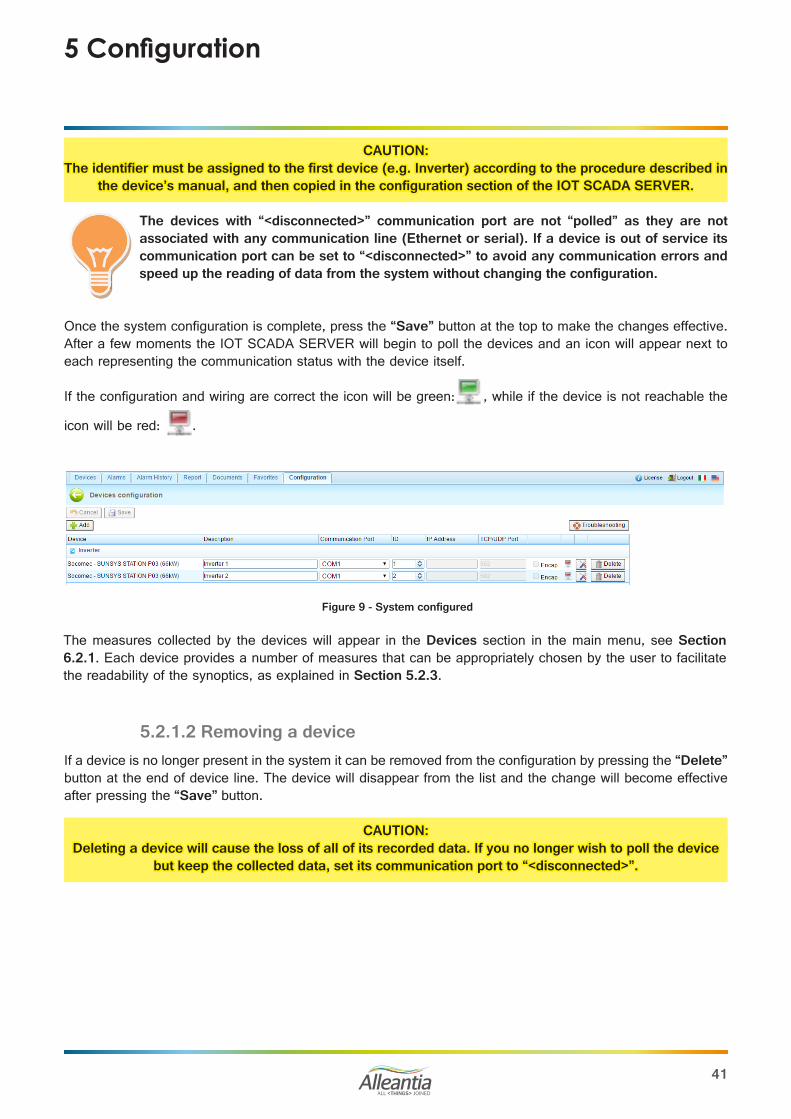
CAUTION: The identifier must be assigned to the first device (e.g. Inverter) according to the procedure described in
the device’s manual, and then copied in the configuration section of the IOT SCADA SERVER.
The devices with “<disconnected>” communication port are not “polled” as they are not associated with any communication line (Ethernet or serial). If a device is out of service its communication port can be set to “<disconnected>” to avoid any communication errors and speed up the reading of data from the system without changing the configuration.
Once the system configuration is complete, press the “Save” button at the top to make the changes effective. After a few moments the IOT SCADA SERVER will begin to poll the devices and an icon will appear next to each representing the communication status with the device itself.
If the configuration and wiring are correct the icon will be green: , while if the device is not reachable the
icon will be red: .
Figure 9 - System configured
5 Configuration
The measures collected by the devices will appear in the Devices section in the main menu, see Section 6.2.1. Each device provides a number of measures that can be appropriately chosen by the user to facilitate the readability of the synoptics, as explained in Section 5.2.3.
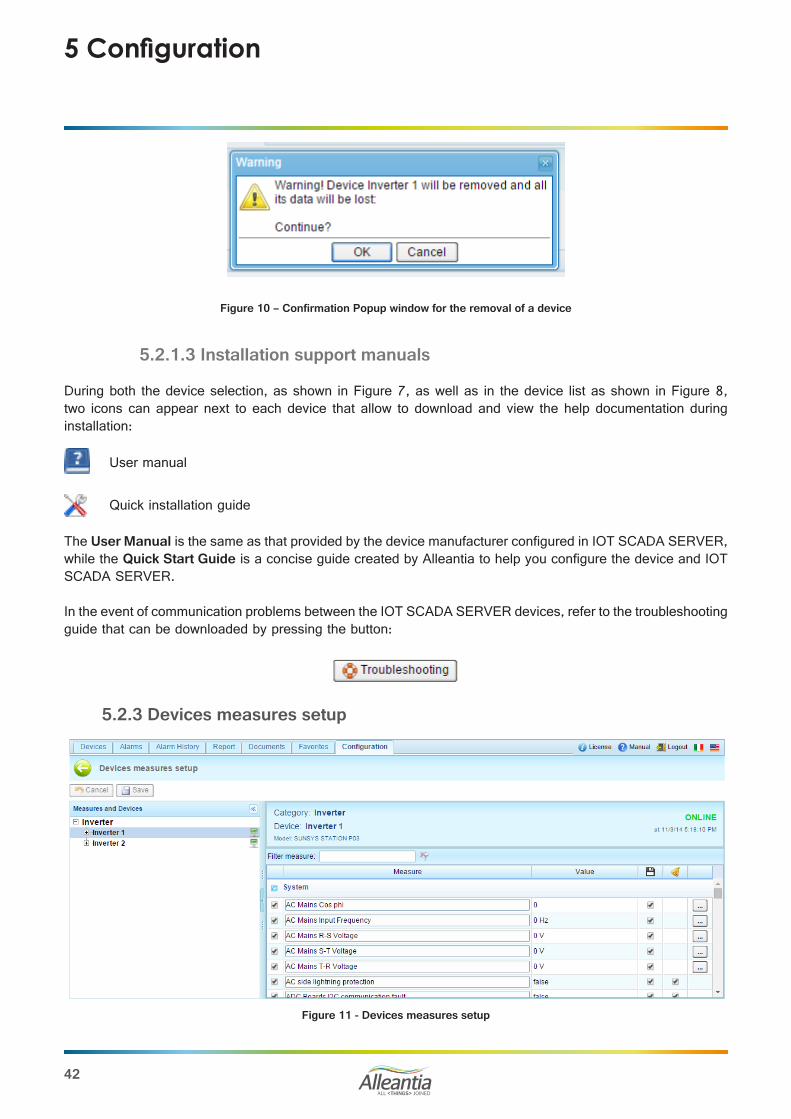
5.2.1.2 Removing a deviceIf a device is no longer present in the system it can be removed from the configuration by pressing the “Delete” button at the end of device line. The device will disappear from the list and the change will become effective after pressing the “Save” button.
CAUTION:Deleting a device will cause the loss of all of its recorded data. If you no longer wish to poll the device
but keep the collected data, set its communication port to “<disconnected>”.
ALL <THINGS> JOINED
42
5.2.1.3 Installation support manuals
5.2.3 Devices measures setup
Figure 11 - Devices measures setup
5 Configuration
Figure 10 – Confirmation Popup window for the removal of a device
User manual
Quick installation guide
During both the device selection, as shown in Figure 7, as well as in the device list as shown in Figure 8, two icons can appear next to each device that allow to download and view the help documentation during installation:
The User Manual is the same as that provided by the device manufacturer configured in IOT SCADA SERVER, while the Quick Start Guide is a concise guide created by Alleantia to help you configure the device and IOT SCADA SERVER.
In the event of communication problems between the IOT SCADA SERVER devices, refer to the troubleshooting guide that can be downloaded by pressing the button:
ALL <THINGS> JOINED
43
Checking the boxes at the beginning of each line enables the reading of a single measure. Unchecking disable reading check boxes in the column with the symbol, it is possible to enable or disable measure logging in the IOT SCADA SERVER.
CAUTION: Graphs can only be generated for the measures with enabled logging
Nel caso in cui la misura rappresenti un allarme, sarà presente anche una casella di spunta nella colonna conil simbolo , spuntandola l’IOT SCADA SERVER visualizzerà un allarme quando la misura assumerà un valore all’interno della soglia impostata oppure sarà un allarme automaticamente generato (PLC, CNC, etc). Il sistema provvederà all’invio di mail in automatico per notifica allarme ai destinatari impostati. È possibile modificare il nome della misura direttamente nella casella di testo, per modificare invece le altre impostazioni, se presenti, è possibile aprire un popup dedicato cliccando sul pulsante .
Each device supported by IOT SCADA SERVER carries all information about any measure provided by the device. In order to avoid showing too many measures and slow down the scanning of the devices, only the measures actually considered useful for the monitoring are read when the device is added.
To change the default configuration, access the Installation -> Devices measures setup section; there is a tree menu on the left where all devices that the IOT SCADA SERVER is polling can be seen, organised by category. Once you have selected a device, all available measures will appear on the right.
5 Configuration
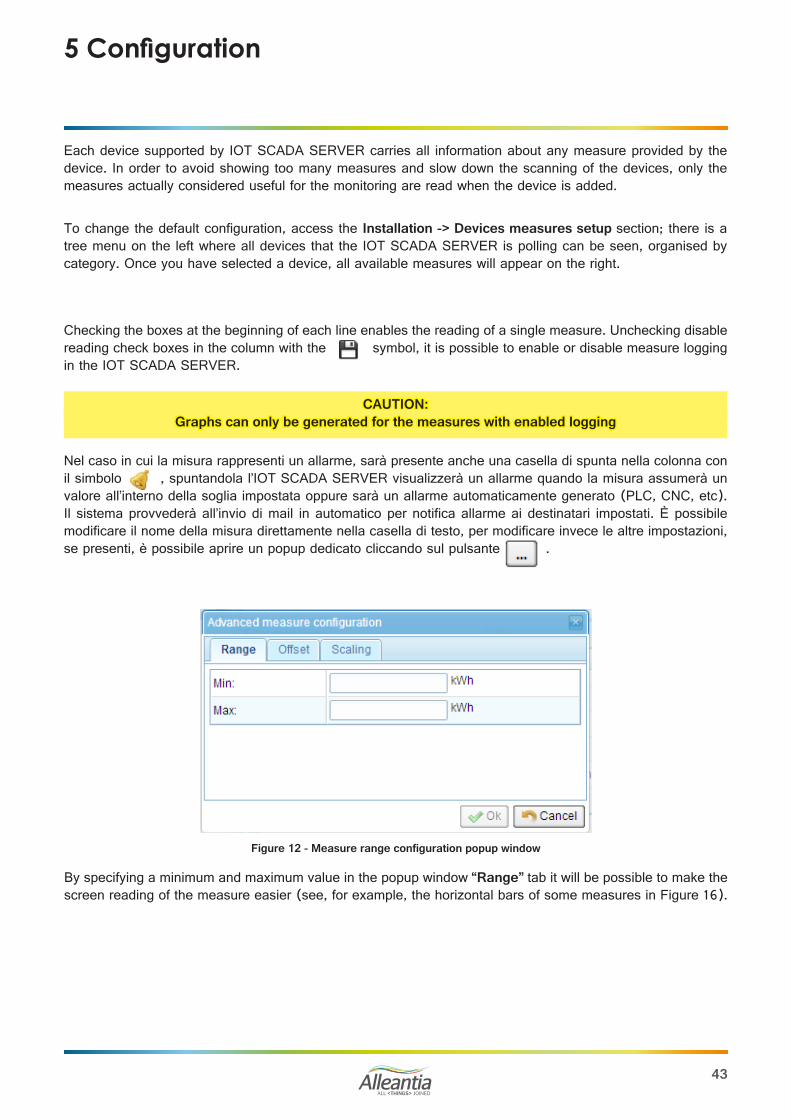
Figure 12 - Measure range configuration popup window
By specifying a minimum and maximum value in the popup window “Range” tab it will be possible to make the screen reading of the measure easier (see, for example, the horizontal bars of some measures in Figure 16).
ALL <THINGS> JOINED
44
5.2.3.1 Measures offset
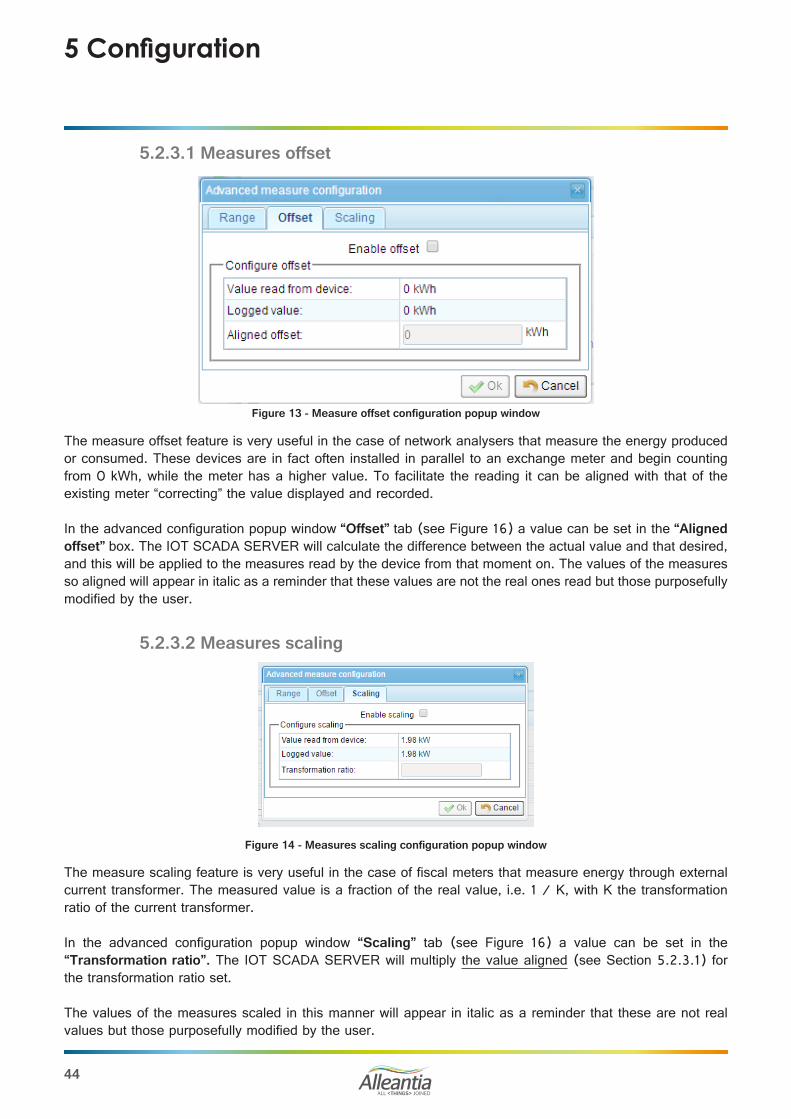
Figure 13 - Measure offset configuration popup window
5.2.3.2 Measures scaling
5 Configuration
Figure 14 - Measures scaling configuration popup window
The measure scaling feature is very useful in the case of fiscal meters that measure energy through external current transformer. The measured value is a fraction of the real value, i.e. 1 / K, with K the transformation ratio of the current transformer.
In the advanced configuration popup window “Scaling” tab (see Figure 16) a value can be set in the “Transformation ratio”. The IOT SCADA SERVER will multiply the value aligned (see Section 5.2.3.1) for the transformation ratio set.
The values of the measures scaled in this manner will appear in italic as a reminder that these are not real values but those purposefully modified by the user.
The measure offset feature is very useful in the case of network analysers that measure the energy produced or consumed. These devices are in fact often installed in parallel to an exchange meter and begin counting from 0 kWh, while the meter has a higher value. To facilitate the reading it can be aligned with that of the existing meter “correcting” the value displayed and recorded.
In the advanced configuration popup window “Offset” tab (see Figure 16) a value can be set in the “Aligned offset” box. The IOT SCADA SERVER will calculate the difference between the actual value and that desired, and this will be applied to the measures read by the device from that moment on. The values of the measures so aligned will appear in italic as a reminder that these values are not the real ones read but those purposefully modified by the user.

ALL <THINGS> JOINED
45
5.2.4 General settings
5.2.5 Password change
5 Configuration
Figure 15 – Data sampling configuration
Data sampling will affect the accuracy of the measure as it will increase or decrease the number of samples available to be analysed. A too high number of samples could excessively slow the processing.
On the same page you can set the system date and time: Date-Time Set, System Reset and System Reboot.It’s even possible to reset IOT SCADA SERVER configuration by clicking on the Reset button, in this case:
CAUTION: In case of reset all data and configurations of devices, alarms and notifications WILL BE LOST without
possibility to recover
Figure 16 – Password change
CAUTION: For security reasons it is strongly recommended to change the IOT SCADA SERVER admin password
immediately
To change the access password to the configuration section, go to the Installation -> Password Change section and enter the old password (the initial installation default password is webloggerSU, as specified in Section 5). Select the new password and re-enter to confirm the selection. When finished, press the Save button.

ALL <THINGS> JOINED
46
5.3 Customization
5.3.1 Logos and title
Figure 18 - Custom measures
5.3.2 Custom measures
5 Configuration
Figure 17 - System logos and title customization
In the Customization -> Logos and title section the IOT SCADA SERVER interface can be customized:• in the Title section the upper title present in all the pages of the interface can be set,• in the Logo section 2 logos can be entered, one on the upper right and one on the upper left. These are
also always present in all the pages GUI.
In addition to the measures read by the devices, you can define custom measures (such as, for example, sums of other measures): clicking the Add button in the Configuration > Synoptic measures configuration -> Custom measures section (Figure 18) a popup menu will open that allows you to enter the name of the new measure and select the existing ones which, when summed, will contribute to its value (Figure 19).
ALL <THINGS> JOINED
47
Figure 19 – Custom measures popup window
5.3.3 Custom alarms
5 Configuration
For example, if the system is divided into two levels, you can create the custom measures “East Power” and “West Power” and select the power of the inverters associated to each level for each one. Please note that it is only possible to choose measures with the same measure units. Therefore, after selecting the first one, an automatic filter will remove all those that have different units of measures from the list on the right.
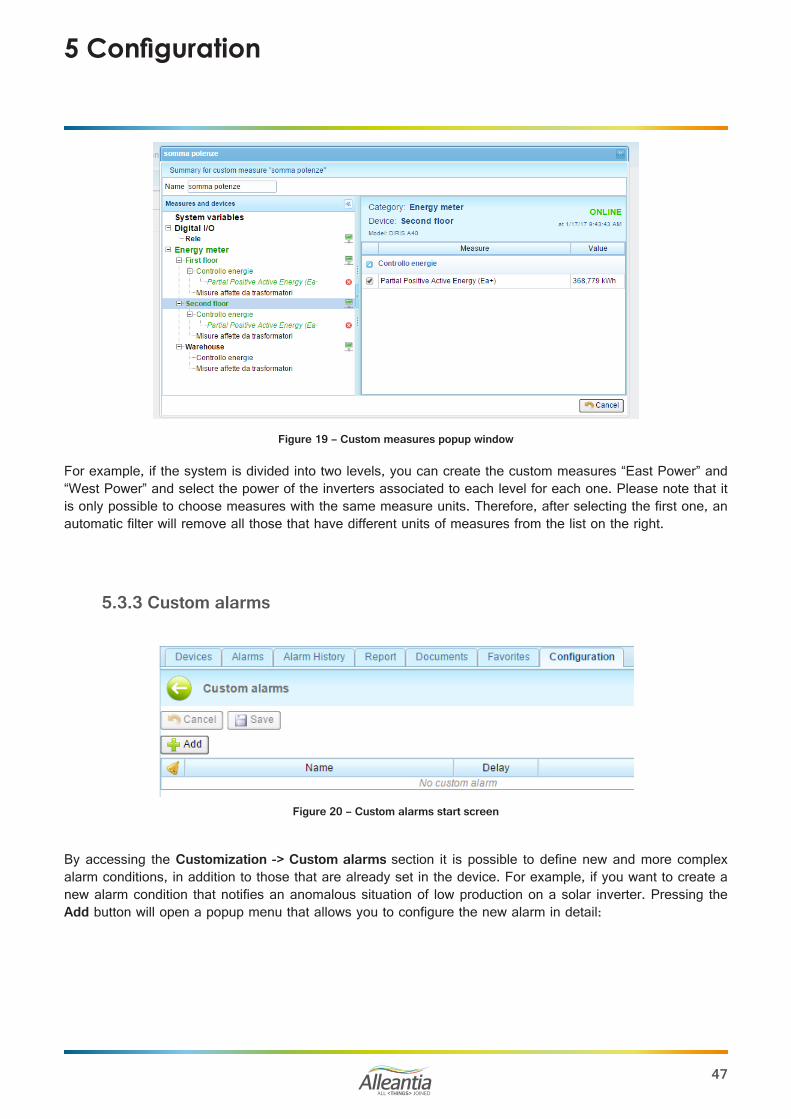
Figure 20 – Custom alarms start screen
By accessing the Customization -> Custom alarms section it is possible to define new and more complex alarm conditions, in addition to those that are already set in the device. For example, if you want to create a new alarm condition that notifies an anomalous situation of low production on a solar inverter. Pressing the Add button will open a popup menu that allows you to configure the new alarm in detail:

ALL <THINGS> JOINED
48
In the popup window insert the name for the alarm and text description that will be used during the notification
to the user. Below, in the Alarm Condition section proceed to the selection of all the measures that you intend
to monitor by pressing the button. In this case we select only the power of inverter 1. Following the selection, the list of measures selected will appear next to the button. The check boxes enable the control types to be performed on the measure value. In this case the alarm will be triggered if the power of the inverter 1 falls below a certain threshold:
5 Configuration
Figure 21 - New custom alarm configuration
ALL <THINGS> JOINED
49
5 Configuration
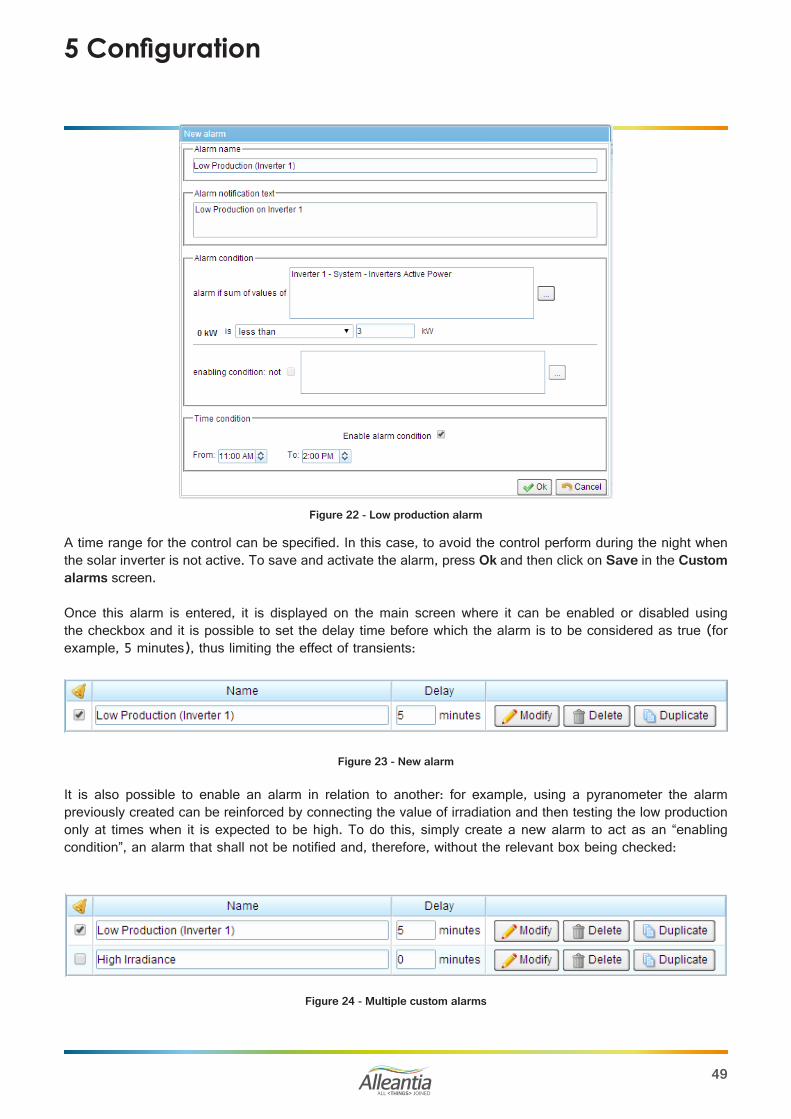
Figure 22 - Low production alarm
A time range for the control can be specified. In this case, to avoid the control perform during the night when the solar inverter is not active. To save and activate the alarm, press Ok and then click on Save in the Custom alarms screen.
Once this alarm is entered, it is displayed on the main screen where it can be enabled or disabled using the checkbox and it is possible to set the delay time before which the alarm is to be considered as true (for example, 5 minutes), thus limiting the effect of transients:
Figure 23 - New alarm
It is also possible to enable an alarm in relation to another: for example, using a pyranometer the alarm previously created can be reinforced by connecting the value of irradiation and then testing the low production only at times when it is expected to be high. To do this, simply create a new alarm to act as an “enabling condition”, an alarm that shall not be notified and, therefore, without the relevant box being checked:
Figure 24 - Multiple custom alarms

ALL <THINGS> JOINED
50
5 Configuration
Figure 25 - High irradiance condition
The alarm condition is unusual in this case (and is, in fact, not notified), but allows the user to avoid the application of a time condition: a “low irradiance” condition without a time slot would be triggered every night.Once the alarm condition has been saved, change the low production alarm to link it to that of the irradiation thanks to the “enabling condition”:
Figure 26 - Change low production alarm enabling condition
ALL <THINGS> JOINED
51
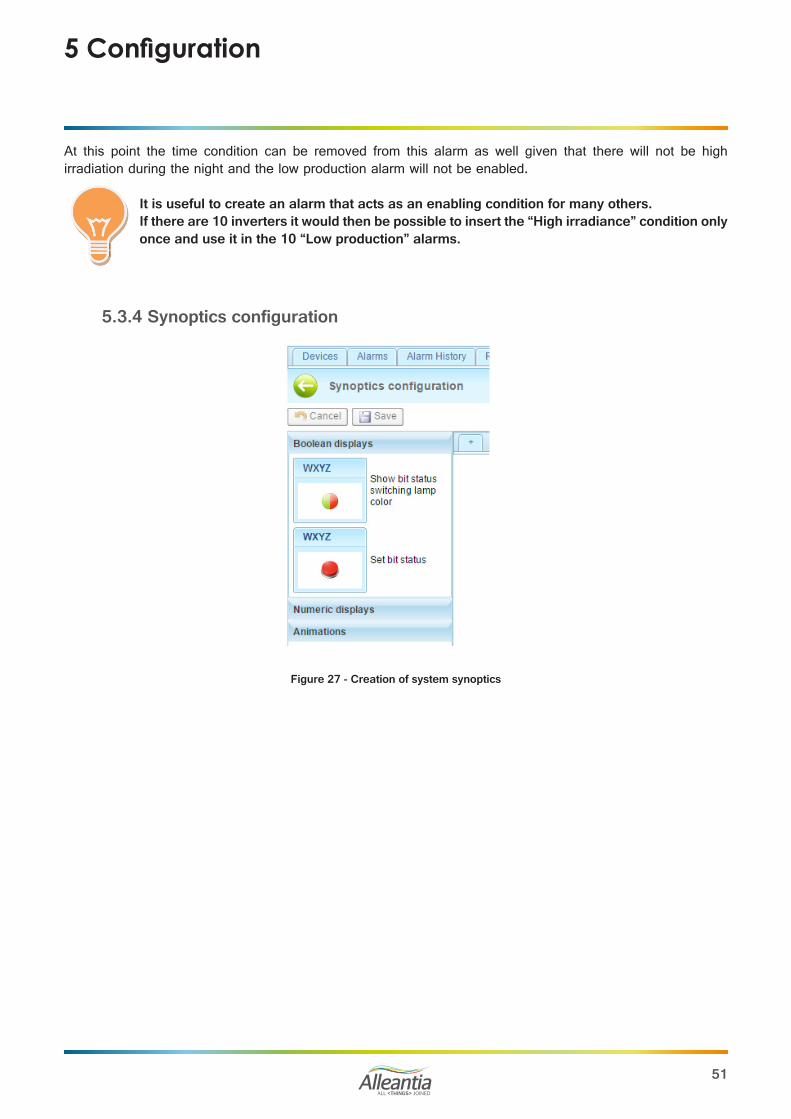
5.3.4 Synoptics configuration
5 Configuration
At this point the time condition can be removed from this alarm as well given that there will not be high irradiation during the night and the low production alarm will not be enabled.
It is useful to create an alarm that acts as an enabling condition for many others.If there are 10 inverters it would then be possible to insert the “High irradiance” condition only once and use it in the 10 “Low production” alarms.
Figure 27 - Creation of system synoptics
ALL <THINGS> JOINED
52
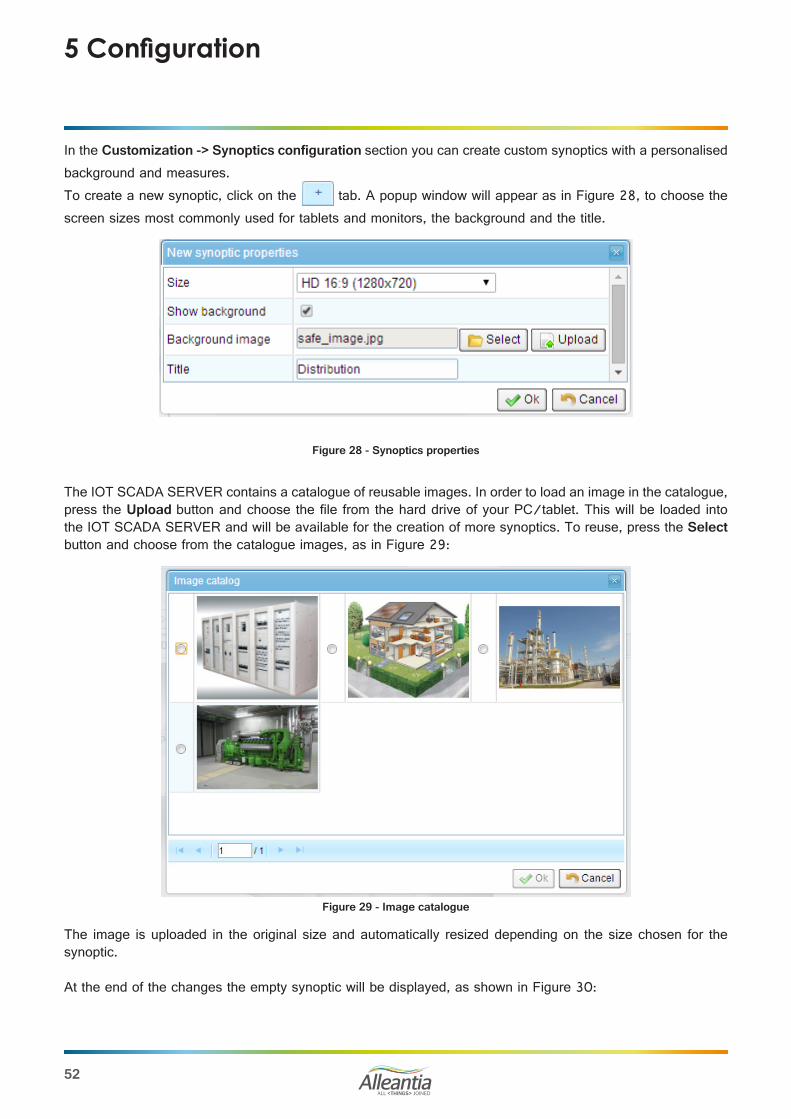
In the Customization -> Synoptics configuration section you can create custom synoptics with a personalised background and measures.To create a new synoptic, click on the tab. A popup window will appear as in Figure 28, to choose the screen sizes most commonly used for tablets and monitors, the background and the title.
5 Configuration
Figure 28 - Synoptics properties
The IOT SCADA SERVER contains a catalogue of reusable images. In order to load an image in the catalogue, press the Upload button and choose the file from the hard drive of your PC/tablet. This will be loaded into the IOT SCADA SERVER and will be available for the creation of more synoptics. To reuse, press the Select button and choose from the catalogue images, as in Figure 29:
Figure 29 - Image catalogue
The image is uploaded in the original size and automatically resized depending on the size chosen for the synoptic.
At the end of the changes the empty synoptic will be displayed, as shown in Figure 30:

ALL <THINGS> JOINED
53
5 Configuration
Figure 30 - Empty synoptic
To change the properties of the synoptic double click on the corresponding tab or on the background. The popup window in Figure 31 will appear again.
To delete the synoptic, click on the “X” in the upper right corner of the corresponding tab.
From now on it is possible to add the displays that will show the values of the measures in the system, which are of 2 types: numeric and visual (lamp) displays. The numeric display shows just numeric values, while the lamp display shows Boolean values.
These two displays are shown on the left side of the page. To add one, simply drag it on to the synoptic into the position where you want it to be shown. Once released, a popup window will appear as in Figure 30 and Figure 31 to change its properties.
Figure 31 - Lamp type display properties

ALL <THINGS> JOINED
54
5 Configuration
Figure 32 - Numeric type display properties
The measure to be shown, the upper (first line) and lower (second row) title, the colours of the background and of any lamp displays can be chosen.
Once the parameters have been entered, the synoptic will appear for example as shown in Figure 33:
Figure 33 - Synoptic with display
To subsequently change the properties of the display, double click on the displays themselves. The popup window in Figure 32 and Figure 33 will appear again, from which it is possible to delete the properties.
In the Animations section the synoptic in the home page can be automatically changed by selecting the check box Enable synoptic rotation and defining an interval in seconds.Once defined the synoptic will appear in Synoptic window of the graphic interface (see Figure 33 at the top left).
ALL <THINGS> JOINED
55
5.4 Interface and Cloud services
5.4.1 E-mail and SMS notifications
5 Configuration
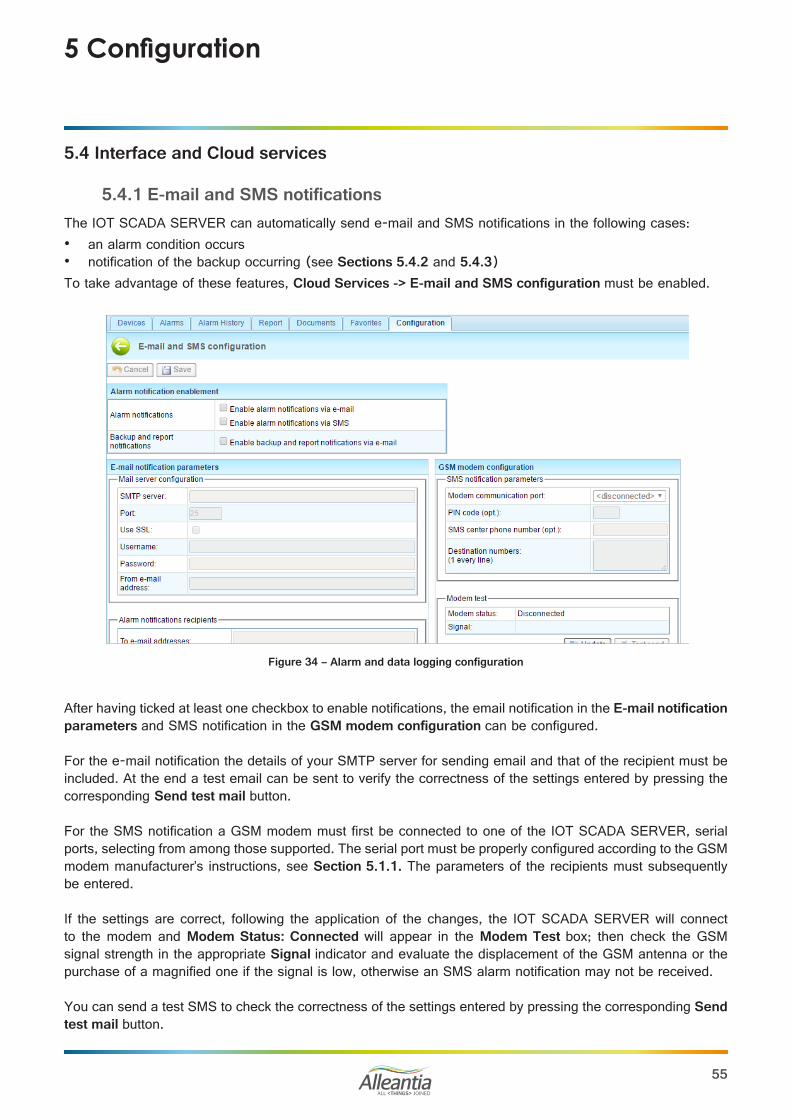
Figure 34 – Alarm and data logging configuration
After having ticked at least one checkbox to enable notifications, the email notification in the E-mail notification parameters and SMS notification in the GSM modem configuration can be configured.
For the e-mail notification the details of your SMTP server for sending email and that of the recipient must be included. At the end a test email can be sent to verify the correctness of the settings entered by pressing the corresponding Send test mail button.
For the SMS notification a GSM modem must first be connected to one of the IOT SCADA SERVER, serial ports, selecting from among those supported. The serial port must be properly configured according to the GSM modem manufacturer’s instructions, see Section 5.1.1. The parameters of the recipients must subsequently be entered.
If the settings are correct, following the application of the changes, the IOT SCADA SERVER will connect to the modem and Modem Status: Connected will appear in the Modem Test box; then check the GSM signal strength in the appropriate Signal indicator and evaluate the displacement of the GSM antenna or the purchase of a magnified one if the signal is low, otherwise an SMS alarm notification may not be received.
You can send a test SMS to check the correctness of the settings entered by pressing the corresponding Send test mail button.
The IOT SCADA SERVER can automatically send e-mail and SMS notifications in the following cases:• an alarm condition occurs • notification of the backup occurring (see Sections 5.4.2 and 5.4.3)To take advantage of these features, Cloud Services -> E-mail and SMS configuration must be enabled.

ALL <THINGS> JOINED
56
5 Configuration
An existing Dropbox account can be indicated as an additional destination for the backup files. This account can also be used to upload the documents generated by IOT SCADA SERVER on the Dropbox by pressing
the buttons in the application (for example, in energy reports). Before connecting a Dropbox account make sure internet connection is available on the device from which you are configuring.
Figure 35 - Dropbox account configuration
Go to Configuration -> Cloud Services -> Dropbox and press the Connection... button to start the connection procedure of the IOT SCADA SERVER to a Dropbox account. The popup window of Figure 36 will open.
Figure 36 - Authorization code request
5.4.2 Dropbox connection
ALL <THINGS> JOINED
57
5 Configuration
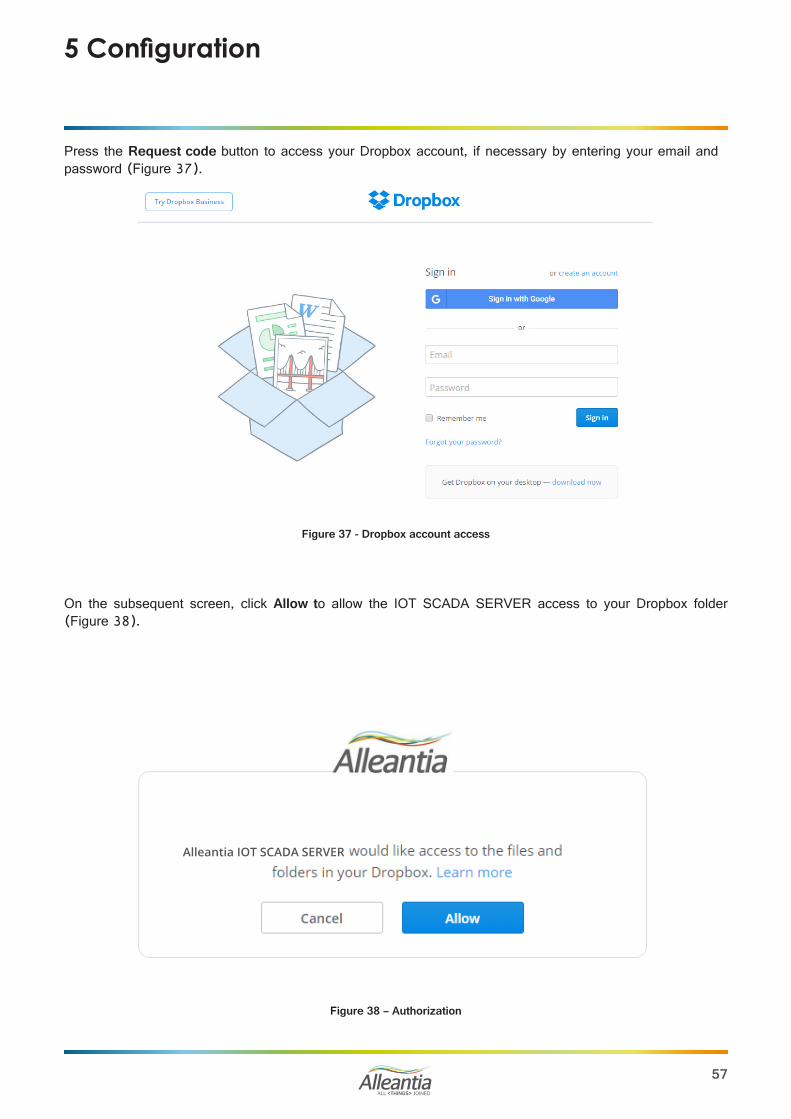
Press the Request code button to access your Dropbox account, if necessary by entering your email and password (Figure 37).
Figure 37 - Dropbox account access
On the subsequent screen, click Allow to allow the IOT SCADA SERVER access to your Dropbox folder (Figure 38).
Figure 38 – Authorization
Alleantia IOT SCADA SERVER

ALL <THINGS> JOINED
58
5 Configuration
Enter the code shown in Figure 39 in the start popup window (Figure 36).
Figure 40 - Authorization code shown in IOT SCADA SERVER
Alleantia IOT SCADA SERVER to finish the
Figure 39 – Authorization code

ALL <THINGS> JOINED
59
5 Configuration
Press Ok to end the procedure. If successful, the account appears correctly connected (Figure 41).
Figure 41 - Dropbox account connected
At this point the Send to Dropbox buttons of IOT SCADA SERVER can already be used to send documents on Dropbox. To disconnect the account in the future, simply press the Disconnect button. If you want to enable the sending of backups to Dropbox press Enable Dropbox remote backup (Figure 42) and choose a destination folder for the files by clicking on the button “...”. To test the backup feature, send a test file to the specified folder by pressing the Send button. When finished, press the Save button to save the configuration.
The backup files sent to Dropbox are not related to those of any FTP backup: in other words, complete backups of IOT SCADA SERVER will be present on both Dropbox as well as FTP.
Figure 42 - Backup parameters
ALL <THINGS> JOINED
60
5.4.3 OneDrive account
5 Configuration
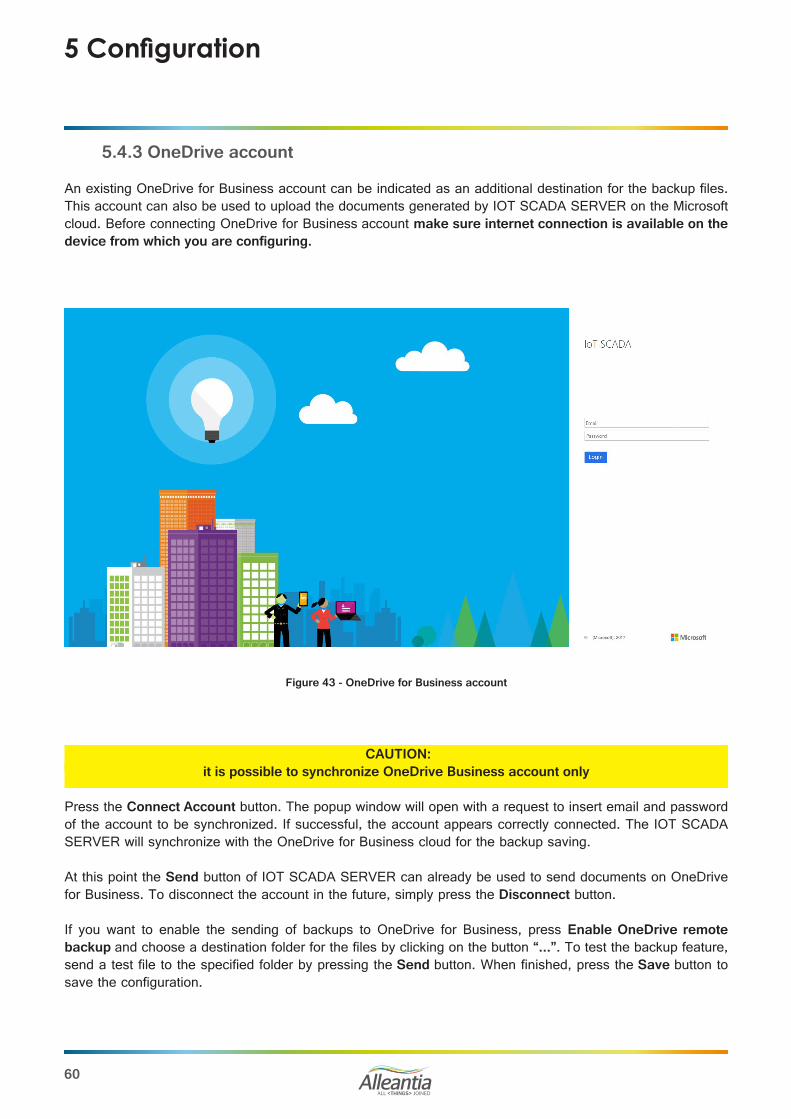
An existing OneDrive for Business account can be indicated as an additional destination for the backup files. This account can also be used to upload the documents generated by IOT SCADA SERVER on the Microsoft cloud. Before connecting OneDrive for Business account make sure internet connection is available on the device from which you are configuring.
CAUTION: it is possible to synchronize OneDrive Business account only
Press the Connect Account button. The popup window will open with a request to insert email and password of the account to be synchronized. If successful, the account appears correctly connected. The IOT SCADA SERVER will synchronize with the OneDrive for Business cloud for the backup saving.
At this point the Send button of IOT SCADA SERVER can already be used to send documents on OneDrive for Business. To disconnect the account in the future, simply press the Disconnect button.
If you want to enable the sending of backups to OneDrive for Business, press Enable OneDrive remote backup and choose a destination folder for the files by clicking on the button “...”. To test the backup feature, send a test file to the specified folder by pressing the Send button. When finished, press the Save button to save the configuration.
Figure 43 - OneDrive for Business account

ALL <THINGS> JOINED
61
5 Configuration
Figure 44 - OneDrive for Business authorization
The remote backup function to FTP provides for the creation and sending of daily backups of IOT SCADA SERVER data and the configuration on an FTP server in order to ensure recovery in case of hardware failure of the internal hard disk.
To use this function an FTP server must be available on which to make the transfer, as well as all the parameters necessary for its access, which are to be entered in the Configuration -> Cloud Services -> FTP remote backup section:
Figure 45 - FTP remote backup configuration
A test file can be sent to check the correctness of the settings entered by pressing the corresponding Backup test button.
5.4.4 FTP Backup
Microsoft OneDrive authentication successful
ALL <THINGS> JOINED
62
IOT SCADA will send 3 files every night called:backup_date_hour.zipbackup_date_hour.zip.md5backup_date_hour.zip.sigin which date represents the date, and hour the UTC time in which the backup was made such as, for example, “backup_23062017_0144.zip”.
The file with the zip extension contains the CSV file with the IOT SCADA data and an encrypted file with its configuration.
CAUTION The backup performed by this IOT SCADA SERVER feature is incremental. To rebuild the system in the event of failure all the files transferred over time are required. The remote backup can be interrupted at any time by disabling it in the dedicated configuration section. If subsequently re-enabled, it will resume
the backup of your data from where it was last interrupted.
The file with the md5 extension contains a signature with the MD5 algorithm to verify the correct transfer of the file. The file with the .sig extension contains a RSA signature to verify that the file was actually generated by an Alleantia product and has not been manipulated to alter the content.
The remote backup function is incremental in respect to the previous backup.If the previous backup is of the previous night, the zip will contain the data of a single day. If the previous backup does not exist, or it is the first run, the zip file will contain ALL the data of the system starting from the commissioning of the plant.
5.4.5 Connection with Microsoft SQL Server
5 Configuration
5.4.4.1 Details of the transferred files
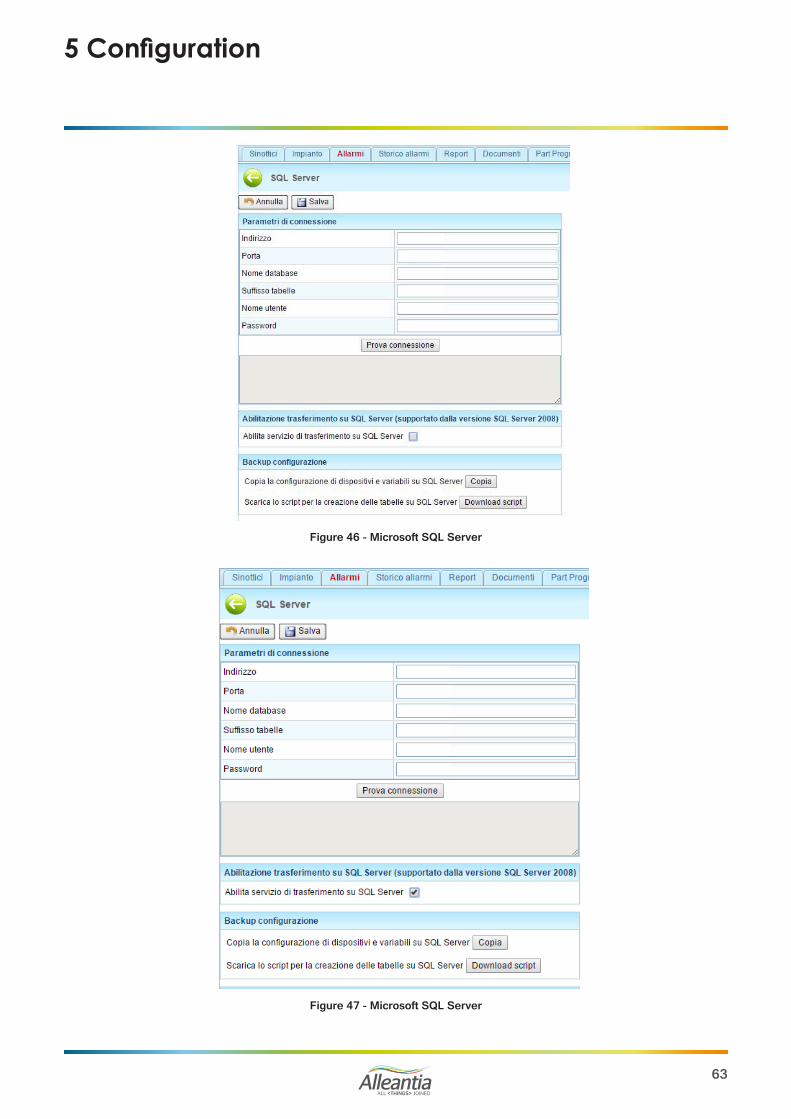
It is possible to indicate Microsoft SQL Server as a destination of all data, events and alarms collected from the IOT SCADA SERVER. First, click the Download Script button to download the sql script, then carry it out on the machine with Microsoft SQL Server to create the database tables, where the IOT SCADA SERVER data will be downloaded.
After, the connection parameters will be inserted in database in the configuration panel. You can test the correct configuration, clicking the Connection test button.
If everything works correctly, click the Save button to save the configuration.
From this moment on, the IOT SCADA SERVER will download its data in configured database. The refresh rate can be changed from interface.
ALL <THINGS> JOINED
63
Figure 46 - Microsoft SQL Server
Figure 47 - Microsoft SQL Server
5 Configuration
ALL <THINGS> JOINED
64
5 Configuration
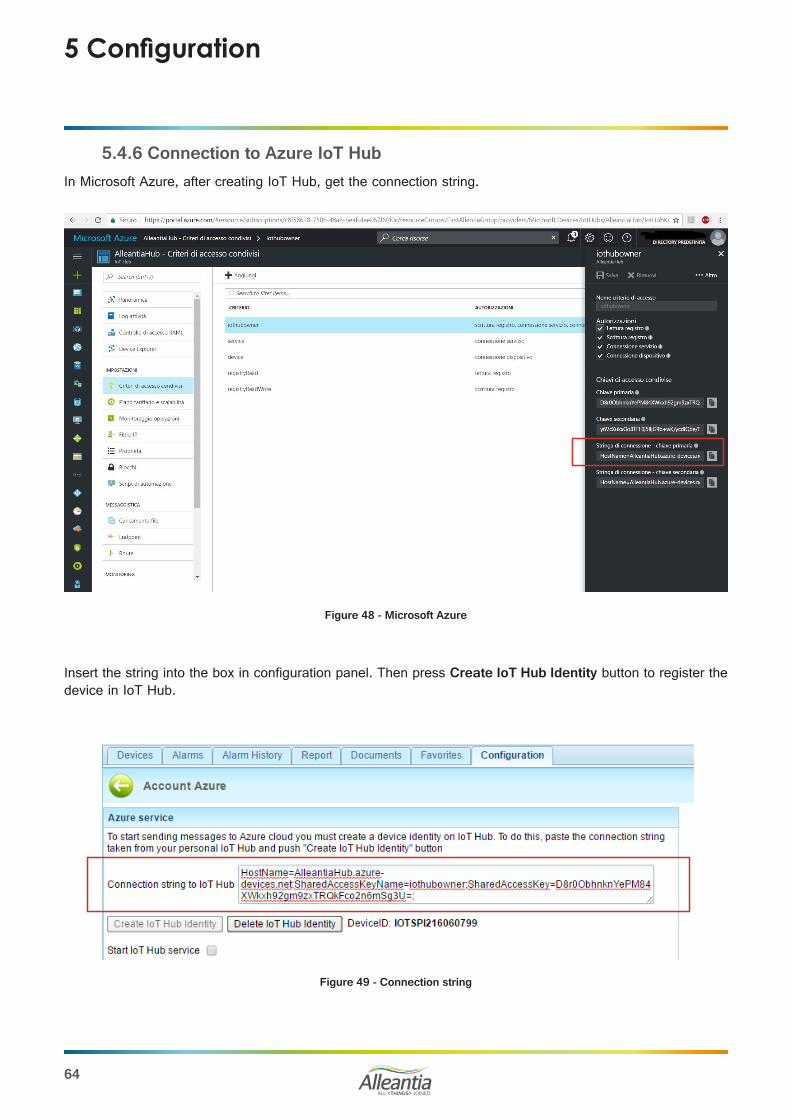
In Microsoft Azure, after creating IoT Hub, get the connection string.
5.4.6 Connection to Azure IoT Hub
Figure 48 - Microsoft Azure
Figure 49 - Connection string
Insert the string into the box in configuration panel. Then press Create IoT Hub Identity button to register the device in IoT Hub.
ALL <THINGS> JOINED
65
5 Configuration
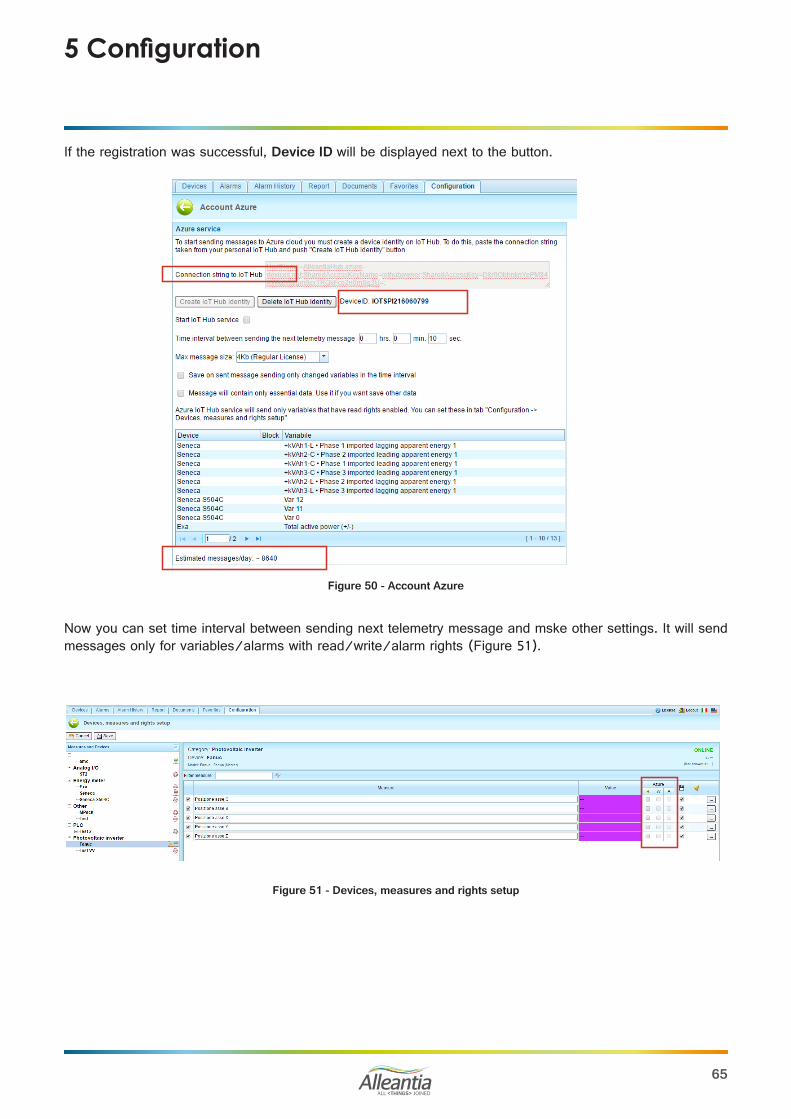
Figure 51 - Devices, measures and rights setup
Figure 50 - Account Azure
Now you can set time interval between sending next telemetry message and mske other settings. It will send messages only for variables/alarms with read/write/alarm rights (Figure 51).
If the registration was successful, Device ID will be displayed next to the button.

ALL <THINGS> JOINED
66
5 Configuration
In Section Information you can find information about the system and change such its data as licence and device catalogue.
5.5 Information
5.5.1 Device catalogue
Every IOT SCADA SERVER system is released with database of connected devices with default configurations. This may contain not all the devices of the Alleantia’s Library of Things, which is continuously updated and is available here http://cloud.alleantia.com/info/products.zul. Therefore you can download one or more .xmod files of devices configuration and upload it in the used IOT SCADA SERVER system, using the functionality of this section. The user can, in the same way, insert in the system ad hoc configured devices (e.g. PLC) using the Alleantia’s tool http://cloud.alleantia.com/xmod/convert.zul which creates an .xmod file for every device.In section Information -> Device catalogue a window with the existing library of devices will open.
Figure 52 - Synoptics measures configuration
Figure 53 - Custom alarms
You can set these rights in Devices, measures and rights setup, Synoptics measures configuration and Custom alarms sections. Write permission can be enabled only for measures which can be modified from outside. The alarms’ permissions (A) can be enabled only for measures defined as an alarm in Xmod driver.
Finally, check the checkbox Start IoT Hub service to activate. Depending on the selected options, estimated messages sent per day will be shown (Figure 52).
The service uses MQTT v3.1.1., to run this protocol the 8883 port or web socket of 443 port are needed. Make sure that these ports are open.
ALL <THINGS> JOINED
67
5 Configuration
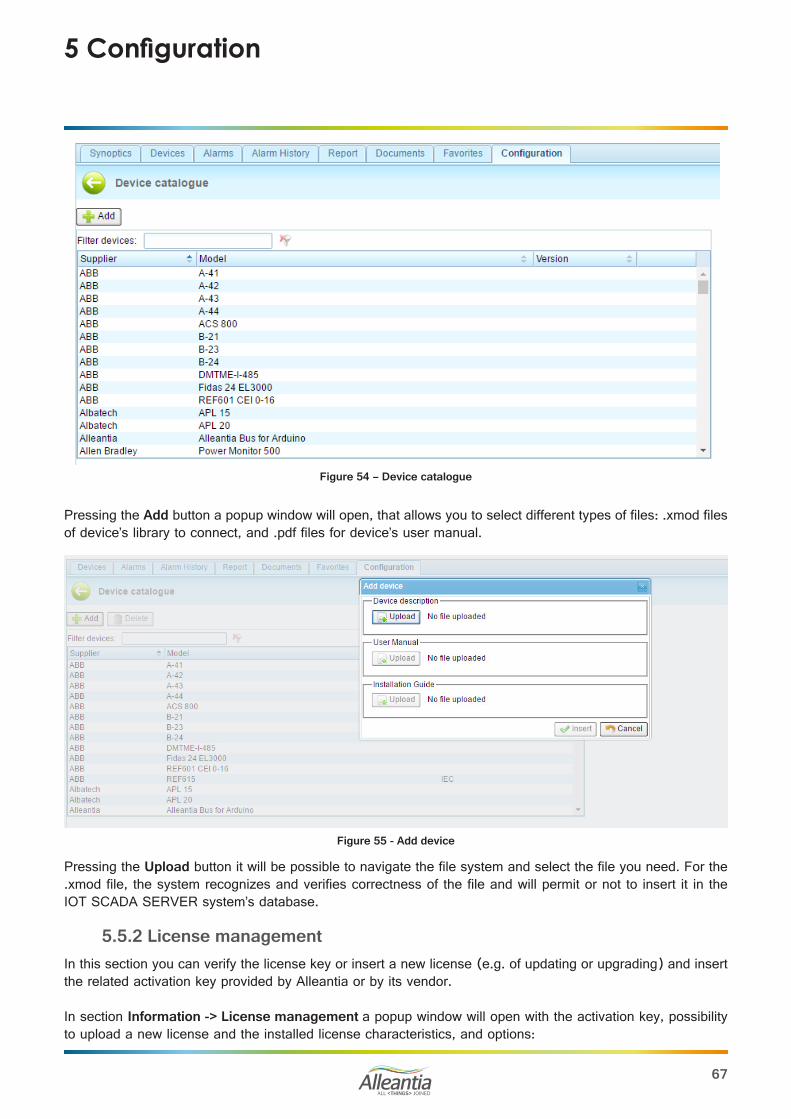
Figure 54 – Device catalogue
Pressing the Add button a popup window will open, that allows you to select different types of files: .xmod files of device’s library to connect, and .pdf files for device’s user manual.
Figure 55 - Add device
Pressing the Upload button it will be possible to navigate the file system and select the file you need. For the .xmod file, the system recognizes and verifies correctness of the file and will permit or not to insert it in the IOT SCADA SERVER system’s database.
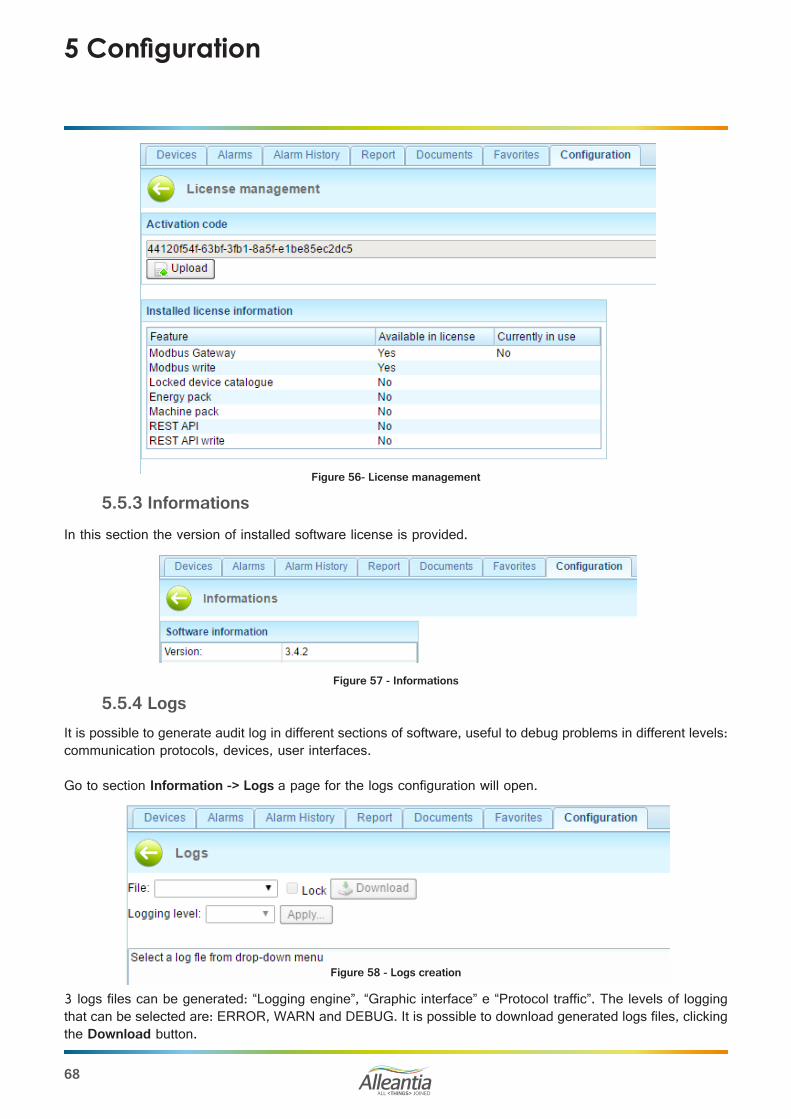
5.5.2 License managementIn this section you can verify the license key or insert a new license (e.g. of updating or upgrading) and insert the related activation key provided by Alleantia or by its vendor.
In section Information -> License management a popup window will open with the activation key, possibility to upload a new license and the installed license characteristics, and options:
ALL <THINGS> JOINED
68
5 Configuration
Figure 57 - Informations
5.5.3 InformationsIn this section the version of installed software license is provided.
3 logs files can be generated: “Logging engine”, “Graphic interface” e “Protocol traffic”. The levels of logging that can be selected are: ERROR, WARN and DEBUG. It is possible to download generated logs files, clicking the Download button.
5.5.4 LogsIt is possible to generate audit log in different sections of software, useful to debug problems in different levels: communication protocols, devices, user interfaces.
Go to section Information -> Logs a page for the logs configuration will open.
Figure 56- License management
Figure 58 - Logs creation
ALL <THINGS> JOINED
69
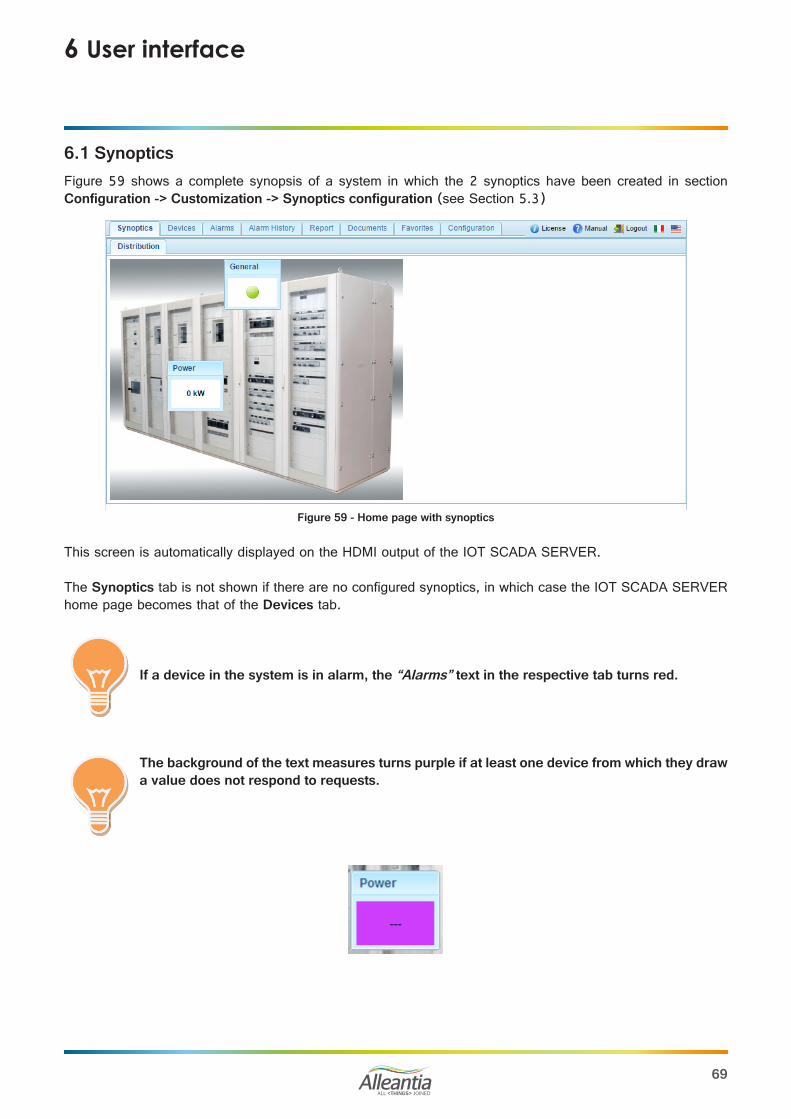
This screen is automatically displayed on the HDMI output of the IOT SCADA SERVER.
The Synoptics tab is not shown if there are no configured synoptics, in which case the IOT SCADA SERVER home page becomes that of the Devices tab.
If a device in the system is in alarm, the “Alarms” text in the respective tab turns red.
The background of the text measures turns purple if at least one device from which they draw a value does not respond to requests.
6 User interface
Figure 59 - Home page with synoptics
6.1 SynopticsFigure 59 shows a complete synopsis of a system in which the 2 synoptics have been created in section Configuration -> Customization -> Synoptics configuration (see Section 5.3)
ALL <THINGS> JOINED
70
6 User interface
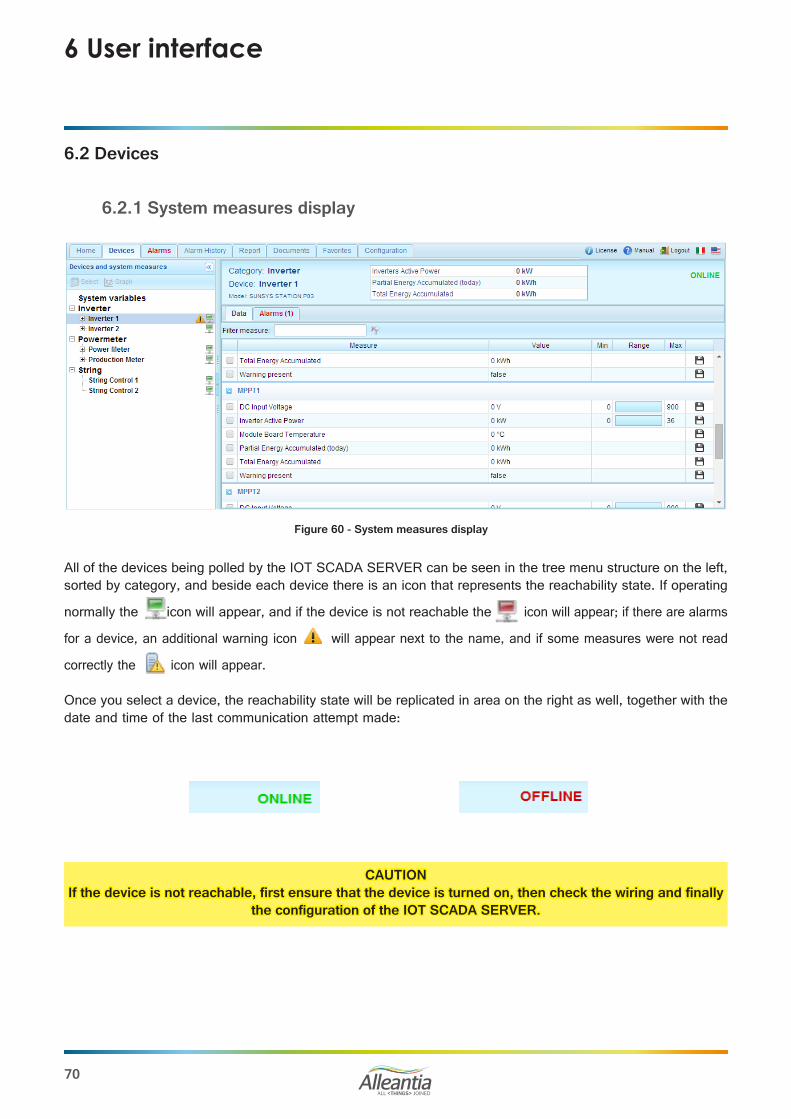
Figure 60 - System measures display
All of the devices being polled by the IOT SCADA SERVER can be seen in the tree menu structure on the left, sorted by category, and beside each device there is an icon that represents the reachability state. If operating
normally the icon will appear, and if the device is not reachable the icon will appear; if there are alarms
for a device, an additional warning icon will appear next to the name, and if some measures were not read
correctly the icon will appear.
Once you select a device, the reachability state will be replicated in area on the right as well, together with the date and time of the last communication attempt made:
CAUTIONIf the device is not reachable, first ensure that the device is turned on, then check the wiring and finally
the configuration of the IOT SCADA SERVER.
6.2 Devices
6.2.1 System measures display
ALL <THINGS> JOINED
71
6 User interface
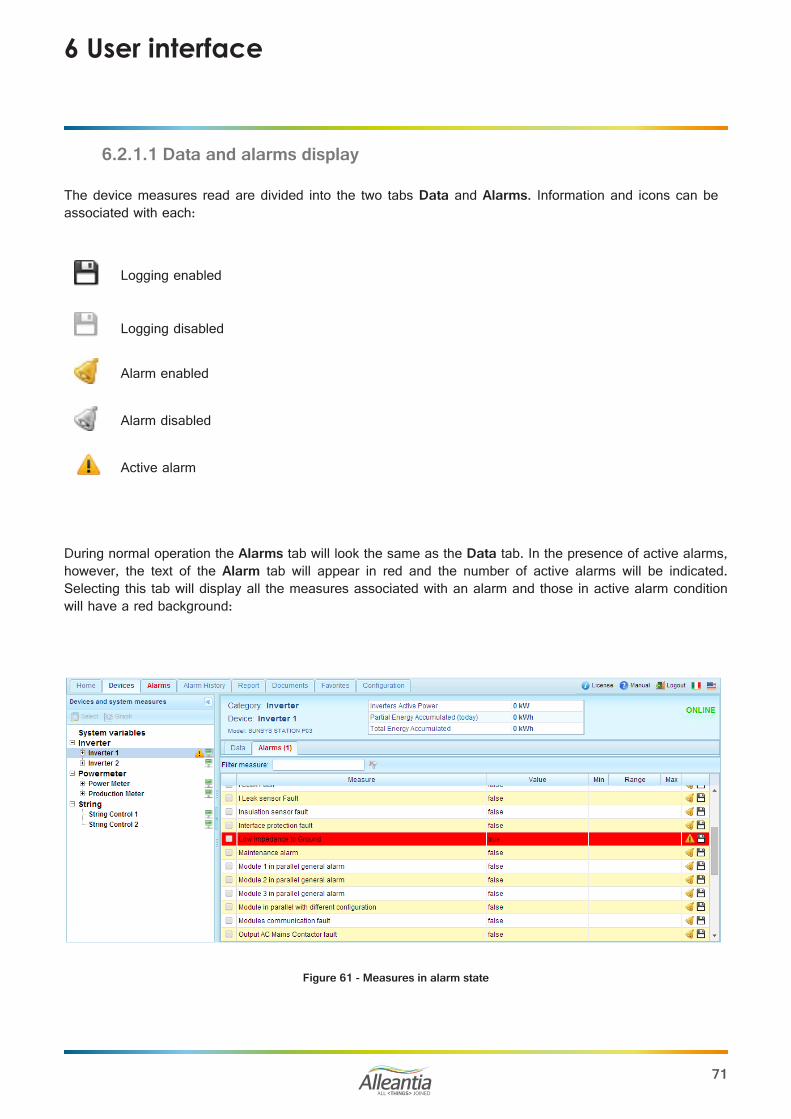
The device measures read are divided into the two tabs Data and Alarms. Information and icons can be associated with each:
Logging enabled
Logging disabled
Alarm enabled
Alarm disabled
Active alarm
During normal operation the Alarms tab will look the same as the Data tab. In the presence of active alarms, however, the text of the Alarm tab will appear in red and the number of active alarms will be indicated. Selecting this tab will display all the measures associated with an alarm and those in active alarm condition will have a red background:
Figure 61 - Measures in alarm state
6.2.1.1 Data and alarms display
ALL <THINGS> JOINED
72
6 User interface
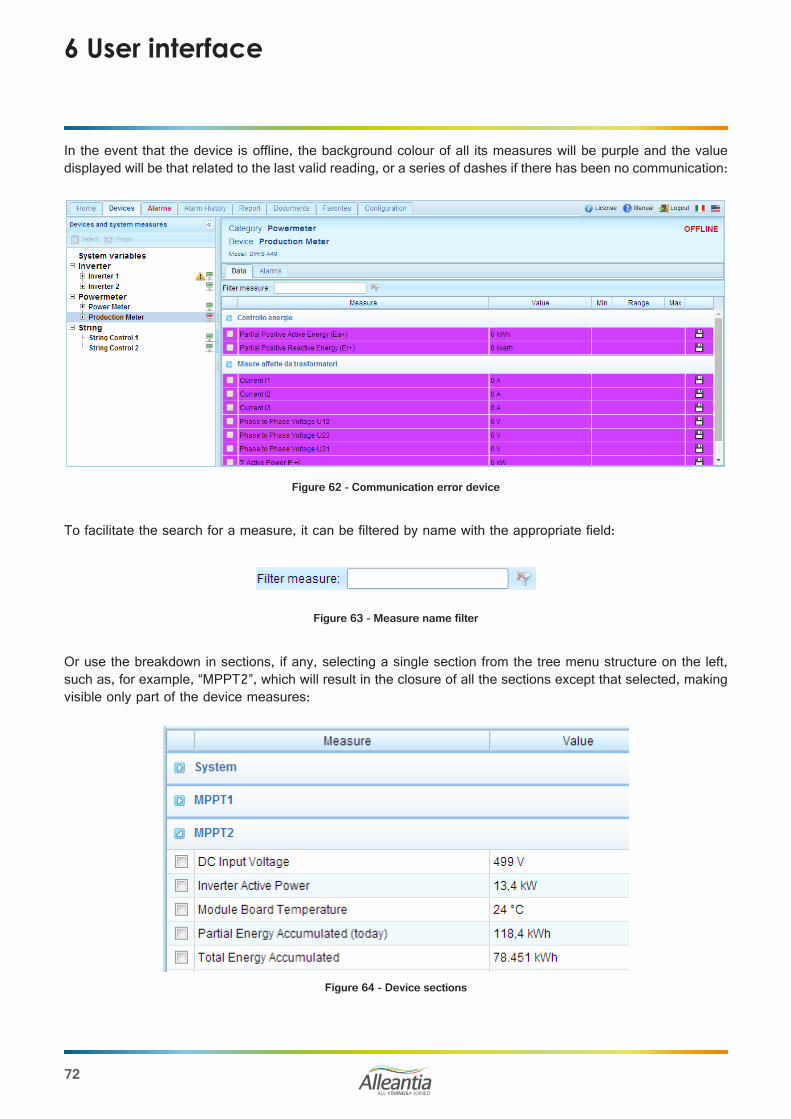
In the event that the device is offline, the background colour of all its measures will be purple and the value displayed will be that related to the last valid reading, or a series of dashes if there has been no communication:
Figure 62 - Communication error device
To facilitate the search for a measure, it can be filtered by name with the appropriate field:
Or use the breakdown in sections, if any, selecting a single section from the tree menu structure on the left, such as, for example, “MPPT2”, which will result in the closure of all the sections except that selected, making visible only part of the device measures:
Figure 64 - Device sections
Figure 63 - Measure name filter
ALL <THINGS> JOINED
73
6 User interface
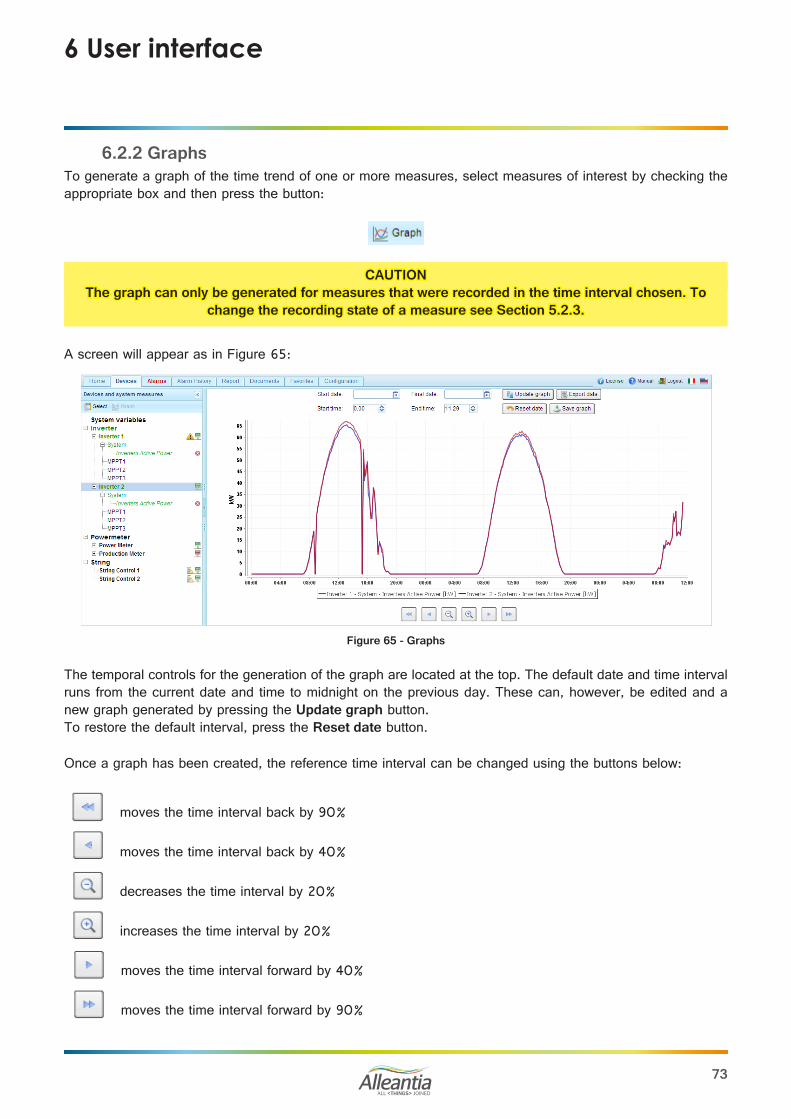
Figure 65 - Graphs
The temporal controls for the generation of the graph are located at the top. The default date and time interval runs from the current date and time to midnight on the previous day. These can, however, be edited and a new graph generated by pressing the Update graph button.To restore the default interval, press the Reset date button.
Once a graph has been created, the reference time interval can be changed using the buttons below:
moves the time interval back by 90%
moves the time interval back by 40%
decreases the time interval by 20%
increases the time interval by 20%
moves the time interval forward by 40%
moves the time interval forward by 90%
6.2.2 GraphsTo generate a graph of the time trend of one or more measures, select measures of interest by checking the appropriate box and then press the button:
CAUTION The graph can only be generated for measures that were recorded in the time interval chosen. To
change the recording state of a measure see Section 5.2.3.
A screen will appear as in Figure 65:

ALL <THINGS> JOINED
74
6 User interface
The graph is automatically regenerated after pressing one of these buttons.
To change the selection of the measures to be plotted, return to the system and device measures display screen by pressing the button:
Select or clear the measure by using the check box again.The measures currently selected are listed in the tree menu structure on the left. These can also be removed by pressing the icon:
6.2.3 Measure write
Some measures can be written, therefore it is possible to insert value to write into measure. To do it you should be authorized by logging in with user/password: go to section Configuration, login, and return to section Devices. Select a device to open the measures list. The writeable ones can be identified by the presence of a button on the row, see figure below.
Pressing the button a popup window will open that allows to insert new value.
Writing is carried out in few seconds and while waiting the selected measure’s line turns orange, keeping the old value.

ALL <THINGS> JOINED
75
6 User interface
Figure 66 - Active alarms
If there is no alarm the message No active alarm will be displayed. If alarms are present, the text in the Alarms tab will be red, even when the tab is not open.
Custom alarms are also reported in this section.
6.2.4 Exporting data to ExcelOnce a graph has been generated, the data can be exported in Excel format by pressing the button:
You will be prompted to save the dataExport.xlsx file containing ALL of the values recorded by IOT SCADA SERVER for the measures that are currently selected within the selected time interval in Excel 2007 format. N.B. Excel 2007 limits the number of rows in an Excel spreadsheet to 65536. If the number of data exported is greater, the “excess” data will be automatically deleted.
6.3 AlarmsThe current active alarms on all devices to which the IOT SCADA SERVER is connected can be viewed in the Alarms section. The list is sorted by date and time, but the order in any column can be changed by clicking on the corresponding heading.
Once writing is complete, the line turns white again and the value is updated.

ALL <THINGS> JOINED
76
6 User interface
Figure 67 - Alarm history per event
The list is sorted by date and time in descending order and the alarms displayed can be filtered based on a date interval to be specified in the Date Filter fields, and on the type of alarm, to be specified in the Alarm type filter box. Thereafter the alarm corresponding to the filters set will be displayed by clicking on the Update button.
There are 3 types of alarms in IOT SCADA:• Measure alarms
o These are default alarms set on catalogue device measures, or defined by the user as shown in Section 5.3.3.
• Device alarmso These are generated when a device does not respond to requests and becomes offline
• System alarmso These are generated by multiple abnormal situations, such as a backup failure, an improper shutdown of the IOT SCADA SERVER, an error while sending a notification, etc.
In Figure 67, Per event selected in the Data sorting box, the alarm ON and the corresponding OFF alarm, if any, are grouped together in the same row, thereby facilitating the relationship between alarm events.If it is not possible to display all the alarms on the same page, the list can be scrolled by means of the page navigation controls at the bottom.If the alarm notification has been configured (see Section 5.4.1), there is a button at the end of each row. If this is pressed, a popup window as in Figure 68 will be displayed, with details on the forwarding of the notification.
Figure 68 - Notification details
6.4 Alarms historyTo display a history of the alarms that were triggered in the devices connected to IOT SCADA SERVER enter the Alarm history section. If alarms are present, the screen that appears is like that in Figure 67:

ALL <THINGS> JOINED
77
6 User interface
The alarm history can also be viewed by sorting the data in a chronological manner (i.e. selecting the option Chronology in which the alarms are presented in the reverse order in which they occurred, that is with the most recent at the top of the list together with the information about the state of the alarm ON (device in alarm) separate from that of the alarm OFF status (device alarm over), as in Figure 69:
Figure 69 - Chronological alarms history
Figure 70 - Types of report
6.5 ReportIn the Report section of the main menu it is possible to choose the type of report to generate:

ALL <THINGS> JOINED
78
6 User interface
Energy reports can be generated (growing monotonic measures), enabling the daily or monthly progress of the energy measures to be analysed in different ways:• the single measure energy report represents the simplest type of energy reports focusing the analysis on a
single energy measure. This is the most compact of the various reports as it is composed of a single page with a bar graph and data table.
• the energy report “comparison between measures” highlights the differences between energy measures over the same period of time. This is useful in comparing energy production and consumption in a system, as well as for discovering any inefficiencies in devices regarded as similar (e.g. different production by inverter of the same model connected to the same number of strings). This contains a line graph and one or more data comparison tables between different measures.
• the energy report “comparison between periods” analyses the performance of one energy measure over several days or several months. It enables, for example, the comparison between the energy produced in July 2016 with that produced in the same month of 2017. It contains a line graph and one or more data comparison tables between different periods.
The measures and the periods over which the analysis is to be performed must be defined in each of these reports by filling in a special form of input parameters.
Figure 71 - Input parameters form for the single measure report
If the report is a comparison of several measures, then more than one measure can be chosen. Similarly, for the comparison report between several periods more than one period can be chosen.
Figure 72 – Choice of multiple measures for the comparison report between different measures
Figure 73 – Choice of multiple periods for the comparison report between different measures
After filling in the parameter input form, a preview of the report can be generated by pressing the Generate button. A few moments later a popup window will open displaying the generated document consisting of a graph and one or more tables; at the bottom of the popup window there are buttons that are used to save or forward the report displayed via email. The email forwarding occurs after the recipients of the mail have been entered in the appropriate popup window that appears after the Send button is pressed. To use this feature the notification parameters must be configured, as described in Section 5.4.1.

ALL <THINGS> JOINED
79
6 User interface
Figure 74 - Single measure energy report
6.6 Documents
Figure 75 - System documents
For convenience, documents that are deemed useful to the system being monitored, such as wiring diagrams or other, can be loaded in IOT SCADA SERVER.
A popup window, as shown in Figure 75, opens when the Add button is pressed. Thereafter the Upload button must be pressed and the document to be loaded chosen. A description, such as System Wiring must be entered and subsequently the Ok button pressed.
You must be logged in to delete a document, in which case the Delete button next to each document will appear.
Figure 76 - Document upload

ALL <THINGS> JOINED
80
6 User interface
6.7 Favourites
Figure 77 - Favourite addresses
Favourites, that is addresses of IP cameras present in the system or of other sites that are of interest, can be entered in the IOT SCADA SERVER configuration.
By pressing the Add button a popup window opens as shown in Figure 77. A name must be entered to help understanding, such as System cameras, the address itself, and then the Ok button must be pressed.
You must be logged in to delete a favourite, in which case the Delete button next to each document will appear.
Figure 78 - Favourite addresses insertion
This will open in a new browser window when clicking on the address.
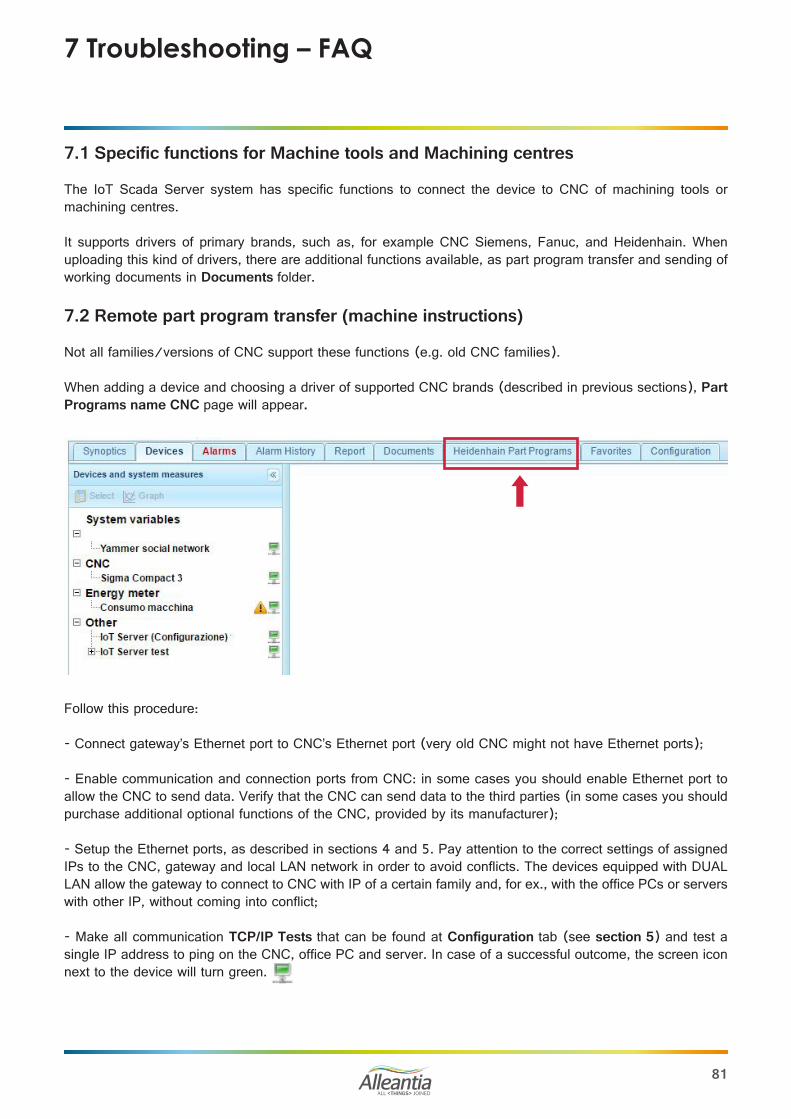
ALL <THINGS> JOINED
81
7.1 Specific functions for Machine tools and Machining centres
The IoT Scada Server system has specific functions to connect the device to CNC of machining tools or machining centres.
It supports drivers of primary brands, such as, for example CNC Siemens, Fanuc, and Heidenhain. When uploading this kind of drivers, there are additional functions available, as part program transfer and sending of working documents in Documents folder.
7.2 Remote part program transfer (machine instructions)
Not all families/versions of CNC support these functions (e.g. old CNC families).
When adding a device and choosing a driver of supported CNC brands (described in previous sections), Part Programs name CNC page will appear.
Follow this procedure:
- Connect gateway’s Ethernet port to CNC’s Ethernet port (very old CNC might not have Ethernet ports);
- Enable communication and connection ports from CNC: in some cases you should enable Ethernet port to allow the CNC to send data. Verify that the CNC can send data to the third parties (in some cases you should purchase additional optional functions of the CNC, provided by its manufacturer);
- Setup the Ethernet ports, as described in sections 4 and 5. Pay attention to the correct settings of assigned IPs to the CNC, gateway and local LAN network in order to avoid conflicts. The devices equipped with DUAL LAN allow the gateway to connect to CNC with IP of a certain family and, for ex., with the office PCs or servers with other IP, without coming into conflict;
- Make all communication TCP/IP Tests that can be found at Configuration tab (see section 5) and test a single IP address to ping on the CNC, office PC and server. In case of a successful outcome, the screen icon next to the device will turn green.
7 Troubleshooting – FAQ

ALL <THINGS> JOINED
82
In case of communication problems the screen icon will turn red . If the communication test succeeds but the icon remains red or the CNC icon remains red, it means that you should enable CNC’s ports.
- After setting up the connections and the communication ports, click Part Programs. The screen as in figure below will appear.
7 Troubleshooting – FAQ

ALL <THINGS> JOINED
83
In the box you will see all part programs on the monitored machine’s PLC.
Then you can download and upload the part program files (machine instructions).
So it will be possible to send the instructions directly from a PC to the machine and transfer new part program.
- Click Upload, in the popup window select the file from your PC (as shown in the figure below) and click Open. The system in few seconds will transfer it to the machine’s CNC, at any distance it is. In this example TEK1 part program was used.
- Click Open, wait for a few seconds.
- When the system has finished the file transfer (it depends on the file dimension and the kind of connection), you can check the transfer: click F5 button to refresh the web page and scroll the list of part programs on the CNC. You will see TEK1 file in the list: the file transfer was successful.
7 Troubleshooting – FAQ

ALL <THINGS> JOINED
84
On-board controller can start the program or work.
The purpose of this function is to organize/program all sequences of working that the machine performs, to organize and plan the production, etc.
CAUTION:If you are accidentally trying to transfer remotely a part program to the CNC, which is already on
the machine, the operation will not have success, as the files are protected from being overwritten remotely. Rename the file, adding revision (TEK1rev, TEK1r1 and so on).
CAUTION:The files that start with “O” cannot be downloaded and managed remotely, for security reasons.
Rename the file (add another letter in the beginning).
- To download a part program from the machine’s CNC (for ex., to modify the instructions remotely), select the file and click Download.
Choose the folder to save the file.
The file WILL NOT BE DELETED from the CNC. For security reasons, when working nothing is modified or overwritten.
After that, on the on-board CNC screen you can easily check that the file has not been removed or modified.
CAUTION:In some cases in might happen that, after selecting the part program to download, clicking the
“Download” button, Google Chrome is set by default to download files in “Downloads” folder (see figure below).
7 Troubleshooting – FAQ

ALL <THINGS> JOINED
85
To change the folder, go to Google Chrome settings, check Ask where to save each file before downloadingbox.
7 Troubleshooting – FAQ

ALL <THINGS> JOINED
86
7.3 IOT SCADA SERVER does not switch onFor the Base and UPS models (code IxS_1y1), check there is 12 V direct current on jack with terminal positive on DC+ and negative on DC-. If voltage is over or below 12 V, change power supply or, if possible, adjust output voltage of existing one.For the Multi and Multi+UPS models (code IxS_1y2, IxS_1y3), check there is between 12 V and 24 V direct current or between 15 V and 26 V alternating current on terminal DC+ and DC-. If the measured voltage is not comprised in the specified intervals, change power supply or, if possible, adjust output voltage of existing one.
7.4 Unable to complete Internet communication testVerify that the Ethernet or Wi-Fi connections have been made correctly and check activity state of LED LAN or Wi-Fi on the IOT SCADA SERVER (Section 2.3.1) and the switch/router. If the IP address has been manually configured, verify the parameter configuration with your network administrator or with the router.
7.5 Communication problems with serial devicesIn the event of communication problems with serial devices, refer to the troubleshooting guide in the section Configuration -> Installation -> Devices configuration that can be downloaded by pressing the button:
7.6 Unable to access IOT SCADA SERVER from the local networkCheck that the IP address and subnet mask of the device from which you want to reach IOT SCADA SERVER are compatible with the IP address and the subnet mask of the IOT SCADA SERVER itself (see Sections 4.4 e 5.1)
7.7 Unable to access IOT SCADA SERVER from the InternetCheck that “NAT” has been configured on the local router on port 80 of the IP address of the IOT SCADA SERVER.In the event that you are trying to access the IOT SCADA SERVER through a name, and not through an IP address (e.g. mymachine.no-ip.org), check the DDNS configuration of the router.
7.8 Auto start of the IOT SCADA system and the gateway at power-up of the machine
In order to allow the auto start when power up from the network when it is installed in machine or electric board, follow the procedure:
- Switch on the PC and press F2 several times, BIOS grey screen will appear- Click Power management > AC recovery > Select Power on- Click Apply- Check the Save as custom user settings box > Click Ok > Exit
This procedure diables the gateway’s power button.For the IOT SCADA auto start see paragraph 4.1.
7 Troubleshooting – FAQ

ALL <THINGS> JOINED
87
To automatically activate the access point every time the gateway is powered up: access the IOT SCADA from a PC, laptop, tablet or smartphone, when in coverage of your gateway (see section 4 for the connection via Wi-Fi to the software).
This procedure can be activated only on the gateways with the appropriate hardware characteristics (if there is Wi/Fi card, possibility to set it up correctly, etc.).
This test has been done on Advantech UTX-3115.
1. Download Tool Connectify Hotspot 2017 (there is also a free version).
2. The Lite license has the following options: - the system generates “Connectify-me” hotspot - the hotspot password can be modified 3. In “Internet to share” section select Wi-Fi card. In our case (Advantech UTX-3115) it is “Realtek PCIe GBE Family Controller”.
4. This tool can be set to start automatically along with Windows: go to Settings section in the upper right corner, click Startup Options, check Start interface on login. Select Always in Resume hotspot on boot-up.
5. Return to the beginning and check Start hotspot box to switch it on.
NOTE: these 5 steps should be done only once, during the device setup. Then the program will do it automatically.
The password can be modified.
Now you can use Wi-Fi:a. Open IoTSCADA web interface.b. Go to Configuration tab and log in:
username: admin password: webloggerSU
c. Click “TCP/IP configuration”d. Select “Microsoft Wi-Fi Direct Virtual Adapter #2”e. In the browser address bar copy 192.168.XXX.X IP address, shown in the table to access the IoTSCADA web interface from a mobile device, connected to “Connectify-me” Wi-Fi network.
7.9 System hotspot activation
7 Troubleshooting – FAQ

ALL <THINGS> JOINED
88
8 Contacts
Alleantia s.r.l.
www.alleantia.com
Registered offices: Via Tosco Romagnola, 136 56025 Pontedera (PI)Operating headquarters: Via Umberto Forti, 24/14 56121 PisaVAT code/Tax code: IT 02011550502

ALL <THINGS> JOINED

Alleantia s.r.l.www.alleantia.com
Registered offices: Via Tosco Romagnola, 136 - 56025 Pontedera (PI)Operating headquarters: Via Umberto Forti, 24/14 56121 Pisa
VAT code/Tax code: IT 02011550502
Tel: (+39) 050 9911933Fax: (+39) 050 9655139
@: [email protected] M-IS
C-0
617-
EN