iowa advanced practice nurse tracking system
TRANSCRIPT

IOWA ADVANCED PRACTICE NURSE TRACKING SYSTEM
ADVISORY COMMITTEE MEETINGMarch 4, 2019

Meeting Agenda & Participant List

Iowa Advanced Practice Nurse Tracking SystemAdvisory Committee Meeting
Monday March 4, 201910:00 A.M. – 12:00 P.M.
Carver College of Medicine 100 CMAB
Agenda
Welcome and Introductions
Meeting Agenda and Participant List 2017 Annual Report Geographic Distribution Access Summary Trends Workforce Summary
Open Discussion Items

Iowa Advanced Practice Nurse Tracking SystemAdvisory Committee Meeting
Monday, March 1, 201910:00 A.M. – 12:00 P.M.
Advisory Committee
Lorinda Inman, MSN, RNChair, Iowa Nurses FoundationIowa Nurses Association
Diana L. Huber, PHD, RN, FAAN, NEA-BCAssociate ProfessorUniversity of Iowa College of Nursing
Kathy Weinberg, MSN, RNExecutive DirectorIowa Board of Nursing
Jimmy Reyes, DNP, AGNP, RNAssociate Director of Practice and EducationIowa Board of Nursing
Laura Hudson, MSN, RNAssociate Director, CE/WorkforceIowa Board of Nursing
Kendra Williams-Perez, EdD, RN, CNEProfessor and DeanAllen College of Nursing

Iowa Advanced Practice Nurse Tracking SystemAdvisory Committee Meeting
Monday, March 4, 201910:00 A.M. – 12:00 P.M.
Iowa Health Professions Tracking Center
Greg NelsonAssistant Dean for Clinical Education Programs
Theresa DunkinProgram Manager/Assistant Director
Nibras ElnourData Analyst/Assistant Manager
Linda ThiesenData Analyst/Assistant Manager
Francisco OlaldeData Analyst/Assistant Manager
Annual Benchmarks

IOWA APNs Annual Workforce Report*
K:\DOCUMENT\NP\YearEnd\2017Yearend\Graphics\np100.ppt
Date APNs• December 2017 2326• January 2017 2180
Gain + 146
Source: Iowa Health Professions Tracking Center, Office of Statewide Clinical Education ProgramsUI Carver College of Medicine, April 2018
* For year ending 12-31-2017
1
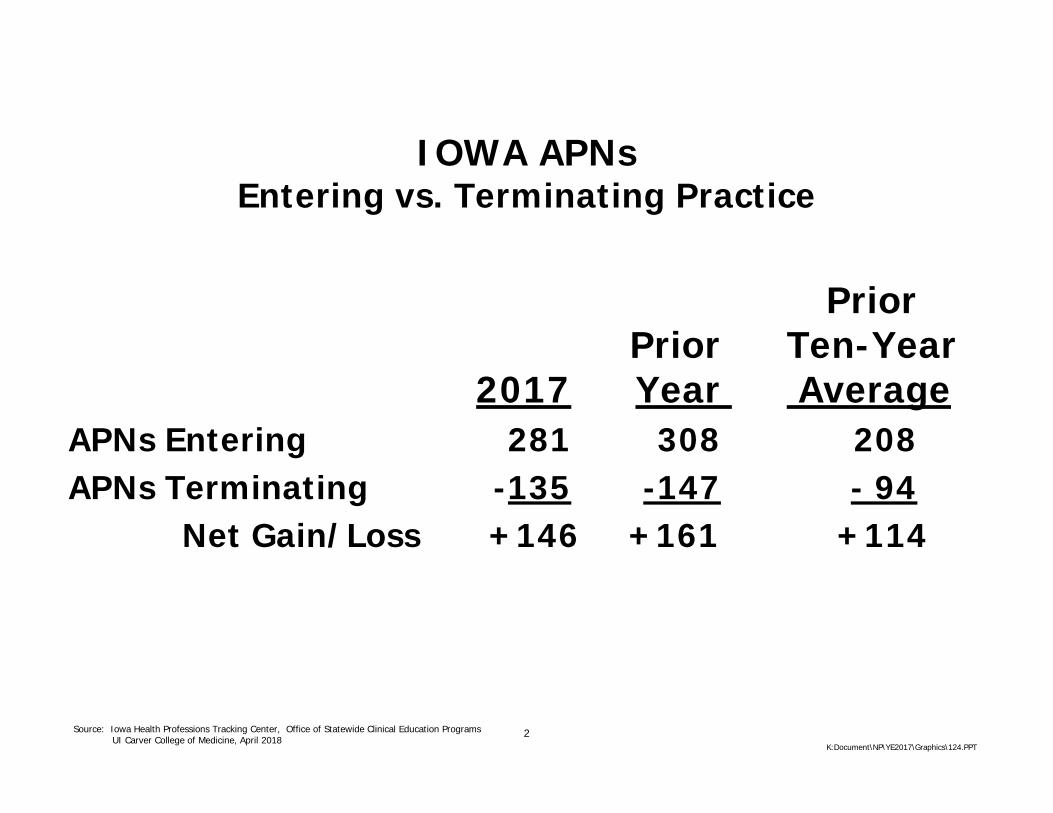
IOWA APNs Entering vs. Terminating Practice
PriorPrior Ten-Year
2017 Year AverageAPNs Entering 281 308 208APNs Terminating -135 -147 - 94
Net Gain/Loss +146 +161 +114
K:Document\NP\YE2017\Graphics\124.PPT
Source: Iowa Health Professions Tracking Center, Office of Statewide Clinical Education ProgramsUI Carver College of Medicine, April 2018
2

IOWA APNs Gender Distribution
2017
Male12%
Female88%
Source: Iowa Health Professions Tracking Center, Office of Statewide Clinical Education ProgramsUI Carver College of Medicine, April 2018 K:\DOC\NP\YE\2017\Graphics\NP104.PPT
• Female 2049• Male 277
Total 2326
3
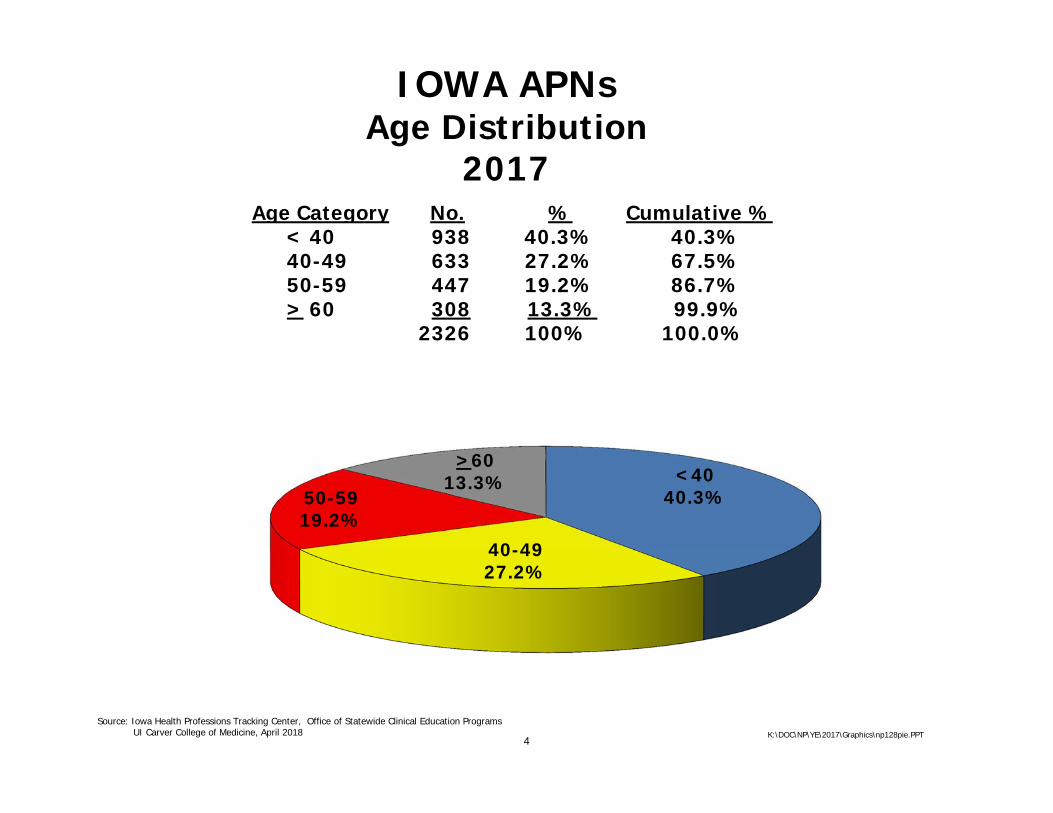
IOWA APNsAge Distribution
2017
<4040.3%
40-4927.2%
50-5919.2%
>6013.3%
Age Category No. % Cumulative %< 40 938 40.3% 40.3%40-49 633 27.2% 67.5%50-59 447 19.2% 86.7%> 60 308 13.3% 99.9%
2326 100% 100.0%
K:\DOC\NP\YE\2017\Graphics\np128pie.PPT
Source: Iowa Health Professions Tracking Center, Office of Statewide Clinical Education Programs UI Carver College of Medicine, April 2018
4

IOWA APNsFull Time vs. Part Time*
2017
APNs Percent
Full Time 2189 94%
Part Time 137 6%Total 2326 100%
Source: Iowa Health Professions Tracking Center, Office of Statewide Clinical Education ProgramsUI Carver College of Medicine, April 2018
K:/DOC/NP/YE/2017/Graphics/FTE-164.PPT
*PT = < 32 hours/week
5

IOWA APNsAge Distribution
Full Time vs. Part Time2017
Age FT % PT % Cumulative %
< 40 904 38.9 34 1.5 40.4
40-49 597 25.7 36 1.5 67.6
50-59 416 17.9 31 1.3 86.8
> 60 272 11.7 36 1.5 100%
2189 94.2 137 5.8
FT = > 32
PT = < 32
Source: University of Iowa Health Professions Tracking Center, Office of Statewide Clinical Education Programs,UI Carver College of Medicine, April 2018
NP\YE2017\Graphics\FTvPTage.PPT
6

IOWA APNs Detail of Age > 50
2017
0102030405060708090
100
50 51 52 53 54 55 56 57 58 59 60 61 62 63 64 65 66 67 68 69 70 71 72 73 74 75 76 77 78# in Iowa 39 32 46 38 58 55 40 60 43 36 40 49 40 37 36 25 21 15 14 10 8 5 2 1 1 0 3 0 1
Source: Iowa Health Professions Tracking Center, Office of Statewide Clinical Education Programs UI Carver College of Medicine, April 2018
K:NP\2YE2017\Graphics\Over50-Bar-163.PPT
Age
AP
Ns
Total number of APNs age 50 and over = 755 (32%)
7

IOWA APNsPrincipal Professional Activity
2017
Number Percent
Private Practice 1677 72.1% State Facility 273 11.7% Public/Community Health 120 5.2% Federal 74 3.2% Hospital Medicine 73 3.1% Urgent Care 55 2.4% Teaching/Research 34 1.5% Student Health 14 0.6% Administration 6 0.2%
Total 2326 100%
Source: Iowa Health Professions Tracking Center, Office of Statewide Clinical Education ProgramsUI Carver College of Medicine, April 2018
K:\DOC\NP\YE\2017\Graphics\NP126.PPT8
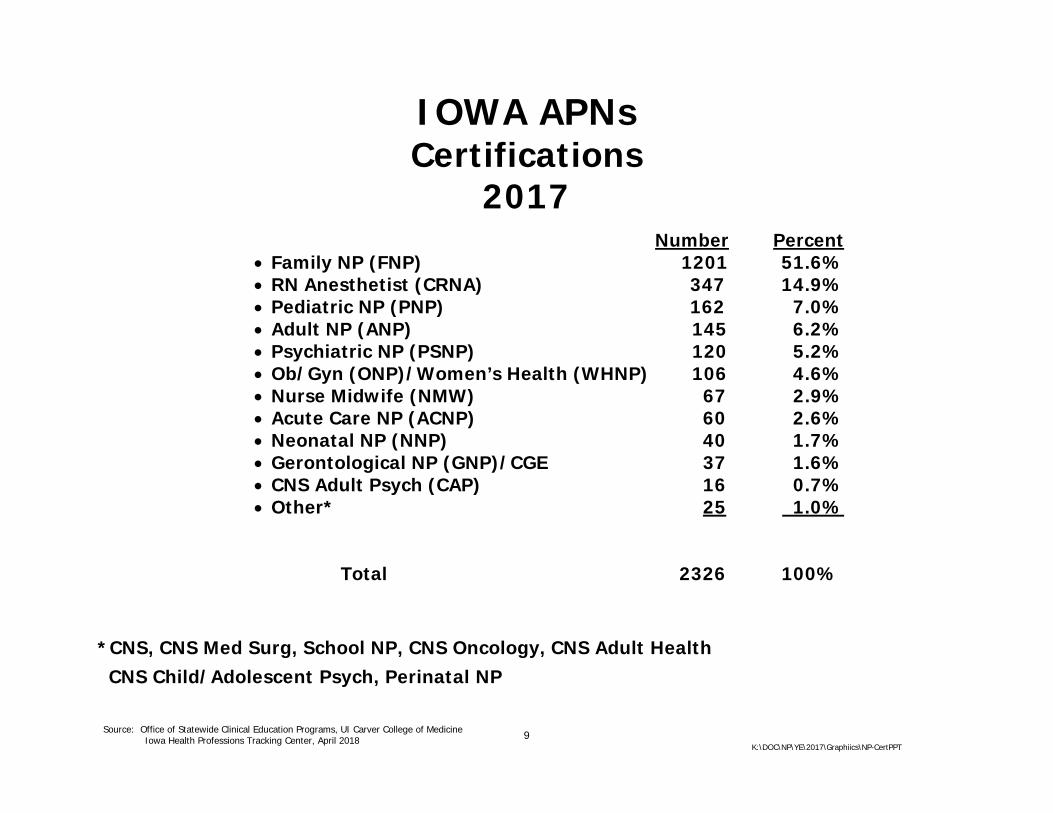
IOWA APNsCertifications
2017
Number Percent Family NP (FNP) 1201 51.6% RN Anesthetist (CRNA) 347 14.9% Pediatric NP (PNP) 162 7.0% Adult NP (ANP) 145 6.2% Psychiatric NP (PSNP) 120 5.2% Ob/Gyn (ONP)/Women’s Health (WHNP) 106 4.6% Nurse Midwife (NMW) 67 2.9% Acute Care NP (ACNP) 60 2.6% Neonatal NP (NNP) 40 1.7% Gerontological NP (GNP)/CGE 37 1.6% CNS Adult Psych (CAP) 16 0.7% Other* 25
1.0%
Total 2326 100%
Source: Office of Statewide Clinical Education Programs, UI Carver College of MedicineIowa Health Professions Tracking Center, April 2018
K:\DOC\NP\YE\2017\Graphiics\NP-CertPPT
*CNS, CNS Med Surg, School NP, CNS Oncology, CNS Adult Health CNS Child/Adolescent Psych, Perinatal NP
9

DISTRIBUTION OF APNsBy City Population Ranges*
2017
K:Doc\NP\YE2017\Grahics\CityPopRanges-Comp.ppt
Population
Cities in Iowa
% of population*
# of Cities with APNs
# of APNs
Percent
Cumulative Percent
< 5,000 867 (62CDP)** 27% 158 334 14.4% 14.4%
5,000-9,999 42 12% 39 264 11.3% 25.7%
10,000-24,999 17 10% 17 192 8.3% 34.0%
25,000-49,999 11 14% 11 238 10.2% 44.2%
50,000-99,999 8 23% 8 891 38.3% 82.5%
100,000 > 2 14% 2 407 17.5% 100.0%
Totals 947 100% 235 2326 100.0%
Source: Iowa Health Professions Tracking Center, Office of Statewide Clinical Education ProgramsUI Carver College of Medicine, April 2018
66% of Iowa’s APNs are in the 21 cities with > 25,000 residents
*Population Source: US Census City Population Estimates 2010**CDP: Census Designated Place
10

IOWA APNsCommunities Gaining/Losing APNs
2017
Community Size #Entering #Leaving Net
<5,000 36 21 +15
5,000 - 9,999 29 12 +17
10,000 - 24,999 19 11 + 8
25,000 - 49,999 29 26 + 3
50,000 - 99,999 118 39 +79
>100,000 50 26 +24Total 281 135 +146
K:Doc/NP/YE/2017Y/Graphics/101-chart.PPTSource: Iowa Health Professions Tracking Center, Office of Statewide Clinical Education ProgramsUI Carver College of Medicine, April 2018 11

Geographic Distributions

12

13

14

15

16

17

18

19

20

Trends

ACTIVE IOWA APNs1999 - 2017
633
707804
872
907
930
997
1044
1087
1176
1260
13531503
16201747
19022019
2180
2326
0
200
400
600
800
1000
1200
1400
1600
1800
2000
2200
2400
'99 '00 '01 '02 '03 '04 '05 '06 '07 '08 '09 '10 '11 '12 '13 '14 '15 '16 '17
K:/Doc/NP/YE/2017/Graphics/NP102.PPT
Source: Iowa Health Professions Tracking Center, Office of Statewide Clinical Education Programs, UI Carver College of Medicine, April 2018
267% Increase
21

IOWA APNs Net Gain/Loss 1999 - 2017
0
50
100
150
200
250
300
Entering 130 96 121 88 72 96 124 92 104 144 132 149 231 224 247 272 268 308 281
Leaving 11 22 24 20 37 73 57 45 61 55 48 56 81 107 120 117 151 147 135
Net Gain/Loss 119 74 97 68 35 23 67 47 43 89 84 93 150 117 127 155 117 161 146
'99 '00 '01 '02 '03 '04 '05 '06 '07 '08 '09 '10 '11 '12 '13 '14 '15 '16 '17
AP
Ns
K:\DOCUMENT\NP\YearEnd\2017\Graphics\NP168.pptm
Source: Iowa Health Professions Tracking Center, Office of Statewide Clinical Education ProgramsUI Carver College of Medicine, April 2018
22

IOWA APNsAge Distribution Comparison
1999 vs. 2017938
633
447
307
159
280
152
210
100
200
300
400
500
600
700
800
900
1000
Under 40 40-49 50-59 60 and OverYear Total APNs Average Age Median Age
2017 2325** 45 43
K:Doc\NP\YE\2017\Graphics\170.PPT
Source: Iowa Health Professions Tracking Center, Office of Statewide Clinical Education Programs, UI Carver College of Medicine, April 2018
*Includes 21 unknown
1999 633* 45 45
23

IOWA APNs Working in Communities of <15,000
1999 – 2017
633
10871260
1503
1747
2019
2326
198 219382 405
481 500574 590 629 686 715
2180
1902
1620
1353
872707
907804
11761044
930 997
248 271 274 289258 318 323 357
100300500700900
11001300150017001900210023002500
'99 '00 '01 '02 '03 '04 '05 '06 '07 '08 '09 '10 '11 '12 '13 '14 '15 '16 '17
All APNs <15,000 Comm
Source: Iowa Health Professions Tracking Center, Office of Statewide Clinical Education ProgramsUI Carver College of Medicine, April 2018 K:/DOC/NP/YE//2017\Graphics\Comm15KNP102.ppt
24

IOWA APNsTowns With at Least One APN
1999 - 2017
213
185
164158
151
238
225
219212
209206
179
178
174
172
155155
143
135120130140150160170180190200210220230240250
'99 '00 '01 '02 '03 '04 '05 '06 '07 '08 '09 '10 '11 '12 '13 '14 '15 '16 '17
Tow
ns
wit
h A
PN
s
YearK:/DOC/NP/YE/2017/Graphics/NPS106.ppt
Source: Iowa Health Professions Tracking Center, Office of Statewide Clinical Education Programs,UI Carver College of Medicine, April 2018
76% Increase
25

135
143
151155
158155
164
172 174178 179
185
206
213209
212
219225
238
239233 232 231 230 230 229
232229
225221 219 217
214 212 213
214
120
130
140
150
160
170
180
190
200
210
220
230
240
250
'99 '00 '01 '02 '03 '04 '05 '06 '07 '08 '09 '10 '11 '12 '13 '14 15 16 17
Com
mun
itie
s
Year
IOWA APNsCommunities with APN or Physician
1999-2017
Towns With At Least One APN
Towns With At Least One PHY
Source: Iowa Health Professions Tracking Center, Office of Statewide Clinical Education Programs,UI Carver College of Medicine, April 2018 K:Doc/NP/YE2017/NPs106w PHY
76% Increase
12% Decrease
26

IOWA ADVANCED PRACTICE NURSING SUPPLYAll APNs – Primary Care APNs*
2006 - 2017
10441176
1353
1620
1902
2180
566649
749
9401087
1260
1503
1747
2019
2326
1019
854
688606
15081279
12051125
0200400600800
10001200140016001800200022002400
'06 '07 '08 '09 '10 '11 '12 '13 '14 '15 '16 '17
Nur
ses
APNs Primary Care APNs
K:Doc/NP/YE/2017E/Graphics/PrimaryCareTrend 16.ppt
*Primary Care: ANP, FNP, & PNP
Source: Office of Statewide Clinical Education Programs, UI Carver College of Medicine Iowa Health Professions Tracking Center, April 2018
Primary Care APNs*126% Increase (13% per year)
APN Supply 96% Increase (10% per year)
27

IOWA APNsCRNA - Gender
1999 - 2017
136
246
286 287324 330
347340
302286
178161
189167
266
214207 209
166
170164154
101
146
116 122133 133
119135
114
149 162 163 149164
180
170160148
35 47 51 59 67 74 76 7997 104123 137 141
183
050
100150200250300350400
'99 '01 '02 '03 '04 '05 '06 '07 '08 '09 '10 '11 '12 '13 '14 '15 '16 '17
All CRNAs Male Female
Source: Iowa Health Professions Tracking Center, Office of Statewide Clinical Education ProgramsUI Carver College of Medicine, April 2018 K:Doc\NP\YE\2017YE\Graphics\CRNA-Gender.PPT28

Iowa APNsAttrition Analysis
2010-2017
Source: Iowa Health Professions Tracking Center, Office of Statewide Clinical Education ProgramsUI Carver College of Medicine, April 2018
K:Document\NP\YE2017\Workforce142
Year Retirement Relocation Death Health Training InactiveLocum Tenens Military Misc/UNK Total
2010 9 13 - 1 - 6 - - 27 56
2011 21 18 - - - 3 - - 39 81
2012 19 21 2 1 - 9 1 - 54 107
2013 20 29 - 2 1 8 1 - 58 119
2014 21 36 1 2 1 3 5 - 48 117
2015 30 39 3 - 1 9 2 - 67 151
2016 28 28 - 1 1 4 4 - 78 144
2017 24 16 1 - 5 1 2 - 86 135
Total 172 200 7 7 9 43 15 0 457 910
Annual Average 21.5 25.0 0.9 0.9 1.1 5.4 1.9 0.0 57.1 113.8
29

RELOCATION OF IOWA APNs IN US (16)*
2017
Source: Iowa Health Professions Tracking Center, Office of Statewide Clinical Education ProgramsUI College of Medicine, April 2018
K:\Document\NP\YE2017\USMap171.ppt
1
1
1 1
2
1
43
*4 unknown
1
30

Workforce Comparisons

IOWA HEALTH PROFESSIONS INVENTORYComposition of Workforce - 2017
K:Graphics/Powerpoint/IA Workforce/ALL-HP-2017/SummarySource: Iowa Health Professions Tracking Center, Office of Statewide Clinical Education Programs, UI Carver College of Medicine, July 2018
Physicians 5926
Pharmacists 2991
Dentists 1523
Nurse Practitioners
Physician Assistants
2326
922
31

IOWA HEALTH PROFESSIONS INVENTORY 2001-2017
4830 4974 5003 51975417 5599 5785 5876 5926
2473 2538 2590 2691 2814 2864 2923 2962 2991
1422 1448 1469 1476 1498 1524
1574 1564
1523
804 907 9971087 1260 1503
17472019
2326
480 538 583 630 681 736 812 893 922
0
500
1000
1500
2000
2500
3000
3500
4000
4500
5000
5500
6000
6500
'01 '03 '05 '07 '09 '11 '13 '15 '17
Physicians 23% Increase
Dentists7% Increase
PAs92% Increase
Pharmacists 21% Increase
APNs 189% Increase
Source: Iowa Health Professions Tracking Center, Office of Statewide Clinical Education ProgramsUI Carver College of Medicine, June 2018
K:Graphics\Powerpoint\IA Workforce\ALL‐HP‐2017\Trendline32

IOWA HEALTH PROFESSIONS INVENTORYComposition of Workforce - 2017
Net Gain/Loss Summary
K:Graphics/Powerpoint/IA Workforce/ALL-HP-2017/Gain-LossSource: Iowa Health Professions Tracking Center, Office of Statewide Clinical Education Programs
UI Carver College of Medicine, July 2017
Entering % Leaving % Net % Total
Physicians 410 6.9% 409 6.9% 1 0.02% 5926
Pharmacists 150 5.0% 136 4.5% 14 -0.5% 2991
Dentists 48 3.2% 68 4.5% -20 -1.3% 1523
Nurse Practitioners 281 12.1% 135 5.8% 146 6.3% 2326
Physician Assistants 88 9.5% 70 7.6% 18 1.95% 922
33

IOWA HEALTH PROFESSIONS INVENTORYComposition of Workforce - 2017
Gender
Male % Female % Total
Physicians 4071 1855 5926
Physician Assistants 269 653 922
Dentists 1074 449 1523
Pharmacists
APNs
1075
277
1916
2047
2991
2326
Source: Iowa Health Professions Tracking Center, Office of Statewide Clinical Education Programs, UI Carver College of Medicine, June 2017 K:Graphics/Powerpoint/IA Workforce/All-HP-2016/GENDER.PPT
29%
69%
71%
36%
71%
29%
88%
31%
12%
64%
34

PhysiciansPhysician Assistants Dentists Pharmacists APNs
<40 1410 24%
44148%
49533%
127443%
93840%
40-49 162127%
21523%
31521%
76626%
63327%
50-59 152526%
17319%
29719%
51717%
44719%
> 60 137023%
9310%
41627%
43314%
30713%
Total 5926 922 1523 2991 2326
Source: Iowa Health Professions Tracking Center, Office of Statewide Clinical Education Programs, UI Carver College of Medicine, July 2018
K:Graphics/Powerpoint/IA Workforce/ALL-HP-2017/AGE
IOWA HEALTH PROFESSIONS INVENTORYComposition of Workforce – 2017
Age
35

IOWA HEALTH PROFESSIONS INVENTORYComposition of Workforce - 2017
Retirement Summary
K:Graphics/Powerpoint/IA Workforce/ALL-HP-2017/RetirementSource: Iowa Health Professions Tracking Center, Office of Statewide Clinical Education Programs
UI Carver College of Medicine, June 2017
Percent of Average Age All Average Age
Retired All Attrition Retirement Attrition All Attrition
Physicians 125 31% 67 410 53
Pharmacists 37 27% 67 136 47
Dentists 35 52% 68 68 57
Nurse Practitioners 24 18% 67 135 49
Physician Assistants 6 8% 62 73 41
36

IOWA HEALTH PROFESSIONS INVENTORYDistribution by Community Size*
2017CommunityPopulation
Number of CommunitiesWith Providers
Number of Providers % of Providers
Pharms APNs Phys PA Pharms APNs Phys PA Pharms APNs Phys PA
< 1,000 14 38 14 22 20 43 19 23 0.7% 1.8% 0.3% 2.5%
1,000-4,999
128 122 112 77 373 259 295 115 12.5 11.1 5.0 12.5
5,000-9,999
40 37 40 35 381 251 436 109 12.7 10.8 7.4 11.8
10,000-49,999 22 22 22 19 491 347 864 118 16.4 14.9 14.6 12.8
50,000-99,999 5 5 5 5 695 608 1864 215 23.2 26.1 31.5 23.3
> 100,000 4 4 4 4 1031 818 2448 342 34.5 35.2 10.3 37.1
Total213 238 197 162 2991 2326 5926 992 100%
*Using 2010 census population figures, combining adjacent communitiesSource: Iowa Health Professions Tracking Center, Office of Statewide Clinical Education Programs,
UI Carver College of Medicine, June 2018 K:Graphics/Powerpoint/IA Workforce/All‐HP‐2017/CommDist‐NP‐Pharm‐PA‐Phys37

IOWA PROFESSIONS OBSTETRICSAge Distribution Comparison
2017
0
6166
79
65
2
59 58
4035
0 3 37
20
10
20
30
40
50
60
70
80
90
Under 30 30-39 40-49 50-59 60 and Over
K:Doc\NP\YE\2017\Graphics\170.PPT
Source: Iowa Health Professions Tracking Center, Office of Statewide Clinical Education Programs, UI Carver College of Medicine, February 2019
KeyBlack: APNBlue: PHYRed: PA
38

IOWA PROFESSIONS MENTAL HEALTHAge Distribution Comparison
2017
0
36
61 60
75
6
46 4439
44
29
59 9
0
10
20
30
40
50
60
70
80
Under 30 30-39 40-49 50-59 60 and Over
K:Doc\NP\YE\2017\Graphics\170.PPT
Source: Iowa Health Professions Tracking Center, Office of Statewide Clinical Education Programs, UI Carver College of Medicine, February 2019
KeyBlack: APNBlue: PHYRed: PA
39

IOWA PROFESSIONS ANESTHESIAAge Distribution Comparison
2017
0
49
99
8488
2
126115
48
71
1 2 0 1 00
20
40
60
80
100
120
140
Under 30 30-39 40-49 50-59 60 and Over
K:Doc\NP\YE\2017\Graphics\170.PPT
Source: Iowa Health Professions Tracking Center, Office of Statewide Clinical Education Programs, UI Carver College of Medicine, February 2019
KeyBlack: APNBlue: PHYRed: PA
40
41

42

43