iowa p-index relationship to feedlots steve brinkman cca nutrient management specialist usda / nrcs...
TRANSCRIPT

Iowa P-IndexRelationship to Feedlots
Steve Brinkman CCANutrient Management Specialist
USDA / [email protected]
515-323-2243

Why!!!
300 head finishing Cattle open lot 4 ton / head /year 1200 tons / year produced Manure analysis
Total N – 14 # / ton P2O5 -- 11 # / ton
16800# Nitrogen- 13200# P2O5

Why!!!
35% N availability 30% application loss 100% P availability 156 bu corn 44 bu beans 125# N 36.4 ton Nitrogen Rate =33 acres + 33 acres
= 66 acres 8.5 ton P- removal rate = 141.2 acres + 141.2
acres = 282.4 acres

Purpose of the P-Index
Assess the Risk of Phosphorous delivery to surface waters
Tool to be used by Conservation Planners, Landowners and Land Users
Used to Help Make Management Decisions in Developing ways to Reduce Risks

Iowa Phosphorus Index
Tool to assess potential for P loss from field to surface water
More comprehensive than soil test Integrates many soil and field characteristics Integrates many management and
conservation practices P-Index looks at source and transport factors
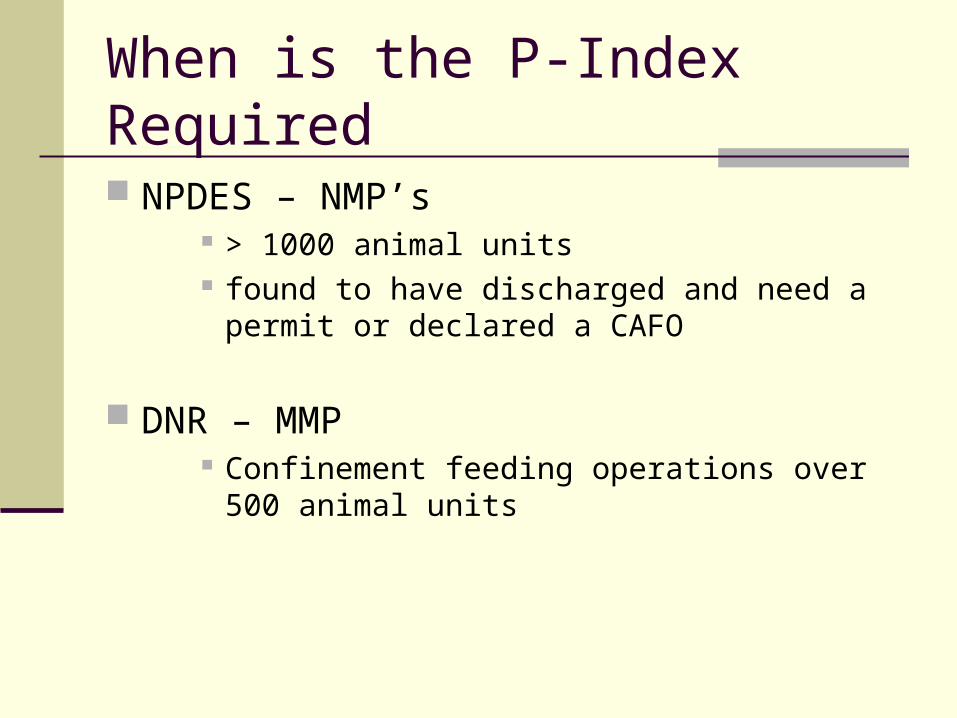
When is the P-Index Required
NPDES – NMP’s > 1000 animal units found to have discharged and need a permit or
declared a CAFO
DNR – MMP Confinement feeding operations over 500 animal
units

When is the P-Index Required
EQIP funds are used for waste water and manure handling needs
NRCS -- CNMP NRCS – NMP’s if

P-Index Use Required -- NRCS
• Animal Manure or Organic By-Products applied
• ID as designated P related impairment (DNR 303D List) http://www.iowadnr.com/water/tmdlwqa/wqa/303d.html
• Current Soil Test P is very high• Soil Losses exceed T
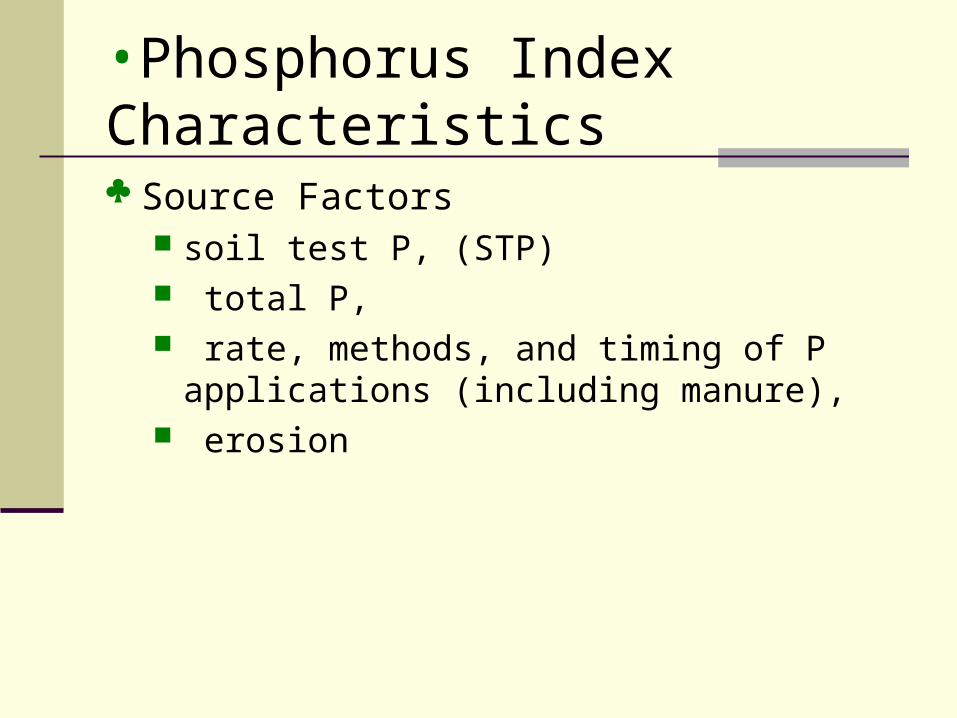
•Phosphorus Index Characteristics Source Factors
soil test P, (STP) total P, rate, methods, and timing of P
applications (including manure), erosion

•Phosphorus Index Characteristics Transport Factors
sediment delivery, relative field location in watershed, soil conservation practices, precipitation, runoff, tile flow/subsurface drainage

P-Index -Three Components
Erosion Component
Runoff Component
Subsurface Drainage Component

•Erosion Component
(Gross Erosion X Sediment Trap) X (Sediment Delivery X Buffer) X Enrichment Factor X Soil Test Phosphorus Erosion Factor
Erosion factor considers sheet and rill erosion, sediment trapped by conservation practices sediment delivery rates, enrichment, STP, and buffers

•Runoff Component
Runoff Curve Number Factor X Precipitation Factor X STP Runoff Factor
Runoff Factors considers water runoff based on a modification of the runoff curve number, STP which includes rate, method, and timing of P applications

•Subsurface Drainage Component
Flow Factor (Tile or Subsurface Flux) X Precipitation Factor X STP Subsurface Transport Factor
Surface Transport Factor considers the presence of tiles and index of water flow through the soil profile, STP, and precipitation

Looking Into the Erosion Component Total Gross soil erosion
Estimated by RUSLE2 adding ephemeral and classical gullies Modified by :
sediment trap and sediment delivery Filter strip factor Sediment enrichment factor Total soil P factor

RUSLE2
Make sure to use the Appropriate Dominant Critical Area for the P-index when Running RUSLE2 sheet and rill erosion.
Should the P-Index be applied to whole fields, or portions of a field? Depends!!! Research has shown that the majority of our P runoff comes from a few of the acres in a field. So why not plan a higher level of conservation to the area of a field that shows to have the greatest risk. The P-Index can also be used as a decision tool when managing a field.

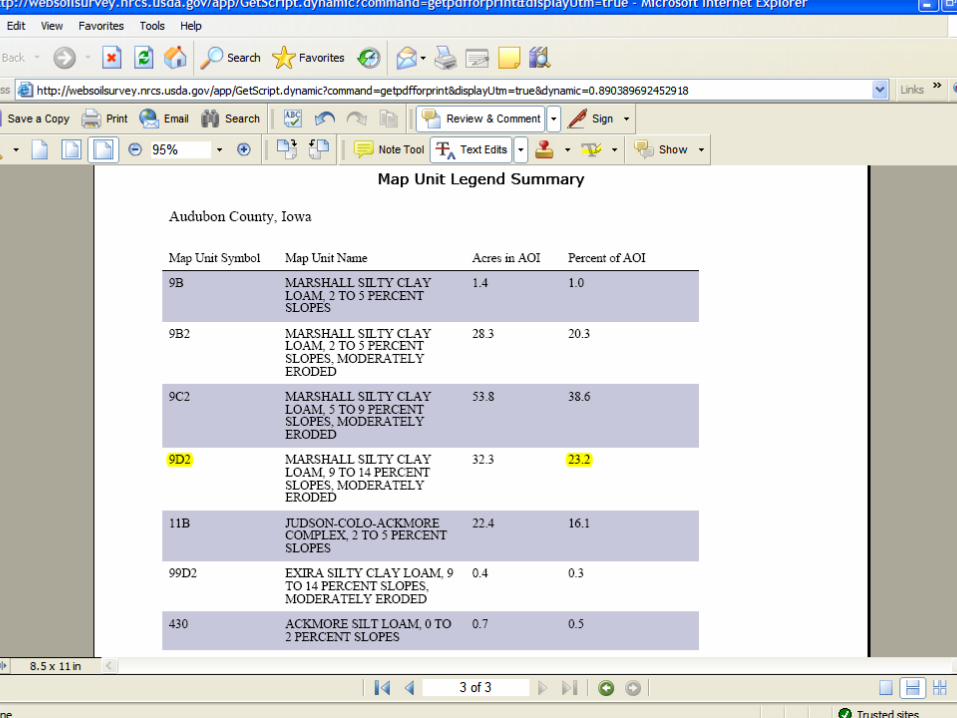
Dominant Critical Area
Phosphorus Index: Iowa NRCS Technical Note 29 is to be used when determining dominant critical area. Small, insignificant SMU areas of 10% or less of the field are not to be used. However, since small areas are known to contribute significant phosphorus loss within a field, areas greater than 10% are to be considered when determining the soil loss for input into the P-Index since this is a resource concern. When determining this dominant critical area look at the most erosive area that is greater than 10%. To determine this area, use the following process:

Dominant Critical Area
Consider first the SMU that is > 10% for the Dominant Critical Area.
If critical area consists of several SMUs that are < 10% then add the SMUs with like Slope Classes to determine if the SUM is > 10%. (i.e. 120D2, 20D2) If the sum is > 10% use the one with the largest
percentage for calculating the PI. If the sum is < 10% then it is not the dominant
critical area If the sum of the SMU with like slope classes is >
10% and have different erosion phases use the erosion phase with the highest percentage (i.e. 10%-120D2 and 4%-120D3 use 120D2).


Erosion Component Value 0.00
Gross Erosion (tons/acre)
Sheet & Rill (RUSLE2) Area (ac) Tons
Ephemeral 0.0
Gully 0.0
Factor 0.0


Recommendations for Types of Manure in RUSLE2 Database:
Iowa NRCS web site RUSLE2 Manure pdf ftp://ftp-fc.sc.egov.usda.gov/IA/technical/
RUSLE2Manure.pdf

Recommendations for Types of Manure in RUSLE2 Database:
“Manure, liquid” (swine from confinement, holding ponds and municipal sewage): use Equation A,
“Manure, semi-solids” (includes beef, swine and dairy settling basin): Use Equation A
“Manure, open lots” (beef, swine, dairy manure from open lots and buildings and poultry manure): Use Equation B, solids
“Manure, with bedding” (horse, sheep packs including straw and shredded newspaper): Use Equation C

Recommendations for Types of Manure in RUSLE2 Database: Equation for semi-solids
(lbs /ac) X (% semi-solids as a decimal) = lbs dry matter
Sample calculations: (15000 lbs /ac) X (0.55) = 8250 lbs/ac dry
matter RUSLE2 Conversion: 8250 lbs/ac dry matter
X 0.5 = 4125 lbs/ac

Ephemeral Gully Erosion
Definitions Ephemeral Erosion---- concentrated flow areas of
erosion that can typically be filled by tillage equipment
Classical Gully Erosion---- concentrated flow areas of erosion that need earth moving equipment to be repaired

Classic Gully

Ephemeral Erosion

Length 100ft Top width 1ft Bottom width 0.5 ft Depth 1ft Sandy loam soil
105# / cu ft 3.94 ton soil
Example

B
C
Drawing Not To Scale
D
Ephemeral Gulley Erosion
A
A = Top Width in FeetB = Bottom Width in FeetC = Depth in FeetD = Length in FeetE = Soil Unit Weight*H = Number of Years*Sands, Loamy sands, Sandy loamsFine sandy loam = 105 Lb/ft3
*Loams, Sandy clay loams, Sandy clay, Silt loam, Silty clay loam, Silty clay, &Clay = 85 Lb/ft3
(A + B) x C x D x E = Tons/ Year 2 x 2000 x H

B
C
Drawing Not To Scale
D
Ephemeral Gulley Erosion
A
A = Top Width in Feet A = 1’B = Bottom Width in Feet B = 0.5’C = Depth in Feet C = 1’D = Length in Feet D = 650’E = Soil Unit Weight* E = 85 Lb/ft3
H = Number of Years H = 1*Sands, Loamy sands, Sandy loamsFine sandy loam = 105 Lb/ft3
*Loams, Sandy clay loams, Sandy clay, Silt loam, Silty clay loam, Silty clay, &Clay = 85 Lb/ft3
(A + B) x C x D x E = Tons/year 2 x 2000 x H
(1 + 0.5) x 1 x 650 x 85 = 20.72 Tons/year 2 x 2000 x 1

Gross Erosion (tons/acre)
Sheet & Rill (RUSLE2) 3.9 Area (ac) Tons
Ephemeral 0.6 139.3 50.0
Gully 0.0 139.3 0.0
Factor 5.6
From RUSLE2 Total area Of Field
Use ephemeralEquation fromPrevious slide


Questions??