iowa’s intelligent compaction research and implementation · iowa’s intelligent compaction...
TRANSCRIPT
BUREAU OF RESEARCH AND TECHNOLOGY NOVEMBER 2010
Iowa’s intelligent compaction research and implementationBy Dr. David J. White, Dr. Pavana Vennapusa and Mr. Heath Gieselman Earthworks Engineering Research Center, Iowa State University (ISU)
Intelligent compaction (IC) technology integrated with a global positioning system (GPS) provides 100 percent cover-age for compacted earth materials and hot-mix asphalt (HMA) conditions. Using IC shows significant potential for
enhancing the abilities of governmental agencies and contrac-tors to construct better, safer and less expensive transportation infrastructure projects. The Iowa Department of Transportation (DOT) and Earthworks Engineering Research Center (EERC) at Iowa State University (ISU) organized three national annual workshops (2008-2010) to provide a collaborative exchange of ideas and experiences; share research results; and develop research, edu-cation and implementation initiatives for IC. Recently, the Iowa DOT started the Intelligent Compaction Research and Implementation – Phase I initiative in collabo-ration with the EERC. Three demonstration projects involv-ing HMA overlay and pavement foundation layer earthwork construction were conducted in Iowa in 2009. New IC specifica-tions have been developed and incorporated into 2010 HMA and embankment construction projects in Iowa. This article provides background information about IC, an overview of the 2010 IC workshop, results from the 2009 demonstration projects, and a summary of the new IC special provision specifications.
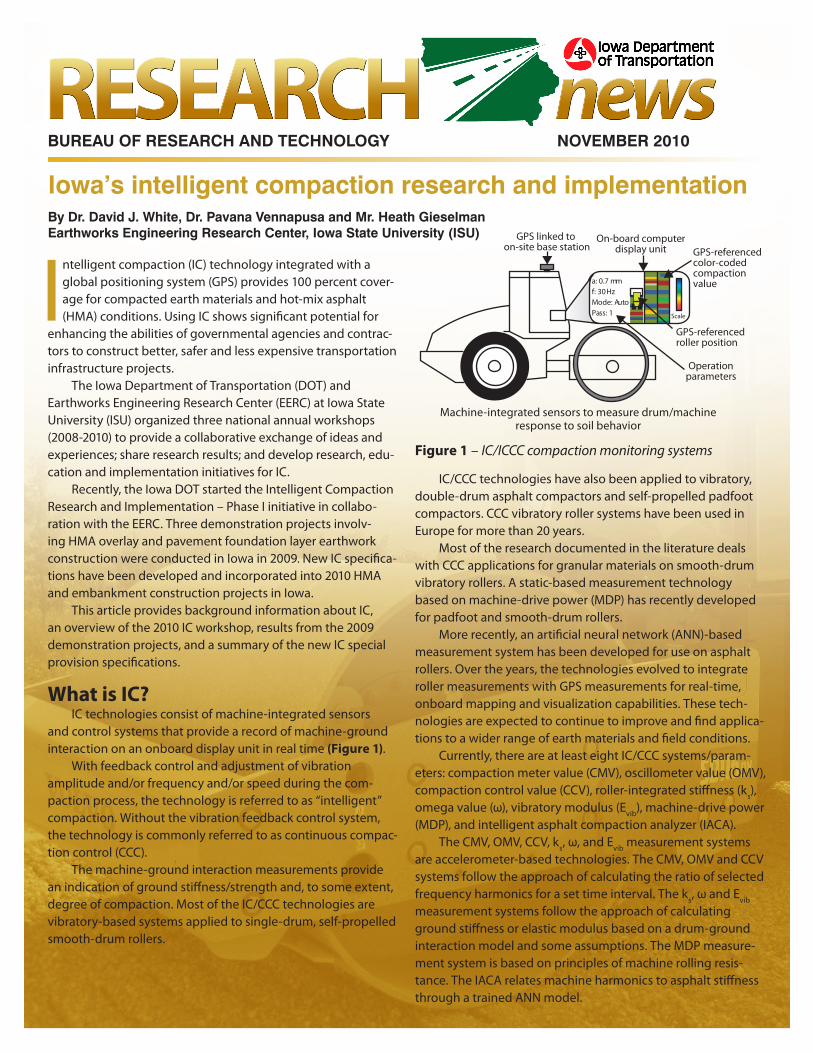
What is IC? IC technologies consist of machine-integrated sensors and control systems that provide a record of machine-ground interaction on an onboard display unit in real time (Figure 1). With feedback control and adjustment of vibration amplitude and/or frequency and/or speed during the com-paction process, the technology is referred to as “intelligent” compaction. Without the vibration feedback control system, the technology is commonly referred to as continuous compac-tion control (CCC). The machine-ground interaction measurements provide an indication of ground stiffness/strength and, to some extent, degree of compaction. Most of the IC/CCC technologies are vibratory-based systems applied to single-drum, self-propelled smooth-drum rollers.
IC/CCC technologies have also been applied to vibratory, double-drum asphalt compactors and self-propelled padfoot compactors. CCC vibratory roller systems have been used in Europe for more than 20 years. Most of the research documented in the literature deals with CCC applications for granular materials on smooth-drum vibratory rollers. A static-based measurement technology based on machine-drive power (MDP) has recently developed for padfoot and smooth-drum rollers. More recently, an artificial neural network (ANN)-based measurement system has been developed for use on asphalt rollers. Over the years, the technologies evolved to integrate roller measurements with GPS measurements for real-time, onboard mapping and visualization capabilities. These tech-nologies are expected to continue to improve and find applica-tions to a wider range of earth materials and field conditions. Currently, there are at least eight IC/CCC systems/param-eters: compaction meter value (CMV), oscillometer value (OMV), compaction control value (CCV), roller-integrated stiffness (ks), omega value (ω), vibratory modulus (Evib), machine-drive power (MDP), and intelligent asphalt compaction analyzer (IACA). The CMV, OMV, CCV, ks, ω, and Evib measurement systems are accelerometer-based technologies. The CMV, OMV and CCV systems follow the approach of calculating the ratio of selected frequency harmonics for a set time interval. The ks, ω and Evib measurement systems follow the approach of calculating ground stiffness or elastic modulus based on a drum-ground interaction model and some assumptions. The MDP measure-ment system is based on principles of machine rolling resis-tance. The IACA relates machine harmonics to asphalt stiffness through a trained ANN model.
GPS linked to on-site base station
On-board computerdisplay unit GPS-referenced
color-codedcompaction value
GPS-referencedroller position
a: 0.7 mmf: 30 HzMode: AutoPass: 1 Scale
Operationparameters
Figure 1 – IC/ICCC compaction monitoring systems
Machine-integrated sensors to measure drum/machine response to soil behavior

Implementation challenges There is growing interest among transportation agen-cies and contractors to incorporate IC/CCC technologies into earthwork and HMA pavement construction practice. Expecta-tions are that the IC/CCC systems will: 1) improve construction efficiency; 2) streamline quality management programs of earthwork and asphalt projects; 3) provide a link between qual-ity acceptance parameters and pavement design parameters; and 4) improve the performance of compacted materials. These expectations cannot be met without addressing the following key implementation challenges.
• Lackofadequateknowledgeabouttechnical aspects • Nowidelyacceptedspecificationsorstandards • Limitednumberofwell-documentedcasehistories demonstrating the benefits of IC/CCC • Inadequateeducation/trainingmaterials
Intelligent compaction workshops Since 2008, the Iowa DOT and EERC have organized three national annual workshops. The 2008 and 2009 workshops were face-to-face meetings, while the 2010 workshop was or-ganized as a Webinar. Proceedings for workshop sessions that summarize workshop events and outcomes are available online at: www.eerc.iastate.edu/publications.cfm (Figure 2).
Figure 2 – 2010 workshop report cover
2
The 2008 and 2009 workshops were attended by about 100 participants, with representatives from several state DOTs, Fed-eral Highway Administration, industry/manufacturers, contrac-tors, and universities. The workshops featured several technical presentations, breakout sessions, panel discussions, and group exercises to identify and prioritize implementation strategies. The 2010 Webinar had about 165 participants with repre-sentatives from state DOTs, Federal Highway Administration, the National Highway Research Program, trade organizations, contractors, equipment manufacturers, and universities. The We-binar’s objective was to generate a focused discussion to identify the research, education and implementation goals necessary for advancing IC for earthwork and HMA. Technical presentations were made by EERC researchers and representatives from state DOTs and manufacturers. Webinar participants were surveyed to update the IC Road Map, a list of key research, implementation and training areas developed from the 2008 and 2009 work-shops. Participants were given the 2009 IC Road Map and asked to rank the items and provide comments regarding topics that should be removed, adjusted or added. The 2010 IC Road Map is based on participant voting (Figure 3).
Figure 3 – * denotes the new elements added in 2010 Similar to previous year workshop results, the top two needs remain 1) developing and providing evidence of correlations between IC/CCC measurements and in situ test measurements, and 2) developing IC/CCC specifications/guidance.
Workshop topic to be adjusted, added or removed Votes
Intelligent compaction and in situ correlations 91
Intelligent compaction specifications/guidance 46
In situ testing advancements and new mechanistic based quality control and quality assurance
43
Intelligent compaction technology advancements and innovations 21
Project scale demonstration and case histories 19
Understanding impact of nonuniformity of performance 18
Data management and analysis 17
Standardization of roller output and output format files* 13
Understanding roller measurement influence depth 11
Education program/certification program 6
Intelligent compaction research database 6
Standardization of roller Sensor Calibration Pro-tocols* 4
Prioritized IC/CCC Technology Research/Implementation Needs

3
Important outcomes from the 2010 workshop included providing a forum that facilitated information exchange and collaboration, updating and prioritizing the IC/CCC road map, connecting people interested in implementing IC/CCC into earthwork and HMA construction practice, and developing plans for further workshops and other activities. Based on the information derived from the Webinar, an action plan for advancing IC/CCC technologies was developed (Figure 4). Item one of the action plan was a technology transfer intel-ligent compaction consortium (TTICC) pooled-fund initiative, proposed at the 2010 workshop by circulating a draft TTICC problem statement to participants. The pooled-fund initiative is now solicited under the Transportation Pooled Fund Program (www.pooledfund.org/projectdetails.asp?id=1262&status=1).
Iowa demonstration projects Three demonstration projects were conducted in Iowa in 2009. These included: (1) a cohesive subgrade construc-tion project on U.S. 30 near Colo; (2) a subgrade, subbase, and base construction project on Interstate 29 in Monona County; and (3) a HMA overlay construction project on U.S 218 near Coralville.
Compaction monitoring technologies The Caterpillar CP56 padfoot roller, equipped with Caterpillar’s MDP measurement system, was used on the U.S. 30 project. A Volvo SD116DX vibratory smooth-drum roller equipped with Trimble’s CMV measurement system was used on the Interstate 29 project. A Sakai SW880 dual-drum, vibra-tory, smooth-drum asphalt roller equipped with a CCV mea-
1. Establish a Technology Transfer Intelligent Compaction Consortium (TTICC) to identify research gaps and implementation needs, develop problem statements for needed research, identify key partners and form a national-level Specifications Technical Working Group to coordinate efforts.
2. Explore the possibility of conducting a National Highway Institute course or a one-day training course at conferences on IC/CCC technologies.
3. Develop several case histories (technical briefs) to demonstrate the technical aspects and benefits of the technologies.
4. Plan future Webinars to facilitate technology transfer.
Action Plan for Advancing IC/ICCC Technologies into Earthwork and HMA
surement system was used for break-down rolling on the U.S. 218 project. A digital display unit employing proprietary software can be mounted in the roller cabin for onboard visualization of roller position, IC-MVs, coverage information, amplitude/frequency settings, speed, etc. Several key features of the rollers are sum-marized below (Figure 5). In situ testing methods are highlight-ed on the next page (Figure 6).
IC RollerDrum Type
Frequency (f) in Hz
Amplitude (a) settings
IC-MVDisplay
SoftwareOutput
Documentation
Output Export
File
Automatic Feedback
Control
Caterpillar CP56
Padfoot 30
Static, 0.90 mm (low), and 1.80
mm (high)
MDP40 (shown as CCV in the
output)
AccuGrade®Date/time, location (northing/easting/ elevation), speed, CCV(MDP40), fre-quency, amplitude, direction (forward/ backward), vibration (On/Off)
*.csv NO
Sakai SW880
Dual, smooth-
drum
42, 50, and 67
0.30 mm (low), 0.60 mm (high)
CCV
Aithon MT-R® Date/time, location (northing/easting/ elevation), CCV, tem-perature, frequency, direction (forward/backward), vibration (on/off), GPS quality
*.txt NO
Volvo SD116DX
Smooth- drum
34 (low amp)
30 (high amp)
1.45 mm (low), 1.85 mm (high)
CMV, RMV
Trimble CB430Date/time, location (northing/easting/ elevation), speed, CMV, RMV, frequency, amplitude, direction (forward/ backward), vibration (on/off)
*.csv NO
Figure 4 – Action plan for advancing IC technologies into earthwork and HMA practices – 2010 workshop
Figure 5 – Key features of the IC rollers used in the demonstration projects

4
In situ testing methodsFive different in situ testing methods were employed to evaluate the in situ soil/asphalt engineering properties.
• CalibratedHumboldtnucleargauge(NG)tomeasure moisture content and dry unit weight of soil, and dry unit weight of asphalt
• Dynamicconepenetrometer(DCP)tomeasurethe penetration index per blow
• Zornlightweightdeflectometer(LWD)setupwith 300-mm plate diameter to measure In situ elastic modulus(ELWD-Z3)
• 300-mmdiameterfour-segmentedplateKUABfalling weightdeflectometer(FWD)tomeasureinsituelastic modulus(ELWD-k3)
• FLIRthermalcameratomeasuretemperatureofthe asphalt layer
Figure 6 – Different in situ testing methods employed on the demonstration projects – (from top left to bottom right) nuclear density gauge, dynamic cone penetrometer, lightweight deflectometer, falling weight deflectometer and thermal camera
U.S. 30 Colo – Iowa cohesive subgrade construction LocatedonU.S.30eastofColo,Iowa,thisprojectinvolvednew construction of two lanes of traffic and focused on em-bankment construction using approved fill materials on site. Onsite soil conditions were tested (Figure 7). The subgrade soils on site are classified as clayey sand (SC) according to the Unified Soil Classification System (USCS) and A-4 according to the AASHTO classification system, with liquid limit equal to 22, and plasticity index equal to 10. The EERC research team was present on site during the demonstration and constructed test beds where in situmoisture and density measurements from various test beds on site were collected and compared with laboratory Proctor curve (Figure 8). Frequent rain events during the field-testing phase of the project resulted in challenges to construction.
In situ moisture and density measurements obtained from various test beds on site in comparison with laboratory Proctor curve were collected (Figure 9). The results indicate that the soils are generally on the wet side of the materials’ optimum moisture content.
Figure 7 – Soil conditions on site
Figure 8 – MDP40 and percent of target MDP40 maps (final pass) on lift 2, and in situ NG test measurements at three selected locations – TB3 (target MDP40 = 140)
Figure 9 – In situ moisture-density measurements in comparison with laboratory stan-dard Proctor test data
Moisture Content, w (%)
68 10 12 14 16 18 20
Dry
Uni
t Wei
ght,
105
110
115
120
125
Dry
Uni
t Wei
ght,
16.5
17.0
17.5
18.0
18.5
19.0
19.5
Proctor In-Situ w-
Gs = 2.70
95% dmax
5
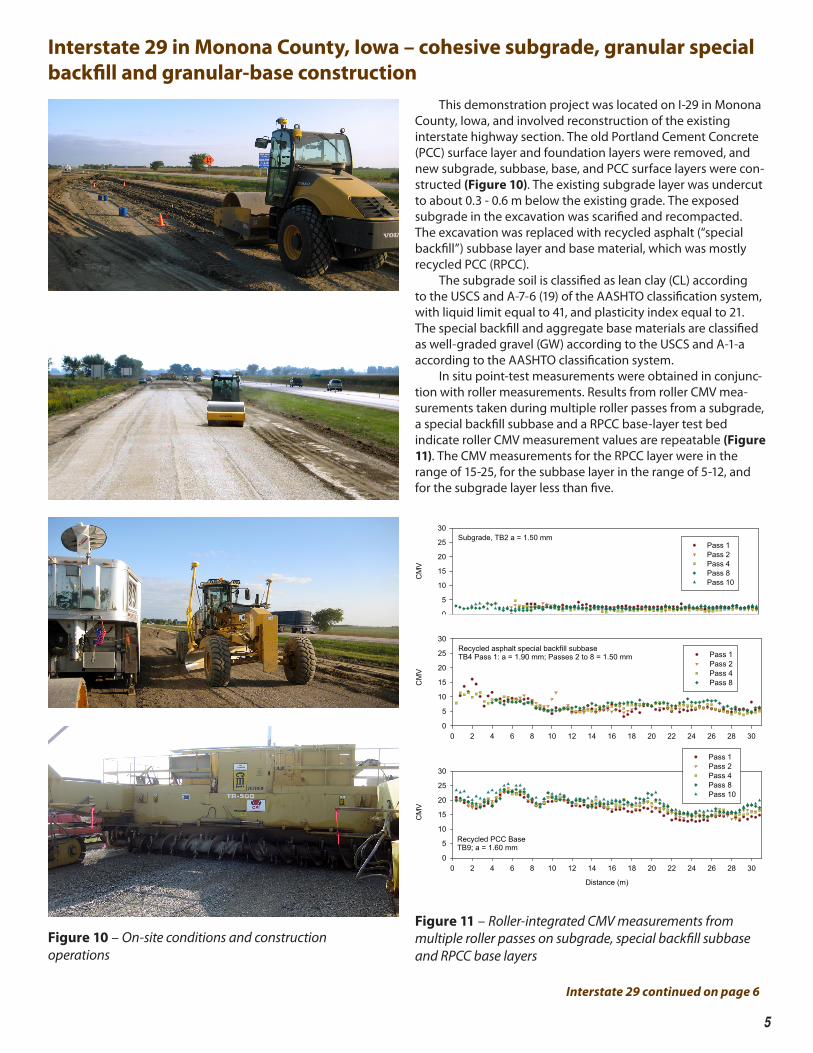
Interstate 29 in Monona County, Iowa – cohesive subgrade, granular special backfill and granular-base construction
Figure 10 – On-site conditions and construction operations
Interstate 29 continued on page 6
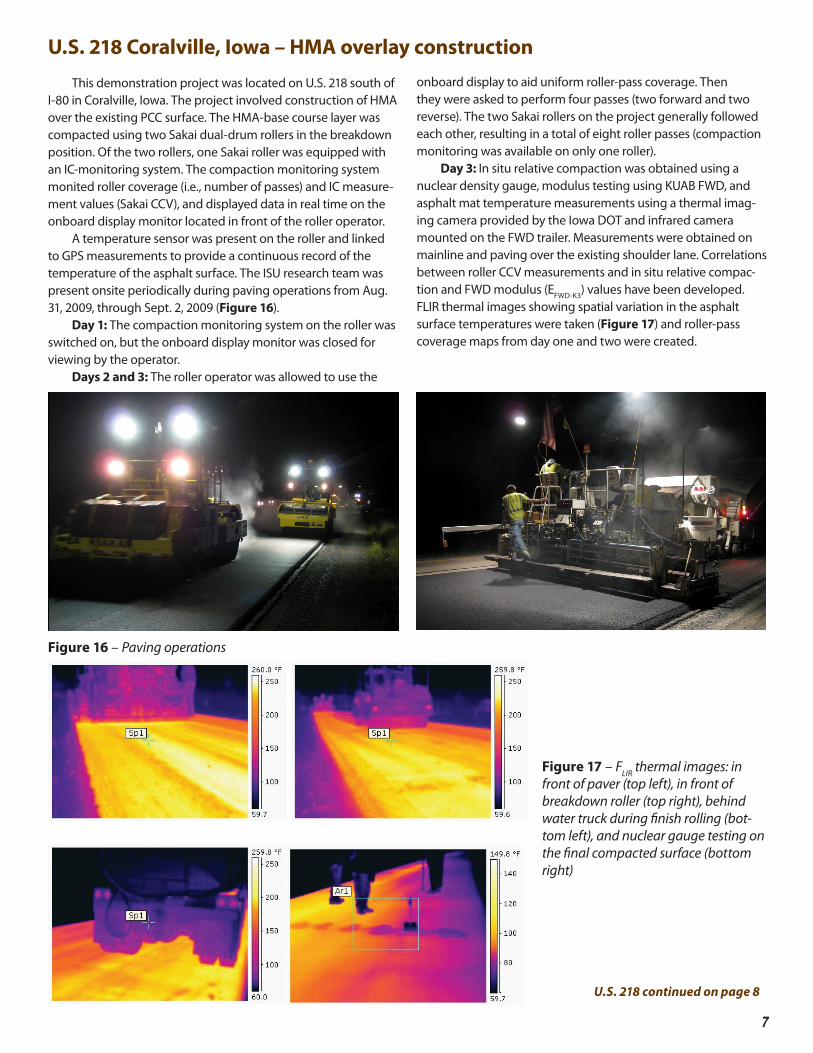
This demonstration project was located on I-29 in Monona County, Iowa, and involved reconstruction of the existing interstate highway section. The old Portland Cement Concrete (PCC) surface layer and foundation layers were removed, and new subgrade, subbase, base, and PCC surface layers were con-structed (Figure 10). The existing subgrade layer was undercut to about 0.3 - 0.6 m below the existing grade. The exposed subgrade in the excavation was scarified and recompacted. The excavation was replaced with recycled asphalt (“special backfill”) subbase layer and base material, which was mostly recycled PCC (RPCC). Thesubgradesoilisclassifiedasleanclay(CL)accordingto the USCS and A-7-6 (19) of the AASHTO classification system, with liquid limit equal to 41, and plasticity index equal to 21. The special backfill and aggregate base materials are classified as well-graded gravel (GW) according to the USCS and A-1-a according to the AASHTO classification system. In situ point-test measurements were obtained in conjunc-tion with roller measurements. Results from roller CMV mea-surements taken during multiple roller passes from a subgrade, a special backfill subbase and a RPCC base-layer test bed indicate roller CMV measurement values are repeatable (Figure 11). The CMV measurements for the RPCC layer were in the range of 15-25, for the subbase layer in the range of 5-12, and for the subgrade layer less than five.
Figure 11 – Roller-integrated CMV measurements from multiple roller passes on subgrade, special backfill subbase and RPCC base layers
Distance (m)
0 2 4 6 8 10 12 14 16 18 20 22 24 26 28 30
CM
V
0
5
10
15
20
25
30
Pass 1Pass 2Pass 4Pass 8Pass 10
Subgrade, TB2 a = 1.50 mm
Distance (m)
0 2 4 6 8 10 12 14 16 18 20 22 24 26 28 30
CM
V
0
5
10
15
20
25
30
Pass 1Pass 2Pass 4Pass 8
Recycled asphalt special backfill subbaseTB4 Pass 1: a = 1.90 mm; Passes 2 to 8 = 1.50 mm
Distance (m)
0 2 4 6 8 10 12 14 16 18 20 22 24 26 28 30
CM
V
0
5
10
15
20
25
30
Pass 1Pass 2Pass 4Pass 8Pass 10
Recycled PCC BaseTB9; a = 1.60 mm

6
Data for compaction growth curves of roller CMV measure-ments and in situ (ELWD-Z3) and dry density measurements with increasing pass on subgrade, subbase and base layers were collected (Figure 12). Correlations obtained from various test beds between roller CMV and ELWD-Z3 and γd in situ test mea-surements were developed (Figure 13). Correlation between CMV and ELWD-Z3 showed an exponential relationship with R2 = 0.81. No statistically significant relationship was present be-tween γd and CMV. Spatial comparison of CMV maps obtained in low- and high-amplitude settings on a subgrade layer and an overlying subbase layer was developed for a test bed along with DCP-CBR profiles at three select locations with low, me-dium and high CMV measurement values (Figure 14).
Interstate 29 continued from page 5
Easting (m)
31005 31010N
orth
ing
(m)
17480
17500
17520
17540
17560
Easting (m)
31005 31010
0 5 10 15 20 25 30
CMV
a = 2.00 mma = 1.60 mm
SUBGRADE (TB6)
Easting (m)
31005 31010
17480
17500
17520
17540
17560
Easting (m)
31005 31010
a = 2.00 mma = 1.60 mm
SPECIAL BACKFILLSUBBASE (TB7)
In-Situ Test Locations
(1)
(2)
(3)
(4)
(5)
(1)
(2)
(3)
(4)
(5)
CBR (%)
0 5 10 15 20 25 30
Dep
th
0
200
400
600
800
1000
CBR (%)
0 5 10 15 20 25 300
200
400
600
800
1000
CBR (%)
0 5 10 15 20 25 300
200
400
600
800
1000(1) (2) (3)
Subbase
Subgrade
Subbase
Subgrade Subbase
Subgrade
ELWD-Z3 = 60.9 MPa
ELWD-Z3 = 24.2 MPa ELWD-Z3 = 32.5 MPa
Figure 14 – Spatial comparison of a subgrade layer CMV map overlain by a special backfill subbase layer CMV map and DCP-CBR profiles at three selected locations
Easting (m)
34104 34110
Nor
thin
g (m
)
11980
12000
12020
12040
12060
12080
12100
12120
12140
Easting (m)
34104 34110
0 5 10 15 20 25 30
CMV
Pass 1Avg. a = 2.00 mm
Pass 2Avg. a = 1.60 mm
In-Situ Test Locations
In-Situ Test Locations
Location ofBox Culvert
Figure 15 – (left) Spatial comparison of CMV maps obtained on a test bed with RPCC base layer using low-and high- amplitude settings
Figure 12 – Comparison of CMV, ELWD-Z3, and γd growth curves with increasing pass on subgrade, special backfill sub-base, and RPCC base layer
Pass Number
0 2 4 6 8 10 12 140
5
10
15
20
25
30
Pass Number
0 2 4 6 8 10 12 140
20
40
60
80Subgrade, TB2 a = 1.50 mm
Pass Number
0 2 4 6 8 10 12 1414
16
18
20
22Avg. w = 20.1%
Pass Number
0 2 4 6 8 100
5
10
15
20
25
30
Pass Number
0 2 4 6 8 100
20
40
60
80Recycled asphalt special backfill subbaseTB4 a = 1.50 mm
Pass Number
Pass NumberPass NumberPass Number
Pass Number
0 2 4 6 8 10
Ave
rage
γd (k
N/m
3 )A
vera
ge γ
d (k
N/m
3 )
14
16
18
20
22
Avg. w = 8.4%
a =1.90 mm
Pass Number
0 2 4 6 8 10 120
5
10
15
20
25
30
Pass Number
0 2 4 6 8 10 120
20
40
60
80Recycled PCC Base; TB9; a = 1.60 mm
Pass NumberPass Number
Ave
rage
CM
VA
vera
ge C
MV
Ave
rage
CM
V
Ave
rage
ELW
D-Z
3 (M
Pa)
Ave
rage
ELW
D-Z
3 (M
Pa)
Ave
rage
ELW
D-Z
3 (M
Pa)
Figure 13 – Correlations between roller-integrated CMV and in situ point measurements (ELWD-Z3 and γd ) from subgrade, special backfill subbase and aggregate base layers
ELWD-Z3 (MPa)
0 10 20 30 40 50 600
5
10
15
20
25
30TB2 (Subgrade)TB4 (Subbase)TB9 (Recycled Base)TB11 (Virgin Base)
CMV = e(0.06 ELWD-Z3)
R2 = 0.81n = 95
γd (kN/m3)
12 14 16 18 20 22 240
5
10
15
20
25
30
TB2 (Subgrade)TB4 (Subbase)TB9 (Recycled Base)TB11 (Virgin Base)
CM
VC
MV
ELWD-Z3 (MPa)
0 10 20 30 40 50 600
5
10
15
20
25
30TB2 (Subgrade)TB4 (Subbase)TB9 (Recycled Base)TB11 (Virgin Base)
CMV = e(0.06 ELWD-Z3)
R2 = 0.81n = 95
γd (kN/m3)
12 14 16 18 20 22 240
5
10
15
20
25
30
TB2 (Subgrade)TB4 (Subbase)TB9 (Recycled Base)TB11 (Virgin Base)
CM
VC
MV
The CBR profiles, ELWD-Z3 measurements at the DCP test locations correspond well with variations in CMV at these test locations. CMV spatial maps were developed in low-and high-ampli-tude settings on a RPCC base layer (Figure 15). The test bed consisted of a buried box culvert beneath the base layer that was clearly identified with high CMV measurement values.
7
U.S. 218 Coralville, Iowa – HMA overlay construction
This demonstration project was located on U.S. 218 south of I-80 in Coralville, Iowa. The project involved construction of HMA over the existing PCC surface. The HMA-base course layer was compacted using two Sakai dual-drum rollers in the breakdown position. Of the two rollers, one Sakai roller was equipped with an IC-monitoring system. The compaction monitoring system monited roller coverage (i.e., number of passes) and IC measure-ment values (Sakai CCV), and displayed data in real time on the onboard display monitor located in front of the roller operator. A temperature sensor was present on the roller and linked to GPS measurements to provide a continuous record of the temperature of the asphalt surface. The ISU research team was present onsite periodically during paving operations from Aug. 31, 2009, through Sept. 2, 2009 (Figure 16). Day 1: The compaction monitoring system on the roller was switched on, but the onboard display monitor was closed for viewing by the operator. Days 2 and 3: The roller operator was allowed to use the
Figure 17 – FLIR thermal images: in front of paver (top left), in front of breakdown roller (top right), behind water truck during finish rolling (bot-tom left), and nuclear gauge testing on the final compacted surface (bottom right)
U.S. 218 continued on page 8
Figure 16 – Paving operations
onboard display to aid uniform roller-pass coverage. Then they were asked to perform four passes (two forward and two reverse). The two Sakai rollers on the project generally followed each other, resulting in a total of eight roller passes (compaction monitoring was available on only one roller). Day 3: In situ relative compaction was obtained using a nucleardensitygauge,modulustestingusingKUABFWD,andasphalt mat temperature measurements using a thermal imag-ing camera provided by the Iowa DOT and infrared camera mounted on the FWD trailer. Measurements were obtained on mainline and paving over the existing shoulder lane. Correlations between roller CCV measurements and in situ relative compac-tion and FWD modulus (EFWD-K3) values have been developed. FLIRthermalimagesshowingspatialvariationintheasphaltsurface temperatures were taken (Figure 17) and roller-pass coverage maps from day one and two were created.
8
U.S. 218 continued from page 7
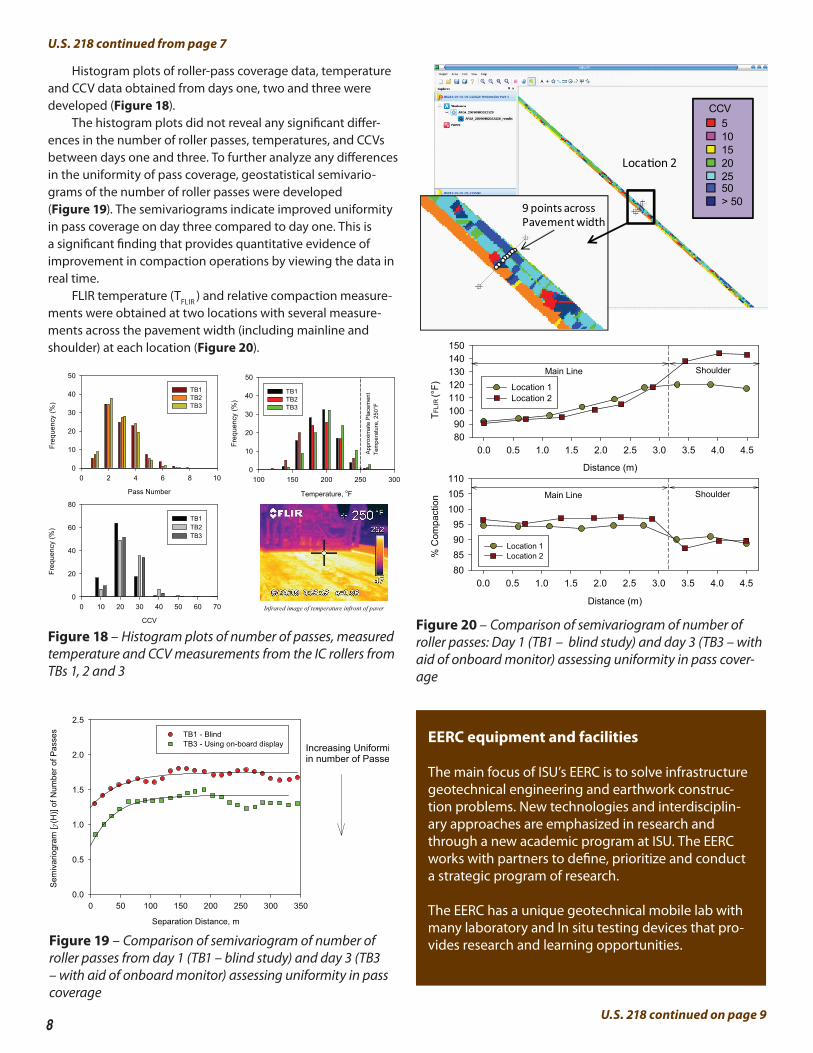
Histogram plots of roller-pass coverage data, temperature and CCV data obtained from days one, two and three were developed (Figure 18). The histogram plots did not reveal any significant differ-ences in the number of roller passes, temperatures, and CCVs between days one and three. To further analyze any differences in the uniformity of pass coverage, geostatistical semivario-grams of the number of roller passes were developed (Figure 19). The semivariograms indicate improved uniformity in pass coverage on day three compared to day one. This is a significant finding that provides quantitative evidence of improvement in compaction operations by viewing the data in real time. FLIRtemperature(TFLIR) and relative compaction measure-ments were obtained at two locations with several measure-ments across the pavement width (including mainline and shoulder) at each location (Figure 20).
Pass Number
0 2 4 6 8 10
Freq
uenc
y (%
)
0
10
20
30
40
50
TB1TB2TB3
Temperature, oF
100 150 200 250 300
Freq
uenc
y (%
)
0
10
20
30
40
50
TB1TB2TB3
CCV
0 10 20 30 40 50 60 70
Freq
uenc
y (%
)
0
20
40
60
80
TB1TB2TB3
App
roxi
mat
e P
lace
men
t Te
mpe
ratu
re, 2
50°F
Infrared image of temperature infront of paver
Figure 18 – Histogram plots of number of passes, measured temperature and CCV measurements from the IC rollers from TBs 1, 2 and 3
Figure 20 – Comparison of semivariogram of number of roller passes: Day 1 (TB1 – blind study) and day 3 (TB3 – with aid of onboard monitor) assessing uniformity in pass cover-age
EERC equipment and facilities
The main focus of ISU’s EERC is to solve infrastructure geotechnical engineering and earthwork construc-tion problems. New technologies and interdisciplin-ary approaches are emphasized in research and through a new academic program at ISU. The EERC works with partners to define, prioritize and conduct a strategic program of research.
The EERC has a unique geotechnical mobile lab with many laboratory and In situ testing devices that pro-vides research and learning opportunities.
U.S. 218 continued on page 9
51015202550> 50
CCV
9 points acrossPavement width
Loca�on 2
0.0 0.5 1.0 1.5 2.0 2.5 3.0 3.5 4.0 4.5TF
LIR
(°F)
8090
100110120130140150
Location 1Location 2
Distance (m)
0.0 0.5 1.0 1.5 2.0 2.5 3.0 3.5 4.0 4.5
% C
ompa
ctio
n
80859095
100105110
Location 1Location 2
Main Line Shoulder
Main Line Shoulder
Distance (m)
Figure 19 – Comparison of semivariogram of number of roller passes from day 1 (TB1 – blind study) and day 3 (TB3 – with aid of onboard monitor) assessing uniformity in pass coverage
Separation Distance, m
0 50 100 150 200 250 300 350
Sem
ivar
iogr
am [γ
(H)]
of N
umbe
r of P
asse
s
0.0
0.5
1.0
1.5
2.0
2.5
TB1 - BlindTB3 - Using on-board display Increasing Uniformity
in number of Passes

EFWD-K3 (MPa)
0 500 1000 1500 2000
CC
V
0
10
20
30
40CCV = 8.0 + 0.01 (EFWD-K3)R2 = 0.80, n = 48
Percent Compaction
80 85 90 95 100 105 110
CC
V
0
10
20
30
40CCV = -63.1 + 0.83 (% compaction)R2 = 0.37, n = 48
Shoulder
Mainline
Shoulder
Mainline
9
Figure 21 – Comparison of CCV, percent compaction, EFWD-K3, and TFLIR along shoulder and mainline
Figure 22 – Correlations between CCV, EFWD-K3 and percent compaction
0 100 200 300 400 500 600 700 800 900 1000 1100 1200 1300
% C
ompa
ctio
n
85
90
95
100
105
110ShoulderMainline
0 100 200 300 400 500 600 700 800 900 1000 1100 1200 13000
400
800
1200
1600
ShoulderMainline
0 100 200 300 400 500 600 700 800 900 1000 1100 1200 13008090
100110120130140150
ShoulderMainline
Average from field cores, 96.7%
Distance (m)
0 100 200 300 400 500 600 700 800 900 1000 1100 1200 1300
CC
V
0
10
20
30
40
50
ShoulderMainline
CCV spatially paired to in-situ test location
TFLI
R (°
F)TF
LIR
(°F)
T FLI
R (°
F)E
LWD
-Z3 (M
Pa)
U.S. 218 continued from page 8
Relative compaction, EFWD-K3, and TFLIR in situ test measure-ments (Figure 21) were obtained at several locations along a stretch of about 1.3 km on the mainline and shoulder and compared with roller CCV measurements. Results presented in figures 20 and 21 indicate that the density, modulus and roller-measured CCV were all lower on the shoulder compared to the mainline. This is likely because of comparatively weak support conditions under the shoulder compared to the mainline. Correlations between CCV, relative compaction and EFWD-K3 were developed (Figure 22). Correlation between CCV and EFWD-K3 showed strong linear regression relationship (with R2 equal to 0.8) compared to correlation between CCV and rela-tive compaction (with R2 equal to 0.4). This is expected as CCV is a result of drum response under vibratory loading that is a measure of the stiffness and not necessarily related to the density of the material.
EFWD-K3 (MPa)
0 500 1000 1500 2000
CC
V
0
10
20
30
40CCV = 8.0 + 0.01 (EFWD-K3)R2 = 0.80, n = 48
Percent Compaction
80 85 90 95 100 105 110
CC
V
0
10
20
30
40CCV = -63.1 + 0.83 (% compaction)R2 = 0.37, n = 48
Shoulder
Mainline
Shoulder
Mainline
Inaddition,variousotherfactorsinfluencebothrollerandin situ test measurements, including: a) differences in underly-ingsupportconditions;b)differencesinmeasurementinflu-ence depths of each device; c) temperature at the time of the measurement; and d) direction of roller travel. Theinfluenceofdifferencesinunderlyingsupportcondi-tionsisclearlyreflectedwithdatagroupingsincorrelationsshown in Tables 1 and 2 on the next page.
10
Overview of Iowa DOT IC specifications
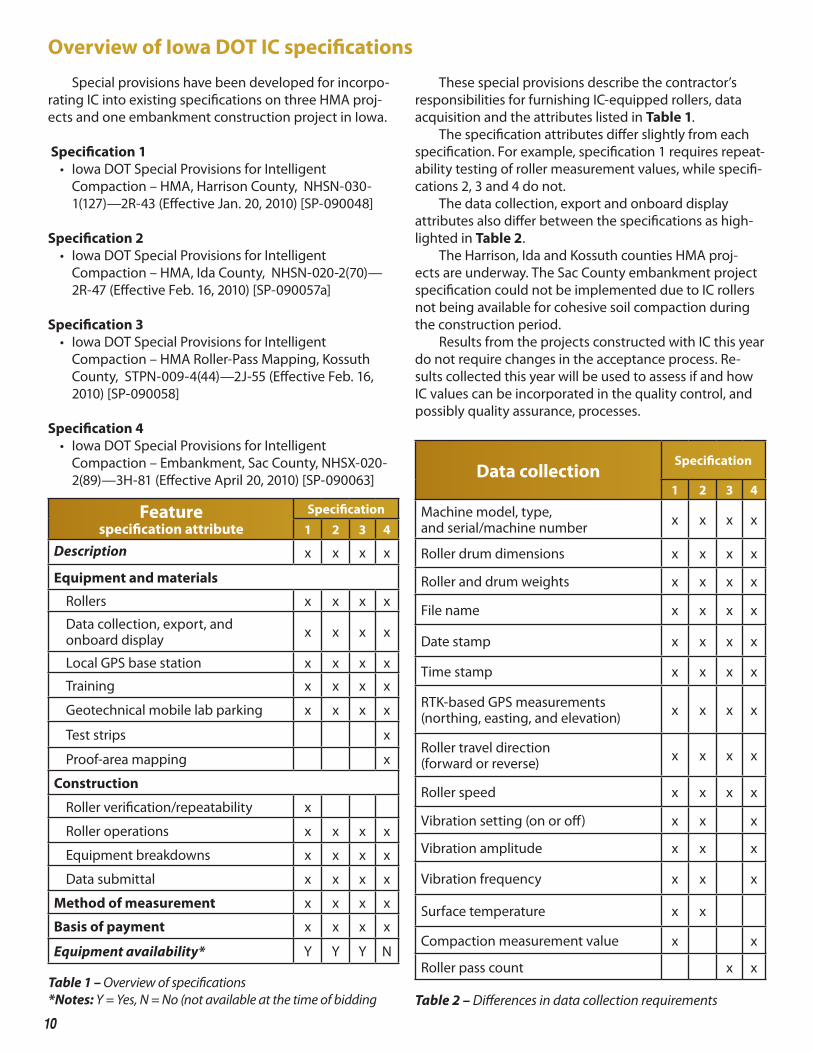
Special provisions have been developed for incorpo-rating IC into existing specifications on three HMA proj-ects and one embankment construction project in Iowa.
Specification 1 • IowaDOTSpecialProvisionsforIntelligent Compaction – HMA, Harrison County, NHSN-030- 1(127)—2R-43 (Effective Jan. 20, 2010) [SP-090048]
Specification 2 • IowaDOTSpecialProvisionsforIntelligent Compaction – HMA, Ida County, NHSN-020-2(70)— 2R-47 (Effective Feb. 16, 2010) [SP-090057a]
Specification 3 • IowaDOTSpecialProvisionsforIntelligent Compaction–HMARoller-PassMapping,Kossuth County, STPN-009-4(44)—2J-55 (Effective Feb. 16, 2010) [SP-090058]
Specification 4 • IowaDOTSpecialProvisionsforIntelligent Compaction – Embankment, Sac County, NHSX-020- 2(89)—3H-81 (Effective April 20, 2010) [SP-090063]
These special provisions describe the contractor’s responsibilities for furnishing IC-equipped rollers, data acquisition and the attributes listed in Table 1. The specification attributes differ slightly from each specification. For example, specification 1 requires repeat-ability testing of roller measurement values, while specifi-cations 2, 3 and 4 do not. The data collection, export and onboard display attributes also differ between the specifications as high-lighted in Table 2. TheHarrison,IdaandKossuthcountiesHMAproj-ects are underway. The Sac County embankment project specification could not be implemented due to IC rollers not being available for cohesive soil compaction during the construction period. Results from the projects constructed with IC this year do not require changes in the acceptance process. Re-sults collected this year will be used to assess if and how IC values can be incorporated in the quality control, and possibly quality assurance, processes.
Data collectionSpecification
1 2 3 4
Machine model, type, and serial/machine number x x x x
Roller drum dimensions x x x x
Roller and drum weights x x x x
File name x x x x
Date stamp x x x x
Time stamp x x x x
RTK-basedGPSmeasurements(northing, easting, and elevation) x x x x
Roller travel direction (forward or reverse) x x x x
Roller speed x x x x
Vibration setting (on or off) x x x
Vibration amplitude x x x
Vibration frequency x x x
Surface temperature x x
Compaction measurement value x x
Roller pass count x x
Table 2 – Differences in data collection requirements
Featurespecification attribute
Specification
1 2 3 4
Description x x x x
Equipment and materials
Rollers x x x x
Data collection, export, and onboard display x x x x
LocalGPSbasestation x x x x
Training x x x x
Geotechnical mobile lab parking x x x x
Test strips x
Proof-area mapping x
Construction
Roller verification/repeatability x
Roller operations x x x x
Equipment breakdowns x x x x
Data submittal x x x x
Method of measurement x x x x
Basis of payment x x x x
Equipment availability* Y Y Y N
Table 1 – Overview of specifications *Notes: Y = Yes, N = No (not available at the time of bidding
11
Some recent IC-related publications from EERCMore than 50 technical articles were published on IC-related research from EERC. Some selected recent publications are listed below.
About the Authors
Dr. David J. White is the director of the EERC at ISU and an associate professor in the department of civil, construction and environmental engineering.
Dr. Pavana Vennapusa is a research assistant professor at ISU’s depart-ment of civil, construction and envi-ronmental engineering.
Mr. Heath Gieselman is a research scientist at the EERC, and manages laboratory and field testing and the ISU’s geotechnical mobile laboratory.
White, D.J., Vennapusa, P. (2010) Report of the Webinar Workshop on Intelligent Compaction for Earthworks and HMA, EERC Publication ER10-02, Earthworks Engineering Research Center, Iowa State University, Ames, Iowa.
Mooney, M., Rinehart, R., White, D.J., Vennapusa, P., Facas, N., (2010). Intelligent Soil Compaction Systems, NCHRP 21-09 Final Report, National Cooperative Highway Research Program, Wash-ington, D.C. (in print).
Vennapusa, P., White, D.J., Morris, M. (2010). “Geosta-tistical analysis for spatially referenced roller-inte-grated compaction measurements.” Journal of Geo-technical and Geoenvironmental Engineering, ASCE, 136(6), 813-822. White,D.J.,Vennapusa,P.,Zhang,J.,Gieselman,H.,Morris, M. (2009). Implementation of Intelligent Compaction Performance Based Specifications in Minnesota, EERC Publication ER09-03, MN/RC 2009-14, Minnesota Department of Transportation, St. Paul, Minn.

PM 864 10-5-10
The Research and Technology Bureau enhances the Iowa DOT’s ability to deliver efficient and effective transporta-tion services by actively promoting research partnerships, knowledge and technology transfer, intelligent transpor-tation systems and information technology.
For more information, see http://www.iowadot.gov/operationsresearch
or contact Mary Starr at 515-239-1590.IowaDOT,800LincolnWay,Ames,IA50010
Federal and state laws prohibit employment and/or public accommodation discrimination on the basis of age, color, creed, disability, gender identity, national origin, pregnancy, race, religion, sex, sexual orientation or veteran’s status. If you believe you have been discriminated against, please contact the Iowa Civil Rights Commission at 800-457-4416 or Iowa Department of Transportation’s affirmative action officer. If you need accommodations because of a disability to access the Iowa Department of Transportation’s services, contact the agency’s affirmative action officer at 800-262-0003.
Iowa DOT Research and Technology Bureaureleases two new project videos.
All videos can be viewed at www.iowadot.gov/research/video/videogallery.html.New videos are also posted at www.iowadot.gov/research/index.htm.
NEW
VIDEOS
ONLINE!
Nondestructive bridge deck evaluationThis video presents collaborative efforts between Iowa DOT and Rutgers University to investigate non-destructive bridge testing methods and technologies that save valuable resources, time and project funds.
Intelligent compaction (IC) techniques for quality permanent foundationsThis short video highlights recent evaluations of IC systems research to develop better construction methods, improve pavement performance over time and extend pavement life.
Visit the Research and Technology Bureau’s home page at www.iowadot.gov/research/index.htm
for more research project news.