iowa’s juvenile justice system improvement planning … girls justice initiative iowa model work...
TRANSCRIPT
November 6, 2017
Presenters:
• Joshua Weber, Program Director, CSG Justice Center
• Elizabeth Seigle, Project Manager, CSG Justice Center
• Emily Rogers, Senior Research Associate, CSG Justice Center
• Gina Vincent, President, National Youth Screening and
Assessment Project
• Michael Umpierre, Senior Research Fellow, Center for
Juvenile Justice Reform
Iowa’s Juvenile Justice System Improvement Planning Grant
Key Findings from System Analysis
This project was supported by Grant Number 2016-ZB-BX-K002 awarded by the Office of Juvenile Justice and Delinquency Prevention, Office of Justice Programs, U.S. Department of Justice. The opinions, findings, and conclusions or recommendations expressed in this presentation are those of the author(s) and do not necessarily reflect those of the Department of Justice.
About the CSG Justice Center
The Council of State Governments Justice Center | 2
Provides practical, nonpartisan, research-driven
strategies and tools to increase public safety
and strengthen communities
National nonprofit, nonpartisan membership
association of state government officials that
engages members of all three branches of
state government
Background
Next Steps
03
01
04
Key Findings
• Supervision
• Service Delivery
• Disparities
02 System Performance
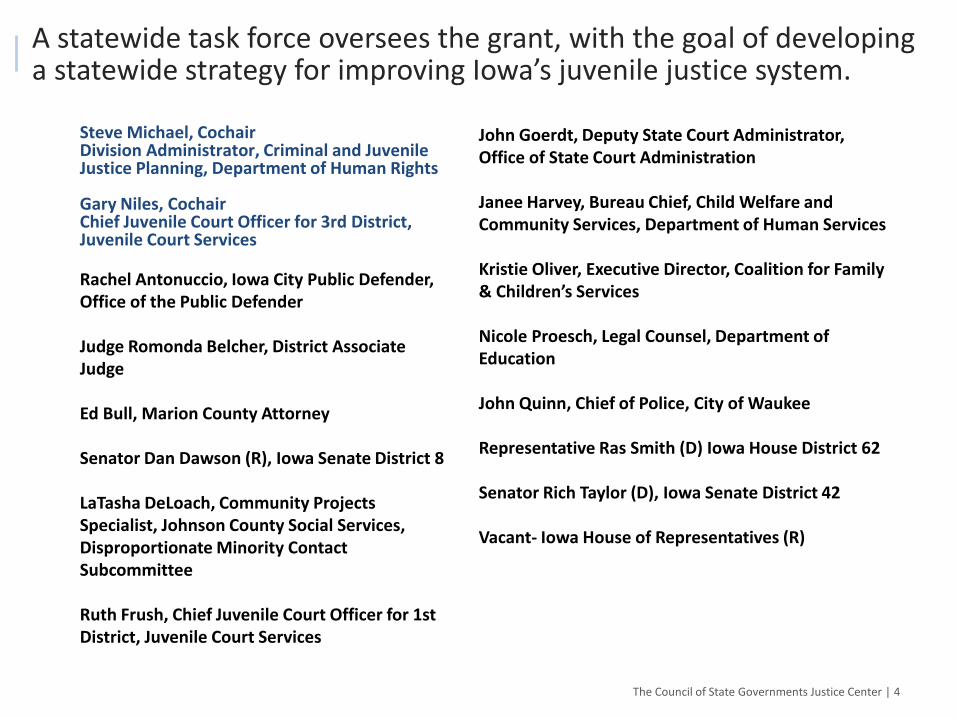
A statewide task force oversees the grant, with the goal of developing a statewide strategy for improving Iowa’s juvenile justice system.
The Council of State Governments Justice Center | 4
Steve Michael, CochairDivision Administrator, Criminal and Juvenile Justice Planning, Department of Human Rights
Gary Niles, CochairChief Juvenile Court Officer for 3rd District, Juvenile Court Services
Rachel Antonuccio, Iowa City Public Defender, Office of the Public Defender
Judge Romonda Belcher, District Associate Judge
Ed Bull, Marion County Attorney
Senator Dan Dawson (R), Iowa Senate District 8
LaTasha DeLoach, Community Projects Specialist, Johnson County Social Services, Disproportionate Minority Contact Subcommittee
Ruth Frush, Chief Juvenile Court Officer for 1st District, Juvenile Court Services
John Goerdt, Deputy State Court Administrator, Office of State Court Administration
Janee Harvey, Bureau Chief, Child Welfare and Community Services, Department of Human Services
Kristie Oliver, Executive Director, Coalition for Family & Children’s Services
Nicole Proesch, Legal Counsel, Department of Education
John Quinn, Chief of Police, City of Waukee
Representative Ras Smith (D) Iowa House District 62
Senator Rich Taylor (D), Iowa Senate District 42
Vacant- Iowa House of Representatives (R)
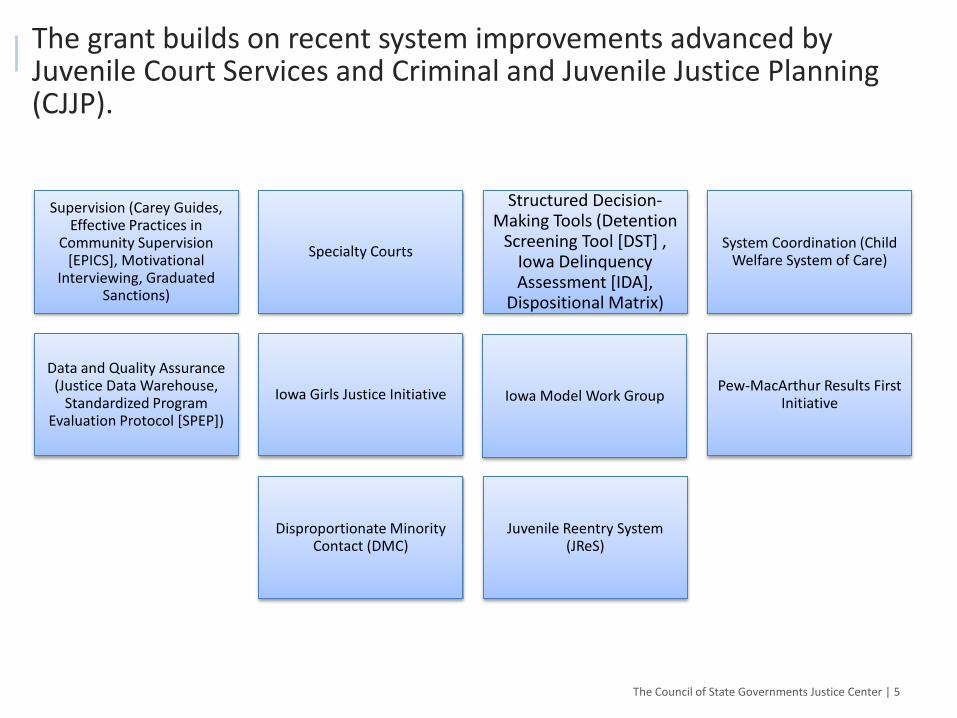
The grant builds on recent system improvements advanced by Juvenile Court Services and Criminal and Juvenile Justice Planning (CJJP).
The Council of State Governments Justice Center | 5
Supervision (Carey Guides, Effective Practices in
Community Supervision [EPICS], Motivational
Interviewing, Graduated Sanctions)
Specialty Courts
Structured Decision-Making Tools (Detention
Screening Tool [DST] , Iowa Delinquency Assessment [IDA],
Dispositional Matrix)
System Coordination (Child Welfare System of Care)
Data and Quality Assurance (Justice Data Warehouse,
Standardized Program Evaluation Protocol [SPEP])
Iowa Girls Justice Initiative Iowa Model Work Group Pew-MacArthur Results First
Initiative
Disproportionate Minority Contact (DMC)
Juvenile Reentry System (JReS)
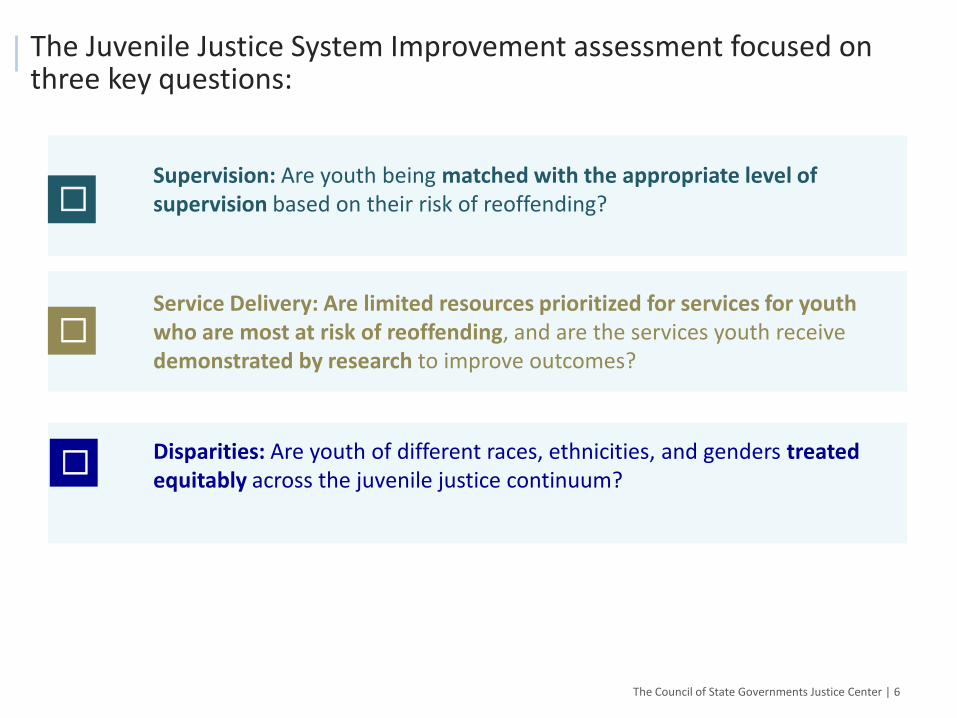
The Juvenile Justice System Improvement assessment focused on three key questions:
The Council of State Governments Justice Center | 6
☐Supervision: Are youth being matched with the appropriate level of supervision based on their risk of reoffending?
Service Delivery: Are limited resources prioritized for services for youth who are most at risk of reoffending, and are the services youth receive demonstrated by research to improve outcomes?
☐ Disparities: Are youth of different races, ethnicities, and genders treated equitably across the juvenile justice continuum?
☐
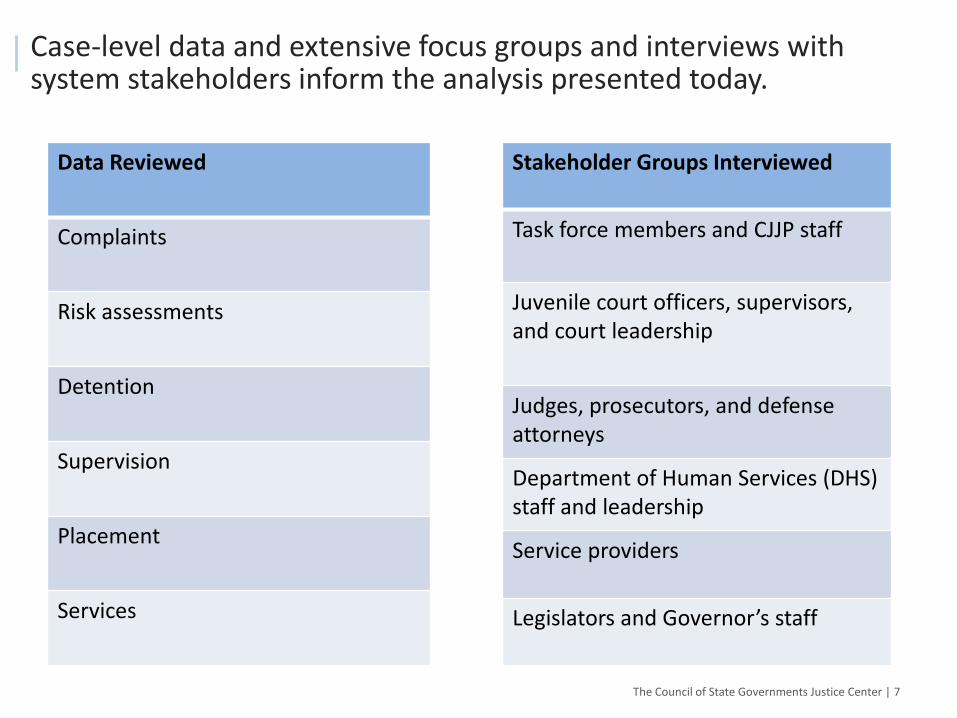
Case-level data and extensive focus groups and interviews with system stakeholders inform the analysis presented today.
The Council of State Governments Justice Center | 7
Data Reviewed
Complaints
Risk assessments
Detention
Supervision
Placement
Services
Stakeholder Groups Interviewed
Task force members and CJJP staff
Juvenile court officers, supervisors, and court leadership
Judges, prosecutors, and defense attorneys
Department of Human Services (DHS) staff and leadership
Service providers
Legislators and Governor’s staff
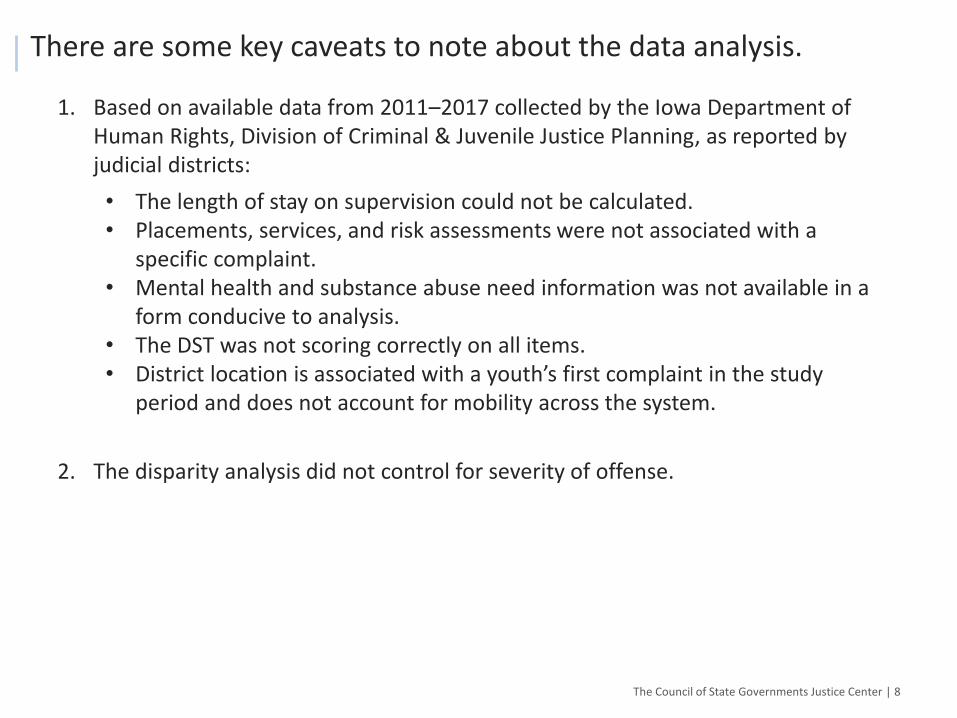
There are some key caveats to note about the data analysis.
The Council of State Governments Justice Center | 8
1. Based on available data from 2011–2017 collected by the Iowa Department of Human Rights, Division of Criminal & Juvenile Justice Planning, as reported by judicial districts:
• The length of stay on supervision could not be calculated. • Placements, services, and risk assessments were not associated with a
specific complaint.• Mental health and substance abuse need information was not available in a
form conducive to analysis. • The DST was not scoring correctly on all items.• District location is associated with a youth’s first complaint in the study
period and does not account for mobility across the system.
2. The disparity analysis did not control for severity of offense.
Background
Next Steps
03
01
04
Key Findings
• Supervision
• Service Delivery
• Disparities
02 System Performance
10
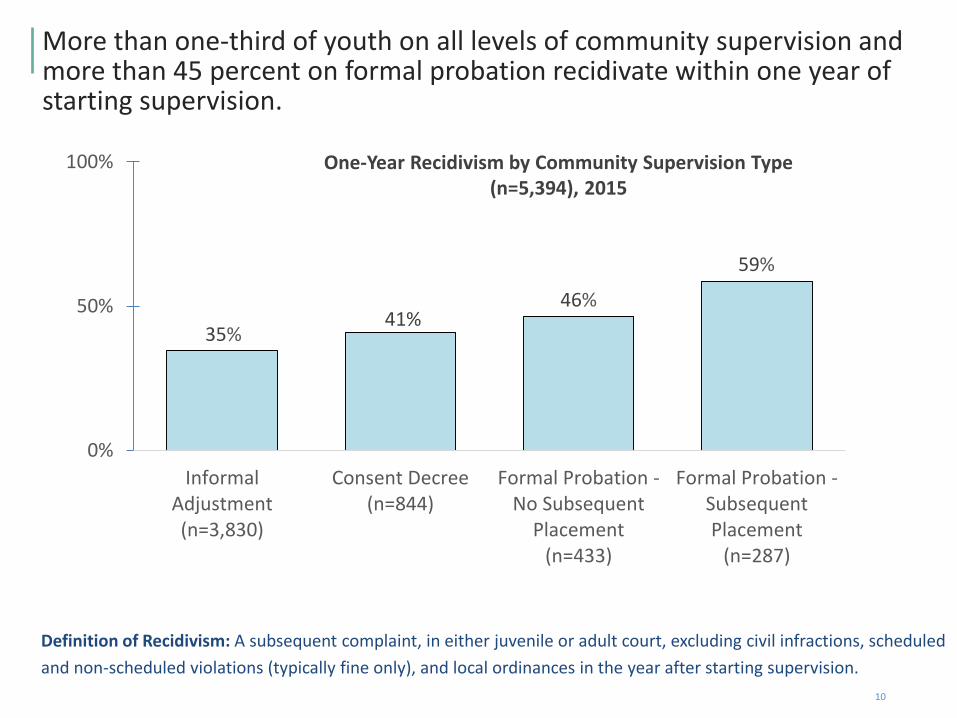
More than one-third of youth on all levels of community supervision and more than 45 percent on formal probation recidivate within one year of starting supervision.
0%
50%
100%
InformalAdjustment(n=3,830)
Consent Decree(n=844)
Formal Probation -No Subsequent
Placement(n=433)
Formal Probation -SubsequentPlacement
(n=287)
35%41%
59%
46%
One-Year Recidivism by Community Supervision Type (n=5,394), 2015
Definition of Recidivism: A subsequent complaint, in either juvenile or adult court, excluding civil infractions, scheduled
and non-scheduled violations (typically fine only), and local ordinances in the year after starting supervision.
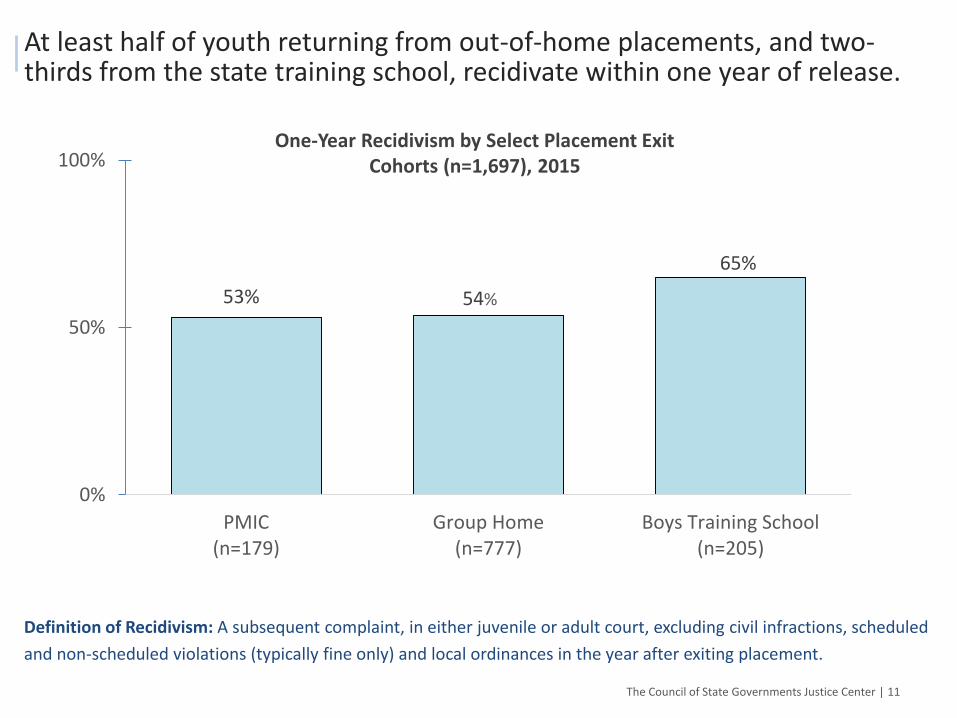
At least half of youth returning from out-of-home placements, and two-thirds from the state training school, recidivate within one year of release.
One-Year Recidivism by Select Placement Exit Cohorts (n=1,697), 2015
0%
50%
100%
PMIC(n=179)
Group Home(n=777)
Boys Training School(n=205)
54%
65%
Definition of Recidivism: A subsequent complaint, in either juvenile or adult court, excluding civil infractions, scheduled
and non-scheduled violations (typically fine only) and local ordinances in the year after exiting placement.
The Council of State Governments Justice Center | 11
53%
Background
Next Steps
03
01
04
Key Findings
• Supervision
• Service Delivery
• Disparities
02 System Performance
The Council of State Governments Justice Center | 13
Noteworthy efforts are underway to match youth to the most appropriate level of supervision based on their risk of reoffending. The degree to which this matching occurs
varies across districts. Additionally, five of the eight districts have experienced an increase in the detention rate and seven districts have experienced an increase in
lengths of stay in detention over the past five years.
☐Are youth being matched with the appropriate level of supervision based on their risk of reoffending?
The Council of State Governments Justice Center | 14
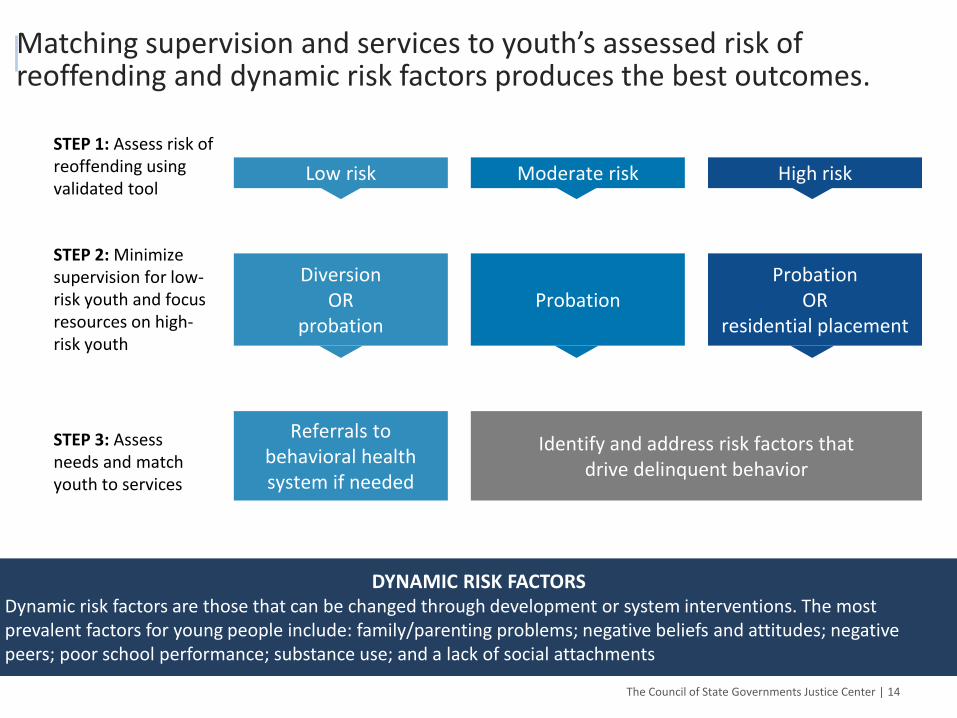
STEP 1: Assess risk of reoffending using validated tool
STEP 2: Minimize supervision for low-risk youth and focus resources on high-risk youth
STEP 3: Assess needs and match youth to services
Low risk
Diversion OR
probation
Referrals to behavioral health system if needed
Moderate risk
Probation
High risk
Probation OR
residential placement
Identify and address risk factors that drive delinquent behavior
DYNAMIC RISK FACTORSDynamic risk factors are those that can be changed through development or system interventions. The most prevalent factors for young people include: family/parenting problems; negative beliefs and attitudes; negative peers; poor school performance; substance use; and a lack of social attachments
Matching supervision and services to youth’s assessed risk of reoffending and dynamic risk factors produces the best outcomes.
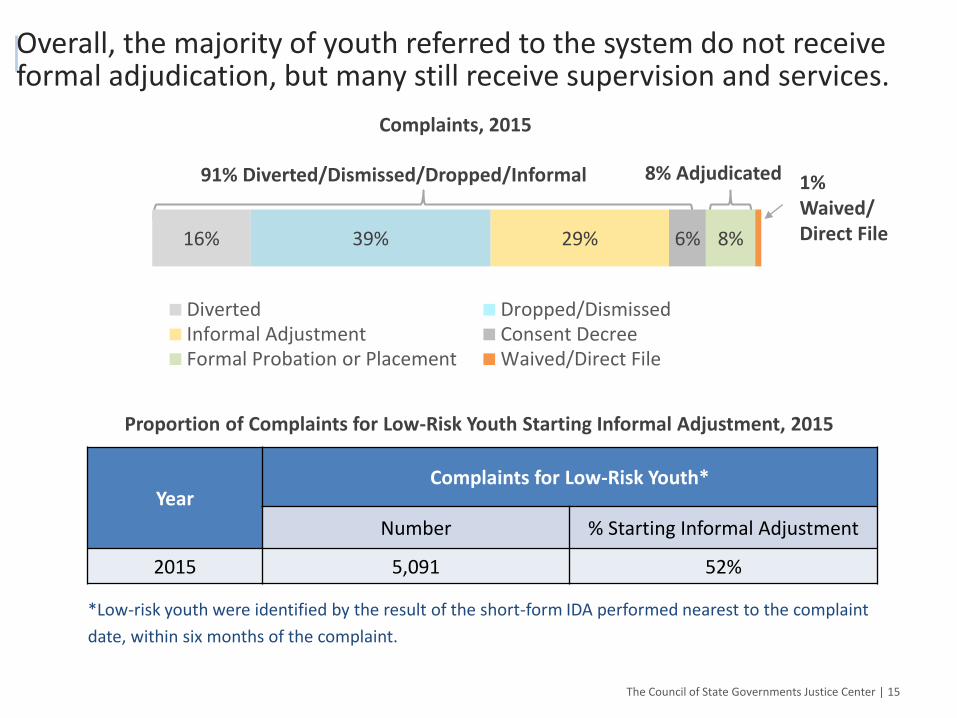
Overall, the majority of youth referred to the system do not receive formal adjudication, but many still receive supervision and services.
The Council of State Governments Justice Center | 15
Complaints, 2015
91% Diverted/Dismissed/Dropped/Informal 8% Adjudicated
16% 39% 29% 6% 8%
Diverted Dropped/DismissedInformal Adjustment Consent DecreeFormal Probation or Placement Waived/Direct File
1% Waived/ Direct File
YearComplaints for Low-Risk Youth*
Number % Starting Informal Adjustment
2015 5,091 52%
Proportion of Complaints for Low-Risk Youth Starting Informal Adjustment, 2015
*Low-risk youth were identified by the result of the short-form IDA performed nearest to the complaint
date, within six months of the complaint.
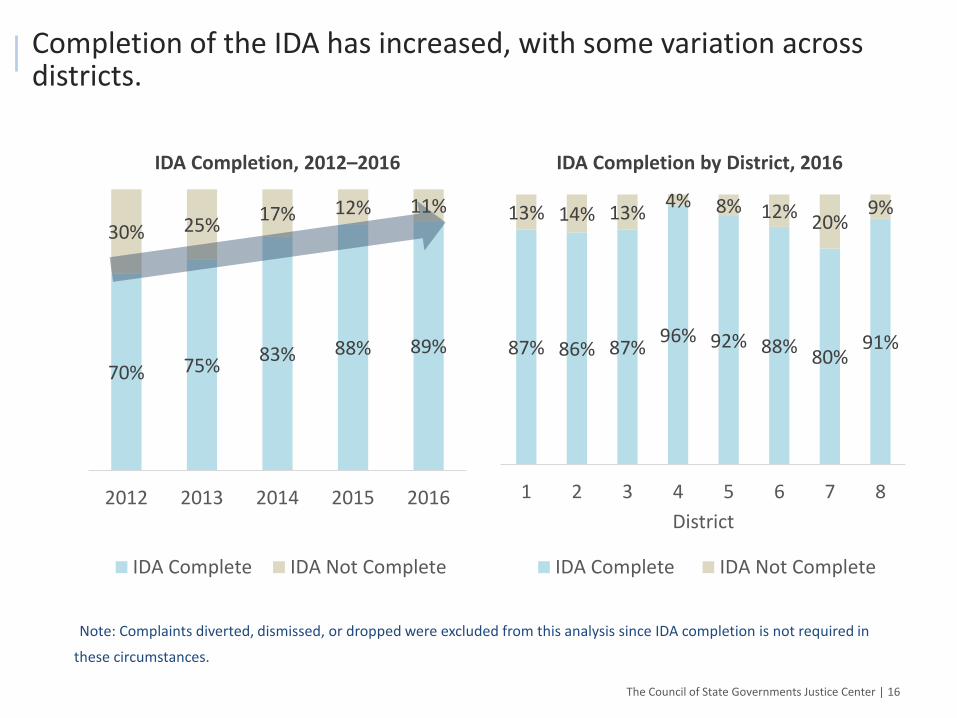
Completion of the IDA has increased, with some variation across districts.
The Council of State Governments Justice Center | 16
70% 75%83% 88% 89%
30% 25%17% 12% 11%
2012 2013 2014 2015 2016
IDA Complete IDA Not Complete
IDA Completion, 2012–2016
87% 86% 87%96% 92% 88%
80%91%
13% 14% 13%4% 8% 12%
20%9%
1 2 3 4 5 6 7 8
District
IDA Complete IDA Not Complete
IDA Completion by District, 2016
Note: Complaints diverted, dismissed, or dropped were excluded from this analysis since IDA completion is not required in
these circumstances.
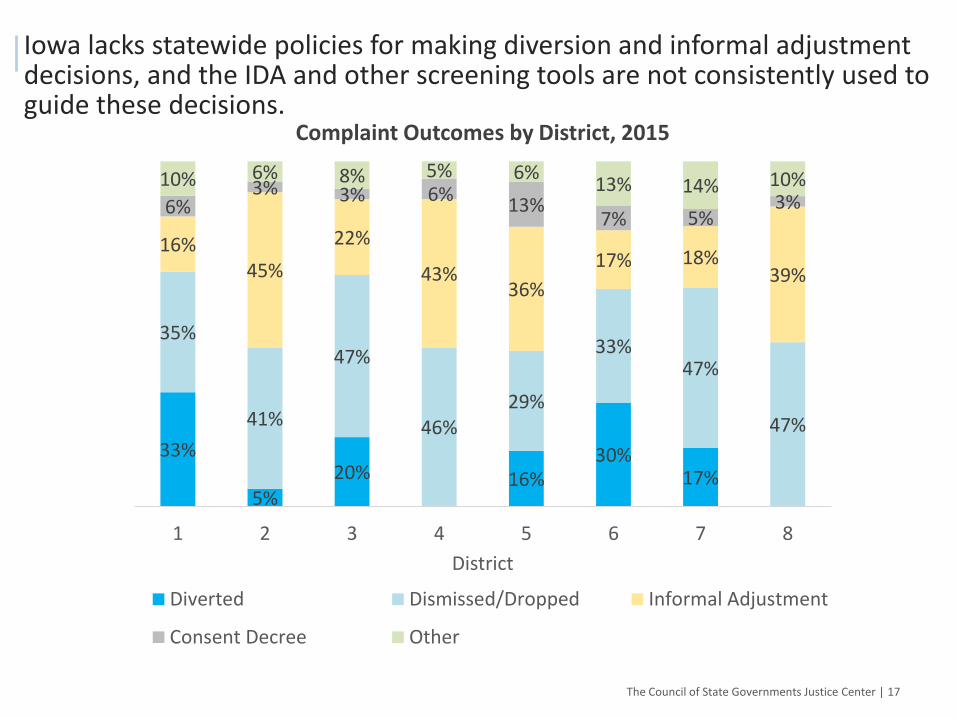
Iowa lacks statewide policies for making diversion and informal adjustment decisions, and the IDA and other screening tools are not consistently used to guide these decisions.
The Council of State Governments Justice Center | 17
Complaint Outcomes by District, 2015
33%
5%20% 16%
30%17%
35%
41%
47%
46%29%
33%47%
47%
16%45%
22%
43%36%
17% 18%39%
6%3% 3% 6%
13%7% 5%
3%10% 6% 8% 5% 6%
13% 14% 10%
1 2 3 4 5 6 7 8
District
Diverted Dismissed/Dropped Informal Adjustment
Consent Decree Other
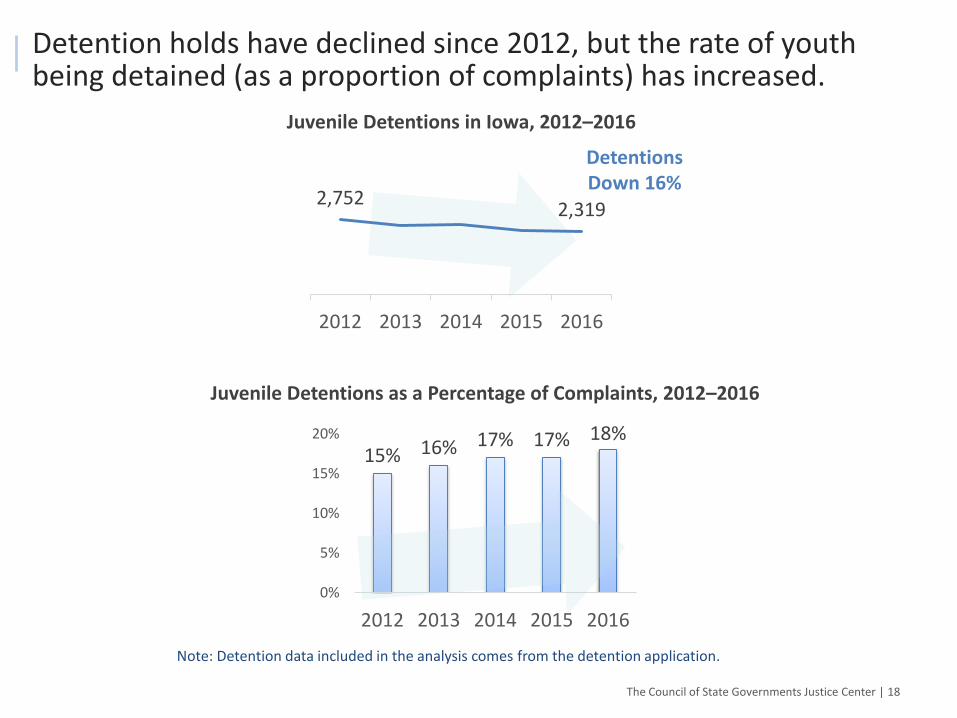
Detention holds have declined since 2012, but the rate of youth being detained (as a proportion of complaints) has increased.
The Council of State Governments Justice Center | 18
Detentions Down 16%
2,7522,319
2012 2013 2014 2015 2016
Juvenile Detentions in Iowa, 2012–2016
15% 16% 17% 17% 18%
0%
5%
10%
15%
20%
2012 2013 2014 2015 2016
Juvenile Detentions as a Percentage of Complaints, 2012–2016
Note: Detention data included in the analysis comes from the detention application.
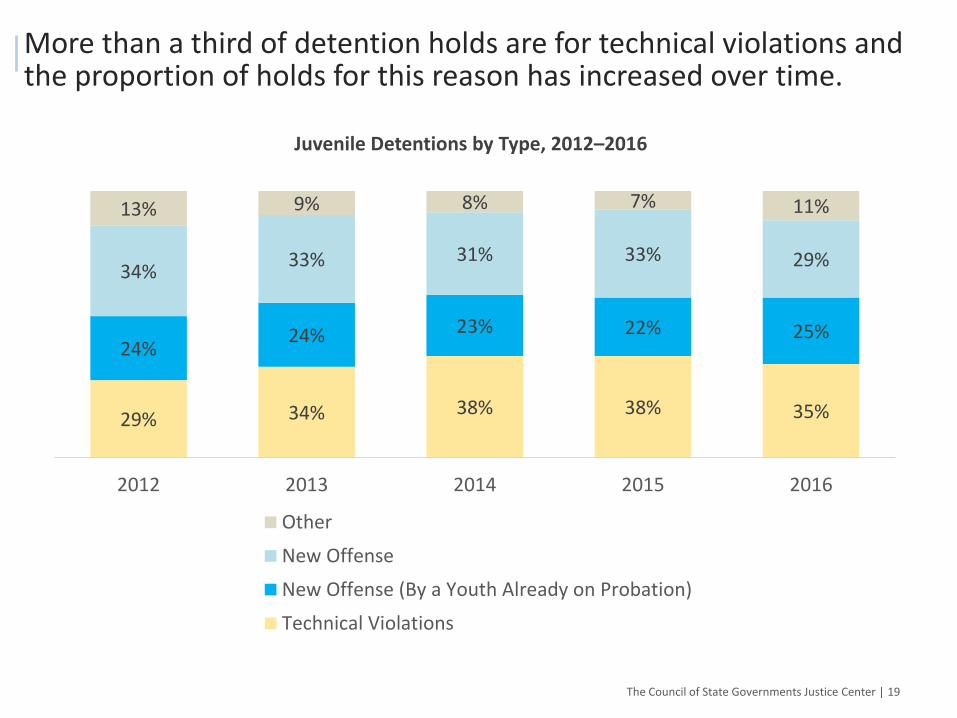
More than a third of detention holds are for technical violations and the proportion of holds for this reason has increased over time.
The Council of State Governments Justice Center | 19
Juvenile Detentions by Type, 2012–2016
29% 34% 38% 38% 35%
24%24% 23% 22% 25%
34%33% 31% 33% 29%
13% 9% 8% 7% 11%
2012 2013 2014 2015 2016
Other
New Offense
New Offense (By a Youth Already on Probation)
Technical Violations
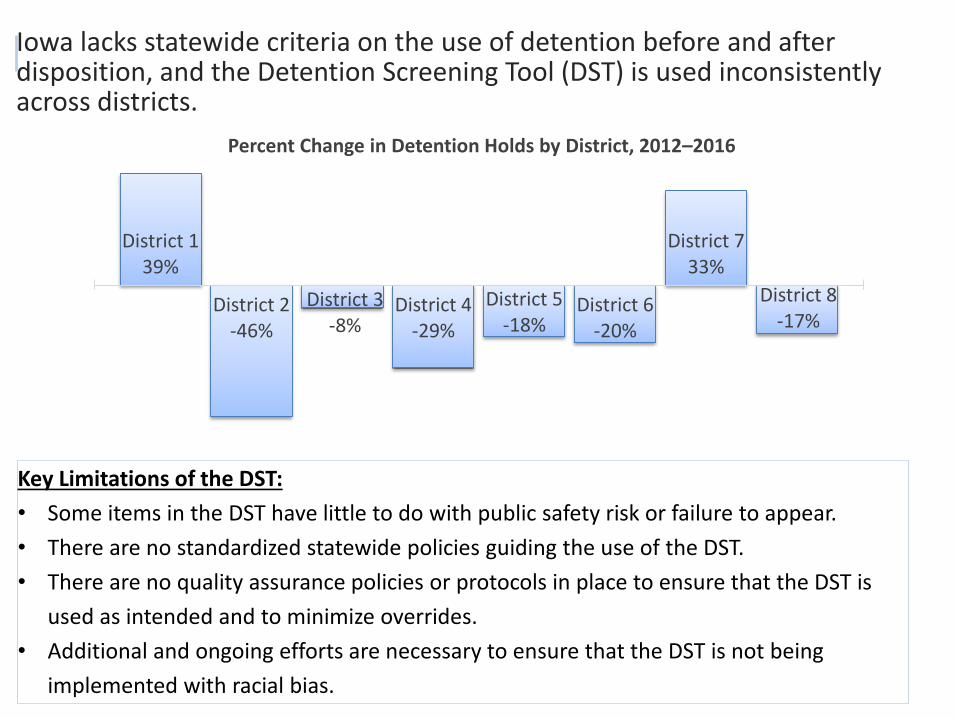
Iowa lacks statewide criteria on the use of detention before and after disposition, and the Detention Screening Tool (DST) is used inconsistently across districts.
Council of State Governments Justice Center | 20
District 139%
District 2-46%
District 3-8%
District 4-29%
District 5-18%
District 6-20%
District 733%
District 8-17%
Percent Change in Detention Holds by District, 2012–2016
Key Limitations of the DST:
• Some items in the DST have little to do with public safety risk or failure to appear.
• There are no standardized statewide policies guiding the use of the DST.
• There are no quality assurance policies or protocols in place to ensure that the DST is
used as intended and to minimize overrides.
• Additional and ongoing efforts are necessary to ensure that the DST is not being
implemented with racial bias.
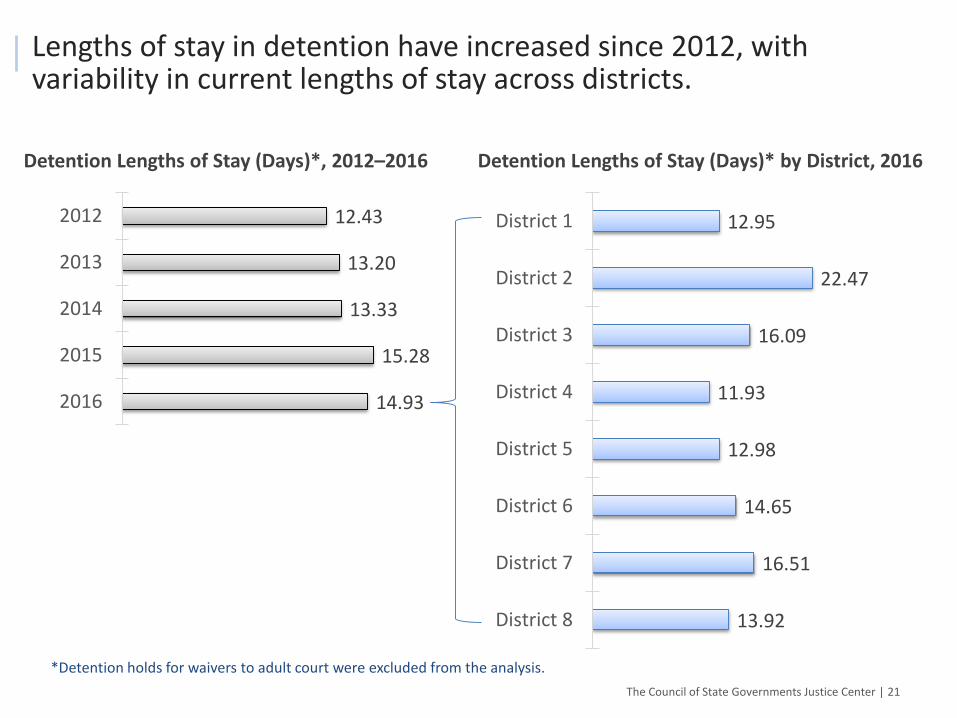
Lengths of stay in detention have increased since 2012, with variability in current lengths of stay across districts.
The Council of State Governments Justice Center | 21
14.93
15.28
13.33
13.20
12.43
2016
2015
2014
2013
2012
13.92
16.51
14.65
12.98
11.93
16.09
22.47
12.95
District 8
District 7
District 6
District 5
District 4
District 3
District 2
District 1
*Detention holds for waivers to adult court were excluded from the analysis.
Detention Lengths of Stay (Days)*, 2012–2016 Detention Lengths of Stay (Days)* by District, 2016
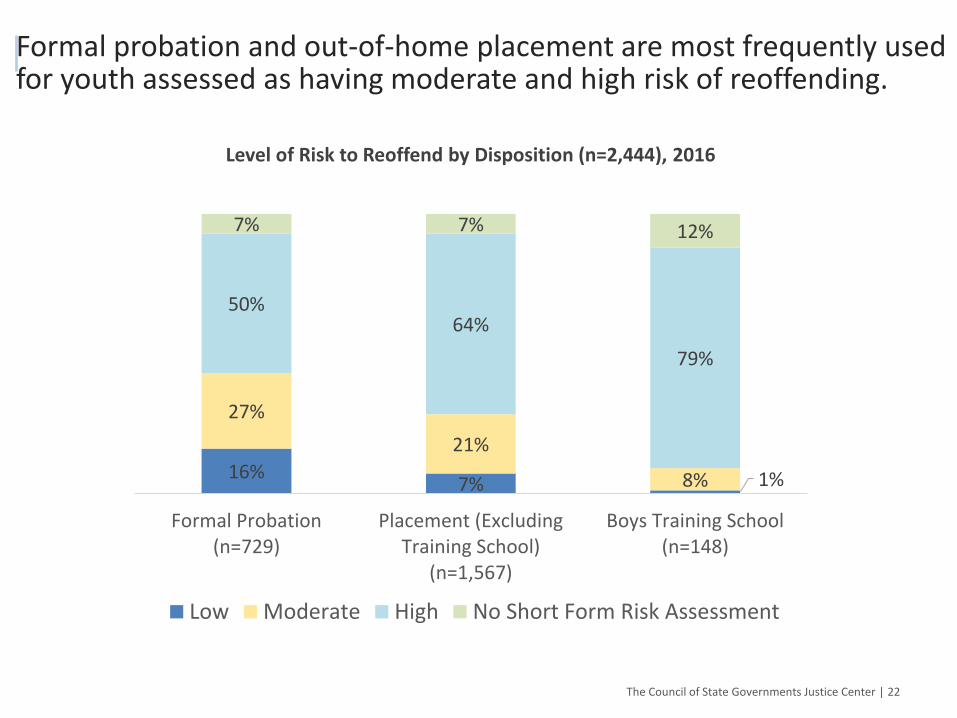
Formal probation and out-of-home placement are most frequently used for youth assessed as having moderate and high risk of reoffending.
The Council of State Governments Justice Center | 22
16%7% 1%
27%
21%
8%
50%64%
79%
7% 7% 12%
Formal Probation(n=729)
Placement (ExcludingTraining School)
(n=1,567)
Boys Training School(n=148)
Low Moderate High No Short Form Risk Assessment
Level of Risk to Reoffend by Disposition (n=2,444), 2016
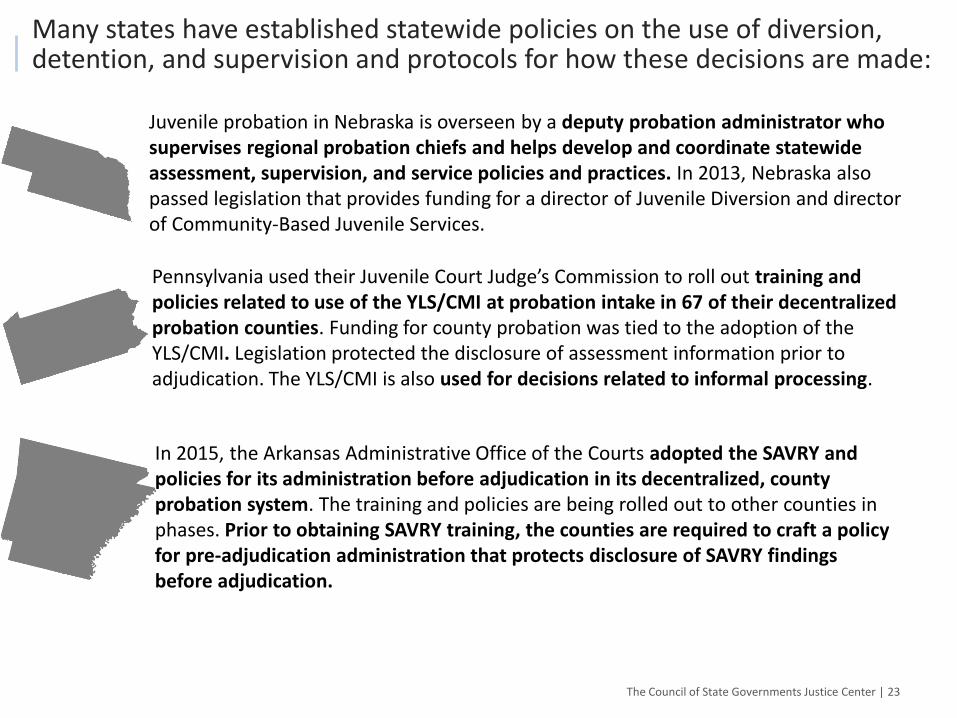
Many states have established statewide policies on the use of diversion, detention, and supervision and protocols for how these decisions are made:
The Council of State Governments Justice Center | 23
Juvenile probation in Nebraska is overseen by a deputy probation administrator who supervises regional probation chiefs and helps develop and coordinate statewide assessment, supervision, and service policies and practices. In 2013, Nebraska also passed legislation that provides funding for a director of Juvenile Diversion and director of Community-Based Juvenile Services.
Pennsylvania used their Juvenile Court Judge’s Commission to roll out training and policies related to use of the YLS/CMI at probation intake in 67 of their decentralized probation counties. Funding for county probation was tied to the adoption of the YLS/CMI. Legislation protected the disclosure of assessment information prior to adjudication. The YLS/CMI is also used for decisions related to informal processing.
In 2015, the Arkansas Administrative Office of the Courts adopted the SAVRY and policies for its administration before adjudication in its decentralized, county probation system. The training and policies are being rolled out to other counties in phases. Prior to obtaining SAVRY training, the counties are required to craft a policy for pre-adjudication administration that protects disclosure of SAVRY findings before adjudication.
There are opportunities to establish statewide policies and practices on the use of diversion, detention, and informal and formal supervision.
1. Hire an administrator of Juvenile Court Services in the State Court Administrator’s Office to coordinate
district practices and serve as a single point of contact for collaboration with other state agencies.
2. Develop more formal, statewide opportunities for pre-arrest diversion to minimize system contact
and monitoring for low-risk youth, such as a civil citation program.
3. Consider statute or court rule changes regarding eligibility for diversion, informal adjustment, and
detention, including whether to have any form of informal supervision at all, as well as whether
detention should be used as a sanction after disposition.
4. Establish statewide screening, diversion, and assessment policies, and formalize these policies and
training requirements through court rules or a supervisory order from the Supreme Court.
5. Revise the DST to ensure correct scoring and use. Once fully implemented, revalidate and improve its
accuracy as needed.
6. Improve data collection, including capturing supervision start and end dates; developing a common
identifier to link different points of contact with the system that arise from a complaint; and collecting
data on the use of technical violations and other sanctions, including date, reason, and response.
The Council of State Governments Justice Center | 24
Background
Next Steps
03
01
04
Key Findings
• Supervision
• Service Delivery
• Disparities
02 System Performance
The Council of State Governments Justice Center | 26
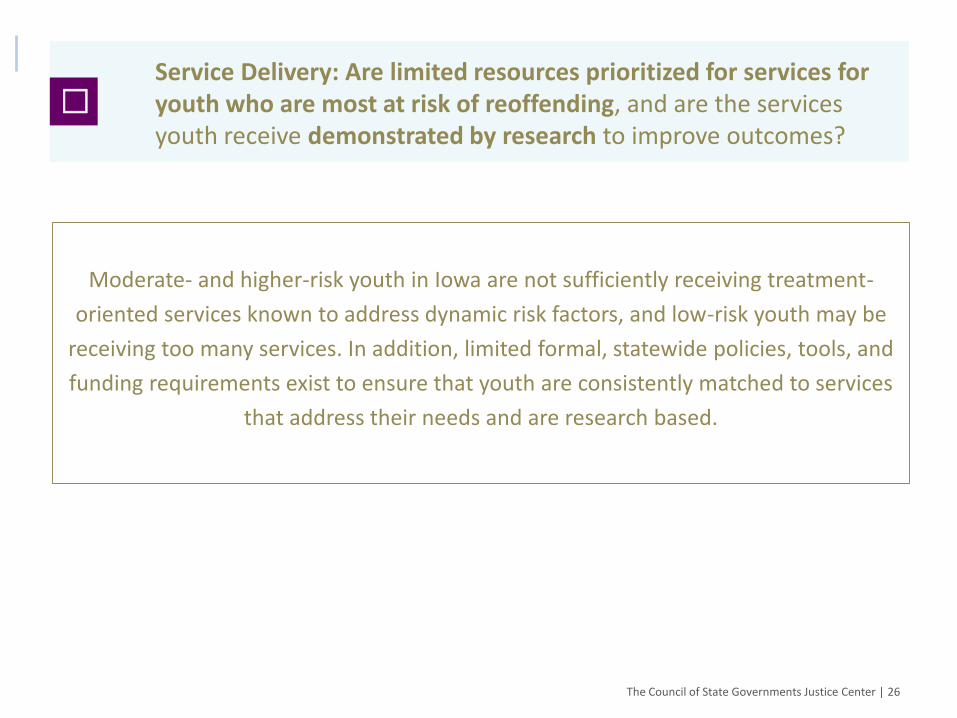
Service Delivery: Are limited resources prioritized for services for youth who are most at risk of reoffending, and are the services youth receive demonstrated by research to improve outcomes?
☐
Moderate- and higher-risk youth in Iowa are not sufficiently receiving treatment-
oriented services known to address dynamic risk factors, and low-risk youth may be
receiving too many services. In addition, limited formal, statewide policies, tools, and
funding requirements exist to ensure that youth are consistently matched to services
that address their needs and are research based.
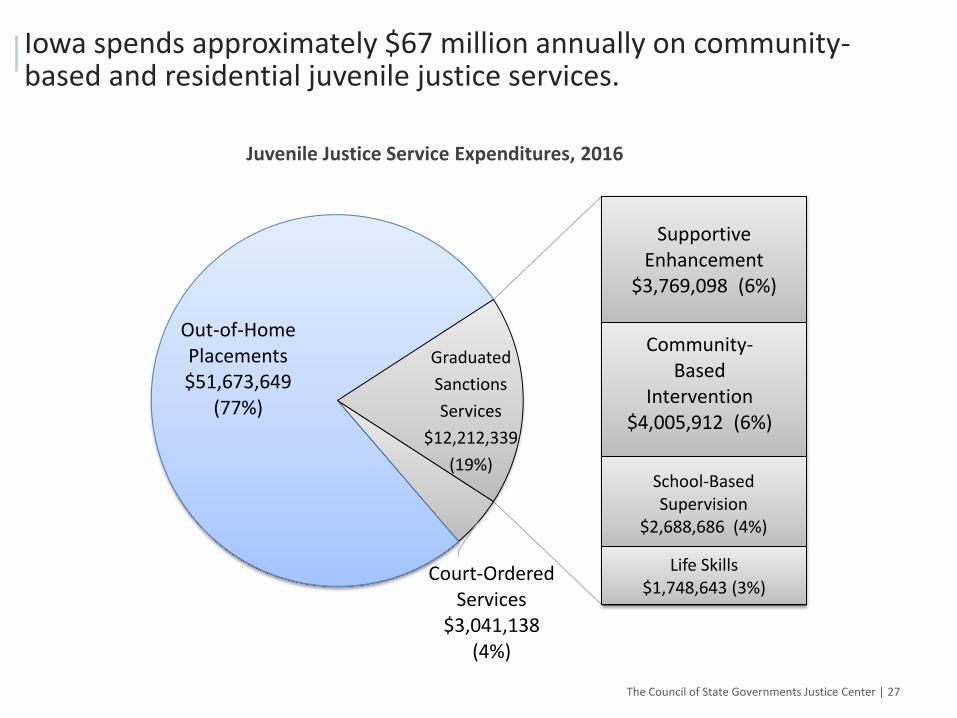
Iowa spends approximately $67 million annually on community-based and residential juvenile justice services.
The Council of State Governments Justice Center | 27
Court-Ordered Services
$3,041,138 (4%)
Out-of-Home Placements$51,673,649
(77%)
Supportive Enhancement
$3,769,098 (6%)
Community-Based
Intervention $4,005,912 (6%)
School-Based Supervision
$2,688,686 (4%)
Life Skills $1,748,643 (3%)
Juvenile Justice Service Expenditures, 2016
Graduated
Sanctions
Services
$12,212,339
(19%)
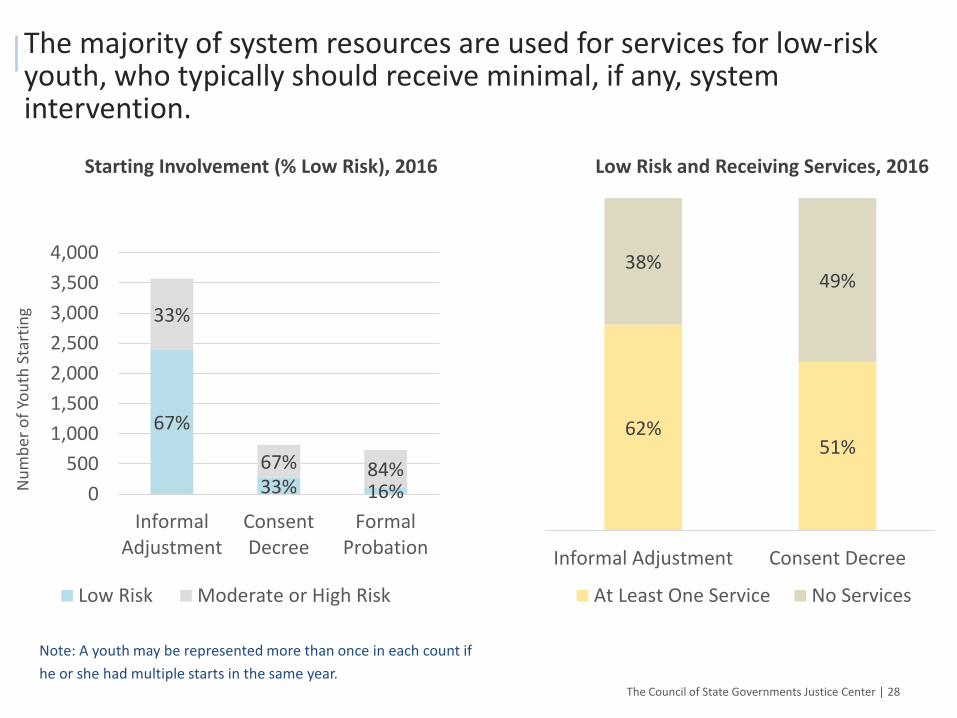
The majority of system resources are used for services for low-risk youth, who typically should receive minimal, if any, system intervention.
The Council of State Governments Justice Center | 28
Starting Involvement (% Low Risk), 2016 Low Risk and Receiving Services, 2016
67%
33% 16%
33%
67% 84%0
500
1,000
1,500
2,000
2,500
3,000
3,500
4,000
InformalAdjustment
ConsentDecree
FormalProbation
Nu
mb
er o
f Yo
uth
Sta
rtin
g
Low Risk Moderate or High Risk
62%51%
38%49%
Informal Adjustment Consent Decree
At Least One Service No Services
Note: A youth may be represented more than once in each count if
he or she had multiple starts in the same year.
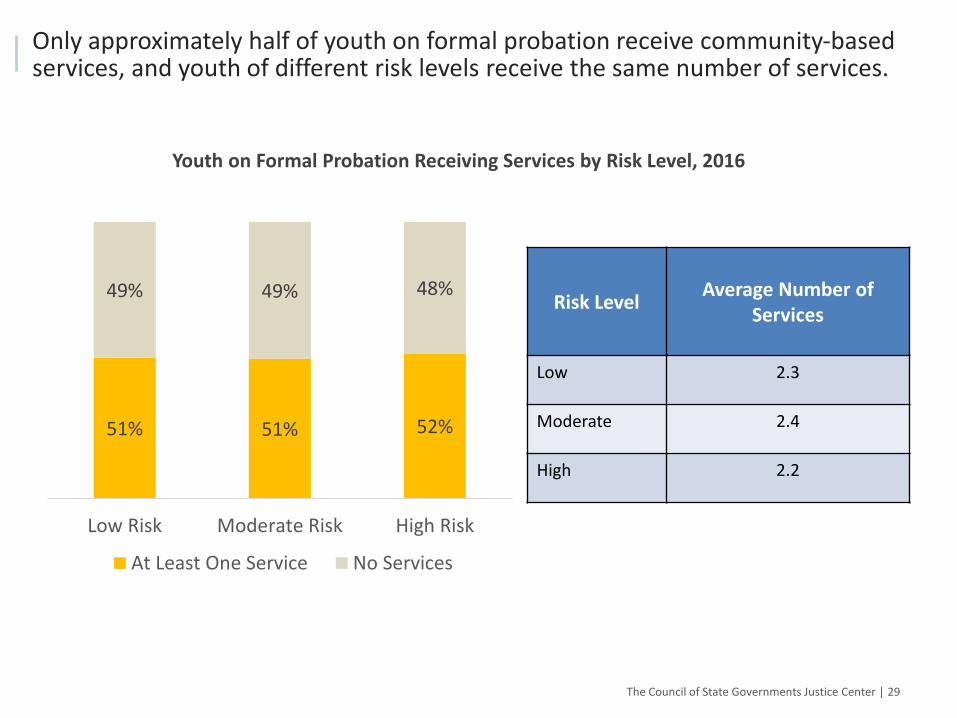
Only approximately half of youth on formal probation receive community-based services, and youth of different risk levels receive the same number of services.
The Council of State Governments Justice Center | 29
Risk LevelAverage Number of
Services
Low 2.3
Moderate 2.4
High 2.2
Youth on Formal Probation Receiving Services by Risk Level, 2016
51% 51% 52%
49% 49% 48%
Low Risk Moderate Risk High Risk
At Least One Service No Services
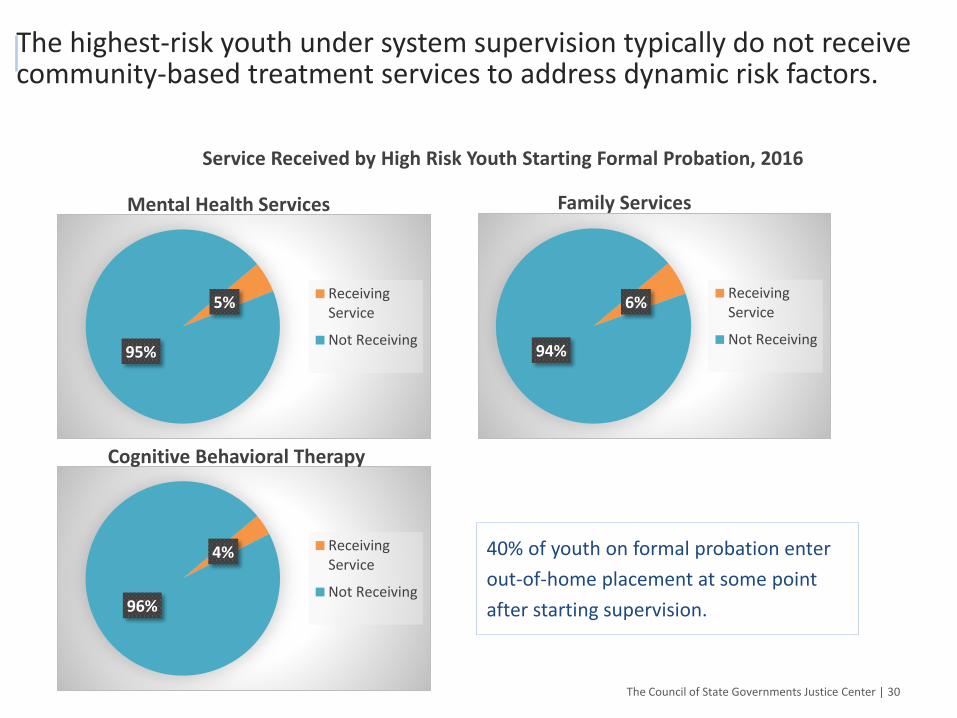
The highest-risk youth under system supervision typically do not receive community-based treatment services to address dynamic risk factors.
The Council of State Governments Justice Center | 30
5%
95%
ReceivingService
Not Receiving
Mental Health Services
Service Received by High Risk Youth Starting Formal Probation, 2016
6%
94%
ReceivingService
Not Receiving
Family Services
4%
96%
ReceivingService
Not Receiving
Cognitive Behavioral Therapy
40% of youth on formal probation enter
out-of-home placement at some point
after starting supervision.
Iowa lacks statewide requirements and policies to ensure that resources are used for research-based services.
There are no statutory funding incentives, requirements, or court rules
directing which youth receive services and requiring that these services are
evidence based.
Current DHS administrative rules that guide funding may inhibit effective
service matching/delivery.
There is a lack of centralized procurement, contracting, and oversight
processes that require the use of evidence-based programs and hold
providers accountable for service fidelity and improved youth outcomes.
While the SPEP is underway, CJJP has limited capacity to expand the SPEP
statewide and the court lacks its own quality assurance infrastructure.
The Council of State Governments Justice Center | 31
Residential services are largely not tailored to addressing the specific risk and needs of youth in the juvenile justice system.
There are limited contractual requirements, quality assurance procedures,
or oversight mechanisms specific to residential providers’ service delivery
for youth in the juvenile justice system.
Youth in the juvenile justice and child welfare systems are often placed in
the same facilities, with potential for negative peer influence.
Many residential providers do not have specific case management
approaches and services to address the dynamic risk factors of youth in the
juvenile justice system, and there is no required training for providers on
what research shows works for these youth.
The Council of State Governments Justice Center | 32
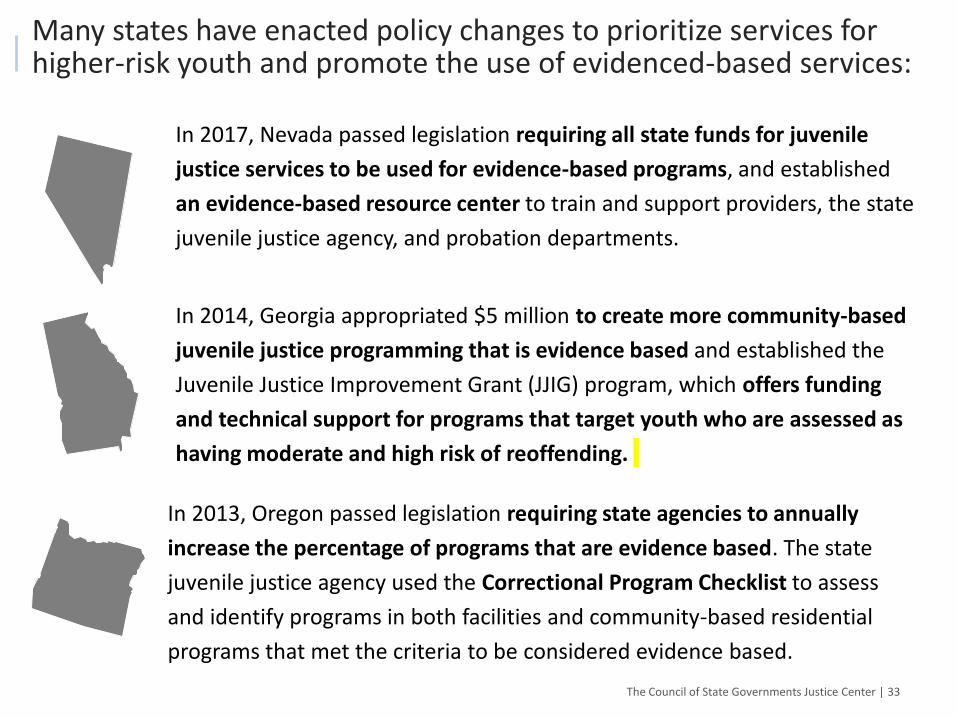
Many states have enacted policy changes to prioritize services for higher-risk youth and promote the use of evidenced-based services:
The Council of State Governments Justice Center | 33
In 2017, Nevada passed legislation requiring all state funds for juvenile
justice services to be used for evidence-based programs, and established
an evidence-based resource center to train and support providers, the state
juvenile justice agency, and probation departments.
In 2014, Georgia appropriated $5 million to create more community-based
juvenile justice programming that is evidence based and established the
Juvenile Justice Improvement Grant (JJIG) program, which offers funding
and technical support for programs that target youth who are assessed as
having moderate and high risk of reoffending.
In 2013, Oregon passed legislation requiring state agencies to annually
increase the percentage of programs that are evidence based. The state
juvenile justice agency used the Correctional Program Checklist to assess
and identify programs in both facilities and community-based residential
programs that met the criteria to be considered evidence based.
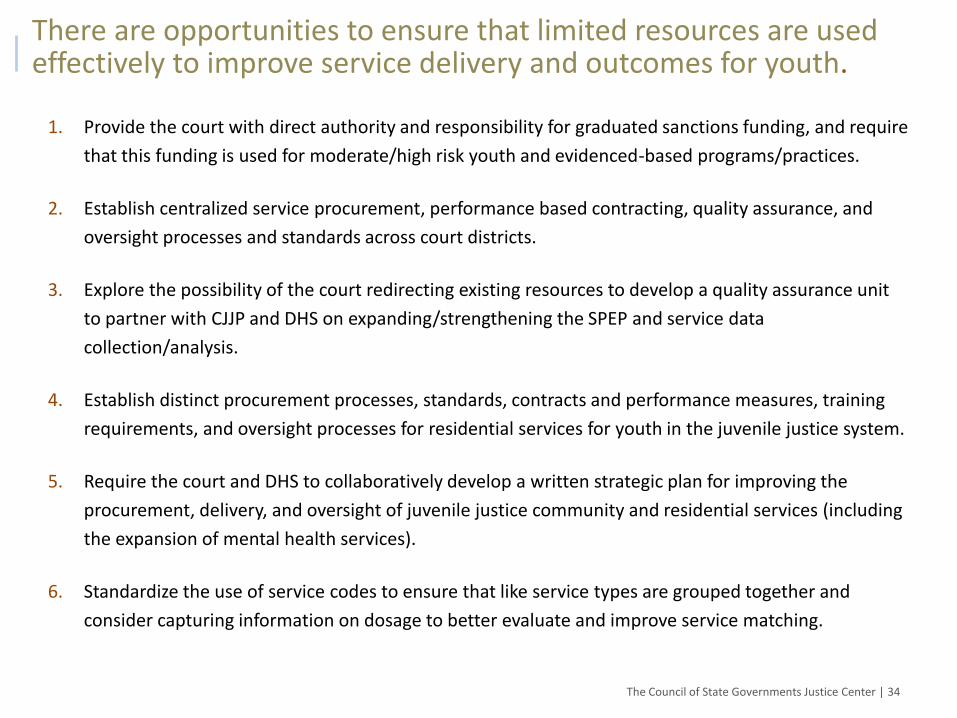
There are opportunities to ensure that limited resources are used effectively to improve service delivery and outcomes for youth.
1. Provide the court with direct authority and responsibility for graduated sanctions funding, and require
that this funding is used for moderate/high risk youth and evidenced-based programs/practices.
2. Establish centralized service procurement, performance based contracting, quality assurance, and
oversight processes and standards across court districts.
3. Explore the possibility of the court redirecting existing resources to develop a quality assurance unit
to partner with CJJP and DHS on expanding/strengthening the SPEP and service data
collection/analysis.
4. Establish distinct procurement processes, standards, contracts and performance measures, training
requirements, and oversight processes for residential services for youth in the juvenile justice system.
5. Require the court and DHS to collaboratively develop a written strategic plan for improving the
procurement, delivery, and oversight of juvenile justice community and residential services (including
the expansion of mental health services).
6. Standardize the use of service codes to ensure that like service types are grouped together and
consider capturing information on dosage to better evaluate and improve service matching.
The Council of State Governments Justice Center | 34
Background
Next Steps
03
01
04
Key Findings
• Supervision
• Service Delivery
• Disparities
02 System Performance
The Council of State Governments Justice Center | 36
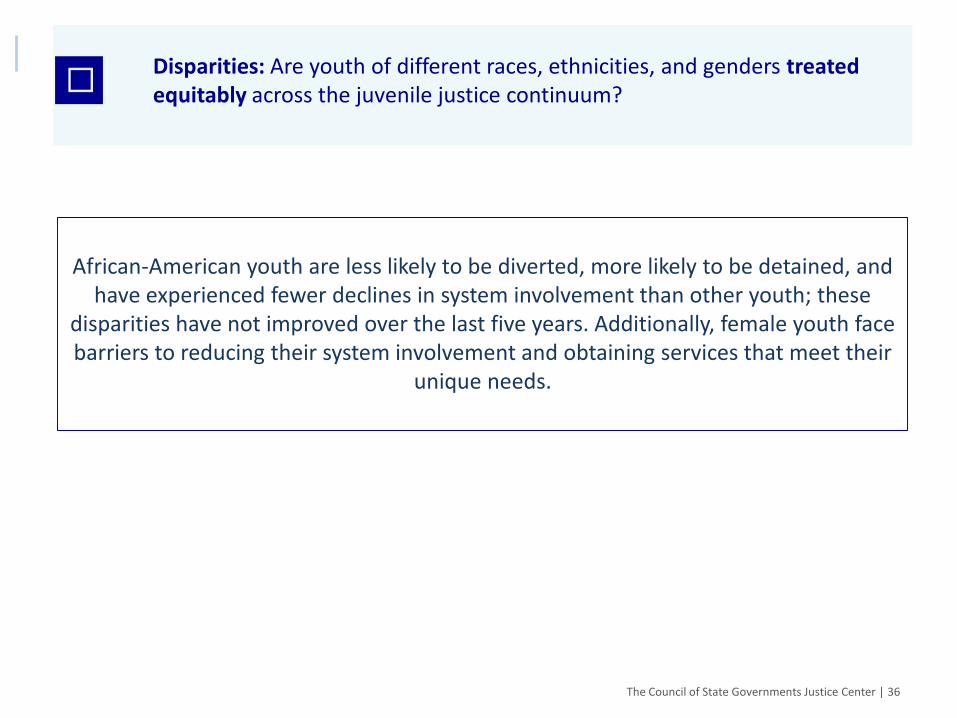
☐Disparities: Are youth of different races, ethnicities, and genders treated equitably across the juvenile justice continuum?
African-American youth are less likely to be diverted, more likely to be detained, and have experienced fewer declines in system involvement than other youth; these
disparities have not improved over the last five years. Additionally, female youth face barriers to reducing their system involvement and obtaining services that meet their
unique needs.
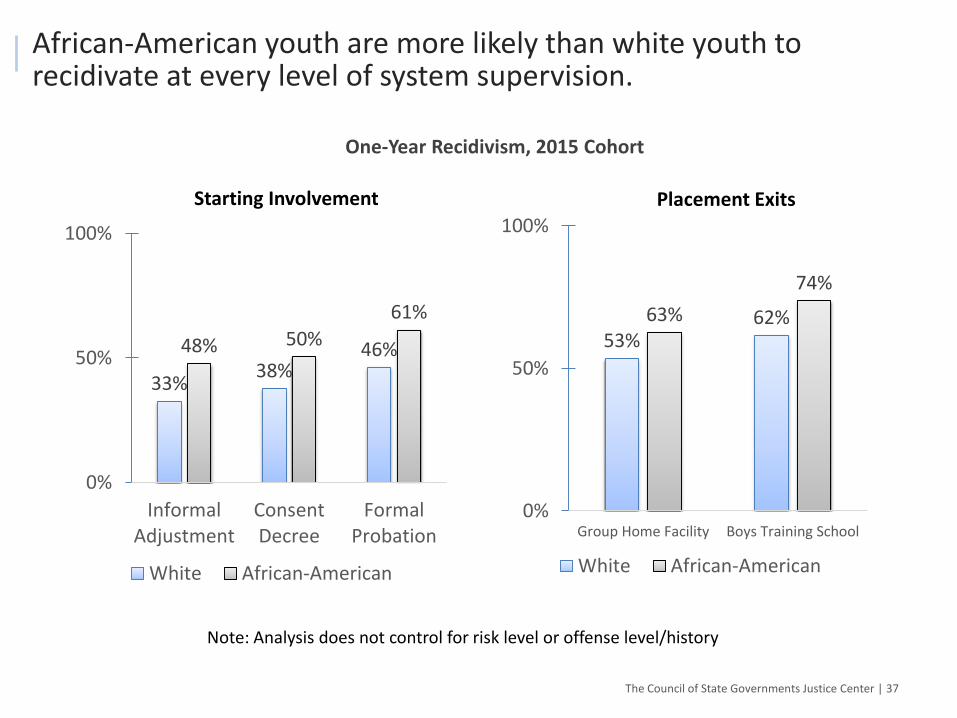
African-American youth are more likely than white youth to recidivate at every level of system supervision.
One-Year Recidivism, 2015 Cohort
Starting Involvement Placement Exits
The Council of State Governments Justice Center | 37
Note: Analysis does not control for risk level or offense level/history
33%38%
46%48% 50%
61%
0%
50%
100%
InformalAdjustment
ConsentDecree
FormalProbation
White African-American
53%62%63%
74%
0%
50%
100%
Group Home Facility Boys Training School
White African-American
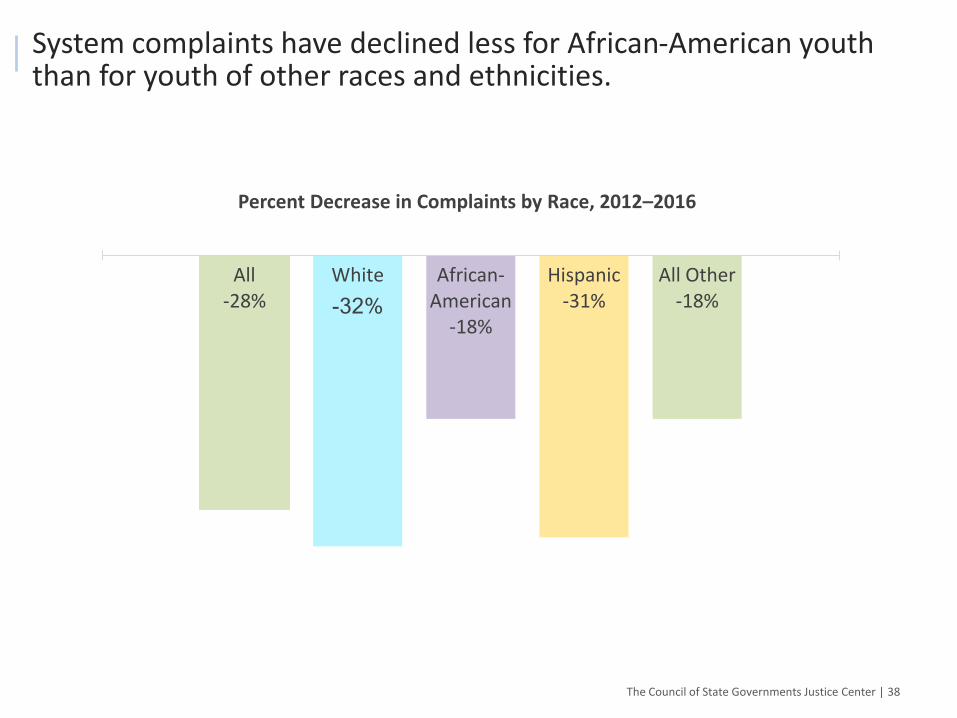
System complaints have declined less for African-American youth than for youth of other races and ethnicities.
The Council of State Governments Justice Center | 38
Percent Decrease in Complaints by Race, 2012–2016
All -28%
White
-32%African-
American-18%
Hispanic-31%
All Other-18%
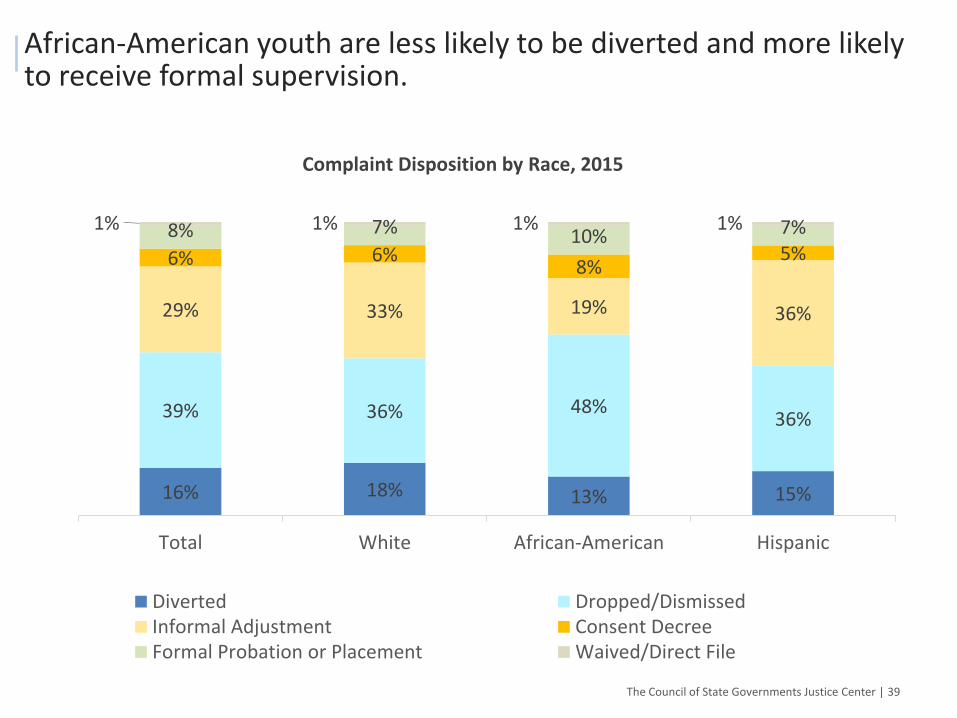
African-American youth are less likely to be diverted and more likely to receive formal supervision.
The Council of State Governments Justice Center | 39
16% 18% 13% 15%
39% 36% 48%36%
29% 33% 19% 36%
6% 6%8%
5%8% 7% 10% 7%1% 1% 1% 1%
Total White African-American Hispanic
Diverted Dropped/DismissedInformal Adjustment Consent DecreeFormal Probation or Placement Waived/Direct File
Complaint Disposition by Race, 2015
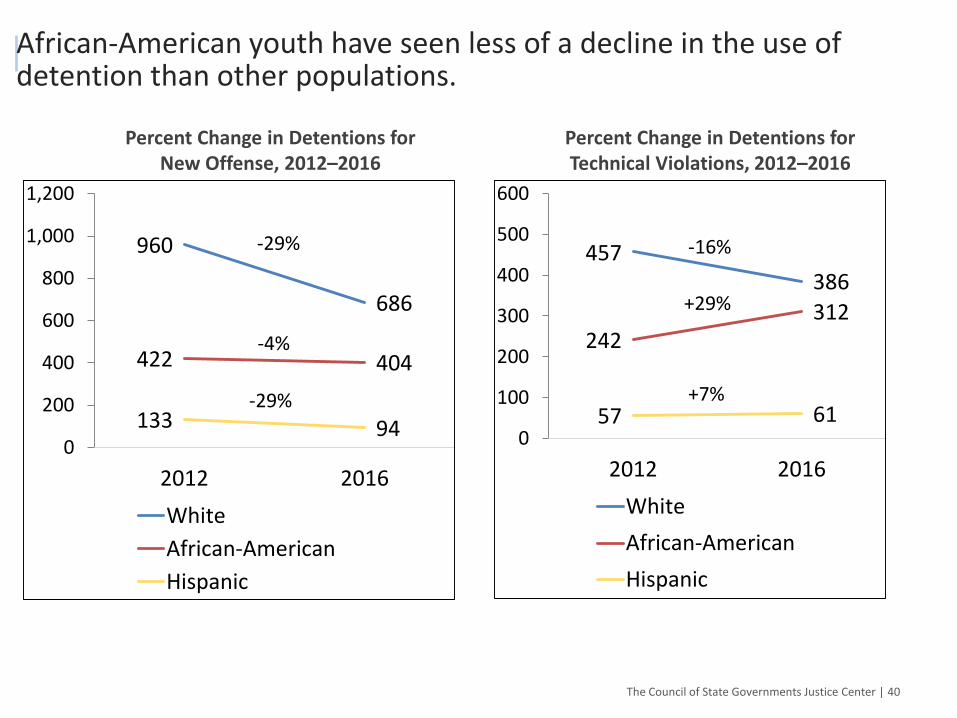
African-American youth have seen less of a decline in the use of detention than other populations.
The Council of State Governments Justice Center | 40
Percent Change in Detentions for New Offense, 2012–2016
960
686
422 404
133 940
200
400
600
800
1,000
1,200
2012 2016
White
African-American
Hispanic
-29%
-4%
-29%
457386
242312
57 610
100
200
300
400
500
600
2012 2016
White
African-American
Hispanic
-16%
+29%
+7%
Percent Change in Detentions for Technical Violations, 2012–2016
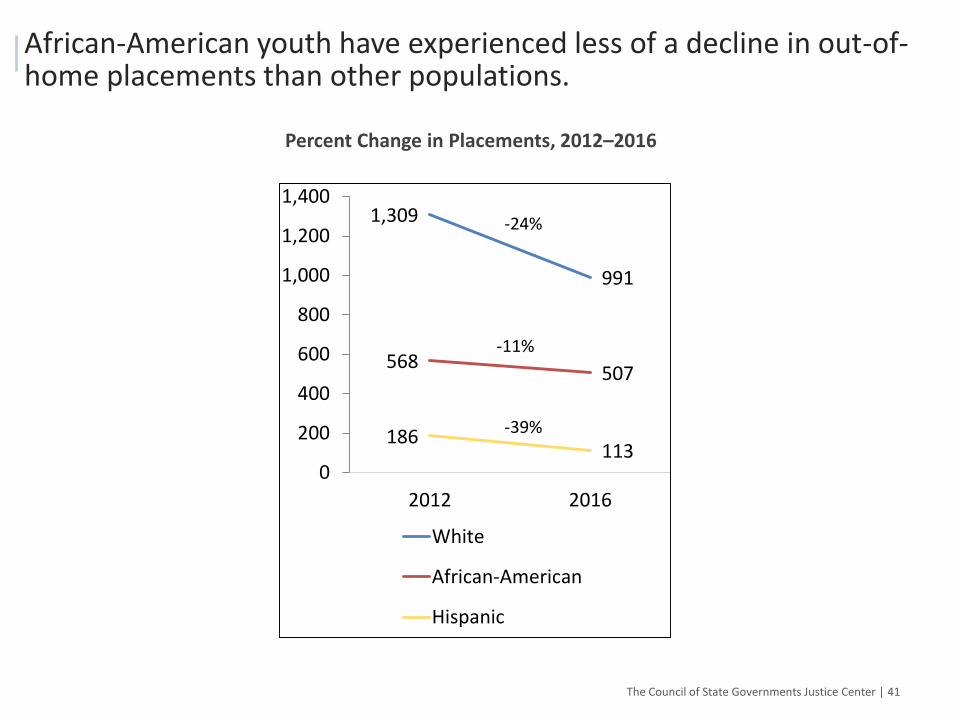
African-American youth have experienced less of a decline in out-of-home placements than other populations.
The Council of State Governments Justice Center | 41
Percent Change in Placements, 2012–2016
1,309
991
568507
186113
0
200
400
600
800
1,000
1,200
1,400
2012 2016
White
African-American
Hispanic
-24%
-11%
-39%
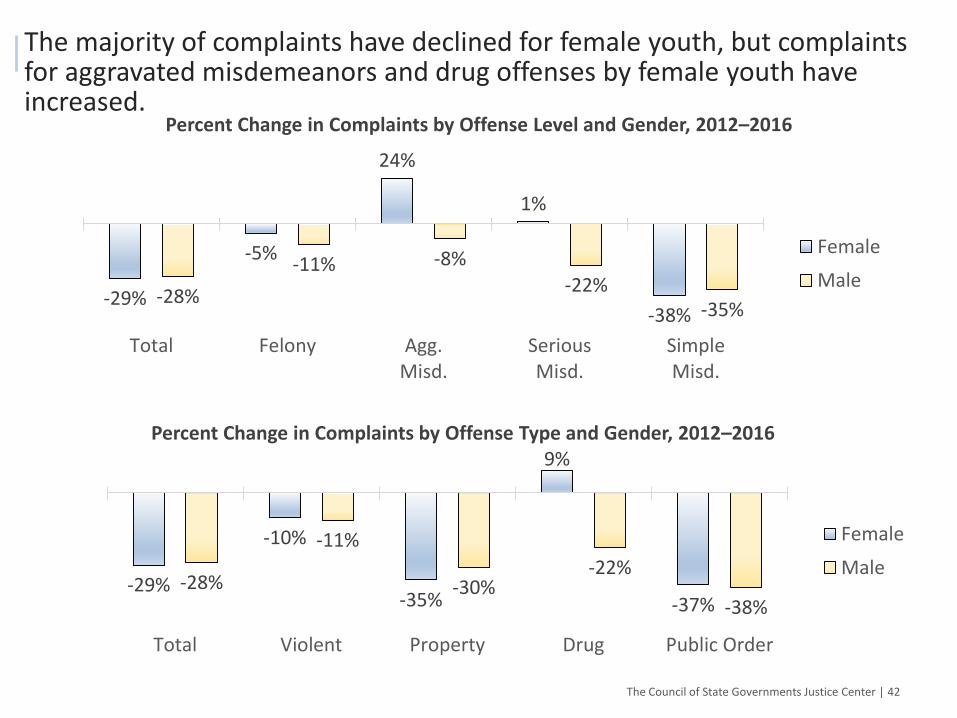
The majority of complaints have declined for female youth, but complaints for aggravated misdemeanors and drug offenses by female youth have increased.
The Council of State Governments Justice Center | 42
-29%
-5%
24%
1%
-38%-28%
-11% -8%-22%
-35%
Total Felony Agg.Misd.
SeriousMisd.
SimpleMisd.
Female
Male
Percent Change in Complaints by Offense Level and Gender, 2012–2016
Percent Change in Complaints by Offense Type and Gender, 2012–2016
-29%
-10%
-35%
9%
-37%-28%
-11%
-30%-22%
-38%
Total Violent Property Drug Public Order
Female
Male
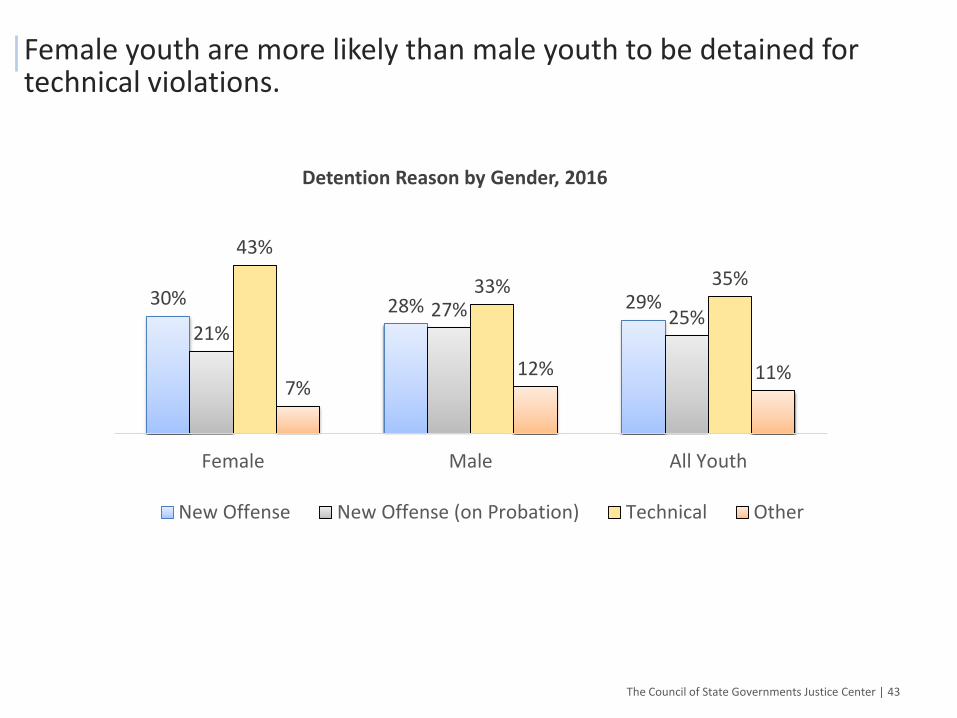
Female youth are more likely than male youth to be detained for technical violations.
The Council of State Governments Justice Center | 43
Detention Reason by Gender, 2016
30% 28% 29%
21%27% 25%
43%
33% 35%
7%12% 11%
Female Male All Youth
New Offense New Offense (on Probation) Technical Other
System stakeholders consistently raise concerns about a lack of intensive and gender-responsive services for female youth.
The Council of State Governments Justice Center | 44
Services for female youth are limited and difficult to access, particularly for
high-risk, high-needs female youth. There is a lack of mental health services,
residential and day treatment, and family foster care options, for example.
A majority of chief juvenile court officers express a low level of satisfaction
with the quality of services available for high-risk, high-needs female youth,
and say that there is a need for more gender- and culturally responsive,
trauma-informed, and developmentally appropriate supports.
A handful of states and counties have made progress on reducing racial and ethnic and gender disparities:
The Council of State Governments Justice Center | 45
In 2015, Scott county Iowa developed a diversion program for first-time youth
offenders of simple misdemeanor, non-traffic offenses. The project included a)
implementing a new policy that requires all officers to divert eligible youth, b)
training for key partners and front-line staff, and c) developing and implementing
diversion classes. Since the project was implemented in 2016, there has been a
significant decrease in youth of color who are charged for simple misdemeanor,
non-traffic offenses.
In 2013, Johnson county Iowa re-defined protocols to guide when school staff to should contact law enforcement for youth’s behavior, implemented a uniform set of graduated sanctions for in-school behaviors to limit law enforcement intervention, and created a community-based diversion program to address youth’s problems/disorderly behaviors (includes youth from school settings as well as communities). Since project implementation, there was a significant decrease in arrests for disorderly conduct, particularly for African American youth. In 2014, 14 out of the 16 youth referred to the program were African American, and all have successfully completed the program.
There are opportunities for reducing racial and ethnic and gender disparities in Iowa.
1. Work with the Office of Juvenile Justice and Delinquency Prevention and national
organizations with demonstrated and continued reductions in racial and ethnic
disparities to engage in an intensive process to address disparities in one or two pilot
districts. Build off of the promising work taking place in Iowa’s counties.
2. Continue/strengthen data collection around disparities using both quantitative and
qualitative data, and utilize data to conduct root cause analyses to identify practices
and factors leading to disparities, as well as to develop targeted strategies.
3. Support and require statewide training on implicit/explicit bias for attorneys, judges,
and service providers.
4. Support and require statewide training on gender responsivity and trauma-informed
care for juvenile court officers and service providers, conduct a statewide gap
analysis on programming for female youth, and allocate funding based on the
results.
The Council of State Governments Justice Center | 46
Background
Next Steps
03
01
04
Key Findings
• Supervision
• Service Delivery
• Disparities
02 System Performance
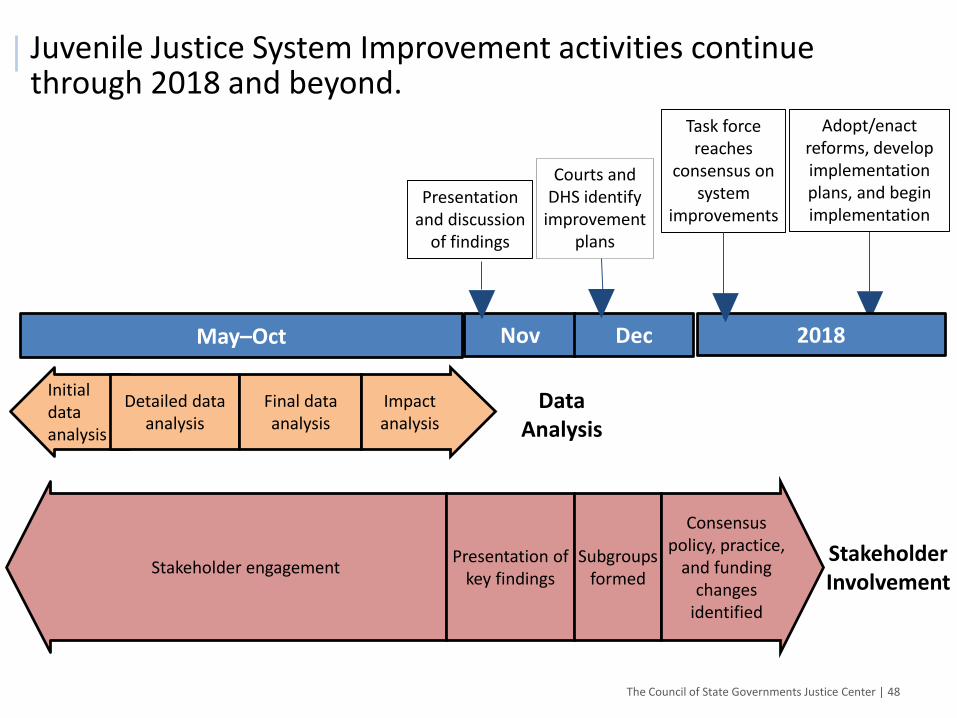
Juvenile Justice System Improvement activities continue through 2018 and beyond.
The Council of State Governments Justice Center | 48
Nov Dec
Presentation and discussion
of findings
Data Analysis
May–Oct
Initialdata analysis
Detailed data analysis
Final data analysis
Impact analysis
Stakeholder engagementPresentation of
key findingsSubgroups
formed
Consensus policy, practice,
and funding changes
identified
StakeholderInvolvement
Adopt/enact reforms, develop implementation plans, and begin implementation
Courts and DHS identify
improvement plans
2018
Task force reaches
consensus on system
improvements
Thank YouAdditional Resources:
Core Principles for Reducing Recidivism and Improving Other Outcomes for Youth in the Juvenile Justice System:
http://csgjusticecenter.org/youth/publications/juvenile-justice-white-paper/
Measuring Juvenile Recidivism: http://csgjusticecenter.org/youth/publications/measuring-juvenile-recidivism/
Juvenile Reentry and Resources: http://csgjusticecenter.org/youth/juvenile-reentry/
Reducing Recidivism Interactive Checklists:https://csgjusticecenter.org/youth/reducing-juvenile-recidivism-interactive-checklists/
The presentation was developed by members of The Council of State Governments (CSG) Justice Center staff. The statements made reflect the views of the authors, and should not be considered the
official position of the CSG Justice Center, the members of The Council of State Governments, or the funding agency supporting the work.