ipac 2010 presentation v4 final - annex.ipacweb.organnex.ipacweb.org/library/conf/10/blair.pdf · 3...
TRANSCRIPT
GAP AnalysisUsing Traditional Pre-Employment Tools to Identify Skill Gaps in Incumbent Populations
IPAC July 21, 2010
Michael Blair, CenturyLink
Amanda Evans, PreVisor
Andy Solomonson, PreVisor
2
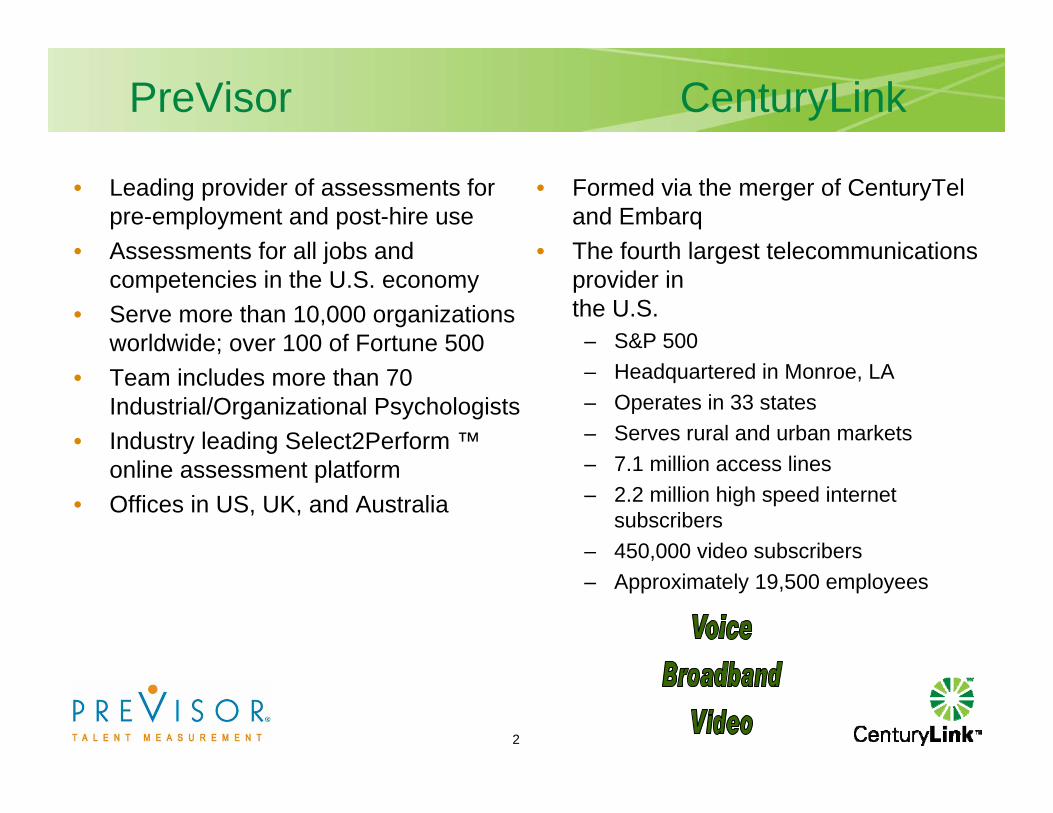
PreVisor CenturyLink
• Formed via the merger of CenturyTeland Embarq
• The fourth largest telecommunications provider in the U.S.
– S&P 500– Headquartered in Monroe, LA– Operates in 33 states– Serves rural and urban markets– 7.1 million access lines– 2.2 million high speed internet
subscribers– 450,000 video subscribers– Approximately 19,500 employees
• Leading provider of assessments for pre-employment and post-hire use
• Assessments for all jobs and competencies in the U.S. economy
• Serve more than 10,000 organizations worldwide; over 100 of Fortune 500
• Team includes more than 70 Industrial/Organizational Psychologists
• Industry leading Select2Perform ™online assessment platform
• Offices in US, UK, and Australia
3
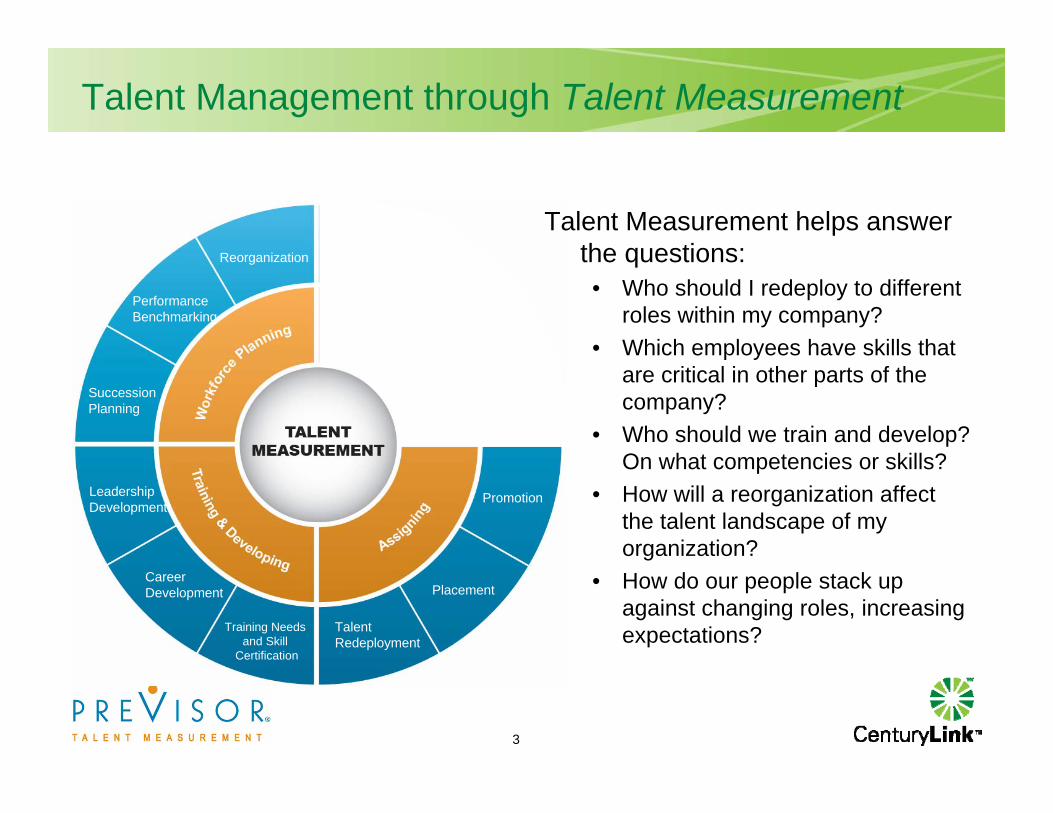
Talent Management through Talent Measurement
CareerDevelopment
Performance Benchmarking
Training Needs and Skill
Certification
Recruiting
Talent Redeployment
SuccessionPlanning
Reorganization
Interviewing
Promotion
Placement
Pre-Employment Testing
LeadershipDevelopment
Talent Measurement helps answer the questions:• Who should I redeploy to different
roles within my company?• Which employees have skills that
are critical in other parts of the company?
• Who should we train and develop? On what competencies or skills?
• How will a reorganization affect the talent landscape of my organization?
• How do our people stack up against changing roles, increasing expectations?
4
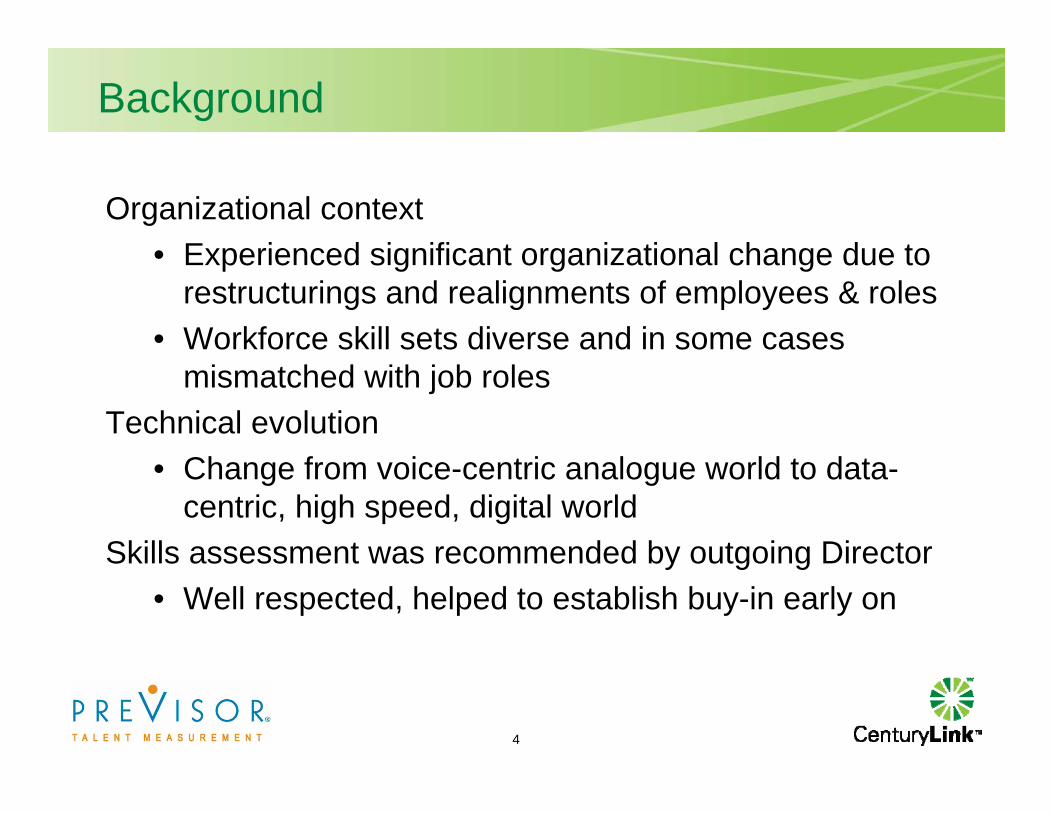
Background
Organizational context• Experienced significant organizational change due to
restructurings and realignments of employees & roles• Workforce skill sets diverse and in some cases
mismatched with job rolesTechnical evolution
• Change from voice-centric analogue world to data-centric, high speed, digital world
Skills assessment was recommended by outgoing Director• Well respected, helped to establish buy-in early on
5
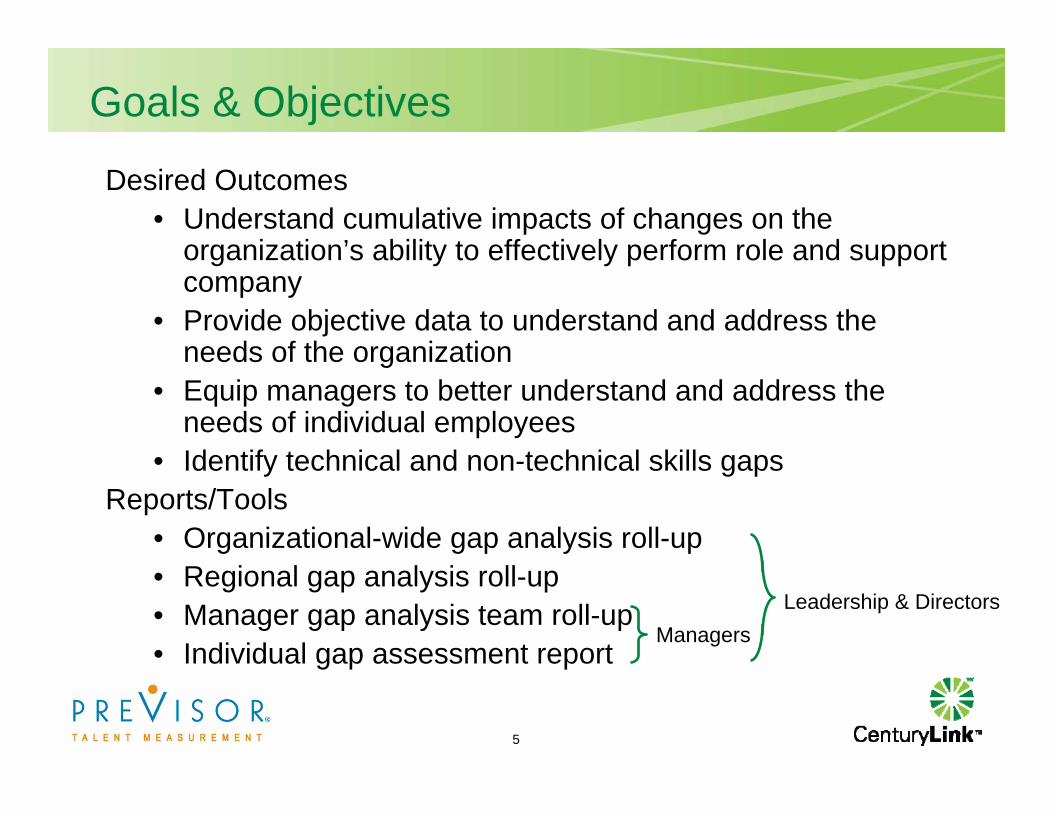
Goals & Objectives
Desired Outcomes• Understand cumulative impacts of changes on the
organization’s ability to effectively perform role and support company
• Provide objective data to understand and address the needs of the organization
• Equip managers to better understand and address the needs of individual employees
• Identify technical and non-technical skills gapsReports/Tools
• Organizational-wide gap analysis roll-up• Regional gap analysis roll-up• Manager gap analysis team roll-up• Individual gap assessment report
Leadership & DirectorsManagers
6
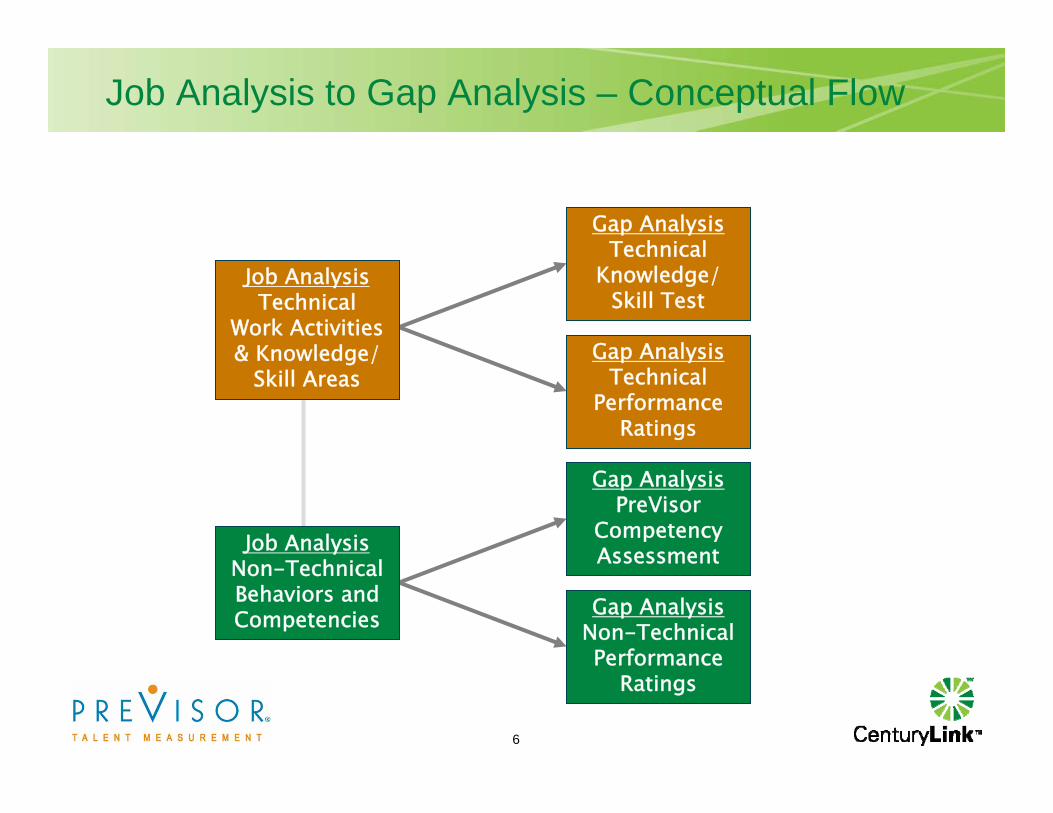
Job Analysis to Gap Analysis – Conceptual Flow
Job AnalysisTechnical
Work Activities & Knowledge/
Skill Areas
Gap AnalysisTechnical
Knowledge/ Skill Test
Gap AnalysisTechnical
Performance Ratings
Job AnalysisNon-Technical Behaviors and Competencies
Gap AnalysisPreVisor
Competency Assessment
Gap AnalysisNon-Technical Performance
Ratings
7
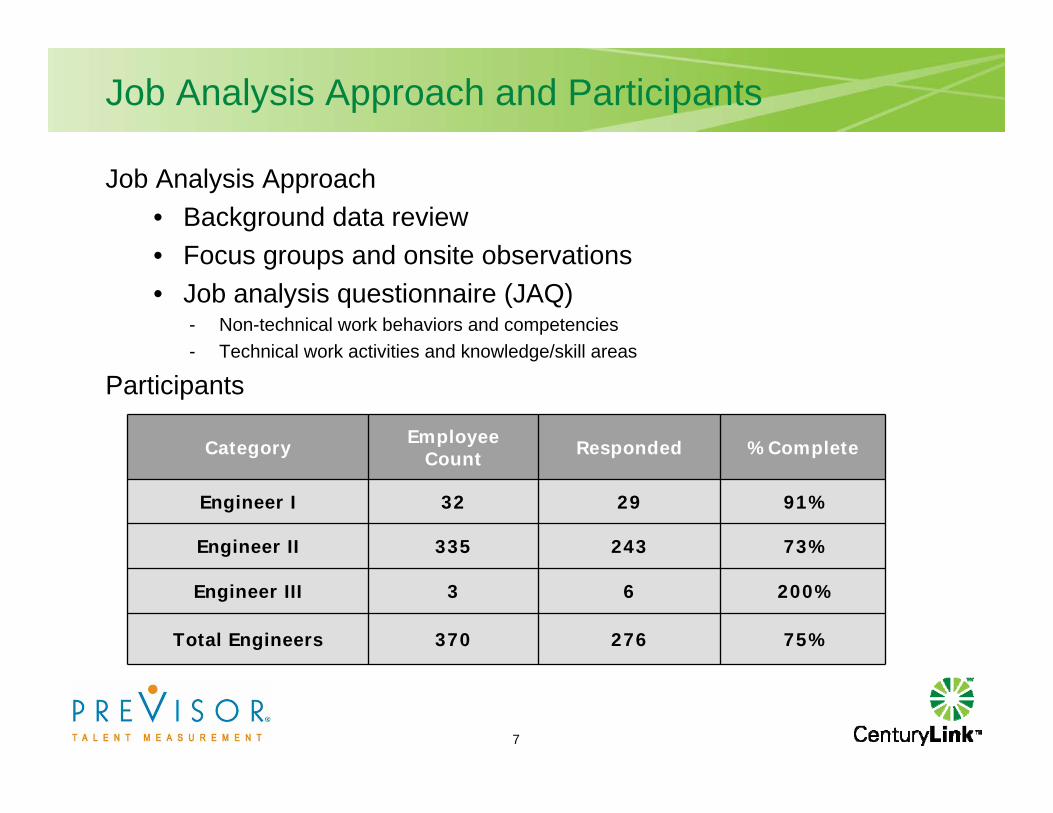
Job Analysis Approach and Participants
Job Analysis Approach• Background data review• Focus groups and onsite observations• Job analysis questionnaire (JAQ)
- Non-technical work behaviors and competencies- Technical work activities and knowledge/skill areas
Participants
Category Employee Count Responded % Complete
Engineer I 32 29 91%
Engineer II 335 243 73%
Engineer III 3 6 200%
Total Engineers 370 276 75%
8
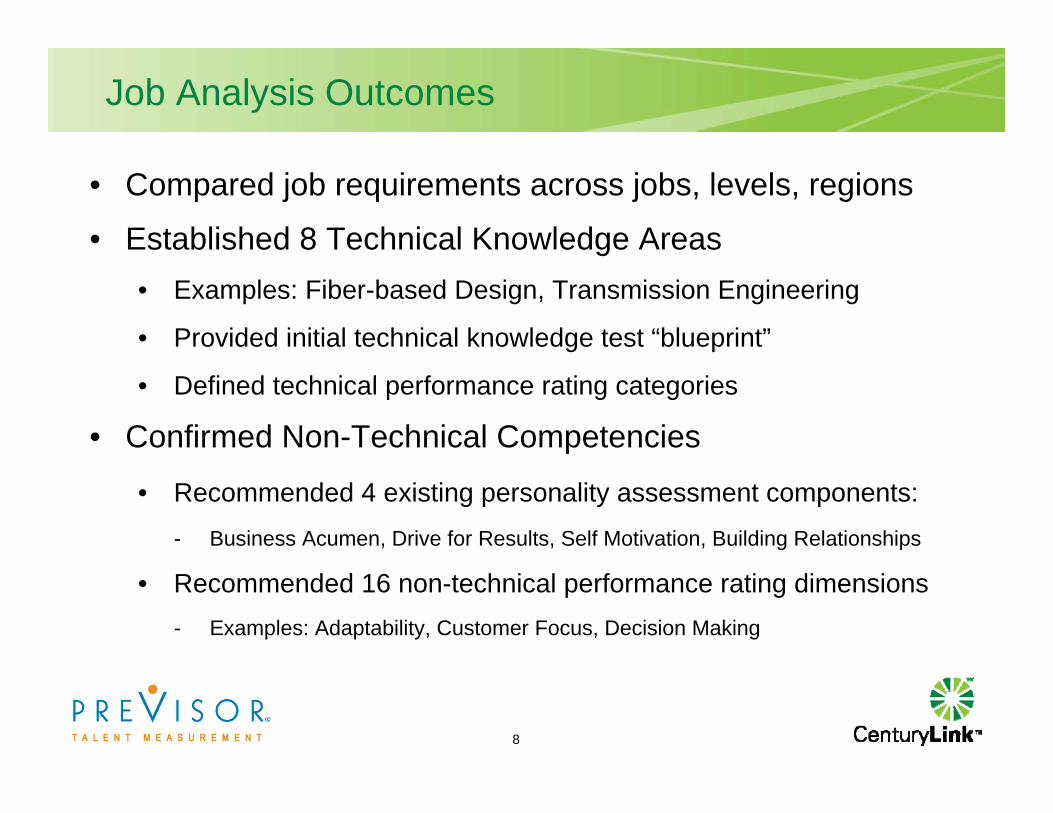
Job Analysis Outcomes
• Compared job requirements across jobs, levels, regions
• Established 8 Technical Knowledge Areas • Examples: Fiber-based Design, Transmission Engineering
• Provided initial technical knowledge test “blueprint”
• Defined technical performance rating categories
• Confirmed Non-Technical Competencies
• Recommended 4 existing personality assessment components:- Business Acumen, Drive for Results, Self Motivation, Building Relationships
• Recommended 16 non-technical performance rating dimensions - Examples: Adaptability, Customer Focus, Decision Making
9
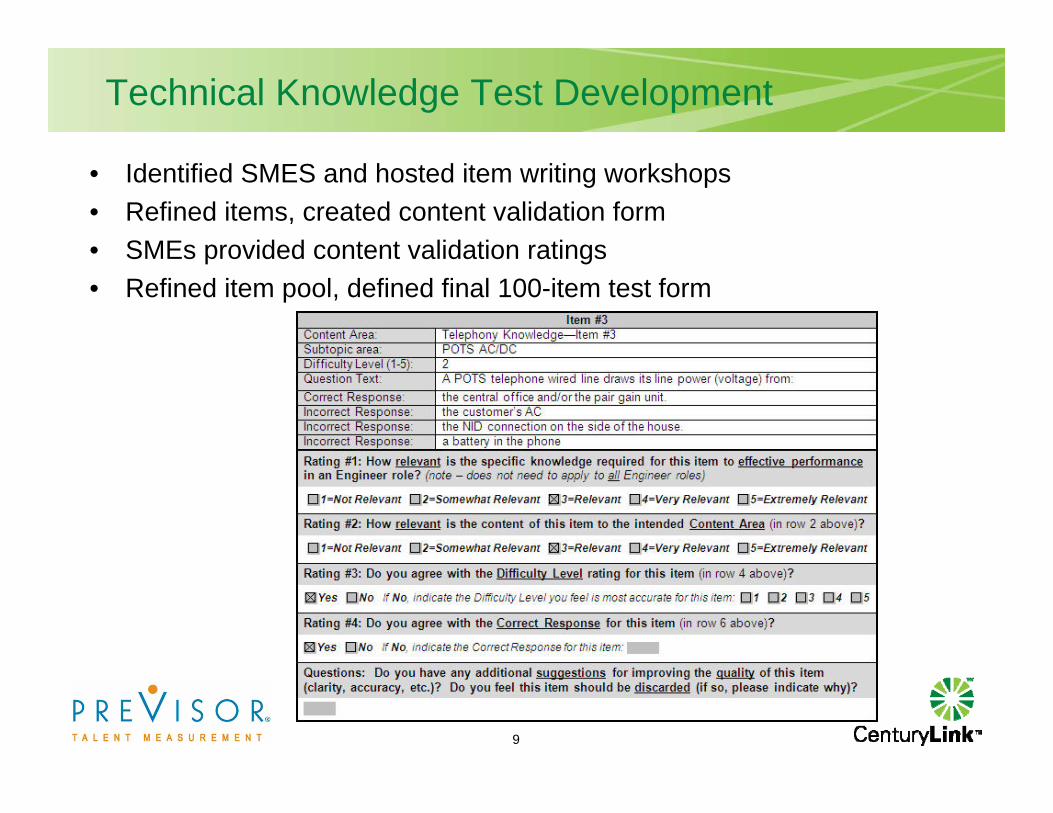
Technical Knowledge Test Development
• Identified SMES and hosted item writing workshops• Refined items, created content validation form• SMEs provided content validation ratings• Refined item pool, defined final 100-item test form
10
Job Analysis and Assessment Summary Access Engineering partnered with HR and PreVisor
• Regular communication on plan, progress, uses, benefitsAdvisory panel
• Corporate and regional managers involved in all phases of projectJob analysis
• Identified technical and non-technical KSAOs• 276 of 370 engineers participated
Technical Knowledge Test development• 8 technical knowledge areas • Advisory panel + 9 Senior Engineers
Assessment• Online assessment – technical knowledge test and personality test• 327 of 332* engineers participated
Performance ratings• Online job performance rating form – technical and non-technical areas• 40 managers provided ratings on participating engineers
*Turnover, promotions, & JA results reduced the target engineer pool
11
Sharing Results: Executive Briefing
Briefed VP and Regional DirectorsReviewed results
• Focused on explaining and interpreting “unexpected”or “uncomfortable” outcomes
Walked through reports• Provided leaders with complete set of reports• Leaders knew what their organization would be
receivingAllowed time for review and digestion
• Leaders were prepared for questions and concerns
12
Technical Assessment Results Summary
Assessment validity reinforced by results• Test content supported by job analysis and content validation • Test scores are predictive of technical job performance ratings
- Conducted concurrent, criterion-related validation study- Overall score-performance r = .50- Content area r ranged from .30 to .60
• Engineer IIIs outperformed IIs; Engineer IIs outperformed Is
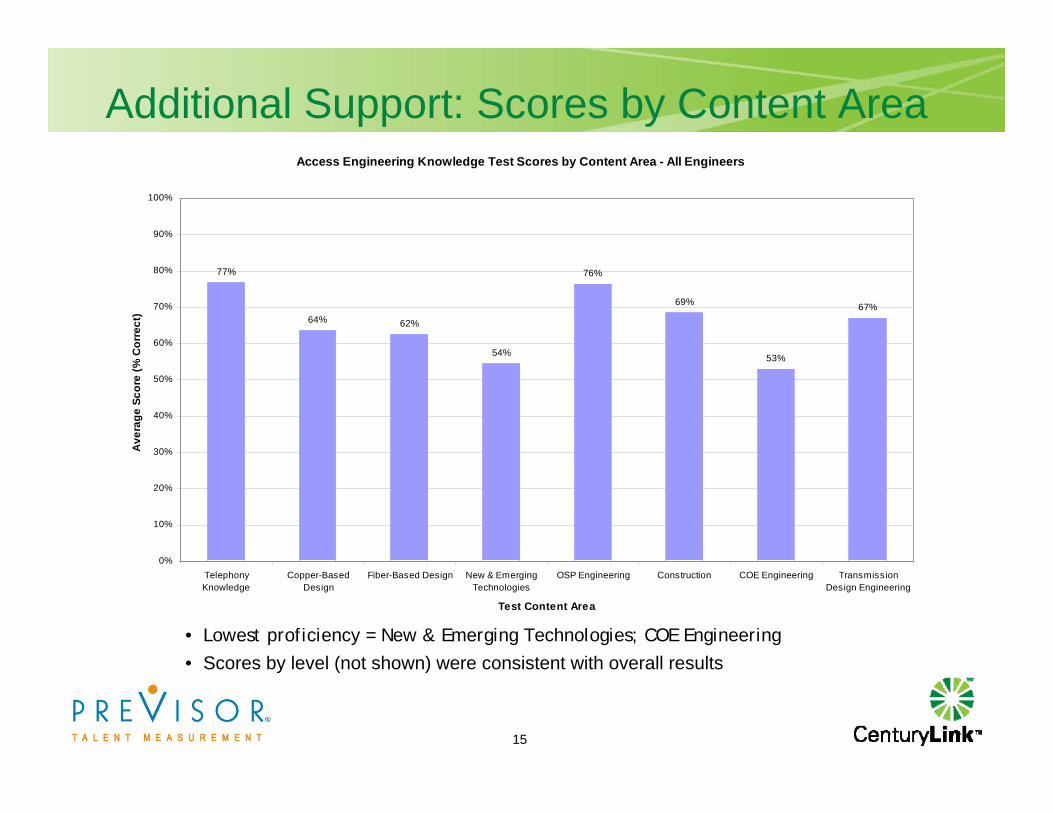
Technical assessment results across all Engineers• Average overall score = 66% (66/100 correct)• Content areas scores ranged from 53% to 77%
- Highest scores = Telephony Knowledge and OSP Engineering- Lowest scores = New & Emerging Technologies and COE Engineering
13
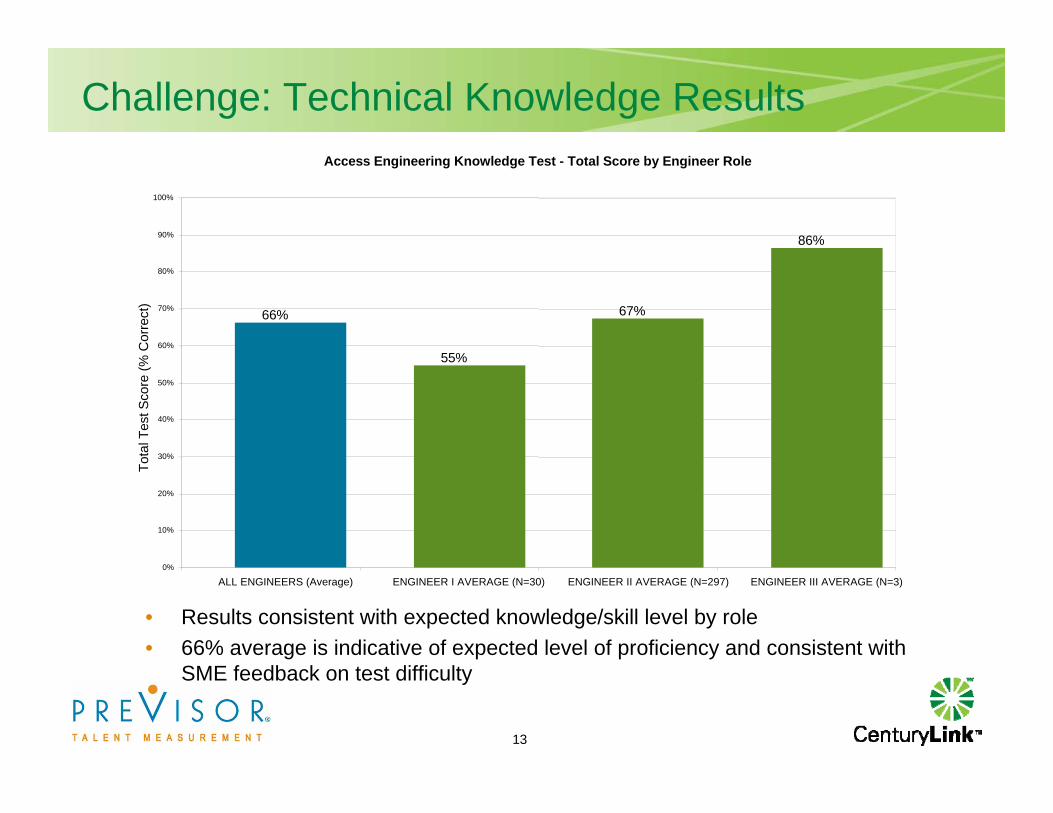
Challenge: Technical Knowledge Results
• Results consistent with expected knowledge/skill level by role• 66% average is indicative of expected level of proficiency and consistent with
SME feedback on test difficulty
Access Engineering Knowledge Test - Total Score by Engineer Role
66%
55%
67%
86%
0%
10%
20%
30%
40%
50%
60%
70%
80%
90%
100%
ALL ENGINEERS (Average) ENGINEER I AVERAGE (N=30) ENGINEER II AVERAGE (N=297) ENGINEER III AVERAGE (N=3)
Tota
l Tes
t Sco
re (%
Cor
rect
)
14
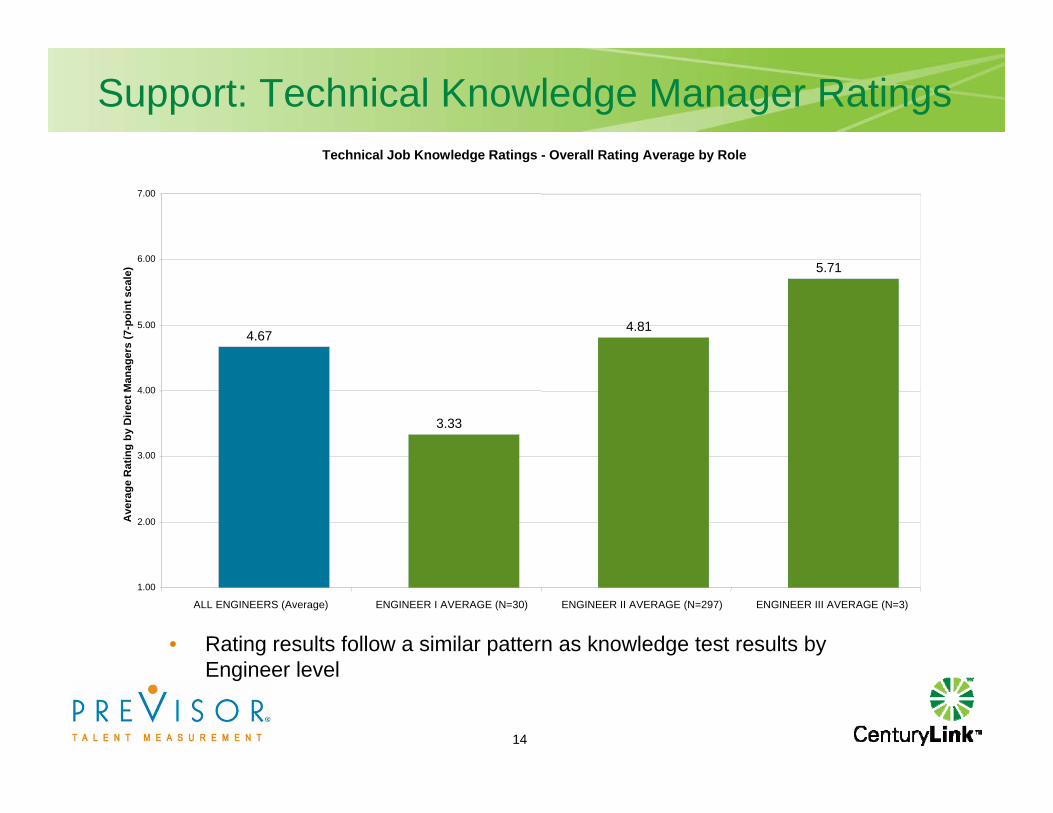
Support: Technical Knowledge Manager Ratings
• Rating results follow a similar pattern as knowledge test results by Engineer level
Technical Job Knowledge Ratings - Overall Rating Average by Role
4.67
3.33
4.81
5.71
1.00
2.00
3.00
4.00
5.00
6.00
7.00
ALL ENGINEERS (Average) ENGINEER I AVERAGE (N=30) ENGINEER II AVERAGE (N=297) ENGINEER III AVERAGE (N=3)
Ave
rage
Rat
ing
by D
irect
Man
ager
s (7
-poi
nt s
cale
)
15
Additional Support: Scores by Content Area
• Highest proficiency = Telephony Knowledge; OSP Engineering• Lowest proficiency = New & Emerging Technologies; COE Engineering• Scores by level (not shown) were consistent with overall results
Access Engineering Knowledge Test Scores by Content Area - All Engineers
77%
64% 62%
54%
76%
69%
53%
67%
0%
10%
20%
30%
40%
50%
60%
70%
80%
90%
100%
TelephonyKnowledge
Copper-BasedDesign
Fiber-Based Design New & EmergingTechnologies
OSP Engineering Construction COE Engineering TransmissionDesign Engineering
Test Content Area
Ave
rage
Sco
re (%
Cor
rect
)
16
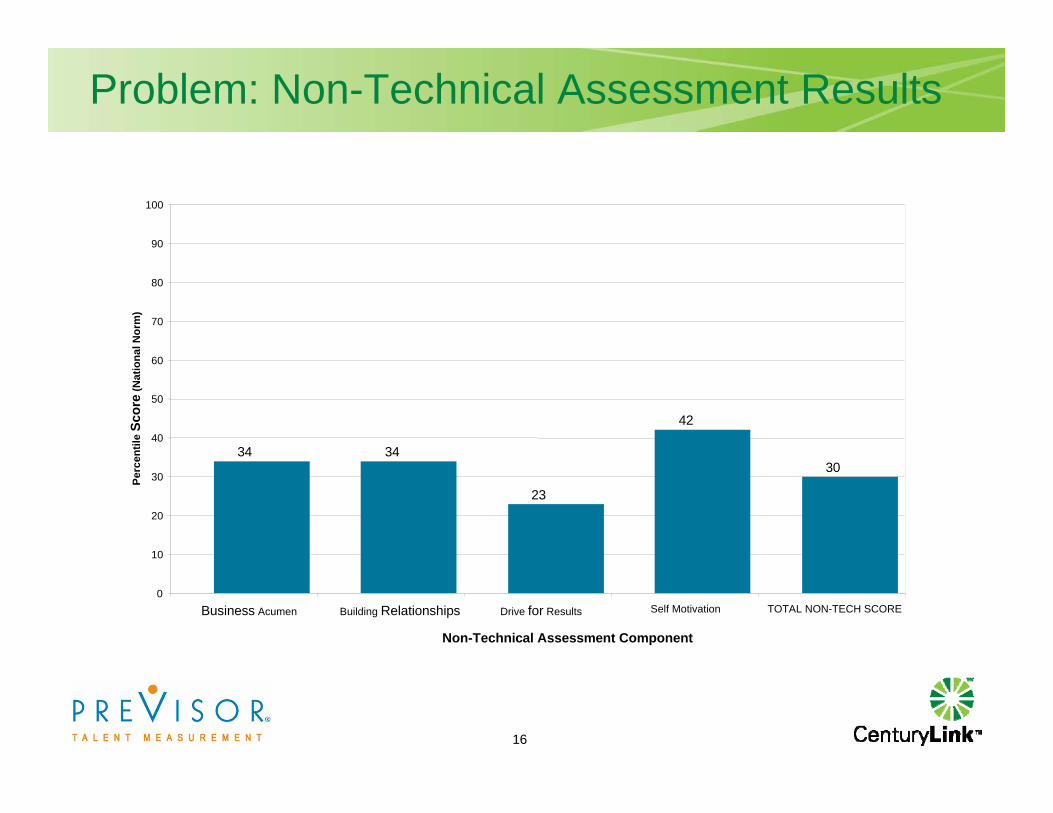
Problem: Non-Technical Assessment Results
34 34
23
42
30
0
10
20
30
40
50
60
70
80
90
100
Business Acumen Building Relationships Drive for Results Self Motivation TOTAL NON-TECH SCORE
Non-Technical Assessment Component
Perc
entil
e Sc
ore
(Nat
iona
l Nor
m)
17
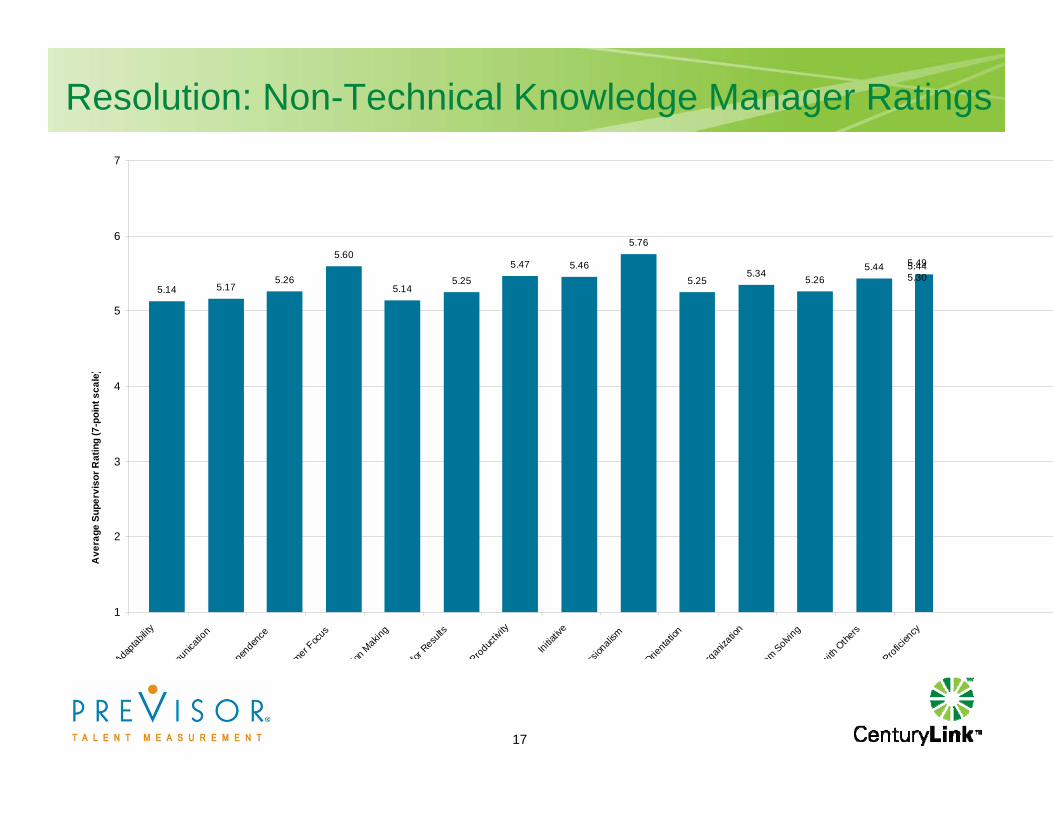
Resolution: Non-Technical Knowledge Manager Ratings
5.14 5.175.26
5.60
5.145.25
5.47 5.46
5.76
5.255.34
5.265.44 5.495.44
5.30
1
2
3
4
5
6
7
Adaptabil
ity
municati
on
epen
denc
e
omer F
ocus
ion M
aking
for R
esults
Produc
tivity
Initia
tive
ssion
alism
Orientatio
n
Organiza
tion
em Solving
with O
thers
Proficien
cy
Ave
rage
Sup
ervi
sor R
atin
g (7
-poi
nt s
cale
)
18
Cascading Results to Organization
Met with Directors, Regional Managers, and Managers for each region• Overview of project and results• Reviewing and using roll-up reports• Strategies for meeting with engineers • Notes on interpreting results• Provided point of contact from HR and PreVisor to
provide ongoing support- Conducted follow-up meetings/training as needed
19
Reviewing and Using Roll-Up Reports
Reports are a tool to identify organizational, regional, and manager/group level needs
Organizational and regional data:• Strategic planning• Organizational training and development• Budget projections• Comparisons across/within regions
Manager/Group data:• Tactical planning• Team training and development• Assigning and managing teams• Allocating work load
20
Reviewing & Using Individual Reports
Organizational and group reports provide baseline and contextIndividual gap assessment reports
• Identify areas of strength and developmental opportunities• Identify disconnects between assessment results and performance
ratings• Anticipate employee’s questions and areas of concern
Individual review/feedback sessions• Establish organizational and group level results as baseline• Review individual report • Use results to help prepare 2009 performance plan
Additional/future uses• Gap analysis results are a tool to assist with:
- Performance management- Coaching and mentoring- Training and development opportunities
21
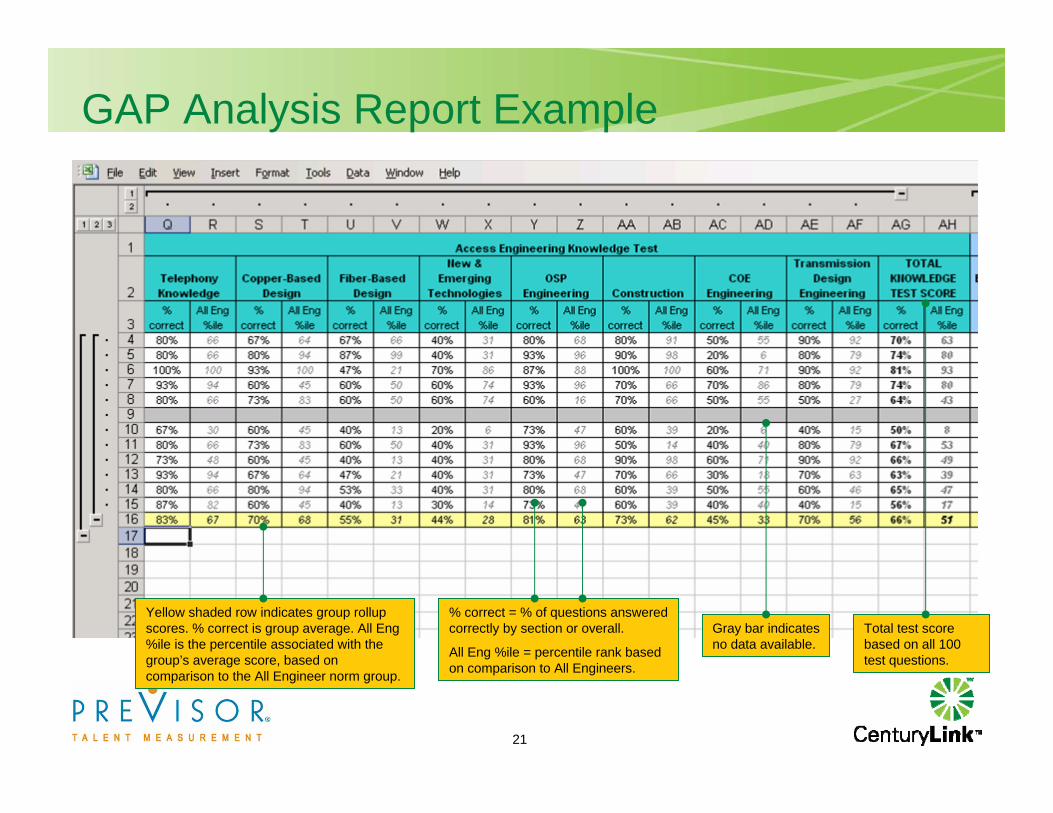
GAP Analysis Report Example
Gray bar indicates no data available.
Total test score based on all 100 test questions.
Yellow shaded row indicates group rollup scores. % correct is group average. All Eng %ile is the percentile associated with the group’s average score, based on comparison to the All Engineer norm group.
% correct = % of questions answered correctly by section or overall.
All Eng %ile = percentile rank based on comparison to All Engineers.
22
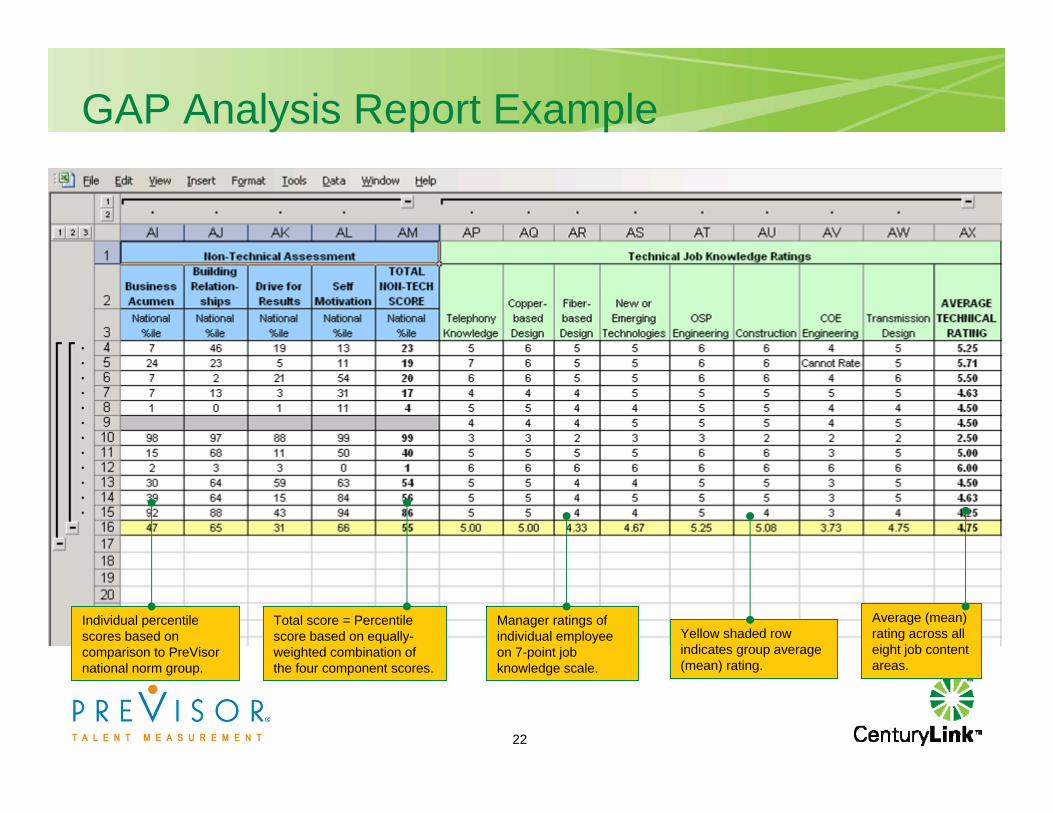
GAP Analysis Report Example
Individual percentile scores based on comparison to PreVisor national norm group.
Total score = Percentile score based on equally-weighted combination of the four component scores.
Yellow shaded row indicates group average (mean) rating.
Manager ratings of individual employee on 7-point job knowledge scale.
Average (mean) rating across all eight job content areas.
23
GAP Analysis Report Example
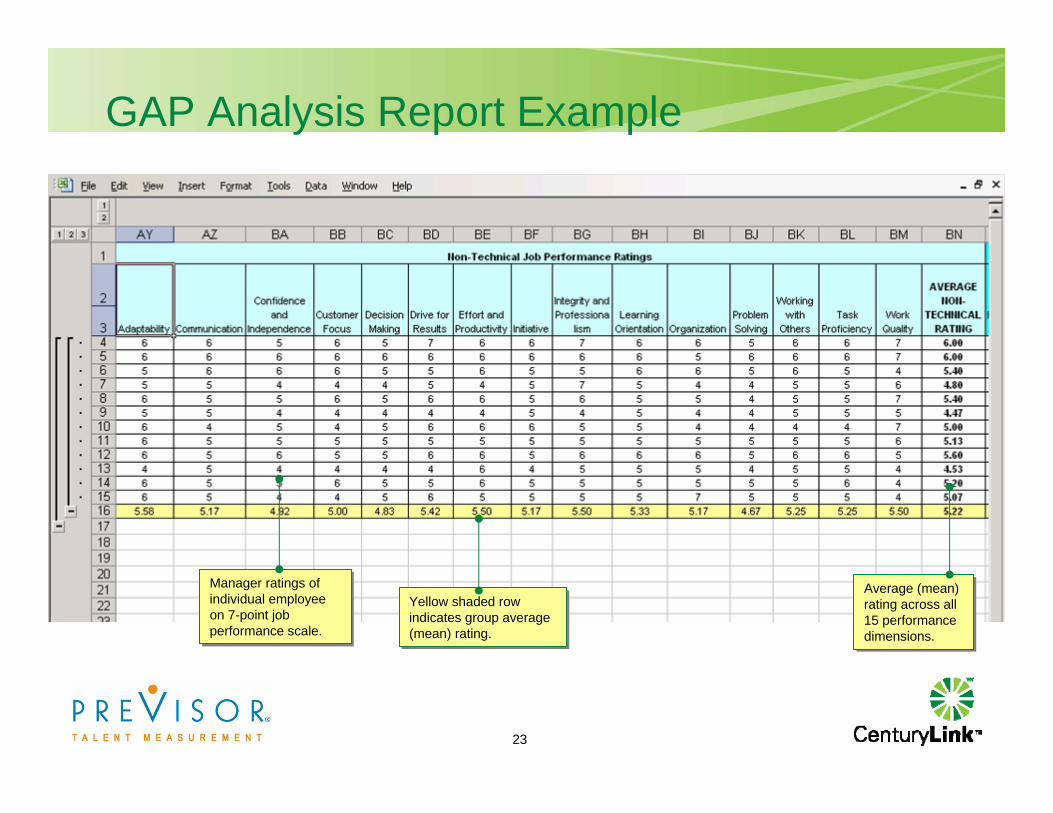
Yellow shaded row indicates group average (mean) rating.
Yellow shaded row indicates group average (mean) rating.
Manager ratings of individual employee on 7-point job performance scale.
Manager ratings of individual employee on 7-point job performance scale.
Average (mean) rating across all 15 performance dimensions.
Average (mean) rating across all 15 performance dimensions.
24
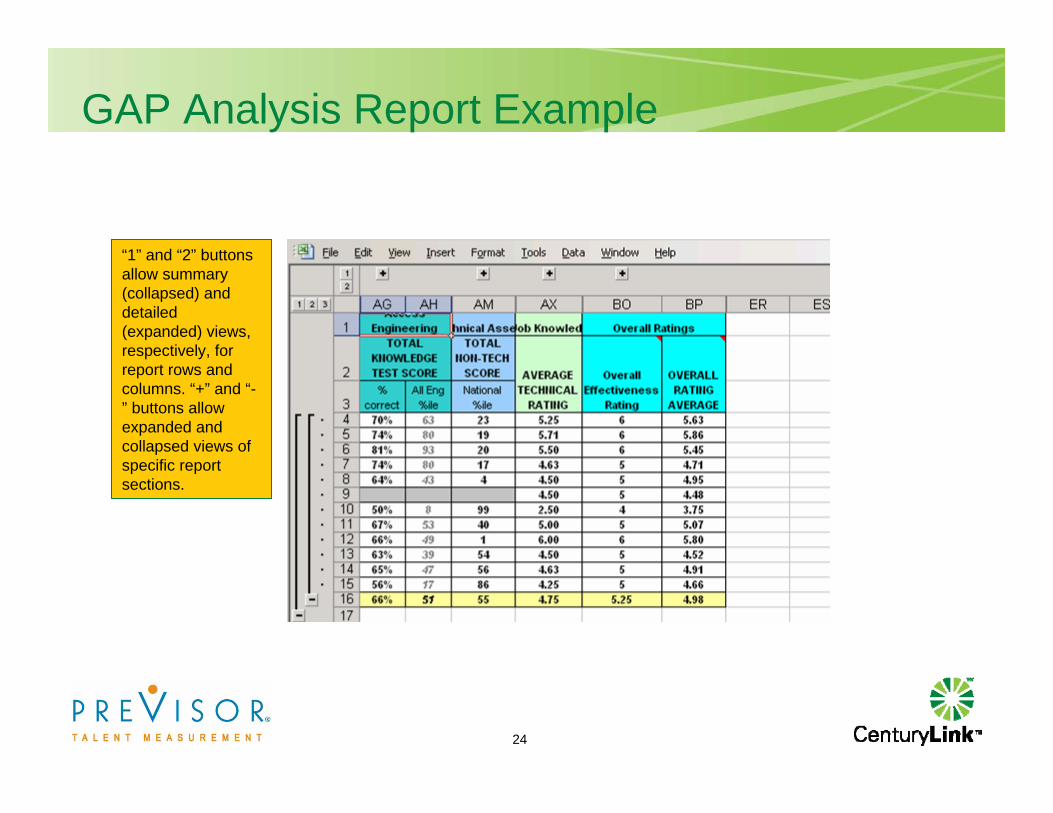
GAP Analysis Report Example
“1” and “2” buttons allow summary (collapsed) and detailed (expanded) views, respectively, for report rows and columns. “+” and “-” buttons allow expanded and collapsed views of specific report sections.
25
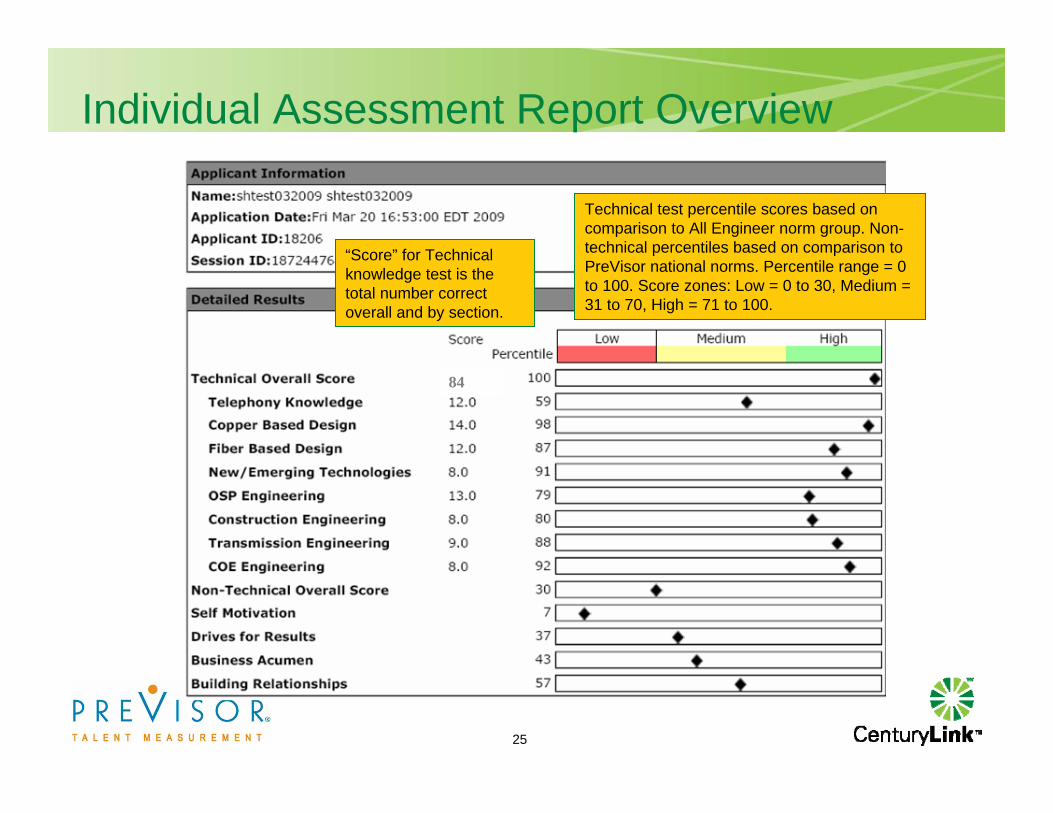
Individual Assessment Report Overview
“Score” for Technical knowledge test is the total number correct overall and by section.
Technical test percentile scores based on comparison to All Engineer norm group. Non-technical percentiles based on comparison to PreVisor national norms. Percentile range = 0 to 100. Score zones: Low = 0 to 30, Medium = 31 to 70, High = 71 to 100.
84
26
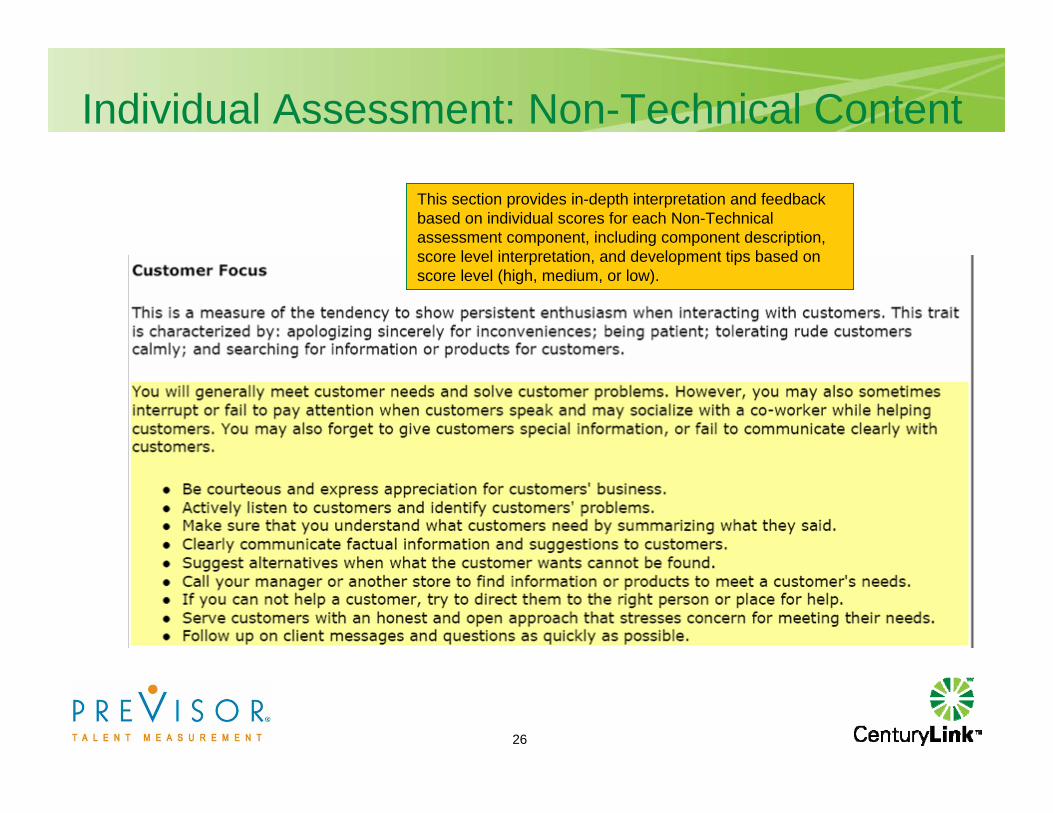
Individual Assessment: Non-Technical Content
This section provides in-depth interpretation and feedback based on individual scores for each Non-Technical assessment component, including component description, score level interpretation, and development tips based on score level (high, medium, or low).
27
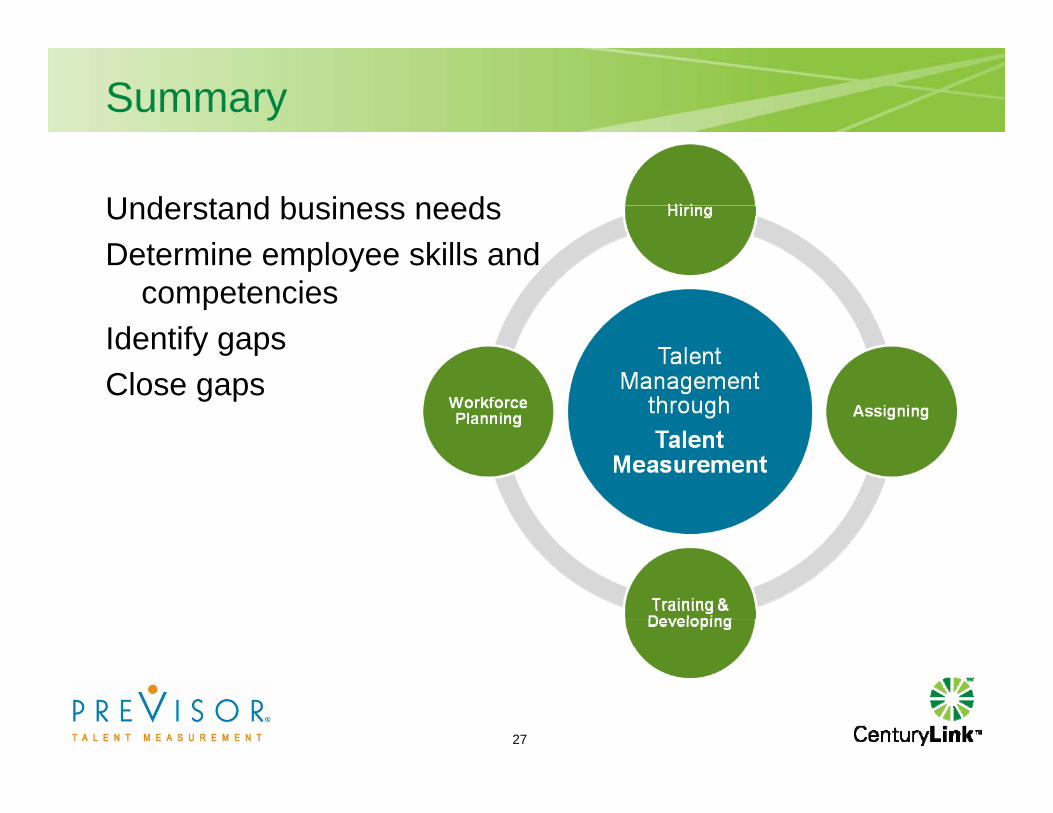
Summary
Understand business needsDetermine employee skills and
competencies Identify gapsClose gaps