ipm model – nuclear p
TRANSCRIPT
IPM Model – Nuclear Power Plant Costs
Nuclear Power Plant Life Extension Cost Development Methodology
Final
January 2018
Project 13527-001 Eastern Research Group, Inc.
Prepared by
55 East Monroe Street • Chicago, IL 60603 USA • 312-269-2000

i
LEGAL NOTICE
This analysis ("Deliverable") was prepared by Sargent & Lundy, L.L.C. ("S&L"), expressly for
the sole use of Eastern Research Group, Inc. ("Client") in accordance with the agreement between
S&L and Client. This Deliverable was prepared using the degree of skill and care ordinarily
exercised by engineers practicing under similar circumstances. Client acknowledges: (1) S&L
prepared this Deliverable subject to the particular scope limitations, budgetary and time
constraints, and business objectives of the Client; (2) information and data provided by others
may not have been independently verified by S&L; and (3) the information and data contained in
this Deliverable are time sensitive and changes in the data, applicable codes, standards, and
acceptable engineering practices may invalidate the findings of this Deliverable. Any use or
reliance upon this Deliverable by third parties shall be at their sole risk.
This work was funded by the U.S. Environmental Protection Agency (EPA) through Eastern
Research Group (ERG) as a contractor and reviewed by ERG and EPA personnel.

CONTENTS
Section Page
ii
1. PURPOSE ................................................................................................................................................... 1-1
1.1 Background .............................................................................................................................................. 1-1
2. METHODOLOGY AND INPUTS ............................................................................................................ 2-1
2.1 Reference Plants ....................................................................................................................................... 2-1
2.1.1 PWR Reference Plant ....................................................................................................................... 2-1
2.1.2 BWR Reference Plant ...................................................................................................................... 2-1
2.1.3 Reference Plant Life Extension Activities ....................................................................................... 2-2
3. HISTORICAL PLANT EXPENSES ........................................................................................................ 3-1
3.1 Historical Capital Expenditures ............................................................................................................... 3-1
3.2 Historical O&M Expenditures ................................................................................................................. 3-2
3.3 Historical Fuel Costs ................................................................................................................................ 3-2
4. PROJECTED PLANT EXPENSES .......................................................................................................... 4-1
4.1 Projected Capital Expenditures ................................................................................................................ 4-1
4.2 Projected O&M Expenditures .................................................................................................................. 4-5
4.3 Projected Fuel Costs ................................................................................................................................. 4-6
5. CONCLUSION ........................................................................................................................................... 5-1
5.1 Capital Cost .............................................................................................................................................. 5-1
5.2 O&M Cost ................................................................................................................................................ 5-1

TABLES AND FIGURES
Table or Figure Page
iii
Table 2-1 — Life Extension Activities ................................................................................................................ 2-2
Figure 4-1 — Historical U.S. Nuclear Annual Capital Expenditures (USD2017 / kW) ......................................... 4-1
Figure 4-2 — Projected U.S. Nuclear Annual Capital Expenditures (USD2017 / kW) ......................................... 4-3
Figure 4-3 — Projected U.S. Nuclear Fleet Annual O&M (Ex-Fuel) Costs (USD2017 / kW) .............................. 4-5
Figure 4-4 — Projected Annual Fuel Costs (USD2017 / kW) ................................................................................ 4-7

13027-001 Nuclear Power Plant Life Extension Cost
1-1
1. PURPOSE
The primary purpose of this report is to provide generic order-of-magnitude costs for operating nuclear power
plant life extension from 40 to 60 years as well as from 60 to 80 years. Cost estimates developed for the
integrated planning model (IPM) are based primarily on a statistical evaluation of cost data available from
various industry publications as well as Sargent & Lundy’s proprietary database and do not take into
consideration site-specific cost issues. By necessity, the cost methodology was designed to approximate the
operating fleet of nuclear power plants as a whole.
1.1 BACKGROUND
The Clean Air Markets Division (CAMD) of the U.S. Environmental Protection Agency (EPA) directed Eastern
Research Group, Inc. and Sargent & Lundy LLC to perform the following task:
Collect industry-wide publicly-available data to provide a consistent methodology for estimating costs for 40 to
60 years and 60 to 80 years life extension of U.S. nuclear power plants.
It is understood that EPA will use this information to update their Integrated Planning Model (IPM) to evaluate
electric generating units for impact on the goals of the Clean Air Act (CAA).

13027-001 Nuclear Power Plant Life Extension Cost
2-1
2. METHODOLOGY AND INPUTS
Costs for life extension are developed based on best estimates of anticipated costs associated with life extension.
These costs are considered along with the plant age associated with their time of occurrence.
2.1 REFERENCE PLANTS
A hypothetical nuclear power plant profile is developed to be representative of the entire U.S. fleet of
Pressurized Water Reactor (PWR) and Boiling Water Reactor (BWR) plants, in aggregate. In order to capture
any differences between the two technologies, one PWR Reference Plant and one BWR Reference Plant are
developed.
Plant operation during 40 to 60 years is referred to as the “period of extended operation” or “1st PEO.” Plant
operation during 60 to 80 years is referred to as the “2nd PEO.”
The profile for each reference plant is as follows.
2.1.1 PWR Reference Plant
The following attributes are assumed for the PWR Reference Plant:
• 1000 MW Capacity
• Licensed in 1978 for 40 years of operation
• Replaced steam generators in 2000
• Replaced feedwater heaters in 2002
• Replaced reactor vessel head in 2002
• Obtained renewed license in 2005 – now licensed to operate until 2038
• Upgraded to turbine digital controls in 2009
• Enters 1st PEO in 2018
• Will submit application for second license renewal in 2026
• Will enter 2nd PEO in 2038
2.1.2 BWR Reference Plant
The following attributes are assumed for the BWR Reference Plant:
• 1000 MW Capacity
• Licensed in 1974 for 40 years of operation

13027-001 Nuclear Power Plant Life Extension Cost
2-2
• Replaced feedwater heaters in 2002
• Replaced reactor vessel head in 2002
• Obtained renewed license in 2008 – now licensed to operate until 2034
• Upgraded to turbine digital controls in 2009
• Entered 1st PEO in 2014
• Will submit application for second license renewal in 2022
• Will enter 2nd PEO in 2034
2.1.3 Reference Plant Life Extension Activities
As U.S. nuclear plants exceed their original 40-year licenses, several activities are expected to be required for
their continued operation through 60 and 80-year lifetimes. The major activities can be broken down into three
categories: development of a license renewal application (including NRC review & approval), implementation
of commitments related to the renewed license, and equipment replacement or refurbishment.
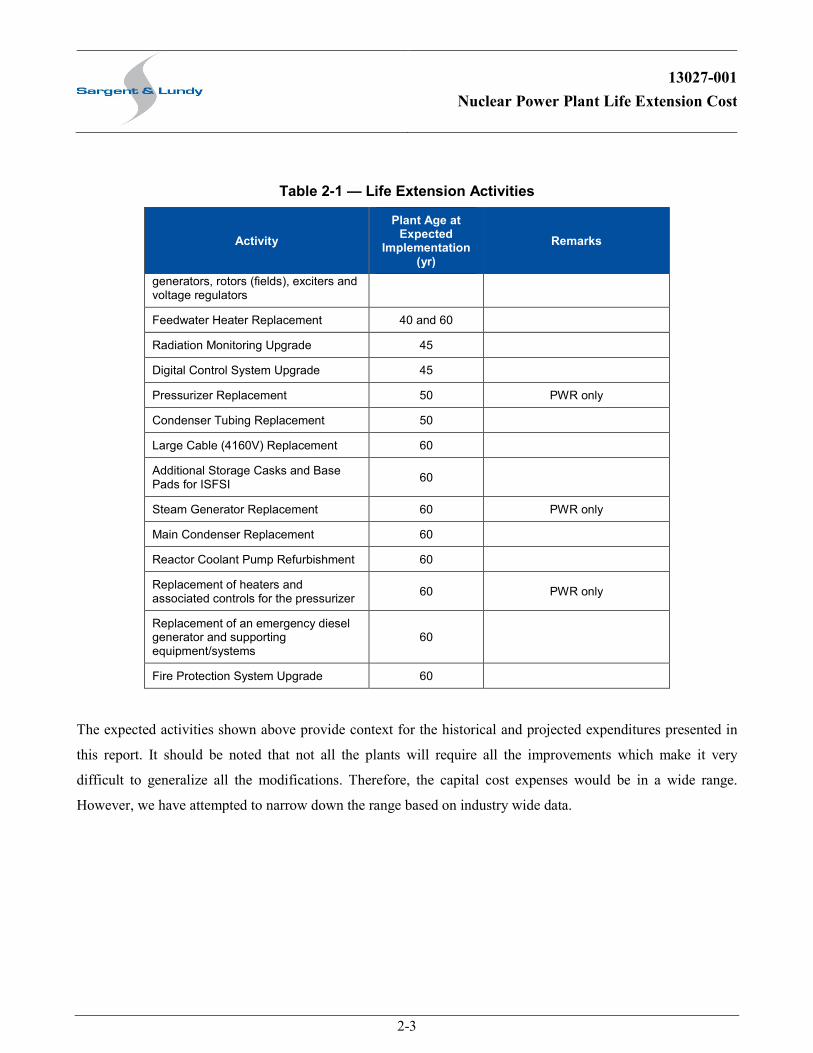
These activities are listed in Table 2-1 along with the expected plant age at the time of implementation.
Table 2-1 — Life Extension Activities
Activity Plant Age at
Expected Implementation
(yr) Remarks
Development of a License Renewal Application
2nd License Renewal 45
Implementation of Commitments Related to Renewed License
1st PEO License Renewal 40
2nd PEO License Renewal 60
Equipment Replacement / Refurbishment
Main Turbine Replacement 40
Heat Exchanger Replacements 45
Service Water Piping Replacement 50
Replacement or refurbishment of main 50
13027-001 Nuclear Power Plant Life Extension Cost
2-3
Table 2-1 — Life Extension Activities
Activity Plant Age at
Expected Implementation
(yr) Remarks
generators, rotors (fields), exciters and voltage regulators
Feedwater Heater Replacement 40 and 60
Radiation Monitoring Upgrade 45
Digital Control System Upgrade 45
Pressurizer Replacement 50 PWR only
Condenser Tubing Replacement 50
Large Cable (4160V) Replacement 60
Additional Storage Casks and Base Pads for ISFSI 60
Steam Generator Replacement 60 PWR only
Main Condenser Replacement 60
Reactor Coolant Pump Refurbishment 60
Replacement of heaters and associated controls for the pressurizer 60 PWR only
Replacement of an emergency diesel generator and supporting equipment/systems
60
Fire Protection System Upgrade 60
The expected activities shown above provide context for the historical and projected expenditures presented in
this report. It should be noted that not all the plants will require all the improvements which make it very
difficult to generalize all the modifications. Therefore, the capital cost expenses would be in a wide range.
However, we have attempted to narrow down the range based on industry wide data.

13027-001 Nuclear Power Plant Life Extension Cost
3-1
3. HISTORICAL PLANT EXPENSES
S&L conducted a literature survey to identify the available capital and O&M cost data. The best source of
reliable data was identified as data collected by Federal Energy Regulatory Commission (FERC) since 1994.
FERC Form No. 1 collects financial and operational information from public electric utilities. FERC Form 1
reports are considered to be non-confidential public use information. The select data was provided to S&L for
capital and O&M cost analysis by EPA’s Clean Air Markets Division.
Sargent & Lundy extracted the publically available FERC data for the U.S. nuclear fleet (from 1994-2016)
regarding O&M and capital expenditures from 70 U.S. nuclear power plants. FERC Form 1 reports include the
field Total Cost of Plant, or capital cost, the year to year change in which represents annual capital expenditures.
The data input to our analyses is screened based on this field to reject years showing negative capital
expenditures. Additionally, annual data is rejected for non-continuous years (e.g. 2011 … 2013, skipping 2012).
Our benchmarking analyses are presented in the following sections.
3.1 HISTORICAL CAPITAL EXPENDITURES
Historical annual capital spending data on PWR plants from FERC was plotted against the age of the plant on
the horizontal axis. Also plotted was the average capital expenditure for each plant of the same age. Note that
cost data is presented in 2017 dollars per kW of nameplate capacity (USD2017 / kW). The average annual capital
expense across all PWR plant ages was approximately 45 USD2017 / kW.
Similarly, historical BWR capital costs were also plotted. The average annual capital expense across all BWR
plant ages was approximately 40 USD2017 / kW.
Review of the annual capital expenses for PWR and BWR plants shows similar levels of capital expenditures.
For each technology, generally higher spending is accompanied with a larger variance as the plants approach 40
years of age and beyond. Particularly for the BWR data, fewer data points are available and variation is higher.
Since the historical spending between PWR and BWR was roughly similar, the capital expenditures across the
entire nuclear fleet was approximately 44 USD2017 / kW.

13027-001 Nuclear Power Plant Life Extension Cost
3-2
Average annual capital expenses were seen to be increasing with plant age. This data was consistent with the
expectation that capital expenditures would increase as equipment aging necessitates replacement. Furthermore,
additional capital may be required to meet licensing commitments agreed to as part of life extension.
3.2 HISTORICAL O&M EXPENDITURES
Historical PWR annual O&M costs (ex-fuel) were analyzed. The data from FERC was plotted against the age of
the plant on the horizontal axis. Also plotted was the average O&M cost spent for each plant of the same age.
The average annual O&M expense across all PWR plant ages was approximately 128 USD2017 / kW.
Similarly, historical BWR O&M costs (ex-fuel) were also plotted. The average annual O&M expense across all
BWR plant ages was approximately 143 USD2017 / kW.
Review of the O&M expenses for PWR and BWR plants showed similar levels of expenditures with BWR
expenditures modestly exceeding those for PWR plants. It was noted that fewer data points are available for
BWRs than for PWRs.
The historical O&M expenditures across the entire nuclear fleet across all U.S. were approximately
132 USD2017 / kW; however, expenses were seen to increase modestly with plant age. This increase may be the
result of component aging necessitating additional upkeep and monitoring.
3.3 HISTORICAL FUEL COSTS
Historical U.S. nuclear annual fuel costs were also analyzed. The data from FERC was plotted against the
calendar year on the horizontal axis. Also plotted was the average fuel cost for that year.
The average annual fuel cost over the period was approximately 49 USD2017 / kW.

13027-001 Nuclear Power Plant Life Extension Cost
4-1
4. PROJECTED PLANT EXPENSES
Sargent & Lundy evaluates the estimated annual capital expenditures associated with life extension in the
context of expected capital improvements and historical capital spending.
4.1 PROJECTED CAPITAL EXPENDITURES
Average annual historical capital spending from Section 3.1 is shown in Figure 4-1 with trendline data added
and the time scale extended to 80 years. Similar to previous sections, cost data is presented in 2017 dollars per
kW of nameplate capacity (USD2017 / kW).
Figure 4-1 — Historical U.S. Nuclear Annual Capital Expenditures (USD2017 / kW)
0
50
100
150
200
250
300
0 10 20 30 40 50 60 70 80
Annu
al C
apita
l Cos
ts (U
SD20
17/k
W)
Plant Age (years)
Historical Average

13027-001 Nuclear Power Plant Life Extension Cost
4-2
The average annual capital expense across all U.S. nuclear plants is shown to be increasing at a rate of
$1.25/ kW per year. As previously noted, fewer data points are available for plants approaching 40 years in
operation; however, the available data shows capital expenses rising during this period of plant age.
Sargent & Lundy believes the rise in expenses as plants approach 40 years of age seen in the historical data
reflects preparations for extended operation through license renewal application and implementation,
accompanied with limited replacement of aging components. These activities necessitate elevated capital costs
at the beginning of the period of extended operation. Therefore, Sargent & Lundy is of the opinion that long
term life extension costs, at least as applicable to the 1st PEO (40 – 60 years), are being captured in the
publically available historical spending data and can provide a reasonable basis for projected future expenses
over the 40 – 60-year period.
However, capital investments for activities associated with the 2nd period of extended operation are likely not
reflected in the available historical spending data since the majority of investments identified in Section 2.1.3
have not been undertaken by the U.S. nuclear fleet. Therefore, capital spending for the 2nd PEO is expected to be
higher than current data shows, particularly near the beginning of the 2nd period of extended operation.
The nature of capital investment at nuclear power plants follows the familiar path of large up-front expenditures
recovered over subsequent years of operation. As such, capital spending is expected to be above average in the
beginning of the operational period and below average at the end as the remaining years of useful life available
to recover the capital diminish. The projection of the time dependent path of capital expenditures is beyond the
scope of this study. Instead, an average yearly capital expense is developed in context of expected and historical
plant expenses over the term associated with life extension.
Sargent & Lundy’s estimated capital costs associated with life extension are shown in Figure 4-2.

13027-001 Nuclear Power Plant Life Extension Cost
4-3
Figure 4-2 — Projected U.S. Nuclear Annual Capital Expenditures (USD2017 / kW)
0
50
100
150
200
250
300
0 10 20 30 40 50 60 70 80
Annu
al C
apita
l Cos
ts (U
SD20
17/k
W)
Plant Age (years)
Historical Average
Projected 40 to 80 Year Life
In Figure 4-2 above, the historical spending data (triangles) is shown with a regression trendline extrapolated to
plant age 50 years. As a result of the data variance and inherent difficulty of future projections, linear regression
is chosen for simplicity, which provides a reasonable fit of the observed data and trend. As previously discussed,
extrapolation of current spending is reasonable to estimate the costs of the 1st PEO (40-60 years). For the 2nd
PEO (60-80 years), additional capital will likely be required beyond current spending. However, that spending
will occur in advance of the 2nd PEO as plants make preparations and extend the period available for capital
recovery. Based on the timeframe presented in Section 2.1.3, Sargent & Lundy expects plants to begin
investment for 2nd PEO at approximately plant age 50 years. Accordingly, Figure 4-2 presents a constant annual
capital expenditure during 50 to 80 years. The annual capital expenditures leading up to and during the 2nd PEO
will vary depending on the plant condition and electric market situation. For simplicity, Sargent & Lundy
assumed a constant $70 USD2017/kW.
13027-001 Nuclear Power Plant Life Extension Cost
4-4
A projection of $70 USD2017/kW annual capital expenditures beginning in year 50 is nearly coincident with the
average historical spending trendline. This projection is further bolstered by surveys of operating nuclear
utilities’ projected capital expenditures, which are consistent with the level of projected spending shown in
Figure 4-2. Projections about future spending involve considerable uncertainty, however, the consideration of
both observed historical spending trends as well as utility expectations for the future provide context to consider
these projections reasonable.
The projected annual capital expenses shown in Figure 4-2 are summarized to be used in the IPM as follows:
Approximate correlation for first 50 years of life is derived as
Annual Cost (USD2017/kW) = 17 + 1.25 AGE
For example, the annual capital cost at 40 years would be: 17 + 1.25 *40 = $67/kW
The annual capital cost after 50 years is projected to be approximately $70/kW.
The overnight capital expenditure would be in the range of $750 to $1,200/kW depending on the discount rate
and approximately 30 years of recovery period.

13027-001 Nuclear Power Plant Life Extension Cost
4-5
4.2 PROJECTED O&M EXPENDITURES
Average annual historical O&M spending from Section 3.2 is shown in Figure 4-3 with a trendline added and
the time scale extended to 80 years. Similar to previous sections, cost data is presented in 2017 dollars per kW
of nameplate capacity (USD2017 / kW).
Figure 4-3 — Projected U.S. Nuclear Fleet Annual O&M (Ex-Fuel) Costs (USD2017 / kW)
0
50
100
150
200
250
300
350
0 10 20 30 40 50 60 70 80
Annu
al O
&M
Cos
ts (U
SD20
17/k
W)
Plant Age (years)
Historical Average
Projection
Review of the historical data shows that the average annual O&M expenditure (ex-fuel) is increasing at a rate of
0.56 USD2017 / kW for each year of plant age. However, aging equipment requires higher O&M expenditures to
maintain. As increased capital is deployed to replace equipment, lower O&M costs are expected as a result of
increased reliability and a reduction in the need for continual monitoring. Additionally, nuclear utilities are
undertaking significant steps to reduce O&M costs industry-wide. Sargent & Lundy expects the refurbishment
efforts for life extension to result in cost savings during the initial deployment of new equipment, which is
expected to occur around plant age 50 years. As such, the historical trendline is reset downward at year 50 in

13027-001 Nuclear Power Plant Life Extension Cost
4-6
Figure 4-3 to the average annual cost for the first 10 years of available plant ages (120 USD2017 / kW). This
reflects the expectation that O&M annual costs for a refurbished plant will resemble those of a younger plant as
well as the fact that recent plant closings have been single unit facilities, leaving a higher fraction of multiple
unit and fleet-operated facilities for which economies of scale provide operating cost savings. Beyond 50 years
of age, the projected trend is the same as the historical trend observed. This reflects the expectation that O&M
annual costs for a refurbished plant will increase similarly to those observed for the aging of the original plant
equipment. The following trend can be used to simulate the annual data.
1) From 10 year to first 50 year - Annual cost $/kW = 116 + 0.56 * (Plant Age)
2) From 50 year onward - Annual cost $/kW = 91 + 0.56 * (Plant Age)
4.3 PROJECTED FUEL COSTS
Average annual U.S. nuclear fuel costs from Section 3.3 is shown in Figure 4-4. Similar to previous sections,
cost data is presented in 2017 dollars per kW of nameplate capacity (USD2017 / kW).

13027-001 Nuclear Power Plant Life Extension Cost
4-7
Figure 4-4 — Projected Annual Fuel Costs (USD2017 / kW)
0
10
20
30
40
50
60
70
80
90
100
1995 2000 2005 2010 2015 2020 2025 2030 2035 2040 2045 2050 2055 2060
Aver
age
Fuel
Cos
t (U
SD20
17/k
W)
Calendar Year
Average
Projected
Review of the historical data shows that fuel costs have oscillated over time. Costs have increased since 2010
but declined in the last three years. The market conditions associated with fuel costs are beyond the scope of this
evaluation. However, stable long-term demand for uranium is expected as the number of users is not expected to
grow dramatically. No significant degradation in efficiency is expected for nuclear power plants which would
yield increased fuel consumption for the same level of generation. Sargent & Lundy notes that the average fuel
cost for the last five years of available data is approximately 58 USD2017 / kW. Based on the historical trends, a
reasonably conservative estimate for fuel costs is the projection of the previous five-year fuel costs over the
duration of 1st and 2nd PEO.

13027-001 Nuclear Power Plant Life Extension Cost
5-1
5. CONCLUSION
The industry-wide publicly-available cost information obtained for this report indicates that expenditures
planned for the activities listed in Section 2 for operation during 40 to 60 years and 60 to 80 years are
commensurate with the projected costs described in Section 4.
5.1 Capital Cost
Approximate correlation for first 50 years of life is derived as
Annual Cost (USD2017/kW) = 17 + 1.25 AGE
The annual capital cost after 50 years is projected to be approximately $70/kW.
The overnight capital expenditure would be in the range of $750 to $1,200/kW depending on the discount rate
and approximately 30 years of recovery period.
5.2 O&M Cost
The following trend can be used to simulate the annual O&M cost.
1) From 10 year to first 50 year - Annual cost $/kW = 116 + 0.56 * (Plant Age)
2) From 50 year onward - Annual cost $/kW = 91 + 0.56 * (Plant Age)