ipo allocations: discriminatory or discretionary? and wilhelm 2002.pdf · ipo allocations:...
TRANSCRIPT

Journal of Financial Economics 65 (2002) 167–201
IPO allocations: discriminatory ordiscretionary?$
Alexander P. Ljungqvista,b,*, William J. Wilhelm Jr.c,d
aStern School of Business, New York University, 44 West Fourth Street Suite 9-190, New York,
NY 10012-1126, USAbCentre for Economic Policy Research (CEPR), Goswell Road, London, EC1U 7RR, UK
cSa.ıd Business School, Oxford University, Oxford OX11HP, UKdMcIntire School of Commerce, University of Virginia, Charlottesville, VA 22904, USA
Received 28 March 2001; received in revised form 30 July 2001
Abstract
We estimate the structural links between IPO allocations, pre-market information
production, and initial underpricing and find that (1) allocation policies favor institutional
investors, both in the US and worldwide; (2) increasing institutional allocations results in offer
prices that deviate more from the pre-marketing price range; (3) constraints on bankers’
discretion reduce institutional allocations and result in smaller price revisions, indicating
diminished information production; and (4) initial returns are directly related to information
production and inversely related to institutional allocations. Our results indicate that
discretionary allocations promote price discovery in the IPO market and reduce indirect
issuance costs for IPO firms. r 2002 Elsevier Science B.V. All rights reserved.
JEL classification: G32; G15; G24
Keywords: Initial public offerings; Bookbuilding; Underpricing; Intermediation; Allocation policy
$We are especially grateful to the referee for detailed comments that substantially improved the paper.
We also thank Francesca Cornelli, William Greene, Michel Habib, Maureen O’Hara, Jay Ritter, G.
William Schwert (the editor), and participants at the NYSE ‘Global Equity Markets in Transition’
conference (Hawaii, 2001), the American Finance Association meetings (Atlanta, 2002), the Third
Toulouse Finance Workshop, and seminars at Cambridge University, Johann-Wolfgang-von-Goethe
Universit.at Frankfurt, the University of North Carolina at Chapel Hill, Oxford University, the University
of Virginia, and the University of Wisconsin-Madison for helpful comments. We wish to thank the many
companies, banks, and bourses that made data available. All errors are our own.
*Corresponding author. Stern School of Business, New York University, 44 West Fourth Street Suite
9-190, New York, NY 10012-1126, USA. Tel.: +1-212-998-0304; fax: +1-212-995-4233.
E-mail address: [email protected] (A.P. Ljungqvist).
0304-405X/02/$ - see front matter r 2002 Elsevier Science B.V. All rights reserved.
PII: S 0 3 0 4 - 4 0 5 X ( 0 2 ) 0 0 1 3 8 - 1

1. Introduction
IPO allocation policies favor institutional investors. This is well known, and fairlywell documented, in the U.S. In this paper, we show that the same is true worldwide.Averaging across 37 countries and 1,032 IPOs between 1990 and 2000, we find thatshare allocations to institutional investors are virtually double those received byretail investors. The available evidence from the U.S. indicates much the same(Hanley and Wilhelm, 1995; Aggarwal et al., 2001).
How should this empirical fact be interpreted? In the U.S., allocation policies arediscretionary—there are few rules to guide or constrain investment bankers. Outsidethe U.S., allocation discretion is frequently constrained and yet the end result, inallocations at least, appears similar to that in the U.S. Benveniste and Wilhelm(1990) suggest that banker discretion can benefit issuers facing asymmetricallyinformed investors by inducing such investors to reveal their information in returnfor favorable allocations. On the other hand, it is not hard to imagine bankersfavoring institutional investors with whom they maintain long-term relationships.The open question is whether, on net, ‘discretionary’ share allocation is beneficial orwhether it should more accurately and pejoratively be thought of as a‘discriminatory’ practice that serves the bankers’ interests at the expense of otherparties to the transaction.
This question gained force on December 7, 2000 when the Wall Street Journal
(p. C1) alleged that in exchange for IPO allocations, bankers require institutionalinvestors to purchase shares in the secondary market or pay unusually high tradingcommissions (see also subsequent articles in the Wall Street Journal as well as theseven-part series beginning May 2, 2001 in Red Herring). The Securities andExchange Commission and the U.S. attorney’s office in Manhattan responded byannouncing investigations to determine whether these allegedly common demandsviolate regulations barring tie-ins. It is worth noting that discretionary use of eithertactic provides for extracting a unique all-in ‘price’ from each investor receiving aninitial allocation and therefore could be interpreted as a means of (implicit) pricediscrimination. Explicit price discrimination in the sale of IPOs is prohibited in theU.S. as well as in most other jurisdictions.
In this paper we attempt to shed light on the rather complex question of whethersuch discriminatory practices undermine primary market efficiency. The complexitybegins with identifying an appropriate objective for pricing and allocation policies.The bulk of academic theory treats maximization of proceeds received by the issueras the appropriate objective. Although there is merit in this assumption in thecontext of well-developed capital markets, it is less obviously appropriate forprivatization IPOs or when it is hoped that broad share ownership will spur thedevelopment of secondary markets or serve some other public interest. Some mighteven argue for non-discriminatory allocations on egalitarian grounds regardless ofthe consequences for issuing firms.
For the purpose at hand, however, we implicitly take proceeds maximization, netof issue costs, as the appropriate objective of a pricing and allocation policy. Webelieve this approach sheds more light on the ongoing debate in the U.S. and is
A.P. Ljungqvist, W.J. Wilhelm Jr. / Journal of Financial Economics 65 (2002) 167–201168

increasingly germane to policymakers worldwide. But it also requires carefulconsideration of the source and magnitude of the indirect costs of issuance. Initialpublic offerings are typically discounted or ‘underpriced’, in the sense of large first-day price increases, and institutional investors are the primary beneficiaries.
Benveniste and Spindt (1989) argue that this substantial indirect cost ofbookbuilding reflects a quid pro quo arrangement with institutional investors whosenonbinding bids or ‘indications of interest’ provide the foundation for establishingthe issuer’s offer price. Absent ‘compensation’ (in the form of large allocations ofunderpriced shares), institutions would have little incentive to bid aggressively,knowing that doing so would only drive up the offer price. But indiscriminateallocation of underpriced shares rewards both informed (aggressive) and uninformedbidders. Although discriminatory allocation of underpriced shares diminishes theissuer’s proceeds from the offering ex post, in this view, expected proceeds aremaximized (Benveniste and Wilhelm, 1990; Sherman and Titman, 2000). Theempirical predictions from this theory are that allocation constraints diminishinformation production and the issuer’s expected net proceeds (as underpricing issubstituted for larger institutional allocations in the ‘compensation package’provided to institutional investors).1
Alternatively, allocation discretion might aggravate an agency problem betweenthe issuer and its banker (Baron, 1982) arising from the fact that bankers dealrepeatedly with institutional investors but infrequently with issuers. Biais et al.(2002) examine this possibility by assuming that bankers and institutional investorscollude to extract informational rents from issuers. Once again, the optimal priceand allocation mechanism (from the issuer’s perspective) favors informed investorswith discounted share allocations.2 However, in broad terms, agency problemsrelated to allocation discretion can be hypothesized to undermine the issuer’sinterests. Thus we might expect allocation constraints to diminish underpricing andlead to a complementary relation between initial returns and institutional allocations(as bankers curry favor among institutional investors by providing larger allocationsin discounted offerings).
1Benveniste et al. (1996) extend the analysis by showing that discretionary implementation of ‘penalty
bids’ designed to prevent immediate sale of initial share allocations by some investors can increase
expected proceeds by providing another instrument for price discrimination. Bankers routinely attempt to
prevent secondary market prices from declining below the offering price. In this context, penalty bids buoy
secondary market prices by counterbalancing selling pressure. In other words, they are economically
equivalent to the alleged demands from bankers that investors purchase shares in the secondary market in
exchange for initial share allocations. But allowing some investors to sell at the offer price, while
preventing others from doing so, is also equivalent to providing some initial investors with put options in
addition to their share allocations but withholding them from others. Thus for the same (offer) price, some
investors receive shares and put options while others receive only shares.2However, price discrimination is not optimal in this setting whereas both price and allocation
discrimination can be optimal in the Benveniste and Wilhelm (1990) setting. In a similar vein, Biais and
Faugeron-Crouzet (2002) identify a parallel between France’s Mise en vente auctions and bookbuilding by
establishing conditions under which both implement the optimal price and allocation mechanism.
A.P. Ljungqvist, W.J. Wilhelm Jr. / Journal of Financial Economics 65 (2002) 167–201 169
Although the limited documentation of allocation policy in the literature appearsconsistent with the Benveniste and Spindt (1989) interpretation, it is premature toaccept discretion as a good thing on the basis of these studies alone. Most empiricalstudies have focused on relatively narrow, reduced-form tests of the theory, oftenignoring serious endogeneity problems, rather than testing the broader structureimplied by the mechanism-design perspective.3 In this paper, we estimate a structuralmodel designed to put the mechanism-design theory to a more severe test. Onenoteworthy finding is that the bookbuilding theory survives our test.
Most existing tests of the bookbuilding theory have also been limited to the U.S.(Cornelli and Goldreich, 2000, 2001 are the noteworthy exceptions). The problemwith U.S. data, apart from the general unwillingness of U.S. banks to shareinformation about their allocation policies, is that it provides no useful alternativefor comparison. Banks maintain full allocation discretion in all U.S. firm-commitment IPOs. Outside the U.S., bookbuilding practices have virtuallysupplanted the traditional fixed-price offering (and its pro rata allocation policy)in much of Continental Europe and increasingly in Asia (Ljungqvist et al., 2001). Butthese countries have also imposed a wide range of regulatory constraints onallocation policies. At one extreme, the German primary markets are increasinglydominated by bookbuilding practices and, like the U.S., impose few constraints onhow shares are allocated. At the other extreme are countries like Australia wherefixed-price offerings with pro rata allocations are the default option given to issuingfirms. In the middle lie countries like France and the United Kingdom where issuerscan select from a range of underwriting practices and banks are subject to a varietyof constraints on the discretion they exercise in the allocation of shares.
This heterogeneity in allocation policy creates variation that increases the powerof our structural econometric model. In turn, estimation sheds light on whetherdiscretionary allocation is beneficial on net, and if so, under what circumstances. Thefollowing results should be of interest to policy makers:
* Constraints on bankers’ allocation discretion reduce institutional allocations.* Constraints on allocation discretion result in offer prices that deviate less from the
indicative price range established prior to bankers’ efforts to gauge demandamong institutional investors. We interpret this as indicative of diminishedinformation production.
* Initial returns are directly related to this measure of information production andinversely related to the fraction of shares allocated to institutional investors.
3See, for example, Hanley (1993). Hanley and Wilhelm (1995) and Cornelli and Goldreich (2000, 2001)
are constrained from estimating a structural model by the fact that they have allocation data only for a
single bank. The structural test performed by Biais et al. (2002) suffers from limited data and, for our
purposes, the fact that allocation policy in the Mise en vente, while discriminatory, provides bankers with
limited discretion. By contrast, Ljungqvist et al. (2001), using data similar to ours, account for the
econometric consequences of issuers selecting from a ‘menu’ of price and allocations mechanisms when
they go public.
A.P. Ljungqvist, W.J. Wilhelm Jr. / Journal of Financial Economics 65 (2002) 167–201170
We tentatively conclude that discretionary allocation does not pose a net cost toissuers because it promotes price discovery in primary markets and diminishes theattendant costs of information acquisition.
2. Sample and data
Our dataset spans the period January 1990 to May 2000 and covers a largefraction of the IPOs brought to market worldwide during the decade. The 1990s arenoteworthy both for the high level of primary market activity and also as a period ofunprecedented experimentation in the means by which issuing firms were marketedto investors. The sharp increase in global offerings required banks to developmechanisms to appeal to a wide range of investor preferences and abide by asimilarly wide range of regulatory constraints. By the end of the decade, a largefraction of IPOs were carried out by methods that involved discretionary shareallocation for at least part of the offering (Ljungqvist et al., 2001).
2.1. Sample construction
We assemble a large dataset of IPOs from a variety of sources, detailed below.While we do not have allocation data for every IPO in this dataset, we still require ascomprehensive a dataset as possible in order to derive certain measures of aggregateIPO activity for our econometric model. The econometric model, in turn, focuses onfirms floating in four countries—France, Germany, the U.K., and the U.S.—that aresubject to a wide range of constraints described later.
Throughout the paper, observations per country refer to the number of firmsgoing public in that country, including foreign issuers. We adopt this conventionbecause rules on allocation discretion are formulated at the level of the country oflisting, not the country of origin. When a company lists in more than one country,we define its main listing as being in its home country, or in the country where thebulk of the offering is conducted if it only lists abroad.
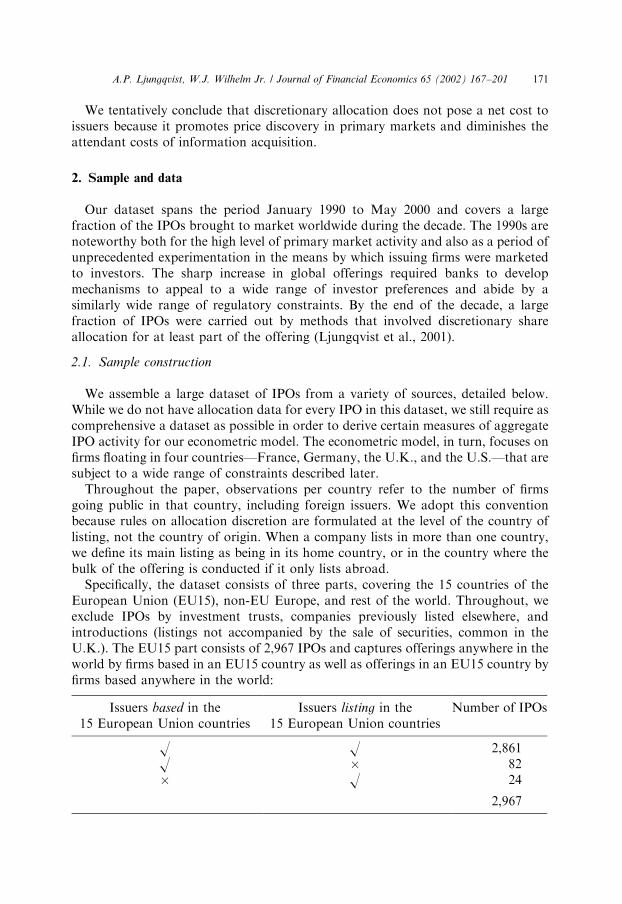
Specifically, the dataset consists of three parts, covering the 15 countries of theEuropean Union (EU15), non-EU Europe, and rest of the world. Throughout, weexclude IPOs by investment trusts, companies previously listed elsewhere, andintroductions (listings not accompanied by the sale of securities, common in theU.K.). The EU15 part consists of 2,967 IPOs and captures offerings anywhere in theworld by firms based in an EU15 country as well as offerings in an EU15 country byfirms based anywhere in the world:
Issuers based in the15 European Union countries
Issuers listing in the15 European Union countries
Number of IPOs
O O 2,861O � 82� O 24
2,967
A.P. Ljungqvist, W.J. Wilhelm Jr. / Journal of Financial Economics 65 (2002) 167–201 171

These 2,967 offerings were identified from five principal sources:
* the Equityware database (between January 1992 and July 1999) (see Ljungqvistet al., 2001, for further details);
* the SDC Global New Issues database, from which we extract all IPOs not alreadycovered in Equityware (619 cases, of which 324 were conducted before January1992 or after July 1999);
* information provided by European stock exchanges;* a search of every article in Reuters’ ‘Share issues’ news archive for each EU15
country;* and Ljungqvist’s (1997) database of German IPOs.
Every offering contained in these sources was checked for eligibility as a bona fideIPO against IPO prospectuses and regulatory filings because we found that SDCfrequently misclassifies seasoned offerings as IPOs and double-counts IPOs underdifferent names.4
The EU15 sample is relatively comprehensive. In addition, we have access to a lesscomprehensive sample of 98 IPOs by issuers in non-EU Europe and 695 IPOs byissuers in the rest of the world (excluding the U.S.), over the period January 1992 toJuly 1999. These offerings were identified using Equityware.
2.2. Allocation data
The transparency of the distribution of shares between retail and institutionalinvestors varies substantially across countries. Some countries follow the U.S. in notrequiring this information to be made public. Until recently, this was the case inGermany, so to gather allocation data we approached companies directly. Therewere 470 IPOs in Germany during our sample period. Of these, 377 werebookbuilding exercises, 92 were fixed-price offerings, and one was conducted byauction. Appendix A contains details of offering mechanisms and allocation rules inGermany.
Bookbuilding became the dominant offering mechanism in 1995, accounting for94% of German IPOs in 1995–2000. Our survey was conducted in May and June2000 and targeted all 351 firms that went public in Germany between January 1996and March 2000 (we also contacted a sample of pre-1996 issuers in a trial but foundthat none would provide allocation data). Responses were received from 106 firms(30%). Of these, 93 disclosed their allocations, five said they no longer had the data,five were unwilling to make the data available, and three sent data pertaining tosubsequent seasoned equity offerings. In addition, we received detailed allocationdata for 36 IPOs from an underwriter (widely regarded as the market leader in IPOson the Neuer Markt, at the time Germany’s dominant primary market). Finally, weobtained allocation data for 15 additional firms from press releases. This provides a
4We are grateful to Wolfgang Aussenegg, Jan Jakobsen, Fran-cois Derrien, and Giancarlo Giudici for
looking over our Austrian, Danish, French, and Italian samples, respectively.
A.P. Ljungqvist, W.J. Wilhelm Jr. / Journal of Financial Economics 65 (2002) 167–201172
sample of 144 IPOs in Germany for which allocation data are available, covering38% of all IPOs since 1996. Three of these IPOs cannot be used in the econometricanalysis for lack of indicative price ranges (two were fixed-price offerings and onewas sold by auction).
By contrast, the Bourse in France generally requires issuers to report allocations,though public availability of the notifications is patchy in the case of flotations onthe over-the-counter markets. During the sample period, there were 516 IPOs inFrance: 28 went public on the Premier March!e, 247 on the Second March!e, 124 onthe Nouveau March!e, and 117 on an OTC market—the Paris March!e Libre, itspredecessor the March!e Hors-Cote, or the OTC markets in Lyon and Nantes. Ofthese, 255 were pure or hybrid bookbuilding exercises, 44 were fixed-price offers, and185 were conducted via auctions; 32 OTC offerings could not be classified (thoughthey are likely to be auctions). Appendix B contains details of offering mechanismsand allocation rules in France. Allocation data for auctions are not publiclyavailable. Among non-auctions, we obtain allocation data from the Bourse for 237of the 255 bookbuilding efforts, and 7 of the 44 fixed-price offers. In total, we haveallocation data for 244 issues. This covers virtually the entire population ofbookbuilt IPOs, and about half of all French IPOs during the sample period. Sevenof the bookbuilt IPOs are excluded from the econometric analysis for lack ofindicative price ranges.
In the U.K., there were 876 IPOs on the London Stock Exchange between January1990 and May 2000: 515 went public on the Official List, 19 on the UnlistedSecurities Market (USM, from 1990 to 1995), and 342 on the Alternative InvestmentMarket (AIM, from June 1995 to May 2000). We exclude companies transferringfrom one London market tier to another (including from the Rule 535.2 or 4.2trading facility which replaced the Third Market), companies traded on Ofex (anunregulated trading facility operated by J.P. Jenkins, a firm of stockbrokers), andintroductions (listings not accompanied by the sale of securities).
As discussed in Appendix C, U.K. offerings can be categorized as ‘placings’ (651cases), ‘public offers’ (12 cases), ‘hybrids’ (which combine a placing with a publicoffer; 178 cases), or ‘global offers’ (large IPOs marketed internationally; 35 cases).Allocation policies for the first two are virtually binary. Placings are not registeredfor offering to the public at large and so involve only institutional investors orextremely wealthy individuals. In some instances, placings set aside a proportion ofshares for employees. On the other hand, public offers, which are allocated on a prorata basis or by ballot, are nearly exclusively a retail phenomenon. We were able toobtain allocation data for 186 of the 213 hybrid or global offers from the LondonStock Exchange, which like the Paris Bourse requires publication of the ‘basis forallocation’. In addition, we know the allocations for all placings and most publicoffers, giving a total of 843 IPOs for which allocation data are available.
To provide a link to the published literature on IPO allocations, which uses U.S.data, we include a sample of IPOs in the U.S. Neither banks nor issuers are requiredto reveal how shares were allocated across various investor clienteles in the U.S.However, we have access to a small sample of 30 U.S. firms taken public in the U.S.by Goldman Sachs between March 1993 and July 1995, as well as two European
A.P. Ljungqvist, W.J. Wilhelm Jr. / Journal of Financial Economics 65 (2002) 167–201 173
firms that went public in the U.S. This sample does not overlap with those previouslyused by Hanley and Wilhelm (1995) and Aggarwal et al. (2001).
For all four countries, our allocation data reflect the aggregate allocations of theentire syndicate, rather than—as in Hanley and Wilhelm (1995)—of the leadmanager only. Our data thus allow us to more precisely measure allocation policythan is the case in the extant literature.
Our econometric model focuses on the IPOs in the four countries just described. Inaddition, we have allocation data for 426 IPOs in other countries, which we includefor descriptive purposes. For some countries (such as Finland), the data come fromfilings with the local stock exchange. For the remainder, we rely on informationabout the final tranche structure in hybrid deals to infer retail and institutionalallocations.5
3. A global perspective on IPO allocations
Table 1 reports summary statistics for institutional allocations in our sample,broken down by country of listing. With few exceptions among the countries forwhich we have more than a few observations, institutional allocations outnumberretail allocations by something in the neighborhood of 2 or 3 to 1, on average, whenbanks have discretion in how shares are allocated. For example, institutions receive76% of IPO shares in France and 73% of U.K. IPOs that are open to bothinstitutional and retail investors. In the small sample of Goldman-backed U.S. IPOs,institutions take 66% of the average offer. On the other hand, German IPOs yieldslightly lower discretionary allocations to institutions, about 58% on average.Across the 1,689 IPOs for which we have allocation data, the average institutionalallocation is 80%, though this reflects the large number of U.K. placings. Excludingthese, the average drops to 69%.
In the remainder of the paper, we focus on IPOs in France, Germany, the U.K.,and the U.S. Because we do not have allocation data for every IPO in thesecountries, we are concerned about the potential for sample selection bias. As a firstcut, Table 2 provides, for each of the four countries, summary statistics regardingoffer size, underpricing, allocations to institutions, and the number of privatizations.For each country, we test for differences in means or medians between the fullcountry sample (Column 1) and the sample for which we have allocation data(Column 2). This reveals no significant differences in Germany or the U.K. In
5Suppose the issuer announces tranches of one million shares for retail investors and two million shares
for institutions. This information is typically contained in the preliminary offering prospectus. Depending
on local rules, the issuer may or may not reallocate between tranches in the light of relative demands. On
the assumption that institutions do not submit bids pretending they are retail investors, and vice versa, we
use the final tranche sizes to compute the institutional/retail split (taking into account the overallotment
option, which frequently benefits institutions). Information regarding final tranche sizes is obtained from
issuer reports to their stock exchange or press announcements by the underwriter or the issuer. Given this
procedure, we are unable to infer allocations in non-hybrid offerings in cases where no voluntary or
mandatory disclosure takes place.
A.P. Ljungqvist, W.J. Wilhelm Jr. / Journal of Financial Economics 65 (2002) 167–201174

Table 1
Institutional IPO allocations by country of listing
Rules on allocation discretion are formulated at the level of the country of listing, not the country of
origin, so we report allocations by country of listing. Where a company lists in more than one country, we
define its main listing as being in its home country, or if it only lists abroad as the country where the bulk
of the offering is conducted. For instance, the Spanish company Terra Networks SA, which obtained
listings on the stock exchanges of Madrid, Bilbao, Barcelona, and Valencia, as well as on Nasdaq, is
classified as listing in Spain. Listings on EASDAQ are classified as Belgian (since Belgian law and
regulations apply). Institutional and retail allocations sum to 100% of the shares sold. In most countries
(including France, Germany, the U.K., and the U.S.), shares sold include overallotment shares where the
overallotment option is exercised. Shares allocated to employees or to ‘friends and family’ are counted as
retail allocations. We have no allocation data for IPOs in Ireland, the 15th EU country. (But we do have
allocation data for Irish companies going public abroad, in particular in the U.K.) Data for U.K. placings
take into account shares set aside for employees, which are counted as retail allocations.
Country N Mean St.dev. Min Max
United Kingdom 843 0.929 0.164 0.000 1.000
Placings 651 0.996 0.032 0.350 1.000
Public offers 6 0.000 0.000 0.000 0.000
Hybrids and global 186 0.725 0.181 0.136 1.000
France 244 0.761 0.182 0.000 1.000
Germany 144 0.577 0.209 0.000 1.000
Italy 52 0.637 0.154 0.000 0.972
Sweden 47 0.696 0.230 0.000 1.000
Belgium 45 0.650 0.215 0.210 1.000
Finland 40 0.764 0.159 0.300 0.300
Netherlands 29 0.680 0.201 0.000 0.927
Spain 27 0.739 0.232 0.250 0.974
Portugal 18 0.595 0.276 0.000 1.000
Denmark 10 0.672 0.246 0.300 0.972
Greece 3 0.131 0.146 0.045 1.000
Austria 1 0.725
Luxembourg 1 0.974
EU15 1,504 0.823 0.223 0.000 1.000
Hungary 14 0.804 0.200 0.342 1.000
Poland 10 0.777 0.103 0.571 0.937
Norway 7 0.624 0.376 0.000 0.929
Croatia 1 0.629
Iceland 1 0.000
Switzerland 1 0.800
Non-EU15 Europe 34 0.730 0.258 0.000 1.000
Singapore 60 0.590 0.246 0.000 0.925
Hong Kong 19 0.650 0.200 0.253 0.940
South Africa 9 0.423 0.335 0.000 0.899
Turkey 8 0.752 0.141 0.498 0.906
Australia 6 0.629 0.172 0.350 0.852
Thailand 4 0.676 0.049 0.602 0.700
China 3 0.933 0.115 0.800 1.000
Malaysia 2 0.837 0.231 0.674 1.000
Bahrain 1 0.528
A.P. Ljungqvist, W.J. Wilhelm Jr. / Journal of Financial Economics 65 (2002) 167–201 175
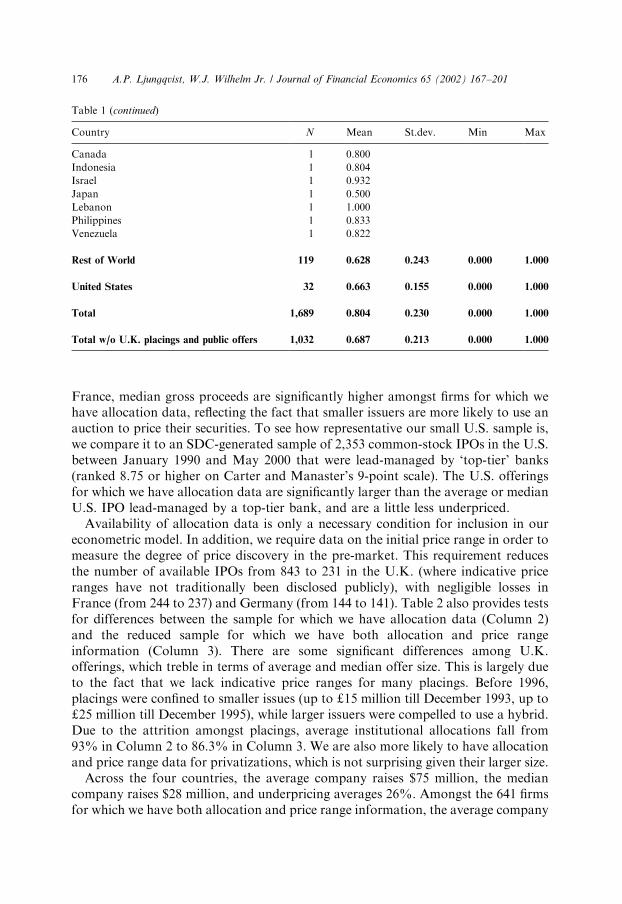
France, median gross proceeds are significantly higher amongst firms for which wehave allocation data, reflecting the fact that smaller issuers are more likely to use anauction to price their securities. To see how representative our small U.S. sample is,we compare it to an SDC-generated sample of 2,353 common-stock IPOs in the U.S.between January 1990 and May 2000 that were lead-managed by ‘top-tier’ banks(ranked 8.75 or higher on Carter and Manaster’s 9-point scale). The U.S. offeringsfor which we have allocation data are significantly larger than the average or medianU.S. IPO lead-managed by a top-tier bank, and are a little less underpriced.
Availability of allocation data is only a necessary condition for inclusion in oureconometric model. In addition, we require data on the initial price range in order tomeasure the degree of price discovery in the pre-market. This requirement reducesthe number of available IPOs from 843 to 231 in the U.K. (where indicative priceranges have not traditionally been disclosed publicly), with negligible losses inFrance (from 244 to 237) and Germany (from 144 to 141). Table 2 also provides testsfor differences between the sample for which we have allocation data (Column 2)and the reduced sample for which we have both allocation and price rangeinformation (Column 3). There are some significant differences among U.K.offerings, which treble in terms of average and median offer size. This is largely dueto the fact that we lack indicative price ranges for many placings. Before 1996,placings were confined to smaller issues (up to d15 million till December 1993, up tod25 million till December 1995), while larger issuers were compelled to use a hybrid.Due to the attrition amongst placings, average institutional allocations fall from93% in Column 2 to 86.3% in Column 3. We are also more likely to have allocationand price range data for privatizations, which is not surprising given their larger size.
Across the four countries, the average company raises $75 million, the mediancompany raises $28 million, and underpricing averages 26%. Amongst the 641 firmsfor which we have both allocation and price range information, the average company
Table 1 (continued)
Country N Mean St.dev. Min Max
Canada 1 0.800
Indonesia 1 0.804
Israel 1 0.932
Japan 1 0.500
Lebanon 1 1.000
Philippines 1 0.833
Venezuela 1 0.822
Rest of World 119 0.628 0.243 0.000 1.000
United States 32 0.663 0.155 0.000 1.000
Total 1,689 0.804 0.230 0.000 1.000
Total w/o U.K. placings and public offers 1,032 0.687 0.213 0.000 1.000
A.P. Ljungqvist, W.J. Wilhelm Jr. / Journal of Financial Economics 65 (2002) 167–201176
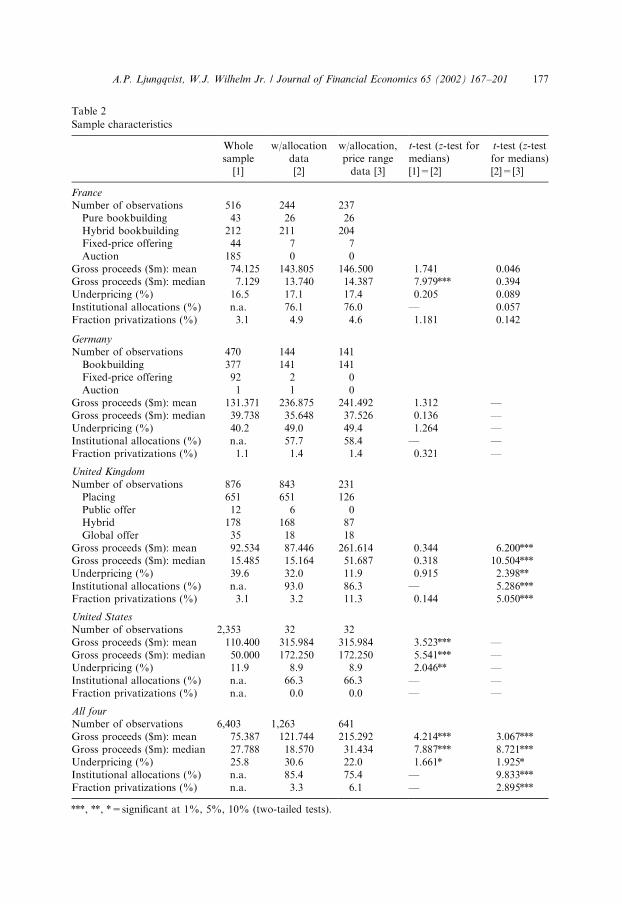
Table 2
Sample characteristics
Wholesample
[1]
w/allocationdata[2]
w/allocation,price rangedata [3]
t-test (z-test formedians)[1]=[2]
t-test (z-testfor medians)[2]=[3]
France
Number of observations 516 244 237Pure bookbuilding 43 26 26Hybrid bookbuilding 212 211 204Fixed-price offering 44 7 7Auction 185 0 0
Gross proceeds ($m): mean 74.125 143.805 146.500 1.741 0.046Gross proceeds ($m): median 7.129 13.740 14.387 7.979*** 0.394Underpricing (%) 16.5 17.1 17.4 0.205 0.089Institutional allocations (%) n.a. 76.1 76.0 — 0.057Fraction privatizations (%) 3.1 4.9 4.6 1.181 0.142
Germany
Number of observations 470 144 141Bookbuilding 377 141 141Fixed-price offering 92 2 0Auction 1 1 0
Gross proceeds ($m): mean 131.371 236.875 241.492 1.312 —Gross proceeds ($m): median 39.738 35.648 37.526 0.136 —Underpricing (%) 40.2 49.0 49.4 1.264 —Institutional allocations (%) n.a. 57.7 58.4 — —Fraction privatizations (%) 1.1 1.4 1.4 0.321 —
United Kingdom
Number of observations 876 843 231Placing 651 651 126Public offer 12 6 0Hybrid 178 168 87Global offer 35 18 18
Gross proceeds ($m): mean 92.534 87.446 261.614 0.344 6.200***Gross proceeds ($m): median 15.485 15.164 51.687 0.318 10.504***Underpricing (%) 39.6 32.0 11.9 0.915 2.398**Institutional allocations (%) n.a. 93.0 86.3 — 5.286***Fraction privatizations (%) 3.1 3.2 11.3 0.144 5.050***
United States
Number of observations 2,353 32 32Gross proceeds ($m): mean 110.400 315.984 315.984 3.523*** —Gross proceeds ($m): median 50.000 172.250 172.250 5.541*** —Underpricing (%) 11.9 8.9 8.9 2.046** —Institutional allocations (%) n.a. 66.3 66.3 — —Fraction privatizations (%) n.a. 0.0 0.0 — —
All four
Number of observations 6,403 1,263 641Gross proceeds ($m): mean 75.387 121.744 215.292 4.214*** 3.067***Gross proceeds ($m): median 27.788 18.570 31.434 7.887*** 8.721***Underpricing (%) 25.8 30.6 22.0 1.661* 1.925*Institutional allocations (%) n.a. 85.4 75.4 — 9.833***Fraction privatizations (%) n.a. 3.3 6.1 — 2.895***
***, **, *=significant at 1%, 5%, 10% (two-tailed tests).
A.P. Ljungqvist, W.J. Wilhelm Jr. / Journal of Financial Economics 65 (2002) 167–201 177
raises $215 million, the median company raises $31 million, and underpricingaverages 22%. Given these patterns, we need to take sample selectivity bias seriously.We will outline a Heckman (1979) selectivity correction in Section 6.
4. The determinants and consequences of allocation policy
The empirical framework used to analyze the 641 IPOs in France, Germany, theU.K., and the U.S. described in Table 2 derives from Benveniste and Spindt (1989).Benveniste and Spindt view discretionary allocation as a key element of theinvestment bank’s effort to extract private information from potential investors priorto setting the offer price for an IPO. Allocation policy, in turn, is influenced by thesestrategic considerations and various constraints imposed by the regulatory regimeunder which the IPO is conducted. In the remainder of this section we outline thetheory underpinning these elements of the econometric model and conclude with adiscussion of the identification and estimation of the implied system of equationsdescribing the market. The precise definitions of all our variables can be found inTable 3.
4.1. Price discovery in primary markets
By price discovery in primary markets, we mean the degree to which priorexpectations regarding the value of the offering, reflected in preliminary filings withthe issuer’s regulator, are revised in response to feedback from investors and themarket at large before the offer price is set. Thus, we think of the offer price asreflecting a conditional expectation representing the culmination of primary marketprice discovery. The literature has proposed two main proxies for the learningreflected in the difference between these conditional and unconditional expectations.Cornelli and Goldreich (2000) define the variable Revision ¼ ðOfferPrice �PlowÞ=ðPhigh � PlowÞ; where Phigh and Plow are the upper and lower bounds of theindicative price range generally filed with the issuer’s regulator prior to seekingfeedback from institutional investors in the course of bookbuilding. Hanley (1993)measures learning instead as Offer Price=½1
2ðPhigh þ PlowÞ� � 1: To ensure that our
results are easily comparable to the related clinical analysis in Cornelli and Goldreich(2000), we follow their approach. The only consequence of this scaling decision is aslight increase in standard errors over those obtained using Hanley’s approach.
By construction, Revision ¼ 12if the offer price is set at the midpoint of the price
range, indicating that no new information has emerged. Revision is negative if theoffer is priced below the range, 0 if priced at Plow; 1 if priced at Phigh; and greaterthan 1 if priced above the range. In our data, Revision averages 0.68 in France, 0.84in Germany, 0.49 in the U.K., and 0.74 in the U.S.
Benveniste et al. (2002) argue that issuers learn not only through their ownmarketing efforts but also through those of their rivals. In other words, pricediscovery is a function of both deal-specific information and information spillingover from contemporaneous transactions and perhaps secondary market activity.
A.P. Ljungqvist, W.J. Wilhelm Jr. / Journal of Financial Economics 65 (2002) 167–201178

Table 3
Definition of variables
Variable name Definition
Endogenous variables
Revision Equals (Offer price�Plow)/(Phigh2Plow), where Phigh and Plow are the high andlow end of the indicative price range, respectively
Revisionþ Equals Revision if Revision>1 (offer price set above the indicative range), and 0otherwise
Inst Alloc Equals the fraction of shares allocated to institutions in IPO i divided by theaverage fraction of shares allocated to institutions in all local offerings iaj in the90 calendar days preceding i’s first day of trading
InitialReturn Equals P5=Offer price � 1; where P5 is the firm’s share price on its fifth day oftrading
Proceeds Equals the natural logarithm of dollar gross proceeds (in million), which is theoffer price times the number of shares sold (including overallotted shares)converted into U.S. dollars using exchange rates on the pricing day
DollarUnderpricing Equals Initial Return times the dollar gross proceeds, in millionsIBmktshare Equals the lead manager’s (or if more than one, the average of the lead
managers’) market share in the local market, in %. Market share is the sum ofgross proceeds in all local offerings lead-managed by bank j divided by totalproceeds raised in all offerings in that local market over the sample period(offerings lead-managed by more than one bank are allocated equally to the leadmanagers). For offerings in the U.S., market shares are computed over the fivecalendar years preceding firm i’s IPO
Exogenous variables
m RevisionBB Average Revision of all local offerings iaj between the setting of i’s price rangeand its final pricing, weighted by the number of such offerings
s RevisionBB Standard deviation of Revision of all local offerings iaj between the setting of i’sprice range and its final pricing
MktRetBB Return on the local market index between the setting of i’s price range and itsfinal pricing. Indices used: Germany—Datastream Germany index prior toJanuary 1994 and the DAX200 thereafter; France—Datastream France indexprior to January 1991 and the SBF250 thereafter; U.K.—FT-SE All Share index;U.S.—S&P500 index
s MktBB Standard deviation of local daily market index returns between the setting of i’sprice range and its final pricing
m IRBB Average one-day Initial Return of all local offerings iaj between the setting of i’sprice range and its final pricing
IPOVol The number of IPOs in the same local market as issue i; during the six weeksbefore to two weeks after i’s pricing date
MktRetpost-pricing Return on the local market index between i’s final pricing and the fifth day oftrading (to coincide with the period over which Initial Returns are computed)
s Mktpost-pricing Standard deviation of daily local market index returns between i’s final pricingand the fifth day of trading
m IRpost-pricing Average one-day Initial Return of all local offerings Iaj between i’s final pricingand its fifth day of trading
BB constraints Dummy=1 for deals subject to constraints on allocation discretion, as defined inTable 4
BB placings Dummy=1 for U.K. placings, as defined in Table 4Privatization Dummy=1 if issue i is a privatizationHightech Dummy=1 if issue i operates in a ‘high-tech’ industry; see the text for industry
classificationsAge Equals the natural logarithm of one plus firm age, where firm age is the IPO year
minus the year of foundation as disclosed in IPO prospectuses
A.P. Ljungqvist, W.J. Wilhelm Jr. / Journal of Financial Economics 65 (2002) 167–201 179

(For empirical evidence consistent with this prediction, see Lowry and Schwert,2000; Benveniste et al., 2002.) Spillover effects from contemporaneous transactionsare controlled by the mean, m RevisionBB; and standard deviation, s RevisionBB; ofprice revisions for contemporaneous IPOs in the same local market. The volatilitymeasure, s RevisionBB; is included to control for noise and idiosyncratic informationreflected in contemporaneous revisions. In other words, if contemporaneous IPOsare subject to a common information factor, we assume that the influence of thiscommon information on price revisions is comparable in magnitude across IPOs.Deviations from the mean reflect noise or idiosyncratic factors that reduce theprecision of learning about the common factor.
IPO i’s contemporaries are defined as all local IPOs that were priced between thedates for setting i’s indicative price range and finalizing its offer price. If there are nocontemporaneous IPOs, or none that use bookbuilding, m RevisionBB ands RevisionBB are set to 1
2and 0, respectively (our results are robust to using windows
of fixed width, which have the advantage of reducing the occurrence of nocontemporaneous IPOs). All measures of contemporaneous activity are estimatedusing the full country samples described in Column 1 of Table 2.
We refer to the period between the setting of the indicative price range and thefinal offer price as the bookbuilding phase and subscript all variables defined duringthis period by ‘BB’.6 The bookbuilding phase averages 15 calendar days in France,11 days in Germany, and 17 days in the U.K. (see Appendix D). If spillovers fromcontemporaneous offerings are substantial, we expect a positive relation betweenRevision and m RevisionBB: However, when the signal-to-noise ratio for informationgenerated by contemporaneous offerings is low, less learning occurs and so Revision
should be negatively related to s RevisionBB:In the Benveniste-Spindt framework, discounted share allocations constitute the
compensation provided in exchange for investors’ private information. Other thingsequal, large price revisions, reflecting a greater yield of private information, willcarry the expectation of a larger discount. This is the well-documented ‘partialadjustment’ phenomenon observed in both the U.S. (Hanley, 1993; Lowry andSchwert, 2000; Loughran and Ritter, 2002) and worldwide (Ljungqvist et al., 2001).The partial adjustment phenomenon also suggests that if spillovers are important,contemporaneous revisions tell only part of the story. In isolation, a moderatepositive contemporaneous revision might be interpreted as revealing only a moderateamount of information. But if it is coupled with a large initial return, the Benveniste-Spindt framework predicts that the combination reflects a strong positive response.We control for this effect by including the mean of the one-day initial return of all
6We use the precise dates on which the price range and the offer price were set in each case. Note that
these generally precede the announcement date by a day or two. Since we are here interested in the
information set of the issuer and not of outside investors, we collect the earlier dates. We obtained these as
follows: in France, from the market regulator (the Commission des Op!erations de Bourse) and the Paris
Bourse; in Germany, from the final IPO prospectus (which recapitulates the sequence of events); in the
U.K., from the London Stock Exchange’s Regulatory News Service and from the ‘expected timetable of
principal events’ in the ‘pathfinder’ (preliminary) prospectus. In the U.S., we use SEC filing and effective
dates from Securities Data Company.
A.P. Ljungqvist, W.J. Wilhelm Jr. / Journal of Financial Economics 65 (2002) 167–201180

local IPOs whose first trading day occurs during IPO i’s bookbuilding phase,m IRBB; in addition to the contemporaneous revision variables.
Secondary market spillovers are measured by the return to a local market indexduring each IPO’s bookbuilding phase (MktRetBB) as well as the standard deviationof daily index returns during the same period (s MktBB). The rationale for includings MktBB mirrors that for s RevisionBB: Although large market movements might bereflective of the arrival of considerable new information bearing on an IPO’s offerprice, when volatility is high it is difficult to tease out its implications. So again, IPOi’s price revision should be directly related to MktRetBB and negatively related tos MktBB:
Controlling for these potential spillover effects, Benveniste and Wilhelm (1990)predict that banker discretion promotes price discovery. The banker’s level ofdiscretion differs across the four countries and, in the case of France and the U.K.,within countries. The various options facing issuers in Germany, France, and theU.K. are outlined in Appendices A-C. Since it is impossible to quantify the relativediscretion granted to bankers across deals, we define two categories of constraints onbanker discretion and outline these in Table 4. Classification is based on theoperative rules announced in the preliminary prospectus or regulatory filings.
Our first category of constraints includes deals subject to a variety of constraintslimiting banker discretion in offerings open to both retail and institutional investors.For example, fixed-tranche deals in France and the U.K., where allocations fordifferent classes of investors are fixed in advance of the bookbuilding effort, clearlyremove a degree of freedom that might prove valuable in the mechanism-designframework. Similarly, some hybrid transactions, particularly in the U.K., include anautomatic clawback provision triggered by retail demand. In essence, suchprovisions enable retail investors to condition their demand on feedback receivedfrom institutional investors. When institutional demand is strong, retail investors canfollow suit and the clawback provision calls for the banker to reassign to retailinvestors shares that otherwise would have been assigned to institutional investors.But institutional investors, recognizing that strong indications of interest will onlycause them to be crowded out by retail investors, will have weaker incentives to stepforward with strong indications in the first place. Finally, the sample includes sevenFrench fixed-price offerings, which (perhaps surprisingly) post an indicative pricerange enabling their inclusion in the analysis. These fixed-price offerings provideunderwriters with no discretion because shares are simply allocated on a pro ratabasis. In total, 18 French and 87 U.K. offerings fall within our first category ofconstraints, which we designate with the dummy variable BB constraints:
The estimation sample also includes 126 U.K. placings that can only be sold toinstitutional investors (ignoring the fact that ten of these set aside between 1
2% and
20% of the offer for their employees). These offerings are designated with thedummy variable BB placings: In this setting, retail investors no longer provide thefallback in bargaining with institutional investors envisioned by Benveniste andWilhelm (1990). For example, suppose the underwriter had reason to believe thatinvestors were deliberately understating their demand in hopes of forcing a lowerprice. The optimal response in the Benveniste-Spindt framework is to reduce
A.P. Ljungqvist, W.J. Wilhelm Jr. / Journal of Financial Economics 65 (2002) 167–201 181

Table 4
Categorization of sample by restriction imposed on price discovery
We categorize sample IPOs into three categories on the basis of the constraints imposed on price
discovery. The ‘unrestricted’ category includes the 92 fixed-price offerings in Germany, on the grounds
that underwriters retain allocation discretion in such deals (in contrast to, for instance, France and the
U.K. where allocations in fixed-price deals are pro rata or balloted). The BB constraints category includes
the 185 fixed-price and 44 auction offerings in France, as well as one auction in Germany.
Category Offer mechanisms Number of cases (with allocation and price
range information)
Unrestricted
bookbuilding
* Companies listing in the U.S.* Dual-tranche IPOs where
tranche allocations are to be
determined after orders have
been received* Dual-tranche IPOs with
clawback provision in favor of
one investor class, where the
clawback exercise is
discretionary
France
Germany
U.K.
U.S.
All
245
469
41
2,353
3,108
(219)
(141)
(18)
(32)
(410)
Deals subject to
constraints on
allocation
discretion
(BB constraints)
* Dual-tranche IPOs with fixed
tranches (i.e., no possibility of
clawback or reallocation)* Dual-tranche IPOs with
clawback provision in favor of
one investor class, where the
clawback exercise is non-
discretionary* Fixed-price offerings with pro
rata allocation* Auctions
France
Germany
U.K.
U.S.
All
239
1
184
0
424
(18)
(0)
(87)
(0)
(105)
Deals subject to
constraints on
retail
participation
ðBB placingsÞ
* U.K. placings France
Germany
U.K.
U.S.
All
0
0
651
0
651
(0)
(0)
(126)
(0)
(126)
Unclassified France 32 (0)
Germany 0 (0)
U.K. 0 (0)
U.S. 0 (0)
All All 32 (0)
France 516 (237)
Germany 470 (141)
U.K. 876 (231)
U.S. 2,353 (32)
All 4,215 (641)
A.P. Ljungqvist, W.J. Wilhelm Jr. / Journal of Financial Economics 65 (2002) 167–201182
institutional allocations by allocating more to retail investors. However, deliberatelymisrepresenting positive views is not an optimal response to the underwriter’soptimal response, and so this is not a Nash equilibrium—unless there are constraintson the underwriter’s ability to switch allocations to retail investors. In the presenceof constraints, misrepresenting positive views may be a Nash strategy, to the extentthat the institutions’ profits on their reduced (but nonzero) allocations are greaterthan the profits from truthful revelation of their information. One plausibleconstraint is that there aren’t enough retail investors, and so some institutions receivenonzero allocations. In U.K. placings the offering is not registered for sale to retailinvestors at all and so we have the worst-case scenario. Although this is a constrainton the banker’s capacity for eliciting information from institutional investors,neither its absolute magnitude nor its magnitude relative to that of the constraintscaptured by BB constraints are clear a priori.7
The remaining offerings are classified as unconstrained bookbuilding efforts. Inaddition to U.S. and German IPOs, this category also includes dual-tranche dealswhich do not pre-commit the underwriter to particular tranche sizes, as in U.K.‘global offers’ which typically state that the final tranche structure is to be decidedafter the offer closes, or French hybrid bookbuilding efforts which provide for thepossibility of clawback (usually but not exclusively in favor of retail investors) butleave the decision to exercise the clawback option with the underwriter.
Finally, note that the banker in the Benveniste-Spindt framework simultaneouslydetermines how much to allocate to investors who relinquish private informationand how much to revise the offer price in response, so what we observe is theequilibrium combination of price (Revision) and quantity (allocations). We thereforelet Revision depend on allocations to institutional investors.
Even after controlling for the level of explicit constraints on discretion, localcustom or other circumstances might influence banker expectations regarding theircapacity to favor certain investors in exchange for information. We thereforenormalize ex post institutional allocations by the average institutional allocation incontemporaneous offerings (local offerings during the three months preceding firmi’s IPO). This variable, which we call Inst Alloc; will be greater than one ifinstitutions are allocated more than is ‘normal’ in that market at that time. Weassume that for U.K. placings the normal allocation is one. Our normalizationenables us to pool data from across countries but assumes that allocation practicesare comparable across countries after regulatory and other differences arecontrolled. Later we test this assumption and examine the robustness of our resultsto alternative specifications. Clearly, Inst Alloc is endogenous according to theBenveniste-Spindt framework, and our estimation will control for this.
7 If this argument is correct and it is more difficult to induce truthful revelation in placings, the problem
should be attenuated if there exist other sources of leverage over the participating institutional investors.
For instance, if the underwriter deals repeatedly with the same institutions, it can credibly threaten to cease
future dealings with an institution perceived as deliberately misrepresenting its demand. Consistent with
this argument, we find that placings are associated with smaller revisions but that the effect is mitigated,
the greater the lead manager’s market share.
A.P. Ljungqvist, W.J. Wilhelm Jr. / Journal of Financial Economics 65 (2002) 167–201 183
In summary, the model of primary market price discovery to be estimated is
Revision ¼ f1ðInst Alloc; m RevisionBB; s RevisionBB; MktRetBB; s MktBB;
m IRBB;BB constraints;BB placingsÞ: ð1Þ
4.2. Allocation policy
We assume that institutions are the primary source of any information extracted inthe course of a bookbuilding effort and take Inst Alloc as a reflection of the banker’sallocation strategy (see Cornelli and Goldreich, 2001, for evidence). Thus, large pricerevisions, if they derive from such information, should be associated with largeinstitutional allocations, other things equal. Moreover, there is likely to be anonlinearity in this relation: particularly valuable information requires particularlyfavorable allocations to induce investors to truthfully reveal their information. Wetherefore include both Revision and Revision+, the latter being equal to Revision
whenever the offering is priced above the range, and zero otherwise. As arguedearlier, price revisions should be viewed as being chosen simultaneously withallocations, so both Revision and Revision+ will be treated as endogenous.
Large IPOs provide more currency for compensating informed investors and somay diminish the fraction of the offering they will expect. We control for this effectby including the variable Proceeds, defined as the natural log of gross proceeds raisedin the offering (converted into U.S. dollars using exchange rates on the pricing day).This variable too is endogenous if issuers aim to minimize wealth losses associatedwith their offerings (Habib and Ljungqvist, 2001), and will therefore be treated asendogenous in the estimation.
We do not control separately for the regulatory constraints BB constraints andBB placings on allocations because our dependent variable Inst Alloc measuresinstitutional allocations relative to what is ‘normal’ in the local market, and soalready takes into account the presence of constraints. (Our results are notsignificantly changed when we include the two constraints dummies in the allocationequation; a w2 test of equal coefficients across the two specifications yields 8.56 with ap-value of 0.99.) We do, however, include a dummy variable indicating whether theoffering was the result of a privatization of a state-owned firm. This reflects the factthat privatizations were quite commonly used as instruments of public policy aimedat broadening domestic share ownership or employee ownership (Jenkinson andLjungqvist, 2001). Either would tend to favor retail investors. Thus the modelspecification for the banker’s allocation policy is
Inst Alloc ¼ f2ðRevision; Revisionþ; Proceeds; PrivatizationÞ: ð2Þ
Allocations might also depend on initial returns: with greater allocations toinstitutions, underpricing need not be as high to compensate informed investors.However, while we find evidence that initial returns are significantly related toinstitutional allocations, we do not find that institutional allocations are significantlyrelated to initial returns. This is consistent with underwriters setting allocation policybefore setting pricing policy.
A.P. Ljungqvist, W.J. Wilhelm Jr. / Journal of Financial Economics 65 (2002) 167–201184

4.3. Initial returns
In the Benveniste-Spindt framework, discounted share allocations constitute thecompensation provided in exchange for investors’ private information. Other thingsequal, large price revisions, reflecting a greater yield of private information, willcarry the expectation of a larger discount. Again, there is likely to be a nonlinearityin this relation: particularly valuable information requires some combination offavorable allocations and initial return to induce information revelation. Wetherefore include both Revision and Revisionþ in the initial return model.
Holding constant the quantity of information revealed and assuming thatinstitutional investors are the source of this information, the percentage discountshould be negatively related to the fraction of shares allocated to institutionalinvestors. In other words, investors’ incentive compatibility constraint for sharingtheir information demands a minimum dollar compensation that can be satisfied byinfinitely many combinations of share price and quantity. Again, we do not controlseparately for the regulatory constraints BB constraints and BB placings: Rather,their effect on underpricing occurs indirectly through their effect on Revision andInst Alloc. (Unreported tests indicate that the regulatory constraints do not have anindependent, direct effect on underpricing.)
Benveniste and Spindt argue that underwriters can reduce underpricing by‘bundling’ deals; see Sherman (2000, especially Proposition 2) for an elaboration ofthis point. Essentially, a higher deal flow affords underwriters the opportunity to cutoff informed investors from other, lucrative deals as punishment for misrepresentingtheir private information. Higher (expected) deal flow should therefore lead to alower marginal cost of acquiring information. Similarly, Benveniste et al. (2001)argue that during periods of high IPO volume, there is greater potential for issuerssharing the costs of information production, again leading to lower requiredunderpricing returns.
We control for this effect with two variables. IPOVol, which captures aggregatedeal flow, is defined as the number of local IPOs in the six weeks before to twoweeks after the present IPO’s pricing date. We include volume after the pricingdate to allow for expectations regarding bundling with deals that are already inthe pipeline. Clearly the eight-week window is arbitrary; experimenting withdifferent window sizes, we find that the results become progressively weaker thelonger the window, but are not qualitatively altered with shorter windows. Oursecond variable is IBmktshare, which is defined as the lead manager’s (or if morethan one, the average of the lead managers’) market share in the local market.IBmktshare captures either bank-specific deal flow or the lead manager’sreputation and thus certification ability. In either case, we expect it to benegatively related to initial returns. We treat IBmktshare as potentiallyendogenous, for it is possible that issuers choose their underwriters endogenously.Indeed, Habib and Ljungqvist (2001) show that treating underwriter choice asexogenous leads to the erroneous inference that more prestigious underwriters areassociated with higher underpricing in the U.S. in the early 1990s. Again, we usethe full country samples to derive these variables.
A.P. Ljungqvist, W.J. Wilhelm Jr. / Journal of Financial Economics 65 (2002) 167–201 185
Unlike in the U.S., where deals are typically priced only a few hours before tradingbegins, there is a substantial lag between pricing and trading in the three Europeancountries (see Appendix D for details). During this post-pricing phase, furtherinformation could arrive from the secondary market, in the form of general marketmovements and spillovers from other IPOs that have begun trading in the meantime.We attempt to capture such information using MktRetpost�pricing; the market returnbetween IPO i’s pricing date and its fifth trading day (to coincide with ourmeasurement of Initial Returns, see below), the post-pricing market volatilitys Mktpost�pricing; and m IRpost�pricing; the average first-day return of all local offeringsthat open during this period.
Finally, we aim to control for firm-specific valuation uncertainty in three ways.Privatization IPOs generally involve more mature firms for which, presumably, moreinformation is in the public domain, so their discounts could be smaller if discountsare compensation, at least in part, for private information. By the same reasoning,younger firms and firms in high-technology industries may be harder to value andthus carry higher initial returns. We therefore include a dummy for privatizationIPOs, the natural log of one plus firm age at the time of the IPO, and a dummy thatequals one for firms whose principal activities are in a high-tech industry. Since oursample cuts across countries, there is no consistent SIC code for assigning firms tothe high-tech category. Instead, we base our assignments on a reading of the businessdescription published in each firm’s prospectus. On this basis, 232 of the 641 firmsare classified as high-tech. These firms operate in the following range of industries:biotech, pharmaceuticals, medical instruments, software and hardware development,communications technology, advanced electronics, and specialty chemicals. Inaddition, we classify internet-related businesses as high-tech.8,9 This yields thefollowing model for initial returns:
InitialReturn ¼ f3ðRevision; Revisionþ; Inst Alloc; IPOVol; IBmktshare;
MktRetpost-pricing; s Mktpost-pricing; m IRpost-pricing;
Privatization; Age; HightechÞ; ð3Þ
where InitialReturn is defined as the percentage return from the offer price to theclosing price on the fifth trading day following listing. This is the same conventionused by Ljungqvist et al. (2001) to obviate problems arising when daily price changesare subject to regulatory limits, as for instance in France. Aftermarket prices wereobtained from Datastream and Equityware for non-U.S. offerings and from CRSPfor U.S. offerings.
8Another popular proxy for uncertainty is offer size. This is a curious proxy, for it is clearly endogenous
to the offer price. Moreover, Habib and Ljungqvist (1998) prove that as a matter of identities,
underpricing is strictly decreasing in offer size even when holding uncertainty constant. We thus refrain from
using it.9Hanley (1993) uses the width of the price range as a proxy for valuation uncertainty. In our data, this
variable has no significant effect and we therefore exclude it from the model.
A.P. Ljungqvist, W.J. Wilhelm Jr. / Journal of Financial Economics 65 (2002) 167–201186

As an alternative to Eq. (3), we estimate the impact of allocation policy on dollar
underpricing, that is, the total amount of money ‘left on the table’:
DollarUnderpricing ¼ f3ðRevision; Revisionþ; Inst Alloc; IPOVol; IBmktshare;
MktRetpost-pricing;s Mktpost-pricing;m IRpost-pricing;
Privatization;Age;HightechÞ; ð30Þ
where DollarUnderpricing equals InitialReturn times the dollar gross proceeds. To afirst approximation, maximizing the net proceeds of the offer (and thus the issuer’swealth) is equivalent to minimizing DollarUnderpricing. It is an approximation, for itignores the dilution effect of selling new (primary) shares at a discount; for furtherdetails, see Habib and Ljungqvist (2001). Following the argument in Habib andLjungqvist (2001), the optimum is characterized by the issuer and its banker havingchosen their allocation policy such that informed investors are just compensated forthe value of disclosing their private information.
A test for the optimality of allocation policies in our data can be based on thecoefficient for Inst Alloc in Eq. (30), which captures the partial derivative of Dollar
Underpricing with respect to institutional allocations. At the optimum, the partialderivative must be zero and so a zero coefficient for Inst Alloc in Eq. (30) is consistentwith issuers having chosen the allocation policy that minimizes DollarUnderpricing:Demsetz and Lehn (1985) first proposed this optimality test in the context ofexecutive ownership. (Note that it does not follow that the coefficient on Inst Alloc inEq. (3), which has percent underpricing on the left-hand side, should also be zero, ifissuers are minimizing dollar rather than percent underpricing.) A nonzerocoefficient can be interpreted as follows. If informed investors expect too littlecompensation relative to the value of their private information, then less informationdiscovery will ensue in the pre-market, leading to a negative relation betweenDollarUnderpricing and Inst Alloc: more money is left on the table, the smaller is theallocation to institutions. If, on the other hand, underwriters favor institutions withlarge allocations beyond the point at which the issuer benefits from informationproduction, perhaps in the expectation of kickbacks, DollarUnderpricing wouldincrease in Inst Alloc:
4.4. Estimation
The two models defined by the three structural equations (1)–(3) and (1)–(30)cannot be estimated using ordinary least squares, for each equation includesamongst its explanatory variables the dependent variable of one or both of the otherequations. Specifically, the InitialReturn is endogenous to IBmktshare and to bothRevision and Inst Alloc; which in turn are endogenous to each other and to Proceeds,which is endogenous to the offer price and thus related to both Initial Return andRevision. This has two consequences. First, it causes the endogenous variables to becorrelated with the disturbances, leading to biased coefficients when estimated usingOLS. Second, since some of the explanatory variables are the dependent variables ofother equations in the system, the error terms are expected to be correlated across
A.P. Ljungqvist, W.J. Wilhelm Jr. / Journal of Financial Economics 65 (2002) 167–201 187
equations, leading OLS standard errors to be biased upwards. Three-stage leastsquares (3SLS) provides consistent estimates of the coefficients and standard errorsas long as the model is identified, that is, if there is sufficient information to estimatethe parameters of the structural model; for further details, see Greene (2000, pp. 692–693). A necessary condition for identification is that the number of exogenousvariables excluded from an equation is at least as large as the number of endogenousvariables included in that equation. This ‘order condition’ is satisfied in our model.
5. Results
5.1. Price discovery in primary markets
Table 5 summarizes the 3SLS estimates of the model’s structural parameters. TheRevision equation yields several insights. Other things equal, constraints on allocation
discretion result in smaller revisions relative to the indicative price range. Relative tounconstrained offerings, constraints on the split between retail and institutionalinvestors reduce average revisions by 0.21 (p-value=3.8%), while shutting out retailinvestors ex ante reduces average revisions by 0.29 (po1%). These are large effects,bearing in mind that the mean of Revisions is 0.65. They are also similar inmagnitude and, in fact, are not statistically different from each other.
Institutional allocations (relative to expectation) have a positive and significant(p ¼ 4:7%) effect on price revisions after allowing for the simultaneity between thetwo and controlling for regulatory constraints. This is consistent with the idea that,relative to retail investors, institutions are a valuable source of information. Toillustrate the economic magnitude of the effect, consider a one standard deviationincrease in institutional allocations from the mean. This will increase Revisions from0.65 to 0.87, holding all other covariates at their sample means. This effect isstronger than that measured by Hanley (1993) and Hanley and Wilhelm (1995).However, if we follow their lead by treating allocation policy as exogenous, thecoefficient switches sign. This illustrates the extent of the simultaneity bias in treatingallocations as exogenous.
The positive and significant coefficient (p ¼ 2:4%) estimated for m RevisionBB isconsistent with information revealed in contemporaneous offerings spilling over intothe price discovery process. However, the economic magnitude of the effect is smallerthan that of allocation policy: a one standard deviation increase in m RevisionBB
from the mean increases Revisions from 0.65 to only 0.71. At the same time, thenegative coefficient estimated for s RevisionBB (po0:1%) is consistent with ourprediction that the noisier is the information coming from other offerings, the lessthe offer price is increased relative to the indicative range. Underpricing of otherdeals during the bookbuilding phase, as measured by m IRBB; also appears to spillover. The coefficient is positive and significant (po0:1%), but its economicmagnitude is again relatively small. A two-quartile increase in contemporaneousunderpricing, from the 1st quartile of 3.9% to the 3rd quartile of 24%, increasesaverage Revisions from 0.60 to 0.64.
A.P. Ljungqvist, W.J. Wilhelm Jr. / Journal of Financial Economics 65 (2002) 167–201188
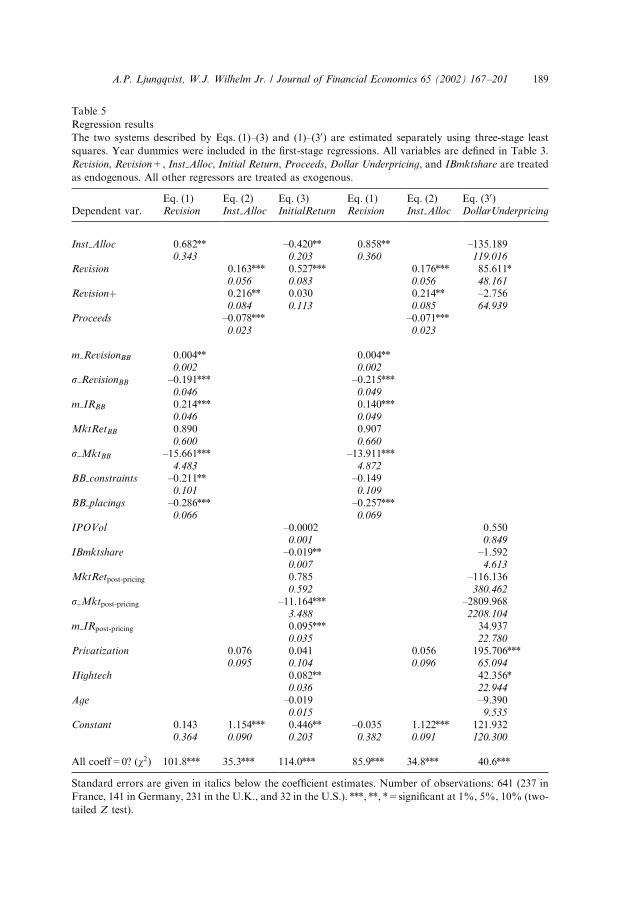
Table 5
Regression results
The two systems described by Eqs. (1)–(3) and (1)–(30) are estimated separately using three-stage least
squares. Year dummies were included in the first-stage regressions. All variables are defined in Table 3.
Revision, Revision+, Inst Alloc, Initial Return, Proceeds, Dollar Underpricing, and IBmktshare are treated
as endogenous. All other regressors are treated as exogenous.
Eq. (1) Eq. (2) Eq. (3) Eq. (1) Eq. (2) Eq. (30)Dependent var. Revision Inst Alloc InitialReturn Revision Inst Alloc DollarUnderpricing
Inst Alloc 0.682** –0.420** 0.858** –135.1890.343 0.203 0.360 119.016
Revision 0.163*** 0.527*** 0.176*** 85.611*0.056 0.083 0.056 48.161
Revisionþ 0.216** 0.030 0.214** –2.7560.084 0.113 0.085 64.939
Proceeds –0.078*** –0.071***0.023 0.023
m RevisionBB 0.004** 0.004**0.002 0.002
s RevisionBB –0.191*** –0.215***0.046 0.049
m IRBB 0.214*** 0.140***0.046 0.049
MktRetBB 0.890 0.9070.600 0.660
s MktBB –15.661*** –13.911***4.483 4.872
BB constraints –0.211** –0.1490.101 0.109
BB placings –0.286*** –0.257***0.066 0.069
IPOVol –0.0002 0.5500.001 0.849
IBmktshare –0.019** –1.5920.007 4.613
MktRetpost-pricing 0.785 –116.1360.592 380.462
s Mktpost-pricing –11.164*** –2809.9683.488 2208.104
m IRpost-pricing 0.095*** 34.9370.035 22.780
Privatization 0.076 0.041 0.056 195.706***0.095 0.104 0.096 65.094
Hightech 0.082** 42.356*0.036 22.944
Age –0.019 –9.3900.015 9.535
Constant 0.143 1.154*** 0.446** –0.035 1.122*** 121.9320.364 0.090 0.203 0.382 0.091 120.300
All coeff=0? (w2) 101.8*** 35.3*** 114.0*** 85.9*** 34.8*** 40.6***
Standard errors are given in italics below the coefficient estimates. Number of observations: 641 (237 in
France, 141 in Germany, 231 in the U.K., and 32 in the U.S.). ***, **, *=significant at 1%, 5%, 10% (two-
tailed Z test).
A.P. Ljungqvist, W.J. Wilhelm Jr. / Journal of Financial Economics 65 (2002) 167–201 189
The coefficient estimated for MktRetBB is positive, as predicted, but notsignificant at conventional levels (p ¼ 13:8%), while that for s MktBB issignificantly negative (po0:1%). The former suggests that secondary marketinformation, which is of course public, has only a weak influence when setting theoffer price. The latter suggests that volatility in secondary markets—like volatilityin the primary market—affects price discovery negatively, and its economic effectis quite large: a one standard deviation increase in volatility reduces Revisions
from 0.65 to 0.57.
5.2. Allocation policy
The allocation equation yields one key insight: institutions are rewarded with
above-normal allocations in return for revealing valuable information, and the more so,the more positive is the information. This is evidenced by the positive and significantcoefficients for Revision ðpo1%Þ and Revisionþ ðp ¼ 1%Þ: Other things equal, theexpected cost of eliciting private information from investors is minimized whendiscounts are concentrated in states characterized by uniformly strong interestamong investors which, presumably, are associated with the largest positive pricerevisions. This strategy minimizes leakage of surplus to investors providing weakindications of interest and therefore avoids undermining incentives for optimisticinvestors to be forthright with their opinions. To illustrate the economic magnitudeof the effect, increasing Revision from the mean of 0.65 to 1 (corresponding topricing at the top of the range) is associated with a 3.2% increase in institutionalallocations, while increasing Revision a further one standard deviation to 1.5 isassociated with a 35.6% increase in relative institutional allocations.
Consistent with our prediction that large IPOs provide more currency forcompensating informed investors and so may diminish the fraction of the offeringthey will expect, we find that Proceeds is negatively and significantly related toinstitutional allocations (po1%). Of course, this coefficient also reflects placings inthe U.K., which tend to be smaller and exclude retail investors, but the coefficient onProceeds continues to be negative and significant if we control separately forplacings.
Finally, we find no evidence of differences in allocations between privatizationsand private-sector IPOs. Since privatizations tend to be large IPOs, it is conceivablethat their effect on allocations is being subsumed in Proceeds. To check whether thisis the case, we interact Proceeds with the privatization dummy but find nodifferential effect of offer size on allocations between private-sector IPOs andprivatizations.
5.3. Initial returns
The underpricing equation provides strong evidence consistent with the notion ofthe strategic use of discounted share allocations to encourage informationproduction. First, we see strong confirmation of the partial adjustment phenomenonidentified by Hanley (1993) in the positive and statistically significant coefficient
A.P. Ljungqvist, W.J. Wilhelm Jr. / Journal of Financial Economics 65 (2002) 167–201190

estimated for Revision ðpo0:1%Þ: Controlling for this effect, large institutionalallocations are then associated with significantly smaller initial returns (p ¼ 3:9%).Other things equal, it suggests that constraints on banker discretion, which translate
into smaller institutional allocations, increase the indirect costs of going public.This result contrasts with Hanley and Wilhelm’s (1995) finding that institutional
allocations have little explanatory power for the cross-sectional variation in initialreturns. It is quite sensitive to our treatment of allocation policy as an endogenousvariable. If we follow Hanley and Wilhelm and treat institutional allocations as anexogenous explanatory variable in an OLS estimation of the underpricing equation,we find a positive and insignificant relation between underpricing and institutionalallocations. We interpret this as evidence of bias associated with failure to treatallocation policy as endogenous.
Interestingly, the coefficient on Revisionþ is not significant. This implies thatparticularly positive information does not result in greater underpricing and thusmore money being left on the table overall. Instead, as we saw in the allocationsequation, informed investors are rewarded for disclosing such information withparticularly favorable allocations. This result contrasts with the findings ofBenveniste et al. (2002) for U.S. IPOs between 1985 and 2000. Since the primarydifference in the structure of our empirical model is our capacity to control forallocation policy, it appears that the inability to do so may lead to mild distortion inthe interpretation of the partial adjustment effect.
The coefficient estimated for IPOVol is negative as predicted but not significant,while the coefficient estimated for IBmktshare is negative and highly significantðp ¼ 1:3%Þ: The former suggests that the indirect costs associated with underpricingare unaffected by the general level of primary market activity. The latter suggeststhat issuers who chose to employ underwriters with larger market shares experiencelower underpricing. This result is consistent both with the notion of underwritercertification and with Benveniste et al.’s (2002) prediction that certain banks havesufficient market power to spread the costs of information production moreuniformly across deals. The effect of IBmktshare is large in economic magnitude: aone standard deviation increase in market share reduces underpricing from 22% to9.2%. Interestingly, IBmktshare is significant only if we treat it as endogenous:otherwise, its coefficient estimate decreases by 90%, from �0.019 to �0.002. Thismirrors the finding of Habib and Ljungqvist (2001) that the effect of underwriterreputation on underpricing in the U.S. changes dramatically when issuers areassumed to choose their underwriters endogenously.
The post-pricing spillover variables have the expected signs and are mostlysignificant. In particular, higher initial returns elsewhere in the primary market tendto increase underpricing, which indicates the presence of ‘hot issue’ markets. Finally,other things equal, we find that companies in high-tech industries are moreunderpriced (p ¼ 2:1%), consistent with differences in ex ante uncertainty. Firm age,while negatively related to underpricing as expected, is not significant, nor areprivatizations associated with significantly different Initial Returns.
When DollarUnderpricing is introduced as the dependent variable, results aresimilar with the main exception that the coefficient estimated for relative institutional
A.P. Ljungqvist, W.J. Wilhelm Jr. / Journal of Financial Economics 65 (2002) 167–201 191
allocations is no longer statistically significant. Recall that the sign of this coefficientcan be interpreted as an indicator of the efficiency, to the issuer, of the pricing andallocation policy. A (statistically) zero coefficient is consistent with Habib andLjungqvist’s (2001) argument that issuing firms (and their banks on their behalf)optimize over a variety of deal characteristics to maximize net proceeds (or minimizewealth losses): on average, allocation policy appears to be chosen such that informedinvestors are just compensated for the value of disclosing their private information,rather than in the expectation of monetary kickbacks from favored investors.
6. Robustness
In this section we consider potential weaknesses in the analysis and outline avariety of experiments conducted to assess the robustness of our findings.
6.1. Selectivity bias
Our sample of IPOs is by no means comprehensive, nor is it necessarily a randomsample from the population. Thus, selectivity bias may exist. For instance, if thewillingness of issuers or banks to share data with us is in some way systematicallyrelated to their bookbuilding behavior or some other characteristics, estimates basedon such data may be misleading. To explore whether selectivity bias is a concern, weuse a Heckman (1979) correction. (For details regarding selectivity corrections instructural estimation, see Maddala, 1983, pp. 234–235.) The selection equationrelates the probability of an observation being included in our final sample to logoffer size and dummies for the country of listing and the IPO year, using a probit onthe full country samples of Table 2, Column 1. This equation has very good fit, witha pseudo-R2 of 47.4%, and confirms that we are more likely to have completeinformation for larger offerings outside the U.S. and especially in France. Includingthe inverse Mills’ ratio in the structural model, we find that its coefficient is verysmall in magnitude and insignificant in each of Eqs. (1)–(3). A Wald test of the jointhypothesis that all three coefficients are zero cannot be rejected (p-value=0.57).Moreover, only the Proceeds coefficient estimate changes by more than two standarderrors following the Heckman correction (causing a sign change and point estimateof 0.009) while the privatization dummy becomes negative and significant in Eq. (2).However, since the inverse Mills’ ratio is invariably insignificant, this is more likely areflection of its collinearity with Proceeds than evidence of selectivity bias. Thus,although the sample is not as comprehensive as we would like, we find no compellingevidence of selectivity bias.
6.2. Normalization of institutional allocations
The normalization of institutional allocations in the construction of Inst Alloc ismotivated by statistically significant differences in mean allocations across
A.P. Ljungqvist, W.J. Wilhelm Jr. / Journal of Financial Economics 65 (2002) 167–201192
markets.10 But normalization also imposes a constraint on the estimation.Specifically, it is equivalent to the following:
1. instead of a single variable Inst Alloc; using four interaction variables which equalnon-normalized institutional allocations times a dummy equaling one for countryi; i ¼ 1;y; 4;
2. constraining the coefficients on the four interaction variables to equal b/[in-country average institutional allocation for country i];
3. estimating b.
Step 2 assumes that our normalization makes allocations comparable acrosscountries so that there is a single b. We can test this by allowing the four interactioncoefficients to vary by country. In the Revision equation we cannot reject thehypothesis that the four interaction coefficients are equal. On the other hand, there isevidence that the effect on underpricing varies across countries when allocations aremodeled with a country-specific effect. The effect is significantly stronger in the U.K.than in Germany, where in turn it is significantly stronger than in France.
6.3. Endogeneity of the offering mechanism
Arguably, issuers have some ability to choose the mechanism through which theyoffer shares to the public, and with it the constraints they face.11 For instance,French and British firms could list in a less constrained country, assuming that theadditional cost of issuing abroad does not outweigh the benefit derived fromescaping local constraints. We test this hypothesis using a variant of the Durbin-Wu-Hausman test of the null hypothesis that BB constraints is exogenous. The test isbased on the difference in coefficients estimated under the null of exogeneity (Table5) and the alternative of endogeneity. In our data, the test does not reject the nullthat BB constraints is exogenous (w2 ¼ 0:06; p ¼ 81:1%). The same holds forBB placings (w2 ¼ 0:11; p ¼ 73:7%).
6.4. U.K. placings
Pooling U.K. placings with other offering types yields benefits in estimation interms of sample size. On the other hand, including U.K. placings could bias ourestimation against finding significant effects, because there is little variation in theirInst Alloc: For example, in estimating the allocation equation only for U.K.placings, we would expect to obtain coefficient estimates close to zero because of theabsence of allocation discretion. Estimation with the pooled sample might thereforelead to understatement of the effects of the explanatory variables.
10The standard deviations of the mean allocations reported in Table 1, exclusive of U.K. placings, are
not statistically different across markets with the marginal exception of the comparison between the U.S.
and Germany. However, we have allowed for such differences in experiments with a normalization that
measures the number of standard deviations from the in-market average institutional allocation. (The
results are available upon request but our conclusions are not sensitive to the alternative specification.)11We are grateful to the referee and to Tim Jenkinson for alerting us to this possibility.
A.P. Ljungqvist, W.J. Wilhelm Jr. / Journal of Financial Economics 65 (2002) 167–201 193

To examine this possibility, we interact (1� BB placings) with a variety of theright-hand-side variables in the structural model’s three equations. The interactioncoefficient estimates capture the effects of each variable on non-placings andtherefore can be compared to the coefficients reported in Table 5. Wald tests indicatethat the interaction coefficients are not statistically different from the coefficientsreported in Table 5 either jointly (w2 ¼ 0:99; p ¼ 98:6%) or individually (p valuesranging from 39% to 97.7%). Standard errors are somewhat larger, as we wouldexpect, but our central conclusions do not change. (These results are available uponrequest.) We interpret these findings as indicating that our results are not colored bythe presence of U.K. placings.
6.5. Nonlinear allocation effects
Allocations can have a nonlinear effect on revisions and IPO initial returns. Weinvestigate this possibility by defining a variable Inst Allocþ which equals (theinstrumented) Inst Alloc if Inst Alloc > X ; and zero otherwise. Different values of X
correspond to different notions of ‘particularly large’ institutional allocations. Wefind no evidence of nonlinearities in the effect of allocations on revisions. There is,however, weak evidence that underpricing is further diminished when institutionsreceive allocations that exceed in-market averages by more than 10%, although allother relations are unaffected.
6.6. Alternative specifications
The structure of the model estimated in Table 5 depends heavily on (oralternatively, is constrained by) a broad interpretation of the Benveniste-Spindttheoretical framework. The signs of the coefficients for the conditioning variables arestrongly consistent with the theory and jointly highly significant, indicating good fit.But of course, this does not rule out biases associated with omitted variables or othermodel misspecifications. Since many of the exogenous variables excluded from oneor more of the structural equations have been included in extant, reduced-formanalyses, we have experimented with various alternative specifications that involveincluding additional exogenous variables in each equation, subject to theidentification constraints. Unless otherwise indicated, the central findings outlinedin Section 5 are robust to these experiments.
In the revision equation, a noteworthy finding is a positive and statisticallysignificant interaction between Inst Alloc and the privatization dummy variable. Inother words, a given increase in institutional allocations has a stronger effect on pricerevisions for privatizations. This finding is consistent with two nonmutuallyexclusive conjectures. First, privatizations often start from a lower base becauseallocation policies are explicitly designed to favor retail investors. Perhaps there arenonlinear effects from allocation policy associated with rapidly diminishing marginalreturns to the incentive effects of discretionary allocation. Moreover, becauseprivatizations are typically large, a given increase in institutional allocations implies
A.P. Ljungqvist, W.J. Wilhelm Jr. / Journal of Financial Economics 65 (2002) 167–201194
a larger dollar allocation to institutions than in the typical private-sector IPO.Perhaps this larger dollar allocation ‘buys’ more information production.
In the allocation equation, the primary finding from including additional exogenousvariables is weak evidence that the spillover variables m RevisionBB; MktRetBB; andm IRBB are negatively related to the fraction of the offering allocated to institutionalinvestors. This could be interpreted as evidence that whenmore information spills overfrom theprice revisions andunderpricing of contemporaneous offerings aswell as frombroadermarketmovements, there is less need to induce informationproduction amonginstitutional investors in the offering at hand.
The underpricing equation is the most widely explored in the existing literature. Inlight of Loughran and Ritter’s (2002) finding of ‘partial adjustment’ to publicinformation, including MktRetBB and s MktBB in Eq. (3) seems a particularly usefulexercise because it permits a test of whether recent market returns are fullyincorporated in offer prices. In contrast to Loughran and Ritter, we find no evidenceof partial adjustment to these measures of public information. Similarly, we find noevidence of direct effects associated with information spilling over from con-temporaneous offerings. The stability of the remaining coefficient estimates suggestsan absence of omitted variable bias in the original specification but the increase instandard errors suggests collinearity associated with the inclusion of the spillovervariables. This is consistent with these variables being important determinants ofRevision, which in turn is instrumented in part using these variables. We interpretthis as evidence that the spillover variables have no direct effect on underpricing buthave an indirect effect through their influence on price revisions reflected in thedifference between indicative and offer prices.
Throughout the paper we have used a directional measure of price revisions. Analternative specification suggested by Hanley (1993) uses the absolute value of thisdirectional measure. This specification enables estimation of the effect of explanatoryvariables on the magnitude but not the direction of information acquired duringbookbuilding. Reestimation of Eq. (1) using this specification yields little additionalinsight, but only 50 of the 641 sample offerings experience negative revisions, whichreflects the fact that poorly received offerings are often withdrawn (see Benvenisteet al., 2002, for related evidence from the U.S.).
Finally, Ljungqvist et al. (2001) find that pricing is influenced by both the presenceof a U.S. bank as a senior member of the syndicate and the marketing of shares toU.S. investors. Accounting for this leaves all our results unchanged withoutgenerating significant insights. This is not surprising in view of the fact that France,Germany, and the U.K. are among the most highly developed European marketsand U.S. investors and U.S. banks have the least impact in those markets at themargin (Ljungqvist et al., 2001).
7. Conclusion
If our empirical model, structured around the mechanism-design frameworkintroduced by Benveniste and Spindt (1989), is an accurate representation of the
A.P. Ljungqvist, W.J. Wilhelm Jr. / Journal of Financial Economics 65 (2002) 167–201 195
incentive structure of primary equity markets, there appears to be evidence of astrategic link between allocations and measures of price discovery and cost. On net,discretion appears to be a good thing: it allows issuers to set more informed pricesand thus minimize the wealth loss of going public.
Having said this, we recognize that discretion could be used to undermine theinterests of issuing firms. In the U.S., for example, underpricing coupled withfavoring institutional investors might reflect bankers serving their own interests andthose of repeat investors. The alleged kickbacks discussed in the context of the SEC’scurrent investigation represent an extreme manifestation of this conjecture.Loughran and Ritter (2002) suggest that issuing firms might willingly put up withthis kind of behavior even if it has no apparent benefit for them. Although ourfindings are not consistent with this hypothesis, direct investigations of proprietaryrecords, such as those currently underway in the U.S., might very well revealevidence of unsavory behavior. But at a minimum, our results provide tentativeevidence that even if banks are self-serving in their exercise of discretion over theallocation of IPO shares, there appear to be benefits for issuing firms as well.
We qualify our conclusions because of the political nature of the question at hand.But we also recognize that failure to reject the theoretical structure used in theanalysis obviously does not imply that it accurately describes reality. Still, themechanism-design framework provides an attractive null hypothesis if for no otherreason than that it implies a good deal more structure than alternative theoreticalperspectives. The framework is not a theory of underpricing. Rather, it is a theory ofthe intermediary function given a particular incentive structure in the primarymarket and the early stages of the secondary market. In this sense, the theoreticalframework subsumes not only Rock’s (1986) winner’s curse model (Benveniste andWilhelm, 1990) but also, by way of the extension in Biais et al. (2002), the agencyconcerns raised by Baron (1982). In contrast to the estimation of reduced-formmodels more typical of the literature, we have tested a structural model built on thistheory. We have not attempted to address the relative explanatory power ofcompeting theories. However, the fact that our estimation of the structural model isso fully consistent with the theory leads us to believe that our conclusions are notmerely spurious inferences regarding the linkage between allocation discretion andmarket efficiency.
Appendix A. Offer rules and mechanisms in Germany
Offer mechanisms. Issuers can choose freely between fixed-price offerings,auctions, and bookbuilding.
Allocation rules. Fixed-price offerings can be allocated in a discretionary fashion.Unless chosen by the issuer, there are no pro rata requirements, etc.
In auctions, orders are filled in descending order. The limit set for the last ordermet determines the single strike price of the auction.
Individual exchanges can, in principle, impose restrictions on IPO allocations aspart of their listing requirements. The Neuer Markt in Frankfurt, by far the most
A.P. Ljungqvist, W.J. Wilhelm Jr. / Journal of Financial Economics 65 (2002) 167–201196
important exchange for IPOs in Germany, requires issuers to adhere to theallocation guidelines of the Exchange Expert Commission at the Federal Ministry ofFinance.
The guidelines were issued on June 7, 2000 (that is, after our sample period). Theyare largely aimed at increasing the transparency of the allocation process. Forinstance, they require that the percentage allocated to retail investors be publishedafter the conclusion of the offer. Article 12 deals with allocations to retail investors inthe case of oversubscription after a bookbuilding exercise. The article is aimed atruling out ‘subjective’ criteria for determining allocations. It recommends thatissuers draw lots, allocate pro rata (within certain order sizes or across the offer as awhole), allocate according to time priority, or some other ‘objective criteria’. Thearticle applies only to ‘fair’ treatment within the retail allocation, not to allocationsto institutions or the relative split between institutional and retail allocations.
Prior to the issuance of these guidelines, IPO allocations were absolutely at theissuer’s/syndicate’s discretion.
Appendix B
Offer rules and mechanisms in France are given in Table 6.
Table 6
Method Description
Offre "a prix minimal (previously
known as Mise en vente)
Invitation to the public to bid for securities of the issuer at or above a
pre-specified minimum price. Bids must be limit orders; market orders
are automatically deleted. Once bids are received, ‘excessively high’
bids are discarded. The Paris Bourse sets the single strike price at
which orders are filled using the limit set on the last order met. If
demand is excessive, the OPM can be repeated at a higher minimum
price, or it can be converted into an offre "a prix ferme (see below) at a
(higher) fixed price
Offre "a prix ferme Invitation to the public to subscribe for securities of the issuer at a
fixed price (set in advance unless accompanied by a placement garanti,
see below). Allocations are non-discretionary (pro-rated) except that
issuers may invite subscriptions in Category A (usually up to 100
shares) and Category B (more than 100 shares) with preferential
treatment (more favorable allocation/bid ratios) in Category A. In case
of excessive demand (allocation/bid ratios below 0.8%), the OPF may
be repeated at a higher fixed price. If combined with a placement
garanti, the price set in the OPF cannot exceed the price set in the
placement
Placement garanti Invitation to investors to participate in bookbuilding. Issuers may
reserve the right to alter the price range. Allocations are at the
bookrunner’s discretion. In principle open to both retail and
institutional investors
A.P. Ljungqvist, W.J. Wilhelm Jr. / Journal of Financial Economics 65 (2002) 167–201 197

Appendix C
Offer rules and mechanisms in the United Kingdom are given in Table 7.
Table 7
Method Description
Placings The marketing of securities in issue but not listed or not yet in issue to
specified persons or clients of the sponsor or any securities house
assisting in the placing, which does not involve an offer to the public or
to existing holders of the issuer’s securities generally
Public offers
Offer for sale Invitation to the public by, or on behalf of, a third party to purchase
securities of the issuer already in issue (and may be in the form of an
invitation to tender at or above a stated minimum price). Thus
typically applies to secondary sales of existing shares
Offer for subscription Invitation to the public by, or on behalf of, an issuer to subscribe for
securities of the issuer not yet in issue (and may be in the form of an
invitation to tender at or above a stated minimum price). Thus applies
to new shares
Open offer Invitation to existing holders of securities to subscribe or purchase
securities in proportion to their holdings. Used in IPOs where existing
shareholders are given the right to purchase shares pro rata (e.g., spin-
offs, demergers or listings by means of a reverse takeover).
Hybrids: Placing combined with
Intermediaries offer The marketing of securities already or not yet in issue, by means of an
offer by, or on behalf of, the issuer to intermediaries (i.e. Stock
Exchange member firms) for them to allocate to their own clients
Public offer Defined as above
Global offers The marketing of securities in issue but not listed or not yet in issue to
investors at large, registered for sale to the public, within and outside
the United Kingdom. Allocation is at the issuer’s discretion
Introduction A method of bringing securities to listing not involving an issue of new
securities or any marketing of existing securities because the securities
are already widely held by the public
Offre "a prix ouvert Invitation to (usually) retail investors to submit price/quantity bids
within the indicative price range (limits included). Issuers may reserve
the right to alter the price range. Always accompanied by a placement
garanti aimed at institutional investors. Allocations are non-
discretionary conditional on the price bid, though as in an OPF,
issuers can invite bids in Category A and B with preference shown to
smaller orders. Introduced July 24, 1998
Table 6 (continued)
Method Description
A.P. Ljungqvist, W.J. Wilhelm Jr. / Journal of Financial Economics 65 (2002) 167–201198

In addition, issuers can use ‘such other method as may be accepted by the LondonStock Exchange (LSE) either generally or in a particular case’.
The terminology ‘public offer’, as shorthand for a combined offer for sale andoffer for subscription, is used where the offer includes both existing and new shares,though we shall use it as a collective noun for fixed-price offers. Public offers must beadvertised in at least one national newspaper and are open to all.
In placings, shares are offered selectively, usually to City institutions. Privateinvestors cannot normally apply. Shares may be set aside for employees.
Rules regarding choice of offer method. Until 1991, placings were allowed for offersraising up to d15 million, with public offers being mandatory for larger issues.Following the Initial Public Offers Review, chaired by Graham Ross Russell andwhich reported in July 1990, the LSE expanded the use of placings subject to makingretail participation in IPOs mandatory for issues exceeding certain monetarythresholds. The new rules came into effect in January 1991. Companies offeringbetween d15 million and d30 million were allowed to place their shares subject to therequirement that 75% or d15 million of the offer, whichever was the lesser, had to beoffered to the public. The offer element could be satisfied via a traditional public
Table 8
France (pure and hybrid bookbuilding)
t�20 Preliminary prospectus, containing non-binding indicative price range, filed with and
approved by the market regulator (COB—Commission des Op!erations de Bourse)
Pre-marketing to institutions
t�10 Bookbuilding (placement garanti with or without offre "a prix ouvert) opens: investors can
submit their bids
t�5 The issue is priced; if hybrid offering, offre "a prix ferme opens
t ¼ 0 Trading begins
Germany (bookbuilding)
t�14 Preliminary prospectus released to public
Pre-marketing to institutions
t�10 Non-binding indicative price range set
t�9 Price range published as amendment to preliminary prospectus
t�8 Bookbuilding opens: institutions and retail investors can submit their bids
t�3 The issue is priced
t ¼ 0 Trading begins
United Kingdom (placing and hybrids)
t�27 ‘Pathfinder prospectus’ released to selected institutions. (This is similar to a ‘red herring’ in
the U.S. though it does not usually contain a price range; instead, the institutions are given a
price indication that is not otherwise widely disseminated.)
Pre-marketing to institutions
t�10 ‘Impact day’: the issue is priced and the final prospectus is made available to all interested
investors; investors can now apply for shares
t ¼ 0 Trading begins
Calendar days relative to first trading day (t ¼ 0), averages based on our samples.
A.P. Ljungqvist, W.J. Wilhelm Jr. / Journal of Financial Economics 65 (2002) 167–201 199
offer or via the newly introduced ‘intermediaries offer’. Issues raising more than d30million should still come as public offers but the sponsor was free to place up to50%. Issues raising less than d15 million should be conducted as placings. On 1December 1993, the thresholds were raised. Below d25 million: placing. Between d25million and d50 million: mandatory public offer component. Above d50 million:mandatory public offer.
From January 1995, the LSE allowed scientific research-based companies tochoose freely between placings, public offers, and hybrids without regard to offersize (Amendment 4). In January 1996, the LSE abolished restrictions on retailparticipation for all types of issuers.
Appendix D
Typical pricing sequences are given in Table 8.
References
Aggarwal, R., Prabhala, N.R., Puri, M., 2001. Institutional allocation of initial public offerings: empirical
evidence. Journal of Finance, forthcoming.
Baron, D.P., 1982. A model of the demand for investment banking advising and distribution services for
new issues. Journal of Finance 37, 955–976.
Benveniste, L.M., Spindt, P.A., 1989. How investment bankers determine the offer price and allocation of
new issues. Journal of Financial Economics 24, 343–361.
Benveniste, L.M., Wilhelm, W.J., 1990. A comparative analysis of IPO proceeds under alternative
regulatory environments. Journal of Financial Economics 28, 173–207.
Benveniste, L.M., Busaba, W., Wilhelm, W.J., 1996. Price stabilization as a bonding mechanism in new
equity issues. Journal of Financial Economics 42, 223–255.
Benveniste, L.M., Busaba, W., Wilhelm, W.J., 2002. Information externalities and the role of underwriters
in primary equity markets. Journal of Financial Intermediation 11, 61–86.
Benveniste, L.M., Ljungqvist, A.P., Wilhelm, W.J., Yu, X., 2002. Evidence of information spillovers in the
production of investment banking services. Journal of Finance, Forthcoming.
Biais, B., Bossaerts, P., Rochet, J.-C., 2002. An optimal IPO mechanism. Review of Economic Studies 69,
117–146.
Biais, B., Faugeron-Crouzet, A.M., 2002. IPO auctions: English, Dutch, y French and Internet. Journal
of Financial Intermediation 11, 9–36.
Cornelli, F., Goldreich, D., 2000. Bookbuilding: how informative is the order book? Unpublished working
paper, London Business School.
Cornelli, F., Goldreich, D., 2001. Bookbuilding and strategic allocation. Journal of Finance 56,
2337–2369.
Demsetz, H., Lehn, K., 1985. The structure of corporate ownership: causes and consequences. Journal of
Political Economy 93, 1155–1177.
Greene, W.H., 2000. Econometric Analysis, 4th Edition. Prentice-Hall, Upper Saddle River, NJ.
Habib, M.A., Ljungqvist, A.P., 1998. Underpricing and IPO proceeds: a note. Economics Letters 61,
381–383.
Habib, M.A., Ljungqvist, A.P., 2001. Underpricing and entrepreneurial wealth losses: theory and
evidence. Review of Financial Studies 14, 433–458.
Hanley, K., 1993. The underpricing of initial public offerings and the partial adjustment phenomenon.
Journal of Financial Economics 34, 231–250.
A.P. Ljungqvist, W.J. Wilhelm Jr. / Journal of Financial Economics 65 (2002) 167–201200
Hanley, K., Wilhelm, W.J., 1995. Evidence on the strategic allocation of initial public offerings. Journal of
Financial Economics 37, 239–257.
Heckman, J., 1979. Sample selection bias as a specification error. Econometrica 47, 153–162.
Jenkinson, T.J., Ljungqvist, A.P., 2001. Going Public: the theory and evidence on how companies raise
equity finance, 2nd edition. Oxford University Press, Oxford.
Ljungqvist, A.P., 1997. Pricing initial public offerings: further evidence from Germany. European
Economic Review 41, 1309–1320.
Ljungqvist, A.P., Jenkinson, T.J., Wilhelm, W.J., 2001. Global integration in primary equity markets: the
role of U.S. banks and U.S. investors. Review of Financial Studies, forthcoming.
Loughran, T., Ritter, J.R., 2002. Why don’t issuers get upset about leaving money on the table in IPOs?
Review of Financial Studies 15, 413–444.
Lowry, M., Schwert, G.W., 2000. IPO market cycles: bubbles or sequential learning? Journal of Finance,
forthcoming.
Maddala, G.S., 1983. Limited-Dependent and Qualitative Variables in Econometrics. Cambridge
University Press, Cambridge.
Rock, K., 1986. Why new issues are underpriced. Journal of Financial Economics 15, 187–212.
Sherman, A., 2000. IPOs and long-term relationships: an advantage of book building. Review of Financial
Studies 13, 697–714.
Sherman, A., Titman, S., 2000. Building the IPO order book: underpricing and participation limits with
costly information. Journal of Financial Economics, forthcoming.
A.P. Ljungqvist, W.J. Wilhelm Jr. / Journal of Financial Economics 65 (2002) 167–201 201