iqm session 1 5nov11
DESCRIPTION
IQMTRANSCRIPT

1
IT Quality Management
Jeeshan George
Session 1
5th Nov, 2011
2
Session plan
� Context Setting
� Product quality
� Service quality
� Situation room 1
� Quality by stages
� Quality paradigm

3
Context Setting
� Expectations
� Some ground rules
� Ref material
� Evaluations
� … and some history
4
Session plan
� Context Setting
� Product quality
� Service quality
� Situation room 1
� Quality by stages
� Quality paradigm
5
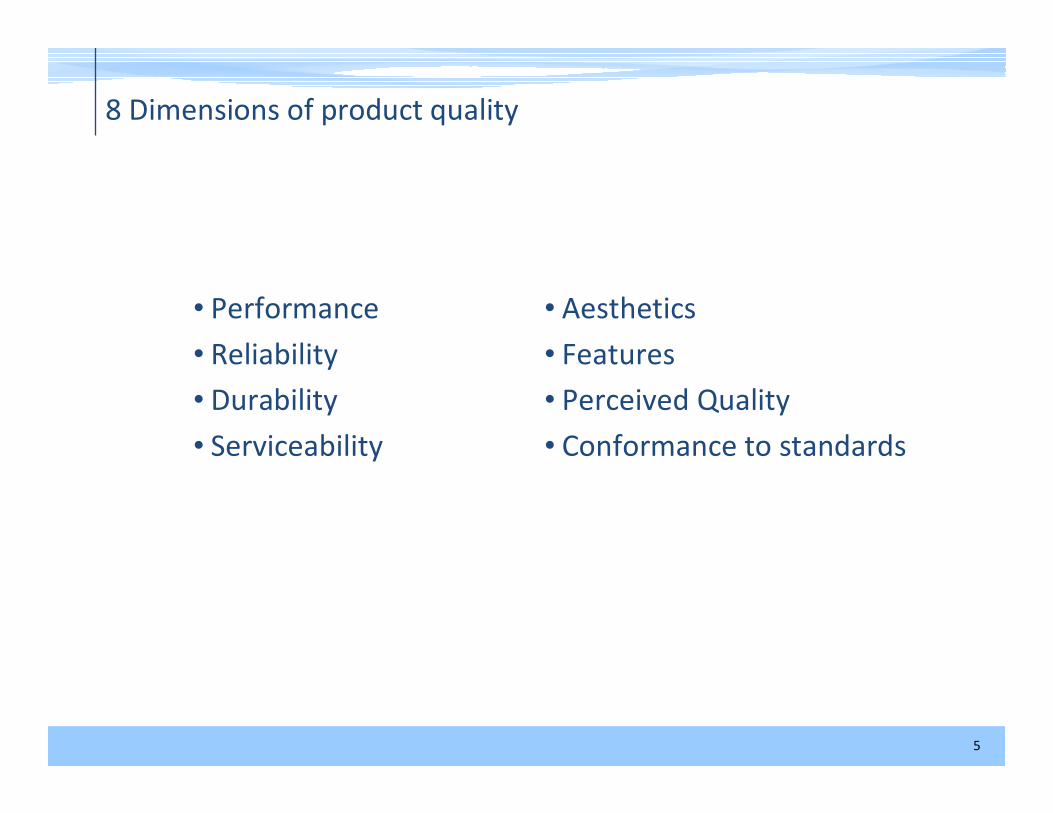
8 Dimensions of product quality
• Performance
• Reliability
• Durability
• Serviceability
• Aesthetics
• Features
• Perceived Quality
• Conformance to standards
6
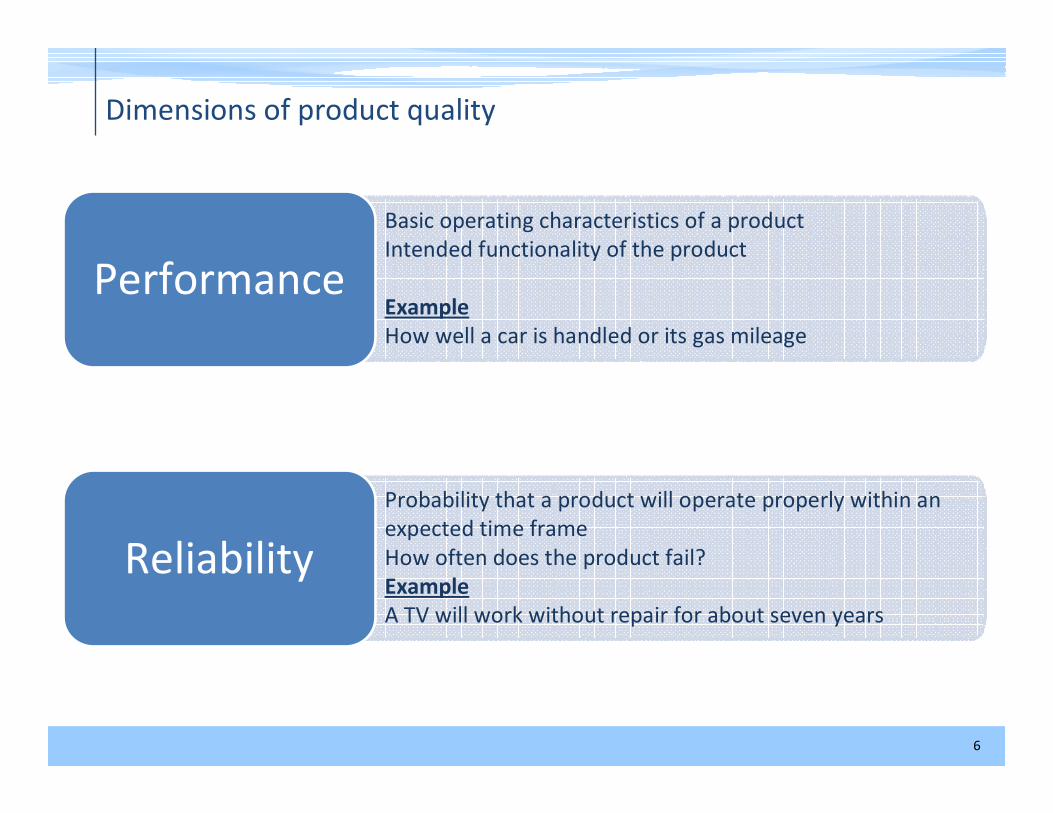
Dimensions of product quality
Basic operating characteristics of a product
Intended functionality of the product
Example
How well a car is handled or its gas mileage
Performance
Probability that a product will operate properly within an
expected time frame
How often does the product fail?
Example
A TV will work without repair for about seven years
Reliability
7
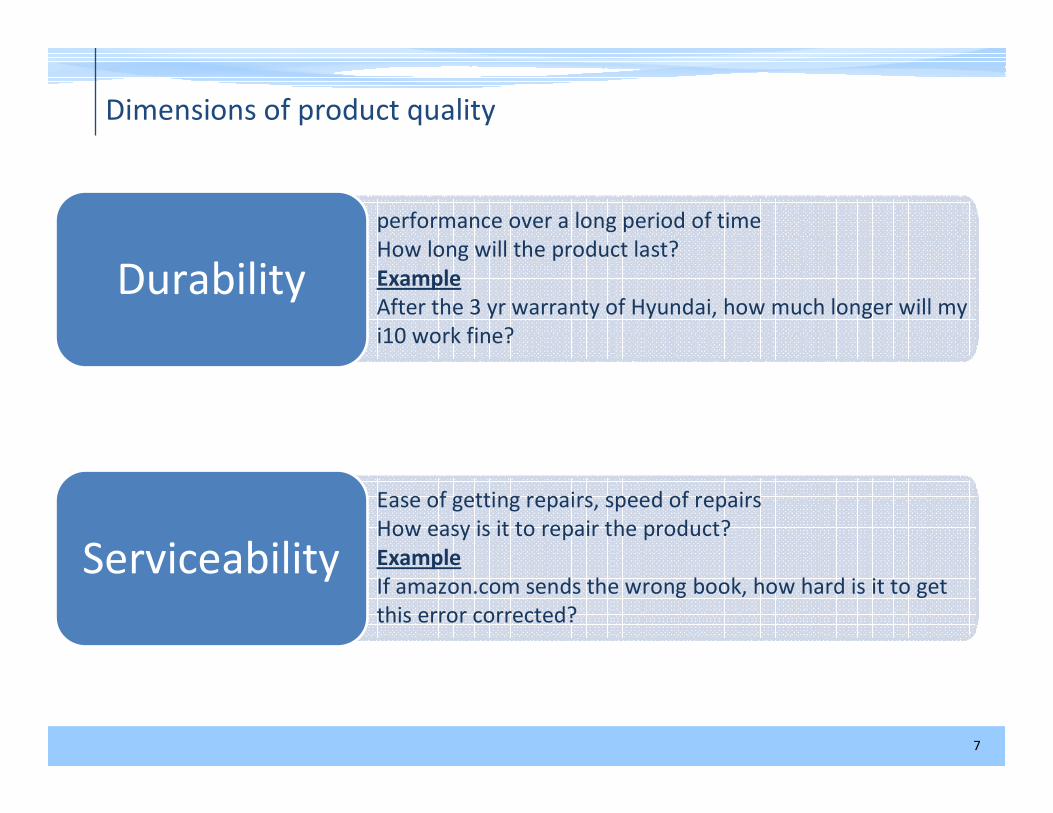
performance over a long period of time
How long will the product last?
Example
After the 3 yr warranty of Hyundai, how much longer will my
i10 work fine?
Durability
Ease of getting repairs, speed of repairs
How easy is it to repair the product?
Example
If amazon.com sends the wrong book, how hard is it to get
this error corrected?
Serviceability
Dimensions of product quality
8
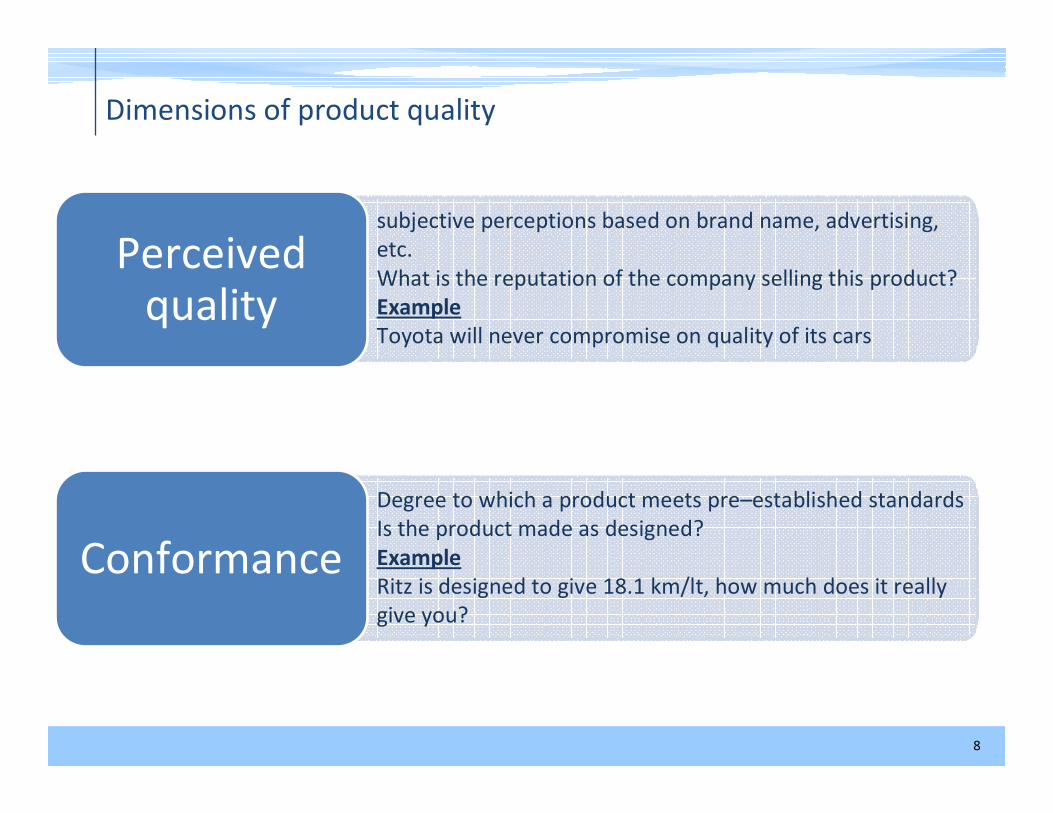
subjective perceptions based on brand name, advertising,
etc.
What is the reputation of the company selling this product?
Example
Toyota will never compromise on quality of its cars
Perceived quality
Degree to which a product meets pre–established standards
Is the product made as designed?
Example
Ritz is designed to give 18.1 km/lt, how much does it really
give you?
Conformance
Dimensions of product quality
9
Session plan
� Context Setting
� Product quality
� Service quality
� Situation room 1
� Quality by stages
� Quality paradigm
10
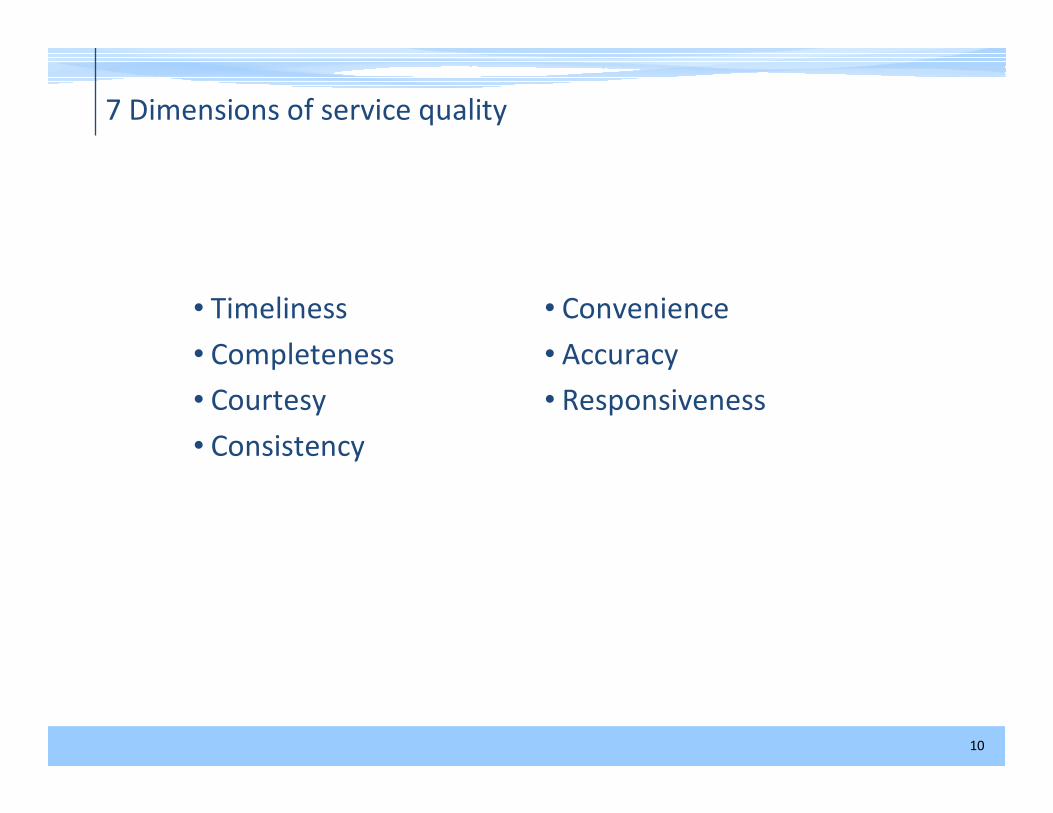
7 Dimensions of service quality
• Timeliness
• Completeness
• Courtesy
• Consistency
• Convenience
• Accuracy
• Responsiveness
11
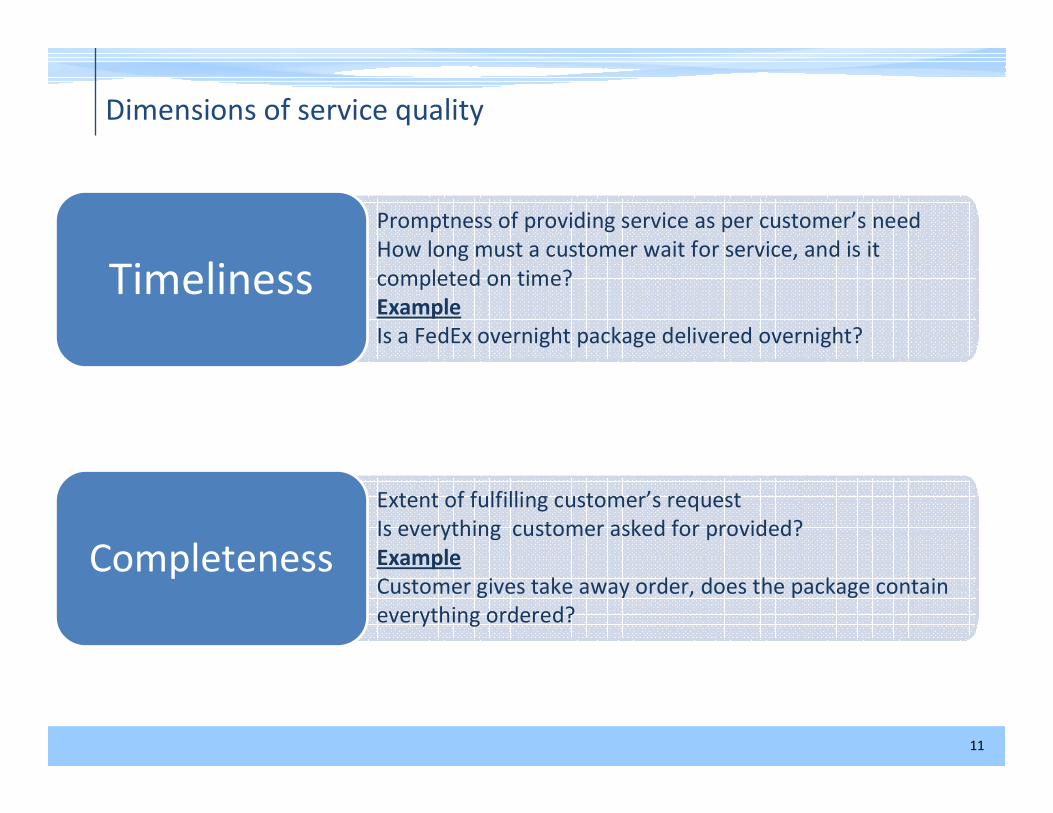
Promptness of providing service as per customer’s need
How long must a customer wait for service, and is it
completed on time?
Example
Is a FedEx overnight package delivered overnight?
Timeliness
Extent of fulfilling customer’s request
Is everything customer asked for provided?
Example
Customer gives take away order, does the package contain
everything ordered?
Completeness
Dimensions of service quality
12
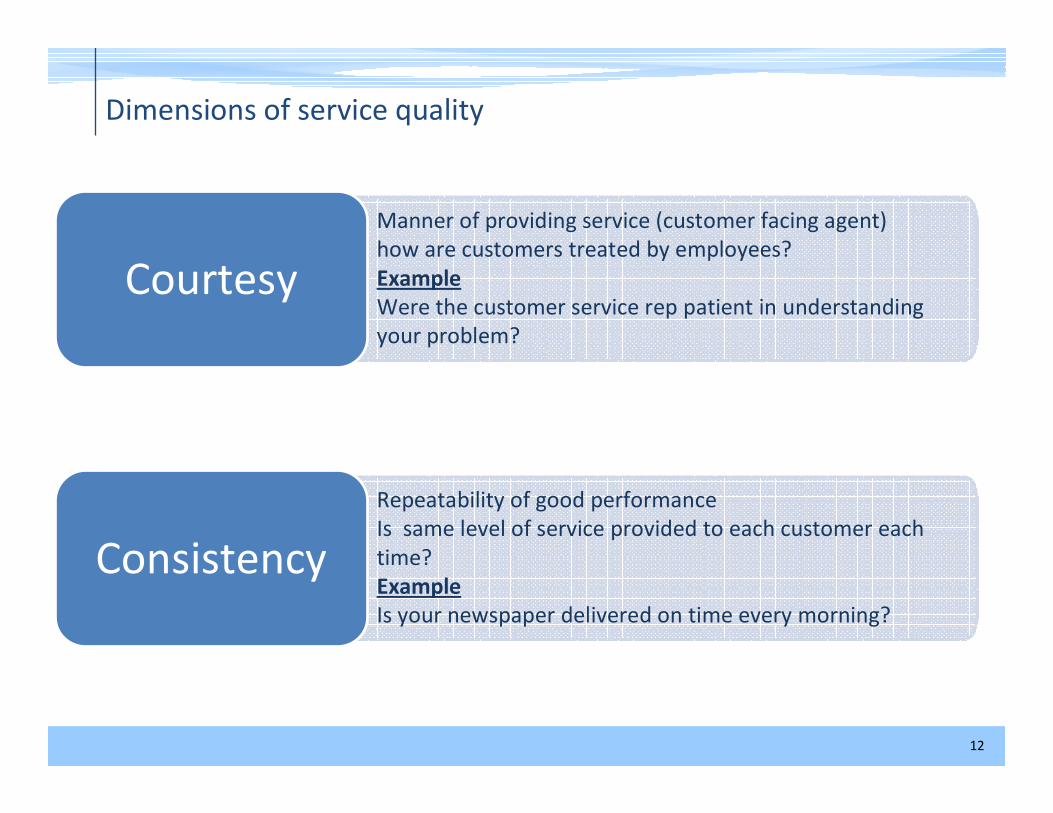
Manner of providing service (customer facing agent)
how are customers treated by employees?
Example
Were the customer service rep patient in understanding
your problem?
Courtesy
Repeatability of good performance
Is same level of service provided to each customer each
time?
Example
Is your newspaper delivered on time every morning?
Consistency
Dimensions of service quality
13
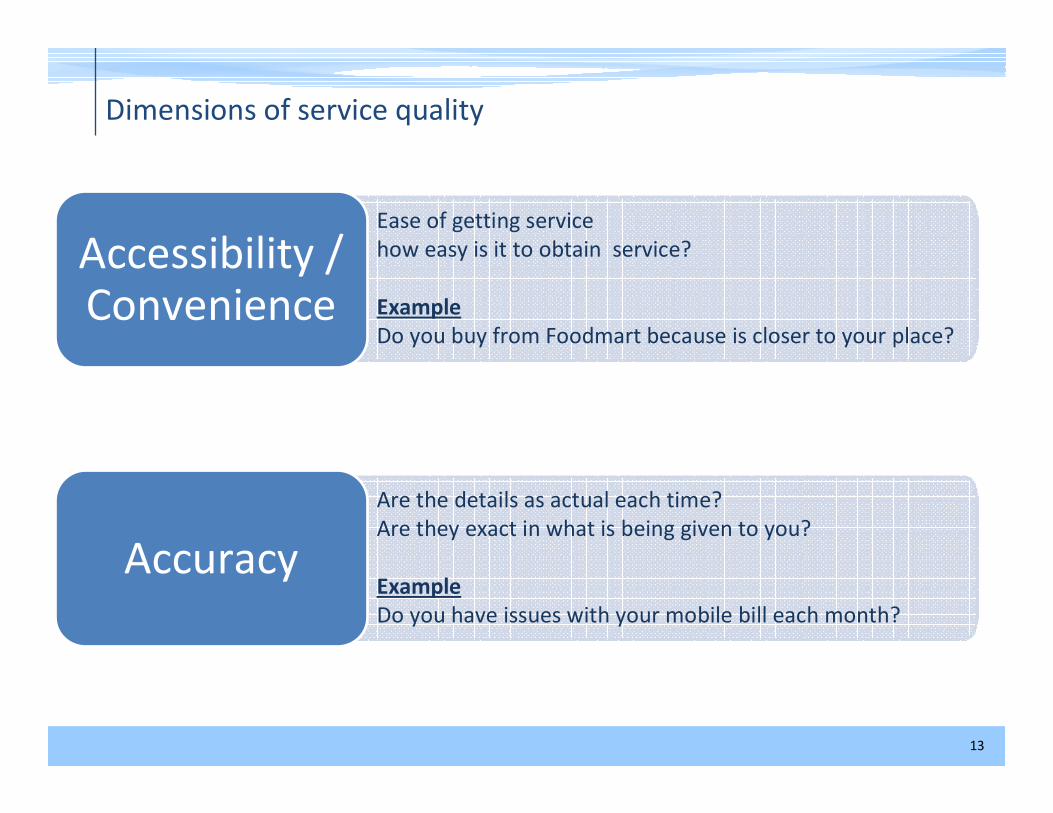
Ease of getting service
how easy is it to obtain service?
Example
Do you buy from Foodmart because is closer to your place?
Accessibility / Convenience
Are the details as actual each time?
Are they exact in what is being given to you?
Example
Do you have issues with your mobile bill each month?
Accuracy
Dimensions of service quality

14
Time to 1st response
How well does company react to unusual situations?
Example
How long does the IVR take to get you connected?
Responsiveness
Dimensions of service quality
15
outline
� Context Setting
� Product quality
� Service quality
� Situation room 1
� Quality by stages
� Quality paradigm
16
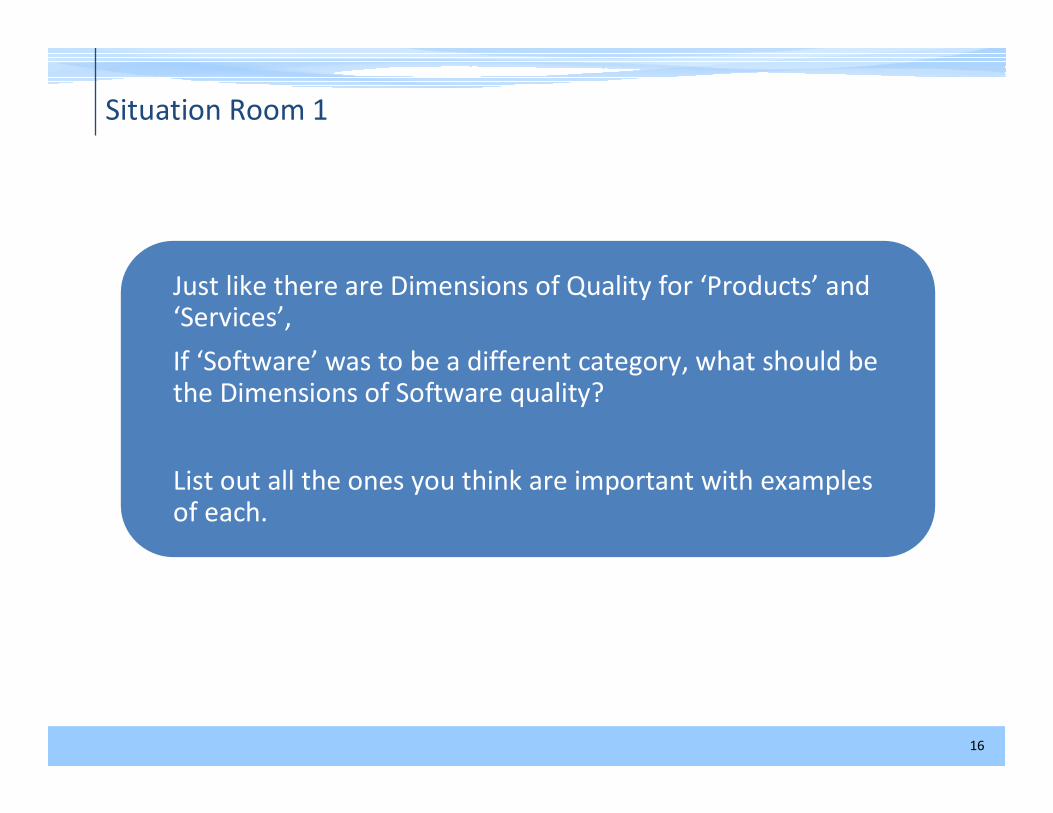
Situation Room 1
Just like there are Dimensions of Quality for ‘Products’ and ‘Services’,
If ‘Software’ was to be a different category, what should be the Dimensions of Software quality?
List out all the ones you think are important with examples of each.
17
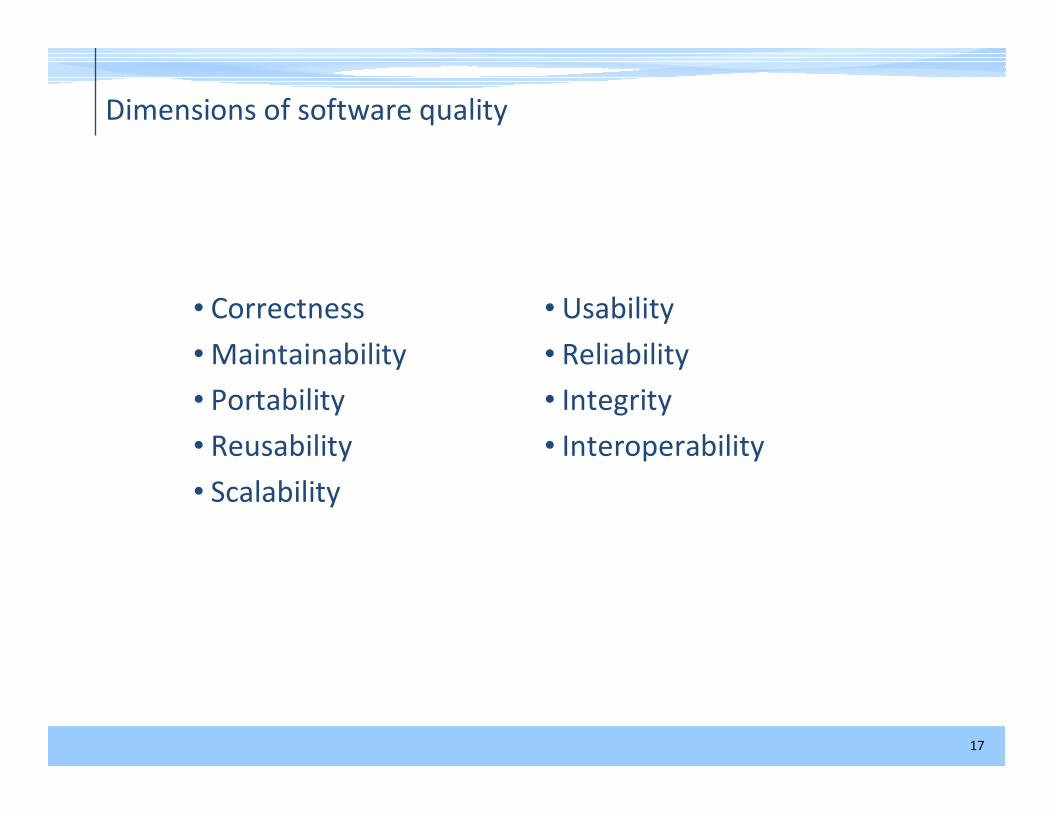
Dimensions of software quality
• Correctness
• Maintainability
• Portability
• Reusability
• Scalability
• Usability
• Reliability
• Integrity
• Interoperability

18
Group Exercise
• G1: Myntra.com
• G2: ERP issue
• G3: World War III
• G4: Bulk SMS utility
19
Session plan
� Context Setting
� Product quality
� Service quality
� Situation room 1
� Quality by stages
� Quality paradigm

20
Quality by stages
• Quality of Design
refers to the characteristics that designer’s specify for an item
o Materials/Components used
o Specifications of the components
o Reliability of drive train components
• Quality of conformance
is the degree to which the design specifications are followed during build
o Choice of processes
o Training of the people
o Quality-assurance procedures that were used

21
Session plan
� Context Setting
� Product quality
� Service quality
� Situation room 1
� Quality by stages
� Quality paradigm
22
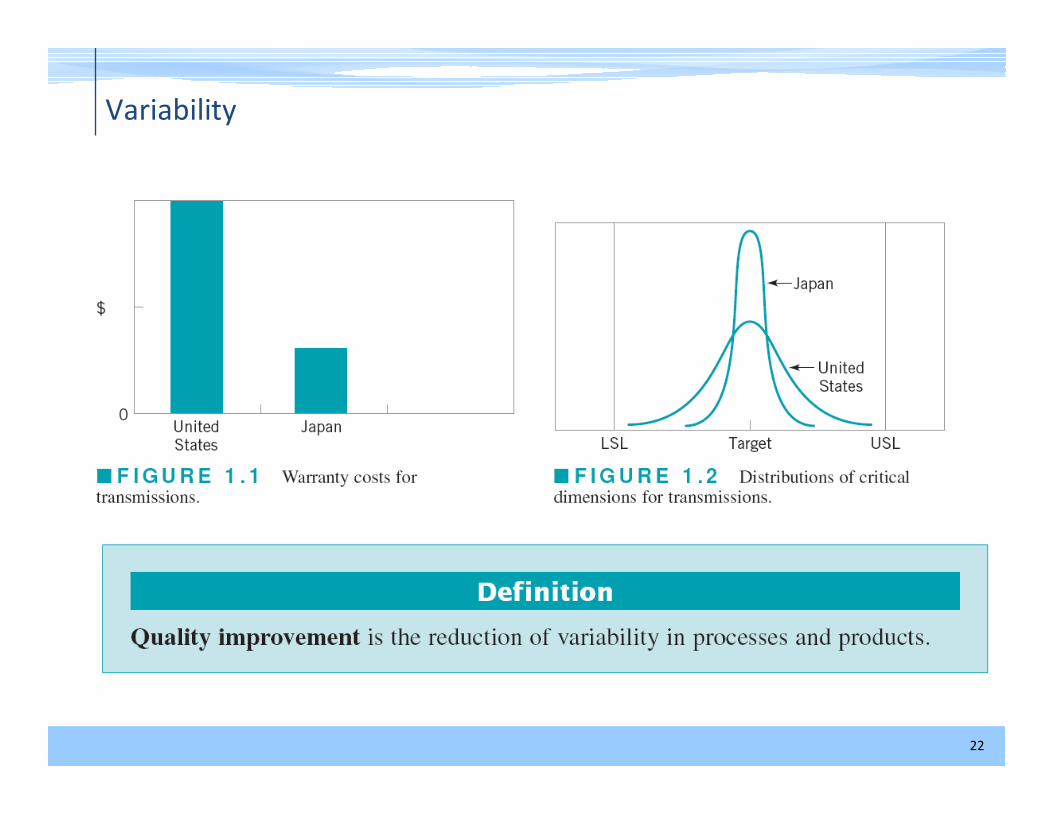
Variability
23
Cost of Quality
• Cost of Quality
includes all costs incurred in the pursuit of quality or in performing quality related activities such as appraisal costs, failure costs and external failure costs

24
Quality Assurance
• Quality Assurance
consists of processes, tools and techniques used to proactively eliminate causes of poor quality
25
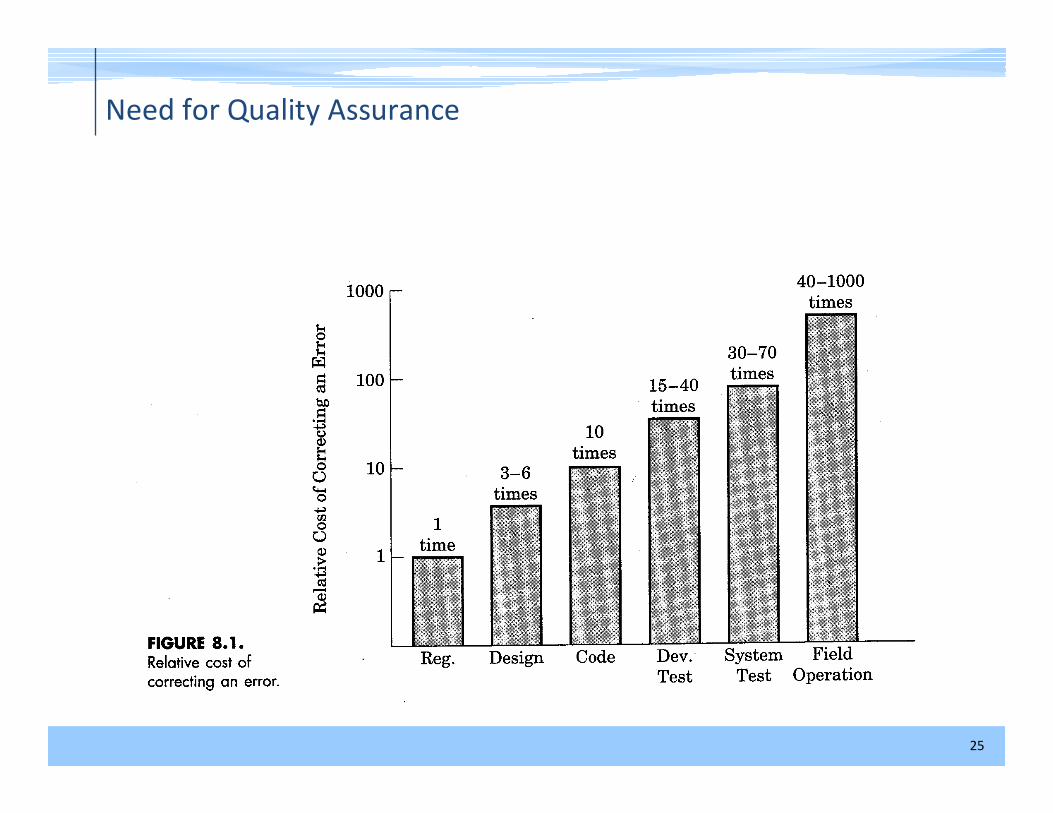
Need for Quality Assurance

26
Acceptance Sampling
• Acceptance sampling is the inspection and classification of
a sample of the product selected at random from a larger
batch or lot and the ultimate decision about disposition of
the lot.
• Two types:
1. Outgoing inspection - follows production
2. Incoming inspection - before use in production
27
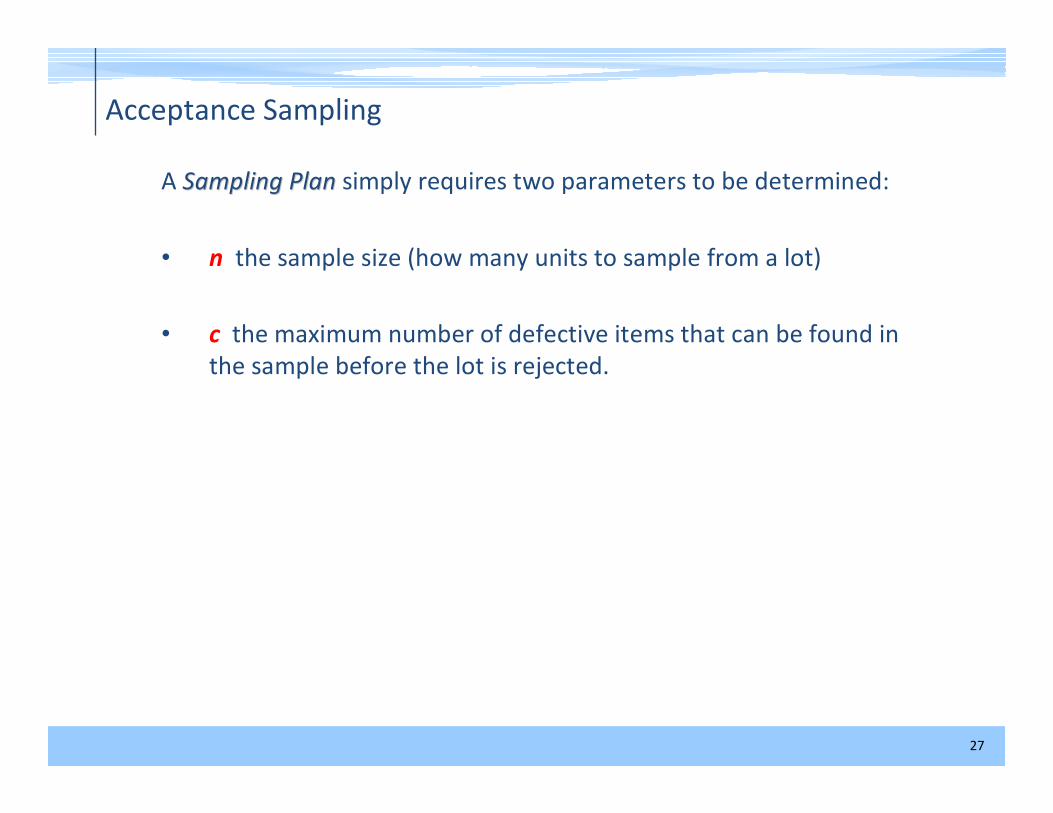
Acceptance Sampling
A Sampling PlanSampling Plan simply requires two parameters to be determined:
• n the sample size (how many units to sample from a lot)
• c the maximum number of defective items that can be found in
the sample before the lot is rejected.
28
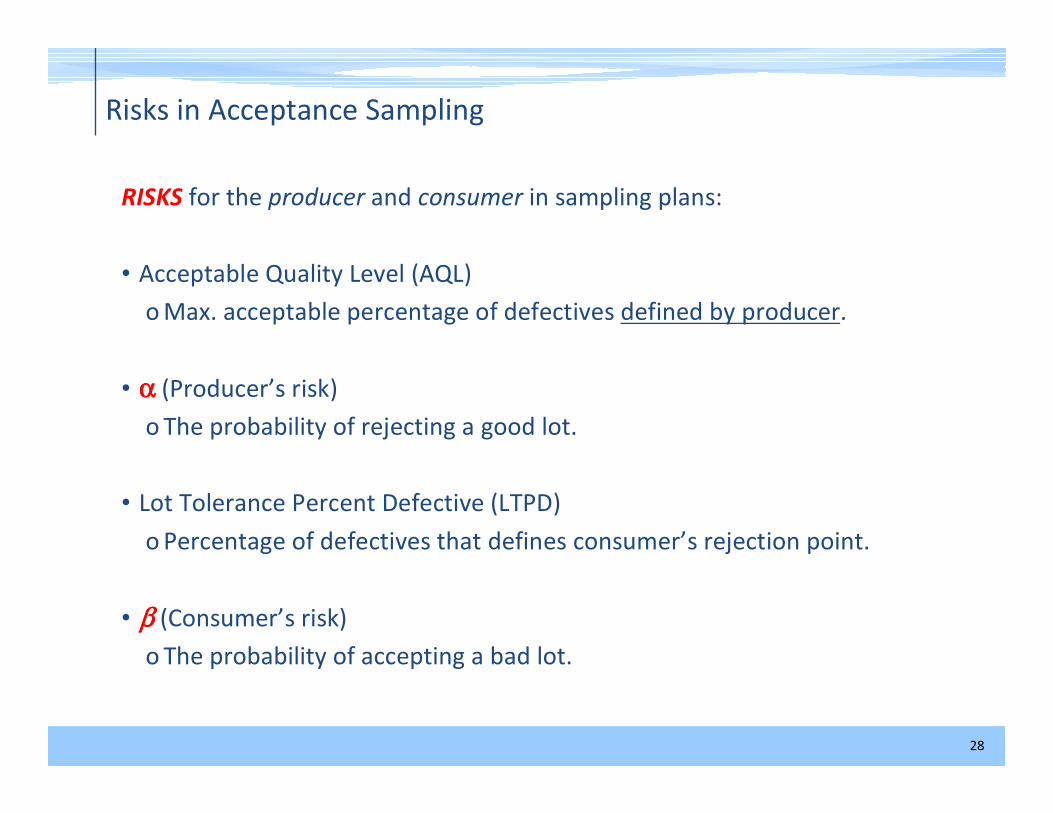
Risks in Acceptance Sampling
RISKS for the producer and consumer in sampling plans:
• Acceptable Quality Level (AQL)
o Max. acceptable percentage of defectives defined by producer.
• αααα (Producer’s risk)
o The probability of rejecting a good lot.
• Lot Tolerance Percent Defective (LTPD)
o Percentage of defectives that defines consumer’s rejection point.
• ββββ (Consumer’s risk)
o The probability of accepting a bad lot.

29
Acceptance Sampling
Advantages
• Economy
• Less handling damage
• Fewer inspectors
• Upgrading of the inspection job
• Applicability to destructive testing
• Entire lot rejection (motivation for
improvement)
Disadvantages
• Risks of accepting “bad” lots and
rejecting “good” lots
• Added planning and documentation
• Sample provides less information
than 100-percent inspection
• Reactive approach
30
Statistical Quality Management/Control (SQC)
• SQC is a number of different techniques designed to evaluate quality
from a conformance view
o How are we doing in meeting specifications?
• SQC can be applied to both manufacturing and service processes
• SQC techniques usually involve periodic sampling of the process and
analysis of data
o Sample size
o Number of samples
• SQC techniques are looking for variance
• Most processes produce variance in output
o we need to monitor the variance (and the mean also) and correct
processes when they get out of range

31
SQC premise
• A graph that establishes control limits of a process
• Control limits are set (upper and low bands)
11 22 33 44 55 66 77 88 99 1010Sample numberSample number
UpperUppercontrolcontrol
limitlimit
ProcessProcessaverageaverage
LowerLowercontrolcontrol
limitlimit
Out of controlOut of control

32
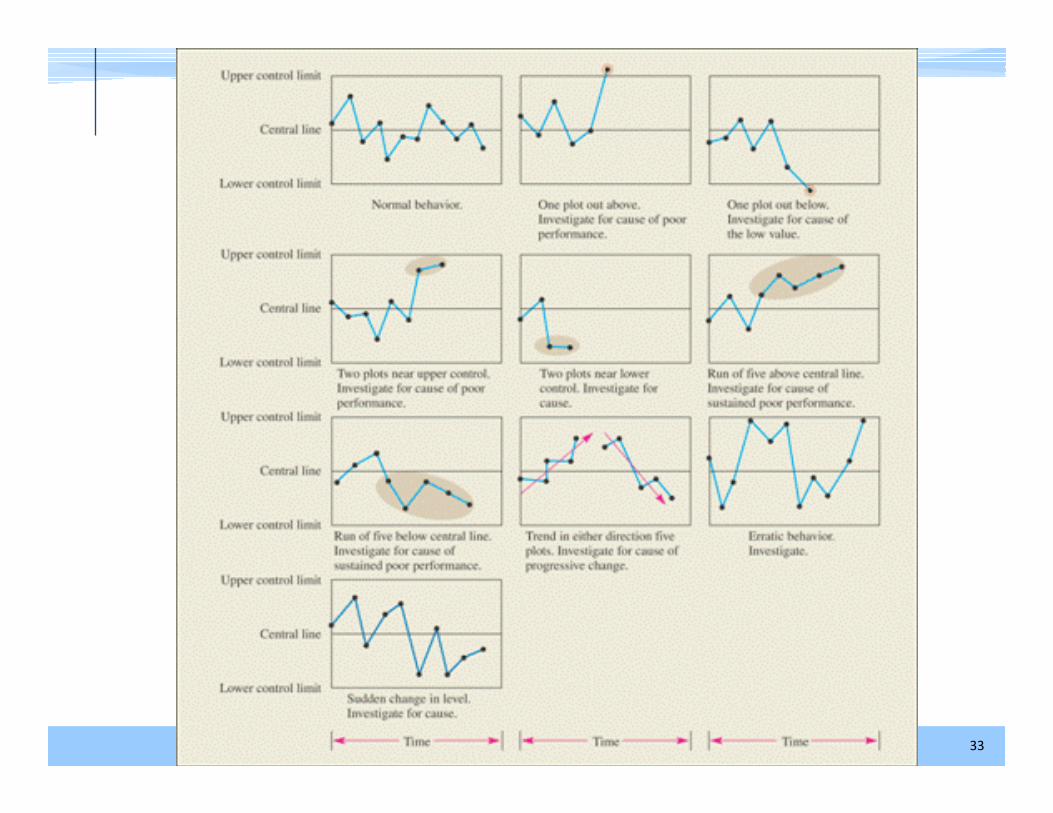
SQC premise
• A process is in control if…
o … no sample points outside limits
o … most points near process average
o … about equal number of points above and below centerline
o … points appear randomly distributed
33
34
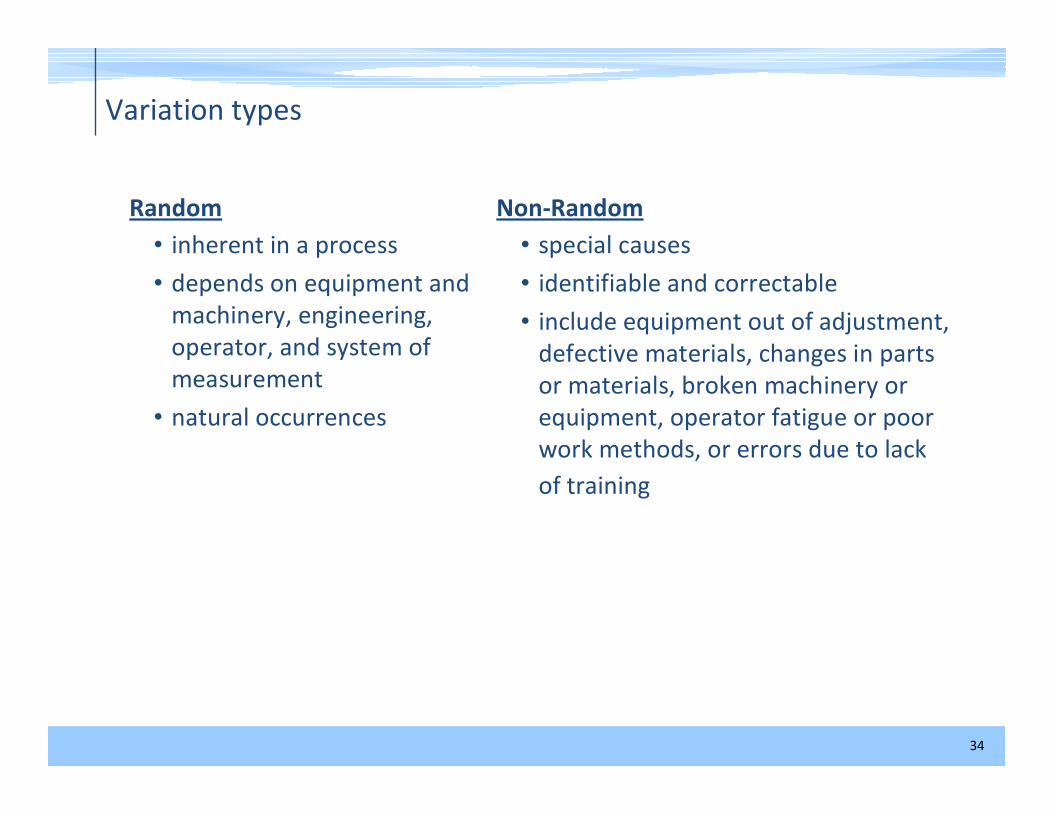
Variation types
Random
• inherent in a process
• depends on equipment and
machinery, engineering,
operator, and system of
measurement
• natural occurrences
Non-Random
• special causes
• identifiable and correctable
• include equipment out of adjustment,
defective materials, changes in parts
or materials, broken machinery or
equipment, operator fatigue or poor
work methods, or errors due to lack
of training
35
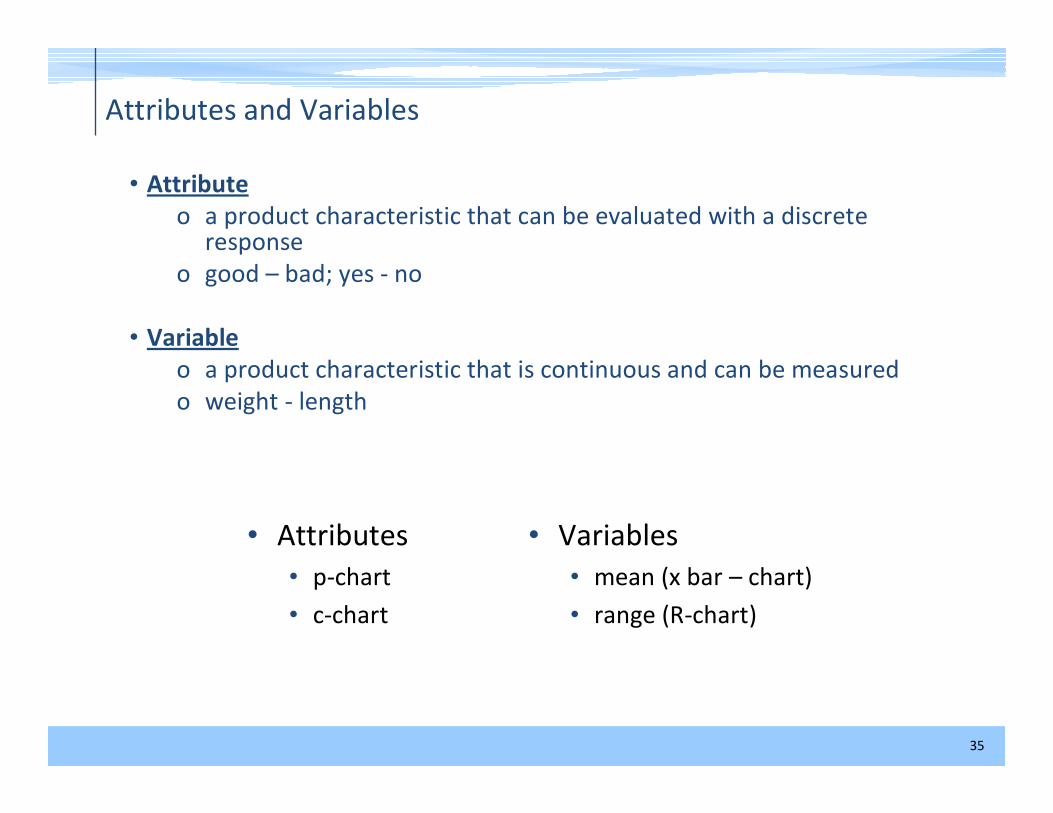
Attributes and Variables
• Attribute
o a product characteristic that can be evaluated with a discrete response
o good – bad; yes - no
• Variable
o a product characteristic that is continuous and can be measured
o weight - length
• Variables
• mean (x bar – chart)
• range (R-chart)
• Attributes
• p-chart
• c-chart
36
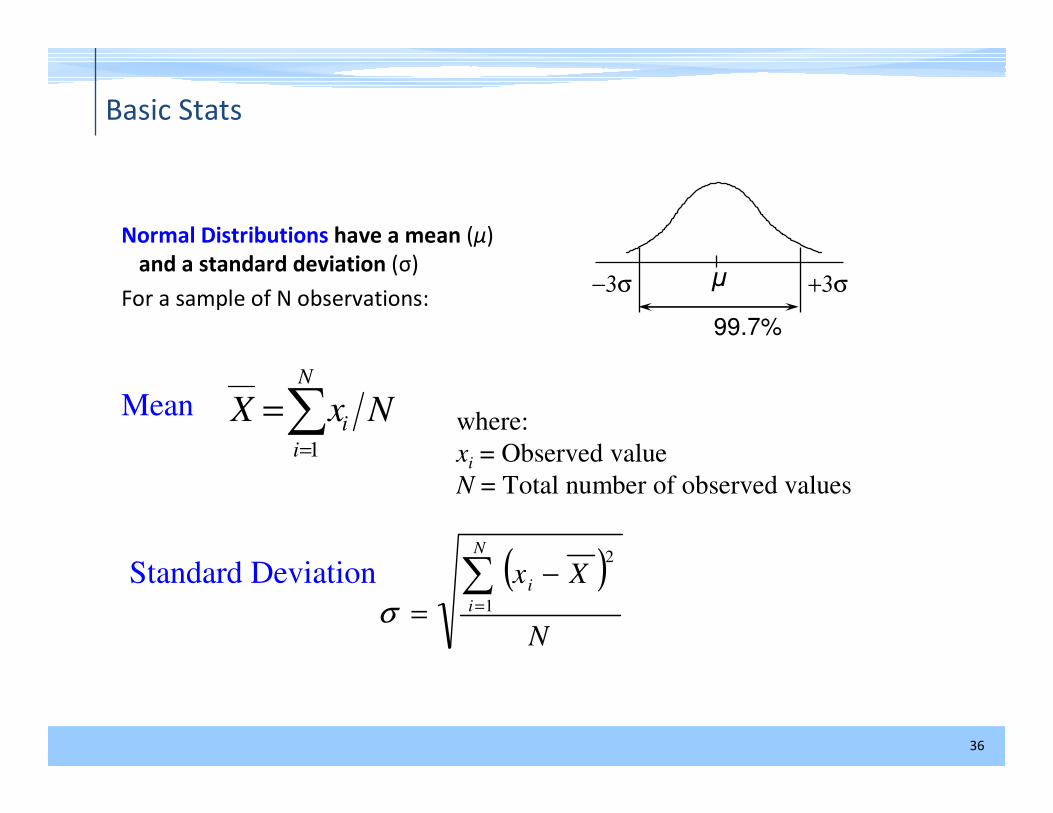
Basic Stats
Mean
Normal Distributions have a mean (μ)
and a standard deviation (σ)
For a sample of N observations:
∑=
=N
i
iNxX
1
( )
N
Xx
N
i
i∑=
−
= 1
2
σ
where:
xi= Observed value
N = Total number of observed values
Standard Deviation
−3σ +3σ
99.7%
µ

37
Session plan
� Recap of session 1
� Dimensions of product quality
� Dimensions of service quality
� Situation room 1
� Quality by stages
� Quality paradigm
� Acceptance sampling
� Statistical Process Control (SPC)
� Attributes based measures
38
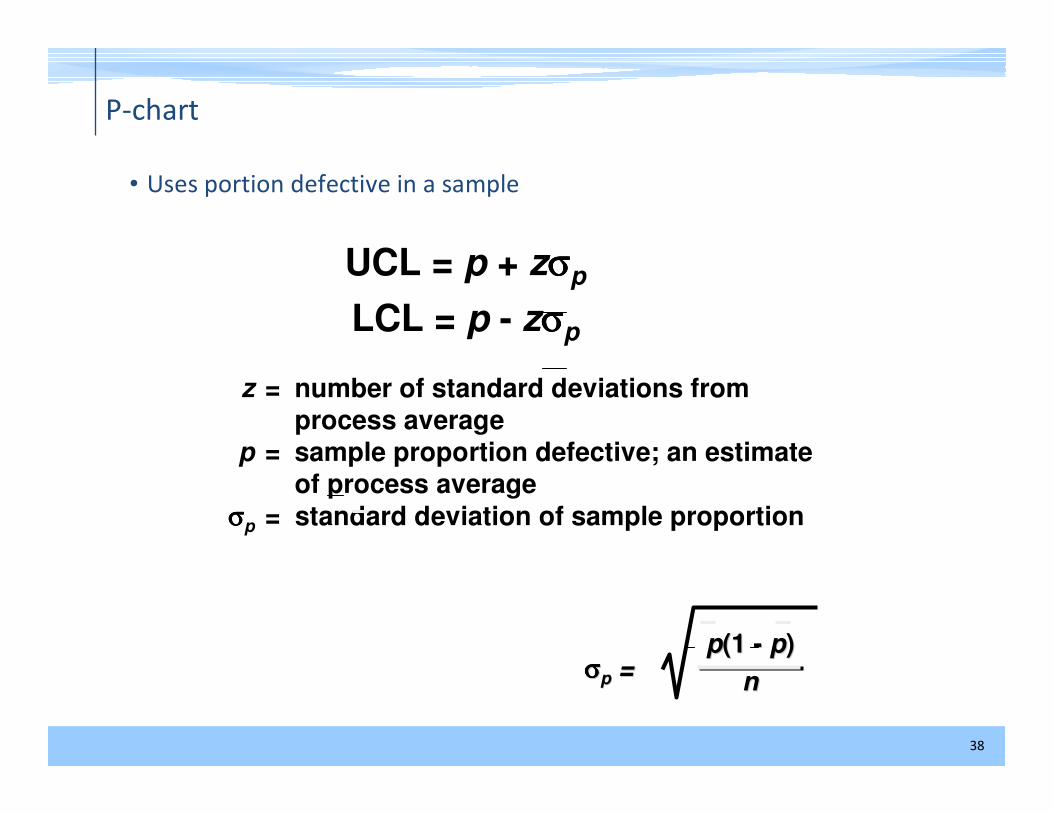
P-chart
• Uses portion defective in a sample
UCL = p + zσσσσp
LCL = p - zσσσσp
z = number of standard deviations from
process average
p = sample proportion defective; an estimate
of process average
σσσσp= standard deviation of sample proportion
σσσσσσσσpp = = pp(1 (1 -- pp))
nn
39
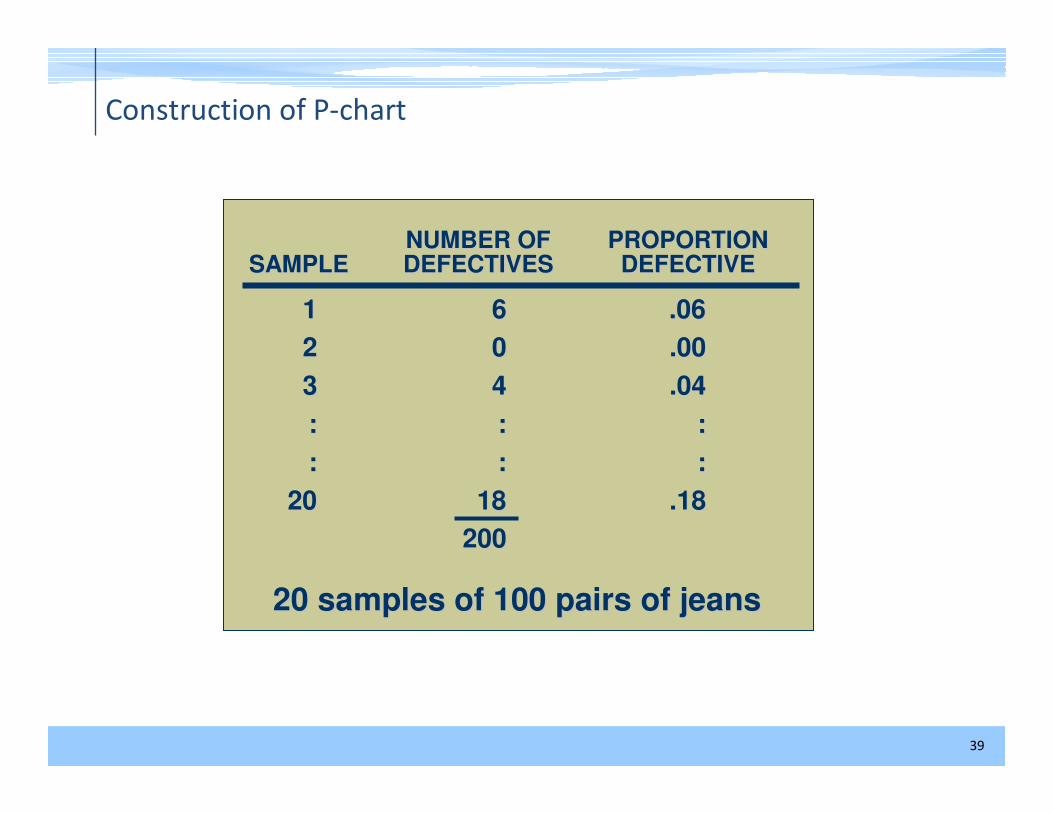
Construction of P-chart
20 samples of 100 pairs of jeans20 samples of 100 pairs of jeans
NUMBER OFNUMBER OF PROPORTIONPROPORTIONSAMPLESAMPLE DEFECTIVESDEFECTIVES DEFECTIVEDEFECTIVE
11 66 .06.06
22 00 .00.00
33 44 .04.04
:: :: ::
:: :: ::
2020 1818 .18.18
200200

40
Construction of P-chart
UCL = p + z = 0.10 + 3p(1 - p)
n
0.10(1 - 0.10)
100
UCL = 0.190
LCL = 0.010
LCL = p - z = 0.10 - 3p(1 - p)
n
0.10(1 - 0.10)
100
= 200 / 20(100) = 0.10total defectives
total sample observationsp =
41
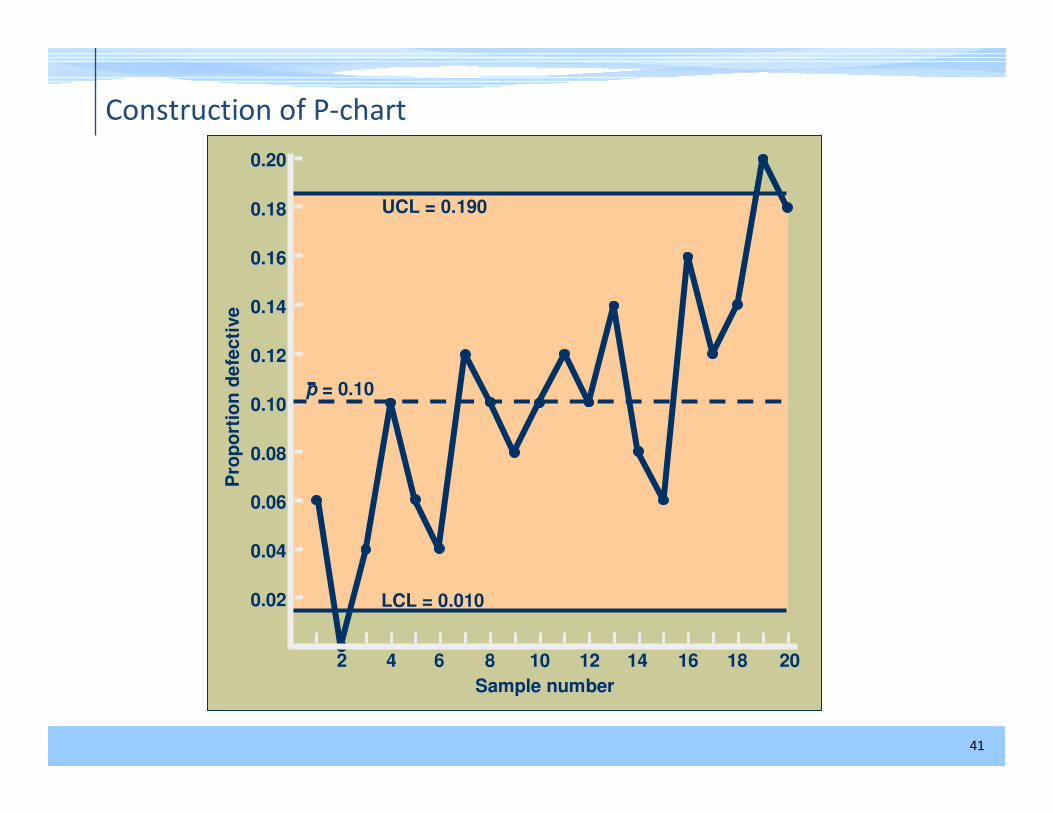
Construction of P-chart
0.020.02
0.040.04
0.060.06
0.080.08
0.100.10
0.120.12
0.140.14
0.160.16
0.180.18
0.200.20
Pro
po
rtio
n d
efe
cti
ve
Pro
po
rtio
n d
efe
cti
ve
Sample numberSample number
22 44 66 88 1010 1212 1414 1616 1818 2020
UCL = 0.190
LCL = 0.010
p = 0.10
42
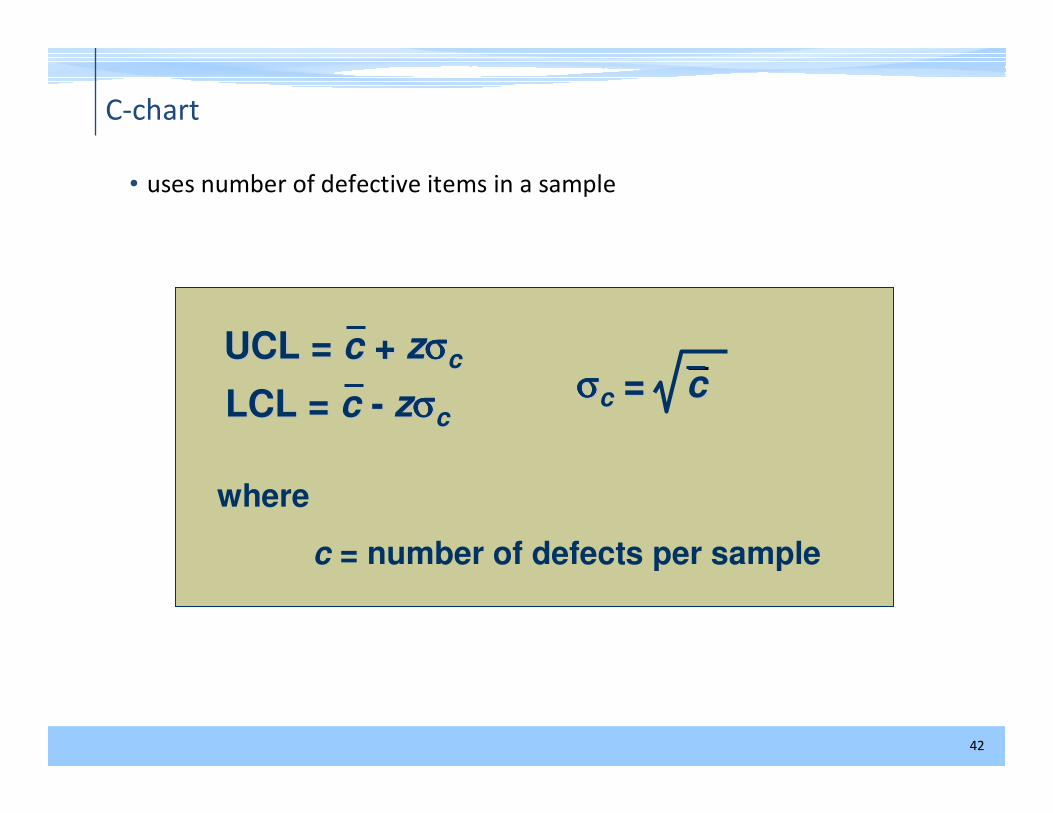
C-chart
• uses number of defective items in a sample
UCL = UCL = cc + + zzσσσσσσσσcc
LCL = LCL = cc -- zzσσσσσσσσcc
where
c = number of defects per sample
σσσσσσσσcc = = cc
43
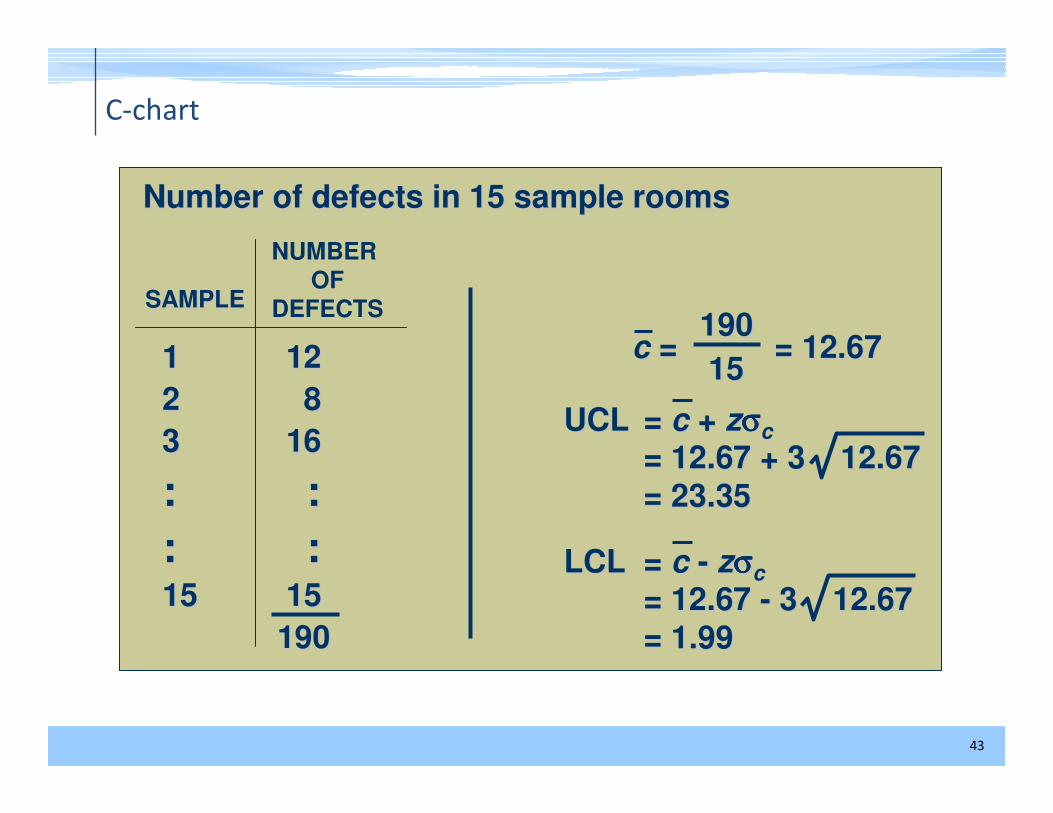
C-chart
Number of defects in 15 sample roomsNumber of defects in 15 sample rooms
1 121 12
2 82 8
3 163 16
: :: :
: :: :15 15 1515
190190
SAMPLESAMPLE
cc = = 12.67= = 12.67190190
1515
UCLUCL = = cc + + zzσσσσσσσσcc
= 12.67 + 3 12.67= 12.67 + 3 12.67
= 23.35= 23.35
LCLLCL = = cc -- zzσσσσσσσσcc
= 12.67 = 12.67 -- 3 12.673 12.67
= 1.99= 1.99
NUMBER
OF
DEFECTS
44
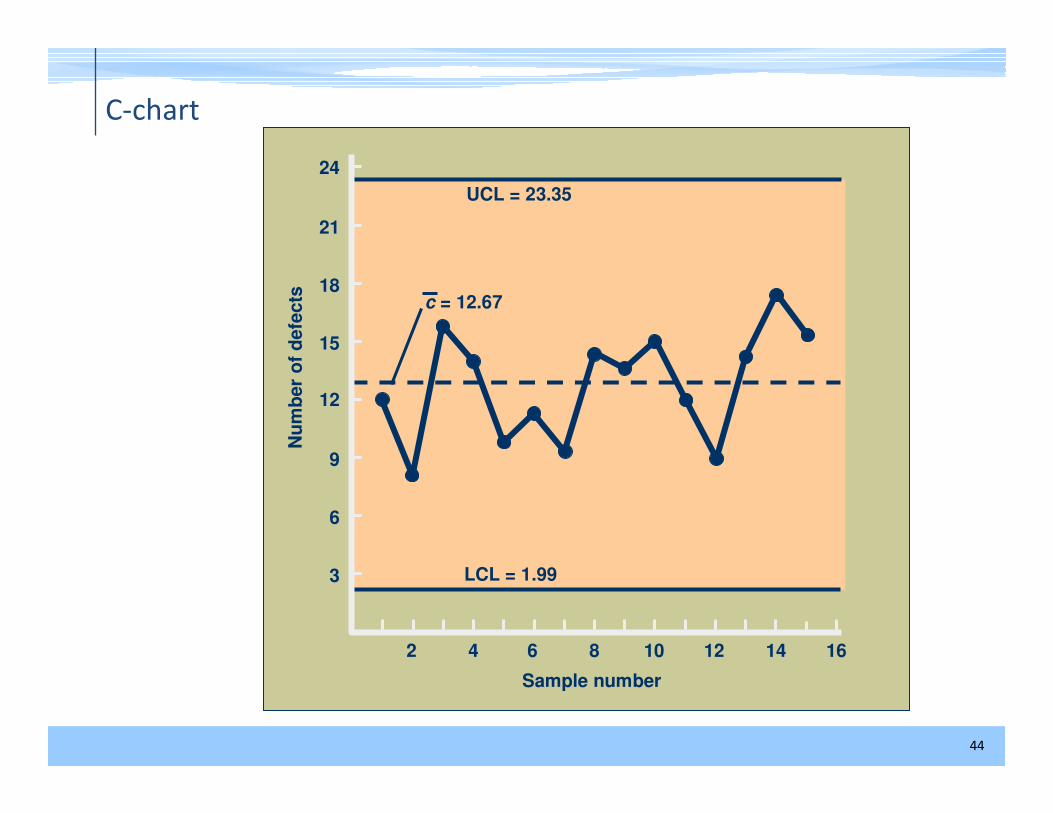
C-chart
33
66
99
1212
1515
1818
2121
2424
Nu
mb
er
of
defe
cts
Nu
mb
er
of
defe
cts
Sample numberSample number
22 44 66 88 1010 1212 1414 1616
UCL = 23.35
LCL = 1.99
c = 12.67