iqvia holdings inc....2 iqvia holdings inc. form 10-k table of contents item page part i 1. business...
TRANSCRIPT
UNITED STATES SECURITIES AND EXCHANGE COMMISSION
Washington, D.C. 20549
FORM 10-K
(Mark One) ☒ ANNUAL REPORT PURSUANT TO SECTION 13 OR 15(d) OF THE SECURITIES EXCHANGE ACT OF 1934
For the fiscal year ended December 31, 2018 or
☐ TRANSITION REPORT PURSUANT TO SECTION 13 OR 15(d) OF THE SECURITIES EXCHANGE ACT OF 1934 For the transition period from to .
Commission File Number: 001-35907
IQVIA HOLDINGS INC.
(Exact name of registrant as specified in its charter)
Delaware(State or other jurisdiction of
incorporation or organization)
27-1341991(I.R.S. Employer
Identification Number)
4820 Emperor Blvd., Durham, North Carolina 27703 and
83 Wooster Heights Road, Danbury, Connecticut 06810 (Address of principal executive offices and Zip Code)
(919) 998-2000 and (203) 448-4600 (Registrant’s telephone number, including area code)
Securities registered pursuant to Section 12(b) of the Act:
Title of Each Class:
Name of Each Exchange on which Registered
Common Stock, par value $0.01 per share New York Stock Exchange
Securities registered pursuant to Section 12(g) of the Act: None
Indicate by check mark if the registrant is a well-known seasoned issuer, as defined in Rule 405 of the Securities Act. Yes ☒ No ☐
Indicate by check mark if the registrant is not required to file reports pursuant to Section 13 or section 15(d) of the Exchange Act. Yes ☐ No ☒
Indicate by check mark whether the registrant (1) has filed all reports required to be filed by Section 13 or 15(d) of the Securities Exchange Act of 1934 during the preceding twelve months (or for such shorter period that the registrant was required to file such reports), and (2) has been subject to such filing requirements for the past 90 days. Yes ☒ No ☐
Indicate by check mark whether the registrant has submitted electronically every Interactive Data File required to be submitted pursuant to Rule 405 of Regulation S-T (§232.405 of this chapter) during the preceding 12 months (or for such shorter period that the registrant was required to submit such files). Yes ☒ No ☐
Indicate by check mark if disclosure of delinquent filers pursuant to Item 405 of Regulation S-K is not contained herein, and will not be contained, to the best of registrant’s knowledge, in definitive proxy or information statements incorporated by reference in Part III of this Form 10-K or any amendment to this Form 10-K. ☒
Indicate by check mark whether the registrant is a large accelerated filer, an accelerated filer, a non-accelerated filer, a smaller reporting company, or emerging growth company. See the definitions of “large accelerated filer,” “accelerated filer,” “smaller reporting company,” and “emerging growth company” in Rule 12b-2 of the Exchange Act.
Large accelerated filer ☒ Accelerated filer ☐
Non-accelerated filer ☐ Smaller reporting company ☐
Emerging growth company ☐
If an emerging growth company, indicate by check mark if the registrant has elected not to use the extended transition period for complying with any new or revised financial accounting standards provided pursuant to Section 13(a) of the Exchange Act. ☐
Indicate by check mark whether the registrant is a shell company (as defined in Rule 12b-2 of the Exchange Act). Yes ☐ No ☒
The aggregate market value of the voting and non-voting common stock held by non-affiliates of the registrant, based upon the closing sale price as reported on the New York Stock Exchange on June 29, 2018, the last business day of the registrant’s most recently completed second quarter, was approximately $16.1 billion.
Indicate the number of shares outstanding of each of the issuer’s classes of Common Stock, as of the latest practicable date.
Class
Number of Shares Outstanding
Common Stock $0.01 par value 197,599,861 shares outstanding as of February 12, 2019
Portions of the registrant’s Proxy Statement for the 2019 Annual Meeting of Stockholders are incorporated herein by reference in Part III of this Annual Report on Form 10-K to the extent stated herein. Such proxy statement will be filed with the Securities and Exchange Commission within 120 days of the registrant’s fiscal year ended December 31, 2018.

2
IQVIA HOLDINGS INC.FORM 10-K
TABLE OF CONTENTS Item
Page
PART I 1. Business 51A. Risk Factors 151B. Unresolved Staff Comments 372. Properties 373. Legal Proceedings 374. Mine Safety Disclosures 38
PART II 5. Market for Registrant’s Common Equity, Related Stockholder Matters and Issuer Purchases of Equity Securities 396. Selected Financial Data 427. Management’s Discussion and Analysis of Financial Condition and Results of Operations 447A. Quantitative and Qualitative Disclosures About Market Risk 648. Financial Statements and Supplementary Data 669. Changes in and Disagreements with Accountants on Accounting and Financial Disclosure 1229A. Controls and Procedures 1229B. Other Information 122
PART III 10. Directors, Executive Officers and Corporate Governance 12311. Executive Compensation 12412. Security Ownership of Certain Beneficial Owners and Management and Related Stockholder Matters 12513. Certain Relationships and Related Transactions and Director Independence 12514. Principal Accountant Fees and Services 125
PART IV 15. Exhibits and Financial Statement Schedules 126
Exhibit Index 12716. Form 10-K Summary 131
Signatures 132

3
FORWARD-LOOKING STATEMENTS
Except for any historical information contained herein, the matters discussed or incorporated by reference in this Annual Report on Form 10-K contains forward-looking statements within the meaning of the federal securities laws, including Section 27A of the Securities Act of 1933, as amended (“Securities Act”), and Section 21E of the Securities Exchange Act of 1934, as amended (the “Exchange Act”). Such forward-looking statements reflect, among other things, our current expectations, our forecasts and our anticipated results of operations, all of which are subject to known and unknown risks, uncertainties and other factors that may cause our actual results, performance or achievements, market trends, or industry results to differ materially from those expressed or implied by such forward-looking statements. Therefore, any statements contained herein that are not statements of historical fact may be forward-looking statements and should be evaluated as such. Without limiting the foregoing, the words “anticipates,” “believes,” “estimates,” “expects,” “intends,” “may,” “plans,” “projects,” “should,” “targets,” “will” and the negative thereof and similar words and expressions are intended to identify forward-looking statements. These forward-looking statements are subject to a number of risks, uncertainties and assumptions, including those described in Part I, Item 1A, “Risk Factors.” If one or more of these risks or uncertainties materialize, or if underlying assumptions prove incorrect, our actual results may vary materially from those expected, estimated or projected or as otherwise suggested by the forward-looking statements that we make for a number of reasons. Given these uncertainties, users of the information included or incorporated by reference in this Form 10-K, including investors and prospective investors, are cautioned not to place undue reliance on such forward-looking statements. All forward-looking statements are made only as of the date hereof. We assume no obligation to update any such forward-looking information to reflect actual results or changes in the factors affecting such forward-looking information.
GENERAL
On May 3, 2016, Quintiles Transnational Holdings Inc. (“Quintiles”) and IMS Health Holdings, Inc. (“IMS Health”) entered into an Agreement and Plan of Merger (the “Merger Agreement”). Effective October 3, 2016, pursuant to the Merger Agreement, IMS Health merged with and into Quintiles, with Quintiles continuing as the surviving corporation, and the separate corporate existence of IMS Health ceased (the “Merger”). Quintiles was incorporated under the laws of the State of North Carolina on November 10, 2009, and immediately prior to the completion of the Merger, Quintiles converted to a Delaware corporation and changed its name to QuintilesIMS Holdings, Inc. On November 6, 2017, we changed our name to IQVIA Holdings Inc.
We renamed two of our reportable segments during the second quarter of 2018. The reportable segment formerly known as Commercial Solutions is now named Technology & Analytics Solutions and the reportable segment formerly known as Integrated Engagement Services is now named Contract Sales & Medical Solutions. This is a name change only and there are no changes to the composition of either segment.
When we use the terms “IQVIA,” the “Company,” “we,” “us” or “our” in this Annual Report on Form 10-K, we mean IQVIA Holdings Inc. and its subsidiaries on a consolidated basis, unless we state or the context implies otherwise.

4
INDUSTRY AND MARKET DATA
This annual report on Form 10-K includes market data and forecasts with respect to the healthcare industry. In some cases, we rely on and refer to market data and certain industry forecasts that were obtained from third party surveys, market research, consultant surveys, publicly available information and industry publications and surveys that we believe to be reliable. However, we have not independently verified data from industry analyses and cannot guarantee their accuracy or completeness. We believe that data regarding the industry, market size and its market position and market share within such industry provide general guidance but are inherently imprecise. Other industry and market data included in this annual report are from IQVIA analyses and have been identified accordingly, including, for example, IQVIA Market Prognosis, which is a subscription-based service that provides five-year pharmaceutical market forecasts at the national, regional and global levels. We are a leading global information provider for the healthcare industry and we maintain databases, produce market analyses and deliver information to clients in the ordinary course of our business. Our information is widely referenced in the industry and used by governments, payers, academia, the life sciences industry, the financial community and others. Most of this information is available on a subscription basis. Other reports and information are available publicly through our IQVIA Institute for Healthcare Informatics (the “IQVIA Institute”). All such information is based upon our own market research, internal databases and published reports and has not been verified by any independent sources. Our estimates and assumptions involve risks and uncertainties and are subject to change based on various factors, including those discussed in the “Risk Factors” section. These and other factors could cause results to differ materially from those expressed in the estimates and assumptions.
TRADEMARKS AND SERVICE MARKS
All trademarks, trade names, product names, graphics and logos of IQVIA contained herein are trademarks or registered trademarks of IQVIA Holdings Inc. or its subsidiaries, as applicable, in the United States and/or other countries. All other party trademarks, trade names, product names, graphics and logos contained herein are the property of their respective owners. The use or display of other parties’ trademarks, trade names, product names, graphics or logos is not intended to imply, and should not be construed to imply, a relationship with, or endorsement or sponsorship of IQVIA Inc. or its subsidiaries by such other party.
Solely for convenience, the trademarks, service marks and trade names referred to in this annual report are listed without the ®, (sm) and (TM) symbols, but we will assert, to the fullest extent under applicable law, our rights or the rights of the applicable licensors to these trademarks, service marks and trade names.

5
PART I
Item 1. Business
Our Company
IQVIA is a leading global provider of advanced analytics, technology solutions and contract research services to the life sciences industry. Formed through the Merger of IMS Health and Quintiles, IQVIA applies human data science – leveraging the analytic rigor and clarity of data science to the ever-expanding scope of human science – to enable companies to reimagine and develop new approaches to clinical development and commercialization, speed innovation, and accelerate improvements in healthcare outcomes. Powered by the IQVIA CORE™, we deliver unique and actionable insights at the intersection of large scale analytics, transformative technology and extensive domain expertise as well as execution capabilities to help biotech, medical device, and pharmaceutical companies, medical researchers, government agencies, payers and other healthcare stakeholders tap into a deeper understanding of diseases, human behaviors and scientific advances, in an effort to advance their path toward cures. With more than 58,000 employees, we conduct operations in more than 100 countries.
We have one of the largest and most comprehensive collections of healthcare information in the world, which includes more than 600 million comprehensive, longitudinal, non-identified patient records spanning sales, prescription and promotional data, medical claims, electronic medical records, genomics, and social media. Our scaled and growing data set contains over 30 petabytes of proprietary data sourced from more than 140,000 data suppliers and covering approximately one million data feeds globally. Based on this data, we deliver information and insights on over 85% of the world’s pharmaceuticals, as measured by 2017 sales. We standardize, curate, structure and integrate this data by applying our sophisticated analytics and leveraging our global technology infrastructure. This helps our clients run their organizations more efficiently and make better decisions to improve their clinical, commercial and financial performance. The breadth of the intelligent, actionable information we provide is not comprehensively available from any other source and our scope of information would be difficult and costly for another party to replicate.
We combine our proprietary information assets with advanced analytics, transformative technology and domain expertise to develop clinical and commercial capabilities that enable us to grow our relationships with healthcare stakeholders throughout the life science’s value chain. This set of capabilities includes:
• A leading healthcare-specific global IT infrastructure, representing what we believe is one of the largest and most sophisticated information technology (“IT”) infrastructures in healthcare. We receive over 70 billion healthcare records annually, our infrastructure then connects complex healthcare data while applying a wide range of privacy, security, operational, legal and contractual protections for data in response to local law, supplier requirements and industry leading practices;
• Analytics-driven clinical development, which improves clinical trial design, site identification and patient recruitment by empowering therapeutic, scientific, and domain experts with expansive levels of information, including product level tracking in 90 markets, and information about treatments and outcomes on more than 600 million non-identified patients globally;
• Robust real-world insights ecosystem, with sophisticated retrospective database analytics, prospective real-world data collection technology platforms and scientific expertise, which enables us to address critical healthcare issues of cost, value and patient outcomes;
• A growing set of proprietary clinical and commercial applications, which helps our clients increase their clinical operations performance, supports their regulatory and compliance needs and orchestrates their sales operations, sales management, multi-channel marketing and performance management; and
• A staff of more than 58,000 employees across the globe, including approximately 21,000 Technology & Analytics Solutions employees, approximately 31,000 Research & Development Solutions employees and approximately 6,000 Contract Sales & Medical Solutions employees.
• Integration of information, analytics, technology, and domain expertise through the IQVIA CORE™, which enables us to provide our clients with more effective options to address their needs from Research and Development through commercialization as well as truly innovative breakthroughs such as virtual trials and global real-world evidence networks.

6
Our mission-critical relationships with our life science clients consist of four important decision-making processes related to their product portfolios: Research and Development, Pre-Launch, Launch and In-Market. We continue to develop software and services applications to further deepen our level of client integration by enabling our clients to enhance and/or automate many components of these key decision-making processes.
• Market opportunity assessment
• Drug pricing optimization
• Market access • Commercial operations
• Project management and clinical monitoring
• Launch readiness • Health technology assessment
• Sales force effectiveness
• Clinical trial support services
• Commercial planning • Commercial readiness • Sales force alignment
• Patient recruitment • Brand positioning • Forecasting • Multi-channel marketing
• Clinical trial laboratory services
• Message testing • Resource allocation • Client relationship management
• Strategic clinical trial planning and design
• Influence networks • Contract sales force • Lifecycle management
• Territory design • Observational studies
• Stakeholder engagement
We believe that a powerful component of our value proposition is the breadth and depth of intelligence we provide to help our clients address fundamental operational questions.
User Illustrative Questions
Research & Development Which study sites have the target patients?
Are there enough patients for my clinical trial?
How long will trial enrollment take to hit target patient volumes?
Sales Which providers generate the highest return on representative visit?
Does my sales representative drive appropriate prescribing?
How much should I pay my sales representative next month?
Marketing What share of patients is appropriately treated?
Which underserved patient populations will benefit most from my new drug?
Is my brand gaining market share quickly enough to hit revenue forecasts?
Real-World Evidence/Pharmacovigilance
What is the likely impact of new therapies on costs and outcomes?
Are new therapies performing better against existing standards of care in real-world settings?
Does real-world data indicate adverse events not detected in clinical trials?
7
Our Market Opportunity
We compete in a market of greater than $230 billion consisting of outsourced research and development, real-world evidence and connected health and technology enabled commercial operations markets for life sciences companies and the broader healthcare industry. The following sets forth our estimates for the size of our principal markets:
• Outsourced research and development: Biopharmaceutical spending on drug development totaled over $100 billion in 2018. Of that amount, we estimate that our addressable opportunity (clinical development spending excluding preclinical spending) was approximately $66 billion. The portion of this addressable opportunity that was outsourced in 2018, based on our estimates, was approximately $32 billion;
• Real-World Evidence and connected health: Total addressable market of approximately $80 billion based on 2018 sales that consists of two relatively equal parts. First, the market for Real-World Evidence of approximately $40 billion includes traditionally defined analytic platforms and implementation, medical and scientific analytic services, observation studies and market access. Second, the market for connected healthcare of approximately $40 billion includes areas such as revenue cycle management, payer analytics and clinical decision support services; and
• Technology enabled commercial operations: Total addressable market of approximately $50 billion based on 2018 sales that includes information, data warehousing, IT outsourcing, software applications and other services in the broader market for IT services. This addressable market also includes commercial services such as recruiting, training, deploying and managing global sales forces, channel management, patient engagement services, market access consulting, brand communication, advisory services, and health information analytics and technology consulting.
In deriving estimates of the size of the various markets described above, we review third-party sources, which include estimates and forecasts of spending in various segments, in combination with internal IQVIA research and analysis informed by our experience serving these segments, as well as projected growth rates for each of these segments. See “Industry and Market Data” above.
We believe there are six key trends affecting our end markets that will create increasing demand for research and development services and technology & analytics solutions:
Growth and innovation in the life sciences industry. The life sciences industry is a large and critical part of the global healthcare system, and, according to the latest information available from the IQVIA Market Prognosis service, is estimated to have generated approximately $1.2 trillion in revenue in 2018. According to our research, revenue growth in the life sciences industry globally is expected to range from 3% to 6% between 2019 and 2023. According to the IQVIA Institute, it is estimated that spending on pharmaceuticals in emerging markets will expand at a 5% to 8% compound annual growth rate (“CAGR”) through 2023. The growth of emerging markets is making these geographies strategically important to life sciences organizations and, consistent with their approach in the developed markets, we expect these organizations to apply a high degree of sophistication to their commercial operations in these countries. For global companies, this requires highly localized knowledge and information assets, the development of market access strategies and performance benchmarking. In addition, local players are learning that they need to compete on the basis of improved information and analytics.
Growth in Research and Development. Spending trends in research and development are impacted as a result of several factors, including major biopharmaceutical companies’ efforts to replenish revenues lost from the so-called “patent cliff,” increased access to capital by the small and midcap biotechnology industry, and recent increases in pharmaceutical approvals by regulatory authorities. The IQVIA Institute also estimates that approximately 270 new molecular entities (“NMEs”) are expected to be approved between 2019 and 2023, compared to 230 between 2014 and 2018, and 182 between 2009 and 2013. We believe that further research and development spending, combined with the continued need for cost efficiency across the healthcare landscape, will continue to create opportunities for biopharmaceutical services companies, particularly those with a global reach and broad service offerings, to help biopharmaceutical companies with their pre- and post-launch solutions development and commercialization needs.

8
Increased Complexity in Research and Development. Biopharmaceutical companies face environments in which it has become increasingly difficult to operate. Improved standards of care in many therapeutic areas and the emergence of new types of therapies, such as biologics, genetically targeted therapies, gene and stem cell therapies, and other treatment modalities have led to more complex development and regulatory pathways. For example, the United States and European countries have recently released guidelines for the development of “biosimilar” products. We believe that our global clinical development capabilities, including our expertise in biomarkers and genomics and our global laboratory network, position us well to help biopharmaceutical companies manage the complexities inherent in an environment where this type of expertise is important. For example, the IQVIA CORE™ helps us validate protocols to ensure studies in new disease areas have greater accuracy and also enables us, through innovations such as predictive analytics, to find patients who may not have been diagnosed.
Regulators require clinical trials involving local populations as part of the process for approving new pharmaceutical products, especially in certain Asian and emerging markets. Understanding the epidemiological and physiological differences in different ethnic populations and being able to conduct clinical trials locally in certain geographies will be important to pharmaceutical product growth strategies, both for multinational and local/regional biopharmaceutical companies. We believe that our global clinical development capabilities and unmatched presence in Asia and other emerging markets make us a strong partner for biopharmaceutical companies managing the complexities of international drug development.
Financial pressures driving the need for increased efficiency. Despite expected accelerating growth in the global life sciences market, we believe our clients will face increased operating margin pressure due to their changing product mix, pricing and reimbursement challenges, and rising costs of compliance. Product portfolios for life sciences companies have shifted toward specialty products with lower peak market sales potential than traditional primary care medicines. We believe that the need for biopharmaceutical companies to maximize productivity and lower costs across their processes from research and development through commercial operations will cause them to look to partners as they enter into outsourcing arrangements to improve efficiency. Further, our clients are looking for new ways to simplify processes and drive operational efficiencies by using automation, consolidating vendors and adopting new technology options such as hosted and cloud-based applications. This provides opportunities for technology services vendors to capture and consolidate internal spending by providing lower-cost and variable-cost options that lower clients’ research and development, selling, marketing and administrative costs.
Evolving need to integrate and structure expanding sources of data. Over the past decade, many health systems around the world have focused on digitizing medical records. While such records theoretically enhance access to data, relevant information is often unintegrated, unstructured, siloed in disparate software systems, or entered inconsistently. In addition, new sources of data from the internet, such as social media and information on limited patient pools, and information resulting from enhanced diagnostic technologies are creating new sources of healthcare data.
In order to derive valuable insights from existing and expanding sources of information, clients need access to statistically significant data sets organized into databases that can be queried and analyzed. For example, real-world evidence studies demonstrate practical and clinical efficacies, which we believe require the aggregation and integration of large clinical data sets across all care settings, types of therapies and patient cohorts. Longitudinal studies require analysis of non-identified patient diagnoses, treatments, procedures and laboratory test results to identify types of patients that will likely best respond to particular therapies. Finally, manufacturers also require the ability to analyze social media activity to identify unmet patient needs and support for new orphan drugs. This information is highly relevant to all healthcare stakeholders and we believe the opportunity to more broadly apply healthcare data can only be realized through structuring, organizing and integrating new and existing forms of data in conjunction with sophisticated analytics.
Need for demonstrated value in healthcare. Participants in the healthcare industry are focused on improving quality and reducing costs, both of which require assessment of quality and value of therapies and providers. As a result, physicians no longer make prescribing decisions in isolation, but rather in the context of guidance and rules from payers, integrated delivery networks and governments. We believe life sciences companies are working to bring alignment across constituents on the value of their treatments in order to successfully develop and commercialize new therapies.
There is increasing pressure on life sciences companies to support and justify the value of their therapies. Many new drugs that are being approved are more expensive than existing therapies and will likely receive heightened scrutiny by regulators and payers to determine whether the existing treatment options would be sufficient. Additionally, many new specialty drugs are molecular-based therapies and require a more detailed understanding of clinical factors and influencers that demonstrate therapeutic value. As a result, leading life sciences companies are utilizing more sophisticated outcome research and data analytics services.

9
We believe we are well positioned to take advantage of these global trends in healthcare. Beyond our proprietary information assets, we have developed key capabilities to assess opportunities to develop and commercialize therapies, support and defend the value of medicines and help our clients operate more efficiently through the application of insight-driven decision-making and cost-efficient technology solutions.
Our Growth Strategy
We believe we are well positioned for continued growth across the markets we serve. Our strategy for achieving growth includes:
Continue to innovate by leveraging our information, advanced analytics, transformative technology and significant domain expertise. As a leader in the development and commercialization of new pharmaceutical therapies, we can empower our therapeutic, scientific and domain experts with expansive levels of information including product level tracking in 90 markets and information about treatments and outcomes on more than 600 million non-identified patients. By integrating these capabilities in the IQVIA CORE™, we have the ability to optimize the clinical trial process and enable our clients to reduce costs and get their products to market more quickly by running their clinical trials more efficiently and effectively through more informed site selection and faster patient recruitment practices as well as through new innovations such as synthetic control arms to better leverage existing data to support future treatments and virtual trials to improve patient centricity.
Build upon our extensive client relationships. We have a diversified base of over 8,000 clients in over 100 countries and have expanded our client value proposition to address a broader market for research and development and commercial operations which we estimate to be more than $230 billion in 2018. Through the combined offerings of research and development and commercial services we built a platform that allows us to be a more complete partner to our clients.
Expand portfolio through strategic acquisitions. We have and expect to continue to acquire assets and businesses that strengthen our value proposition to clients. We have developed an internal capability to source, evaluate and integrate acquisitions that have created value for stockholders. As the global healthcare landscape evolves, we expect that there will be a growing number of acquisition opportunities across the life sciences, payer and provider sectors. We expect to continue to invest in or explore opportunities for strategic acquisitions to grow our platform and enhance our ability to provide more services to our clients.
Expand the penetration of our offerings to the broader healthcare marketplace. We believe that substantial opportunities exist to expand penetration of our market and further integrate our offerings in a broader cross-section of the healthcare marketplace, particularly connected healthcare.

10
Our Offerings
We offer hundreds of distinct services, applications, technology platforms and solutions to help our clients make critical decisions and perform better. We have three operating segments: Technology & Analytics Solutions, Research & Development Solutions and Contract Sales & Medical Solutions. Their offerings complement each other and can provide enhanced value to our clients when delivered together, with each driving demand for the other.
Our Technology & Analytics Solutions offerings include:
Technology solutions. We provide an extensive range of cloud-based applications and associated implementation services. Software as a Service (“SaaS”) solutions that support a wide range of clinical and commercial processes, including clinical trial design and planning, site start-up, patient consent, site payments, content management, multi-channel marketing, real-world evidence generation, customer relationship management (“CRM”), performance management, incentive compensation, territory alignment, roster management, call planning, compliance and safety reporting and master data management. These solutions are used by healthcare companies to manage, optimize and execute their clinical and commercial strategies in an orchestrated manner while addressing their regulatory obligations. Using proprietary algorithms, we combine our country-level data, healthcare expertise and therapeutic knowledge in over 100 countries to create our Global Market Insight family of offerings such as MIDAS, Analytics Link and Disease Insights, which provides a leading source of insight into international market dynamics and are used by most large pharmaceutical companies.
Real-World Insights. We help healthcare stakeholders meet their increasing demand for faster insights and evidence by applying digital technology, scientific expertise, and machine learning to ever-expanding rich clinical data. We use proprietary patient privacy and security safeguards to protect non-identified patient-level medical claims, prescriptions, electronic medical records, genomics, and social media data. We help our global customers across payers, providers, governments, and biopharmaceuticals to answer critical questions about healthcare interventions related to safety, efficacy, and value. We also bring together stakeholders across healthcare to collaborate in efforts to develop new information sources, more effective reimbursement models, and better patient outcomes.
Analytics and consulting services. We provide a broad set of strategic and implementation consulting services, including advanced analytics and commercial processes outsourcing services to help the commercial operations of life sciences companies successfully transform their commercial models, engage more effectively with the healthcare stakeholders and reduce their operating costs. We also help our client’s R&D function to address strategic challenges in the drug development process. Our global teams leverage local market knowledge, deep scientific and therapeutic area expertise and our global information resources to assist our clients with R&D strategy, portfolio, brand and commercial strategy, as well as pricing and market access and launch excellence.
National information offerings. Our national offerings comprise unique services in over 90 countries that provide consistent country level performance metrics related to sales of pharmaceutical products, prescribing trends, medical treatment and promotional activity across multiple channels including retail, hospital and mail order. These solutions are an integral part of critical processes in life science companies around the world and are also used extensively by the investment and financial sectors that deal with life science companies.
Sub-national information offerings. Our sub-national offerings comprise unique services in over 70 countries that provide a consistent measurement of sales or prescribing activity at the regional, zip code and individual prescriber level (depending on regulation in the relevant country). These solutions are used extensively, with a majority of pharmaceutical sales organizations within these countries dependent on these services to set goals, determine resourcing, measure performance and calculate compensation.
Reference information offerings. Our widely used reference database that tracks approximately 16 million healthcare professionals in over 100 countries, providing a comprehensive view of health care practitioners that is critical for the commercial success of our clients’ marketing and sales initiatives.

11
Our Research & Development Solutions offerings include:
Project Management and Clinical Monitoring. Drawing upon our years of experience, our site databases, our site relationships and our highly trained staff, our solutions and services enables the efficient conduct and coordination of multi-site clinical trials (generally Phase II-IV). Our service offerings include protocol design, feasibility and operational planning, site start up, patient recruitment and clinical site monitoring. By infusing technology into field-based monitoring, we are able to reduce data collection steps and time.
Clinical Trial Support Services. Each clinical trial requires a number of concurrent services and data streams. We offer a broad range of functional services and consultation to support clinical trials through specialized expertise that help clients efficiently collect, analyze and report the quality data and evidence they need to gain regulatory approval.
Q2 Solutions. We provide our clients globally scaled end-to-end clinical trial laboratory and research services through our majority-owned joint venture with Quest Diagnostics Incorporated (“Quest”), which was formed on July 1, 2015. We offer genomic and bioanalytical laboratory services supporting clinical trials offerings within the joint venture, which is referred to as Q2 Solutions.
Strategic Planning and Design. By bringing our data science capabilities to our strategic planning and design services, we offer consultation services to improve decisions and performance including portfolio, program and protocol planning and design, biomarker consultation, benefit-risk management, regulatory affairs, biostatistics, modeling and simulation, and personalized medicine.
Virtual Trials. Utilizing our proprietary information assets and transformative technology, we bring trials directly to patients, with the objective of increasing participation and improving cycle times. Combining this with purpose-built processes and industry-leading clinical capabilities, we help clients reach diverse and difficult to recruit patient populations.
Our principal Contract Sales & Medical Solutions offerings include:
Health Care Provider Engagement Services. We partner with biopharmaceutical companies and other life sciences providers (e.g., medical device companies) to develop and deploy tailored stakeholder engagement solutions, including contract sales and market access professionals, which are focused on improving brand value at all stages of the product lifecycle from initial market entry to brands nearing patent expiry.
Patient Engagement Services. Our nurse-based programs directly engage with patients to help improve their disease and medication understanding through interventional and non-interventional support, while also providing assistance in navigating complex reimbursement coverage issues. Our patient engagement services combine insight from clinical trials and social listening, behavioral design, personal and innovative eHealth multichannel interactions across multiple sites (e.g., the physician’s office, hospital, pharmacy, home), that act as an extension of the Health Care Provider prescribed treatment course which can lead to improved adherence and better overall outcomes.
Medical Affairs Services. We provide a range of scientific strategy and medical affairs services to help biopharmaceutical companies plan and transition from the clinical trial setting to commercialization. Beginning in the clinical trial stage, our services can deploy educators to clinical trial sites to accelerate patient recruitment and improve retention, assist in translation of complex clinical trial data into a compelling scientific platform and publication strategy, and, provide field medical teams to facilitate scientific engagement with key opinion leaders and healthcare decision makers, before and after product approval.
Our Clients
Sales to companies in life sciences, including pharmaceutical companies, biotechnology companies, device and diagnostic companies, and consumer health companies, accounted for the majority of our revenues. Nearly all of the top 100 global pharmaceutical and biotechnology companies, measured by revenue, are clients, and many of these companies subscribe to reports and services in many countries. Other clients include payers, government and regulatory agencies, providers, pharmaceutical distributors, and pharmacies. Our client base is broad in scope and enables us to avoid dependence on any single client. No single client accounted for 10% or more of our combined company revenues in 2018, 2017 or 2016.
12
Our Competition
Our Technology & Analytics Solutions business competes with a broad and diverse set of businesses. While we believe no competitor provides the combination of geographical reach and breadth of its services, we generally compete in the countries in which we operate with other information, analytics, technology, services and consulting companies, as well as with the in-house capabilities of our clients. Also, we compete with certain government agencies, private payers and other healthcare stakeholders that provide their data directly to others. In addition to country-by-country competition, we have a number of regional and global competitors in the marketplace as well. Our offerings compete with various firms, including Accenture, Cognizant Technology Solutions, Covance Inc. (the drug development business of Laboratory Corporation of America Holdings), Deloitte, Evidera, GfK, LexisNexis Risk Solutions, IBM, Infosys, Kantar Health, McKinsey, Nielsen, OptumInsight, PAREXEL International Corporation, Press Ganey, RTI Health Solutions, Symphony Health Solutions (now part of PRA Health Sciences), Synovate Healthcare, The Advisory Board, Trizetto, Veeva, Verisk, and ZS Associates. We also compete with a broad range of new entrants and start-ups that are looking to bring new technologies and business models to healthcare information services and technology services.
The markets for Research & Development Solutions offerings are highly competitive, and we compete against traditional contract research organizations (“CROs”), the in-house research and development departments of biopharmaceutical companies, universities, and teaching hospitals. Among the traditional CROs, there are several-hundred small, limited-service providers, several medium-sized firms and only a few full-service companies with global capabilities. Our primary competitors include Covance Inc. (the drug development business of Laboratory Corporation of America Holdings), ICON plc, PAREXEL International Corporation, Pharmaceutical Product Development, Inc., PRA Health Sciences, and Syneos Health, among others.
Our Contract Sales & Medical Solutions business competes against the in-house sales and marketing departments of biopharmaceutical companies, other contract pharmaceutical sales and service organizations and consulting firms. Contract Sales & Medical Solutions’ primary competitor in the United States is Syneos Health, Publicis and United Drug plc. Outside of the United States, Contract Sales & Medical Solutions typically competes against single country or more regionally focused service providers, such as United Drug plc, Syneos Health, EPS Corporation and CMIC HOLDINGS Co., Ltd.
Government Regulation
Many aspects of our businesses are regulated by federal and state laws, rules and regulations. Accordingly, we maintain a robust compliance program aimed at ensuring we operate our business in compliance with all existing legal requirements material to the operation of our businesses. There are, however, occasionally uncertainties involving the application of various legal requirements, the violation of which could result in, among other things, fines or other sanctions. See “Part I—Item 1A—Risk Factors” for additional detail.
Good Clinical Practice
Good Clinical Practice (“GCP”) regulations and guidelines are the industry standard for the conduct of clinical trials with respect to maintaining the integrity of the data and safety of the research subjects. The United States Food and Drug Administration (“FDA”), the European Medicines Agency (“EMA”), Japan’s Ministry of Health, Labour and Welfare and most other global regulatory authorities expect that study results and data submitted to such authorities be based on clinical trials conducted in accordance with GCP provisions. Records for clinical trials must be maintained for specified periods for inspection by the FDA and other regulators.
Regulation of Drugs, Biologics and Medical Devices
In the United States, pharmaceutical, biological and medical device products are subject to extensive regulation by the FDA. The Federal Food, Drug, and Cosmetic Act (“FDC Act”), the Public Health Service Act (“PHS Act”), and other federal and state statutes and regulations, govern, among other things, the research, development, testing, manufacture, storage, recordkeeping, approval, labeling, promotion and marketing, distribution, post-approval monitoring and reporting, sampling, and import and export of pharmaceutical, biological and medical device products. Failure to comply with applicable United States requirements may subject a company to a variety of administrative or judicial sanctions, such as FDA refusal to approve a pending new drug application (“NDA”) for a new drug, a biologics license application (“BLA”) for a new biological product pre-market approval (“PMA”) or clearance for a new medical device, warning or untitled letters, clinical holds, product recalls, product seizures, total or partial suspension of production or distribution, injunctions, fines, civil penalties, and criminal prosecution.

13
Regulation of Patient Information
Our information management services relate to the processing of information regarding patient diagnosis and treatment of disease and are, therefore, subject to substantial governmental regulation. In addition, the confidentiality of patient-specific information and the circumstances under which such patient-specific records may be released for inclusion in our databases or used in other aspects of our business is heavily regulated. Federal, state and foreign governments are contemplating or have proposed or adopted additional legislation governing the possession, use and dissemination of personal data, such as personal health information and personal financial data, as well as security breach notification rules for loss or theft of such data. Additional legislation or regulation of this type might, among other things, require us to implement additional security measures and processes or bring within the legislation or regulation de-identified health or other data, each of which may require substantial expenditures or limit our ability to offer some of our services.
In particular, personal health information is recognized in many countries such as the United States, the European Union, or EU, and several countries in Asia, as a special, sensitive category of personal information, subject to additional mandatory protections. Violations of data protection regulations are subject to administrative penalties, civil money penalties and criminal prosecution, including corporate fines and personal liability.
Regulation of Promotion, Marketing and Distribution of Pharmaceutical Products and Medical Devices
Certain of our services are subject to detailed and comprehensive regulation in each geographic market in which we operate. Such regulation relates, among other things, to the distribution of drug samples, the marketing and promotion of approved products, the qualifications of sales representatives and the use of healthcare professionals in sales functions.
In the United States, certain of our services are subject to numerous federal and state laws pertaining to promotional activities involving pharmaceutical products and medical devices. Certain of our services are subject to the FDA’s regulations against “off-label promotion,” which require sales representatives to restrict promotion of the approved product they are detailing to the approved labeling for the product. The Prescription Drug Marketing Act imposes licensing, personnel record keeping, packaging, labeling, product handling and facility storage and security requirements. Other federal and state laws prohibit manufacturers, suppliers and providers from offering, giving or receiving kickbacks or other remuneration in connection with ordering or recommending the purchase or rental of healthcare items and services. The sale or distribution of pharmaceutical products and devices is also governed by the United States Federal Trade Commission Act and state consumer protection laws. We are subject to similar regulations currently in effect in the other countries where we offer Contract Sales & Medical Solutions.
We are also subject to various laws and regulations that may apply to certain drug and device promotional practices, including, among others, various aspects of Medicare and federal healthcare programs. Violations of these laws and regulations may result in criminal and/or civil penalties, including possibly as an “aider and abettor.”
Regulation of Laboratories
Our United States “central” laboratories are subject to licensing and regulation under federal, state and local laws relating to hazard communication and employee right-to-know regulations, and the safety and health of laboratory employees. Additionally, our United States laboratories are subject to applicable federal and state laws and regulations and licensing requirements relating to the handling, storage and disposal of hazardous waste, radioactive materials and laboratory specimens, including the regulations of the Environmental Protection Agency, the Nuclear Regulatory Commission, the Department of Transportation, the National Fire Protection Agency and the United States Drug Enforcement Administration (“DEA”). The use of controlled substances in testing for drugs with a potential for abuse is regulated in the United States by the DEA and by similar regulatory bodies in other parts of the world. Our United States laboratories using controlled substances for testing purposes are licensed by the DEA. The regulations of the United States Department of Transportation, Public Health Service and Postal Service apply to the surface and air transportation of laboratory specimens. Our laboratories also are subject to International Air Transport Association regulations, which govern international shipments of laboratory specimens. Furthermore, when the materials are sent to a foreign country, the transportation of such materials becomes subject to the laws, rules and regulations of such foreign country. Our laboratories outside the United States are subject to applicable national laws governing matters such as licensing, the handling and disposal of medical specimens, genetic material, hazardous waste and radioactive materials, as well as the health and safety of laboratory employees.
In addition to its comprehensive regulation of safety in the workplace, the United States Occupational Safety and Health Administration has established extensive requirements relating to workplace safety for healthcare employers whose workers may be exposed to blood-borne pathogens such as HIV and the hepatitis B virus. Although we believe that we are currently in compliance in all material respects with such federal, state and local laws, failure to comply with such laws could subject us to denial of the right to conduct business, fines, criminal penalties and other enforcement actions.

14
Further, laboratories that analyze human blood or other biological samples for the diagnosis and treatment of clinical trial subjects must comply with Clinical Laboratory Improvement Amendments (“CLIA”), as well as requirements established by various states. The failure to meet these requirements may result in civil penalties and suspension or revocation of the CLIA certification.
Our Intellectual Property
In addition to our proprietary data sets described above, we develop and use a number of proprietary methodologies, analytics, systems, technologies and other intellectual property in the conduct of our business. We rely upon a combination of legal, technical, and administrative safeguards to protect our proprietary and confidential information and trade secrets, and patent, copyright and trademark laws to protect other intellectual property rights. We consider our trademark and related names, marks and logos to be of material importance to our business, and we have registered or applied for registration for certain of these trademarks including IQVIA, in the United States and other jurisdictions and aggressively seek to protect them. Trademarks and service marks generally may be renewed indefinitely so long as they are in use and/or their registrations are properly maintained, and so long as they have not been found to have become generic. The technology and other intellectual property rights owned and licensed by us are of importance to our business, although our management believes that our business, as a whole, is not dependent upon any one intellectual property or group of such properties.
Our Employees
As of December 31, 2018, we have more than 58,000 employees worldwide. Almost all of these employees are full-time. None of our employees are covered by a collective bargaining agreement or are represented by a labor union. Employees in certain locations outside of the United States are represented by works councils as required by local laws.
Available Information
Our website address is www.iqvia.com, and our investor relations website is located at http://ir.iqvia.com. Information on our website is not incorporated by reference herein. Copies of our annual reports on Form 10-K, quarterly reports on Form 10-Q, current reports on Form 8-K and our Proxy Statements for our annual meetings of stockholders, and any amendments to those reports, as well as Section 16 reports filed by our insiders, are available free of charge on our website as soon as reasonably practicable after we file the reports with, or furnish the reports to, the Securities and Exchange Commission (“SEC”). In addition, the SEC maintains an Internet site (http://www.sec.gov) containing reports, proxy and information statements, and other information regarding issuers that file electronically with the SEC. Information on the SEC’s website does not constitute part of this report. Also posted on our website are our certificate of incorporation and by-laws, the charters for our Audit Committee, Leadership Development and Compensation Committee and Nominating and Governance Committee, our Corporate Governance Guidelines, and our Code of Conduct governing our directors, officers and employees. Copies of our SEC reports and corporate governance information are available in print upon the request of any stockholder to our Investor Relations Department. Within the time period required by the SEC and the New York Stock Exchange (“NYSE”), we will post on our website any amendment to the Code of Conduct or any waiver of such policy applicable to any of our senior financial officers, executive officers or directors.

15
Item 1A. Risk Factors
RISK FACTORS
We operate in a rapidly changing environment that involves a number of risks, some of which are beyond our control. You should consider carefully the risks and uncertainties described below together with the other information included in this Annual Report on Form 10-K, including our consolidated financial statements and related notes included elsewhere in this Annual Report on Form 10-K, in evaluating our company. The occurrence of any of the following risks may materially and adversely affect our business, financial condition, results of operations and future prospects.
Risks Relating to Our Business
The potential loss or delay of our large contracts or of multiple contracts could adversely affect our results.
Most of our Research & Development Solutions clients can terminate our contracts upon 30 to 90 days notice. Our clients may delay, terminate or reduce the scope of our contracts for a variety of reasons beyond our control, including but not limited to:
• decisions to forego or terminate a particular clinical trial;
• lack of available financing, budgetary limits or changing priorities;
• actions by regulatory authorities;
• production problems resulting in shortages of the drug being tested;
• failure of products being tested to satisfy safety requirements or efficacy criteria;
• unexpected or undesired clinical results for products;
• insufficient patient enrollment in a clinical trial;
• insufficient investigator recruitment;
• shift of business to a competitor or internal resources;
• product withdrawal following market launch; or
• shut down of manufacturing facilities.
As a result, contract terminations, delays and alterations are a regular part of our Research & Development Solutions business. In the event of termination, our contracts often provide for fees for winding down the project, but these fees may not be sufficient for us to maintain our margins, and termination may result in lower resource utilization rates. In addition, we will not realize the full benefits of our backlog of contractually committed services if our clients cancel, delay or reduce their commitments under our contracts with them, which may occur if, among other things, a client decides to shift its business to a competitor or revoke our status as a preferred provider. Thus, the loss or delay of a large contract or the loss or delay of multiple contracts could adversely affect our revenues and profitability. We believe the risk of loss or delay of multiple contracts potentially has greater effect where we are party to broader partnering arrangements with global biopharmaceutical companies.

16
We depend on third parties for data and support services. Our suppliers or providers might restrict our use of or refuse to license data or provide services, which could lead to our inability to access certain data or provide certain services and, as a result, materially and adversely affect our operating results and financial condition.
Each of our Technology & Analytics Solutions information services is derived from data we collect from third parties. These data suppliers are numerous and diverse, reflecting the broad scope of information that we collect and use in our business.
Although we typically enter into long-term contractual arrangements with many of these suppliers of data, at the time of entry into a new contract or renewal of an existing contract, suppliers may increase restrictions on our use of such data, increase the price they charge us for data or refuse altogether to license the data to us. In addition, during the term of any data supply contract, suppliers may fail to adhere to our data quality control standards or fail to deliver data. Further, although no single individual data supplier is material to our business, if a number of suppliers collectively representing a significant amount of data that we use for one or more of our services were to impose additional contractual restrictions on our use of or access to data, fail to adhere to our quality-control standards, repeatedly fail to deliver data or refuse to provide data, now or in the future, our ability to provide those services to our clients could be materially adversely impacted, which may harm our operating results and financial condition.
Additionally, we depend on third parties for support services to our business. Such support services include, but are not limited to, third-party transportation providers, suppliers of drugs for patients participating in clinical trials, suppliers of kits for use in our clinical trial laboratories business, suppliers of reagents for use in our testing equipment and providers of maintenance contracts for our equipment. The failure of any of these third parties to adequately provide the critical support services could have a material adverse effect on our business.
If we fail to perform our services in accordance with contractual requirements, regulatory standards and ethical considerations, we could be subject to significant costs or liability and our reputation could be harmed.
We contract with biopharmaceutical companies to perform a wide range of services to assist them in bringing new drugs to market. Our services include monitoring clinical trials, data and laboratory analysis, electronic data capture, patient recruitment and other related services, and we perform these services in a number of ways, including through physical and technology-enabled efforts. Such services are complex and subject to contractual requirements, regulatory standards and ethical considerations. For example, we must adhere to regulatory requirements such as the FDA and current GCP and Good Laboratory Practice requirements. If we fail to perform our services in accordance with these requirements, regulatory agencies may take action against us for failure to comply with applicable regulations governing clinical trials or sales and marketing practices. Such actions may include sanctions, such as injunctions or failure of such regulatory authorities to grant marketing approval of products, delay, suspension or withdrawal of approvals, license revocation, product seizures or recalls, operational restrictions, civil or criminal penalties or prosecutions, damages or fines. Clients may also bring claims against us for breach of our contractual obligations and patients in the clinical trials and patients taking drugs approved on the basis of those clinical trials may bring personal injury claims against us for negligence. Any such action could have a material adverse effect on our results of operations, financial condition and reputation.
Such consequences could arise if, among other things, the following occur:
Improper performance of our services. The performance of clinical development services is complex and time-consuming. For example, we may make mistakes in conducting a clinical trial that could negatively impact or obviate the usefulness of the clinical trial or cause the results of the clinical trial to be reported improperly. If the clinical trial results are compromised, we could be subject to significant costs or liability, which could have an adverse impact on our ability to perform our services. As examples:
• non-compliance generally could result in the termination of ongoing clinical trials or sales and marketing projects or the disqualification of data for submission to regulatory authorities;
• compromise of data from a particular clinical trial, such as failure to verify that informed consent was obtained from patients, could require us to repeat the clinical trial under the terms of our contract at no further cost to our client, but at a substantial cost to us; and
• breach of a contractual term could result in liability for damages or termination of the contract.
Large clinical trials can cost up to hundreds of millions of dollars, and while we endeavor to contractually limit our exposure to such risks, improper performance of our services could have an adverse effect on our financial condition, damage our reputation and result in the cancellation of current contracts by or failure to obtain future contracts from the affected client or other clients.

17
Investigation of clients. From time to time, one or more of our clients are audited or investigated by regulatory authorities or enforcement agencies with respect to regulatory compliance of their clinical trials, programs or the marketing and sale of their drugs. In these situations, we have often provided services to our clients with respect to the clinical trials, programs or activities being audited or investigated, and we are called upon to respond to requests for information by the authorities and agencies. There is a risk that either our clients or regulatory authorities could claim that we performed our services improperly or that we are responsible for clinical trial or program compliance. If our clients or regulatory authorities make such claims against us and prove them, we could be subject to damages, fines or penalties. In addition, negative publicity regarding regulatory compliance of our clients’ clinical trials, programs or drugs could have an adverse effect on our business and reputation.
Insufficient client funding to complete a clinical trial. As noted above, clinical trials can cost hundreds of millions of dollars. There is a risk that we may initiate a clinical trial for a client, and then the client becomes unwilling or unable to fund the completion of the clinical trial. In such a situation, notwithstanding the client’s ability or willingness to pay for or otherwise facilitate the completion of the clinical trial, we may be ethically bound to complete or wind down the clinical trial at our own expense.
Security breaches and unauthorized use of our IT systems and information, or the IT systems or information in the possession of our vendors, could expose us, our clients, our data suppliers or others to risk of loss.
We rely upon the security of our computer and communications systems infrastructure to protect us from cyberattacks and unauthorized access. Cyberattacks can include malware, computer viruses, hacking or other significant disruption of our computer, communications and related systems. Cyber threats are rapidly evolving and are becoming increasingly sophisticated. Despite our efforts to ensure the integrity of our systems, as cyber threats evolve and become more difficult to detect and successfully defend against, one or more cyber threats might defeat the measures that we or our vendors take to anticipate, detect, avoid or mitigate such threats. Certain techniques used to obtain unauthorized access, introduce malicious software, disable or degrade service, or sabotage systems may be designed to remain dormant until a triggering event and we may be unable to anticipate these techniques or implement adequate preventative measures since techniques change frequently or are not recognized until launched, and because cyberattacks can originate from a wide variety of sources. Although we take steps to manage and avoid these risks and to prevent their recurrence, our preventive and remedial actions may not be successful. Such attacks, whether successful or unsuccessful, could result in our incurring costs related to, for example, rebuilding internal systems, defending against litigation, responding to regulatory inquiries or actions, paying damages or fines, or taking other remedial steps with respect to third parties. Publicity about vulnerabilities and attempted or successful incursions could damage our reputation with clients and data suppliers and reduce demand for our services.
We also store proprietary and sensitive information in connection with our business, which could be compromised by a cyberattack. To the extent that any disruption or security breach results in a loss or damage to our data, an inappropriate disclosure of proprietary or sensitive information, an inability to access data sources, or an inability to process data or provide our offerings to our clients, it could cause significant damage to our reputation, affect our relationships with our data suppliers and clients (including loss of suppliers and clients), lead to claims against us and ultimately harm our business. We may be required to incur significant costs to alleviate, remedy or protect against damage caused by these disruptions or security breaches in the future. We may also face inquiry or increased scrutiny from government agencies as a result of any such disruption or breach. While we have insurance coverage for certain instances of a cyber security breach, our coverage may not be sufficient if we suffer a significant attack or multiple attacks. Any such breach or disruption could have a material adverse effect on our operating results and our reputation as a provider of mission-critical services.
Some of our vendors have significant responsibility for the security of certain of our data centers and computer-based platforms. Also, our data suppliers have responsibility for security of their own computer and communications environments. These third parties face risks relating to cyber security similar to ours, which could disrupt their businesses and therefore materially impact ours. Accordingly, we are subject to any flaw in or breaches to their computer and communications systems or those that they operate for us, which could result in a material adverse effect on our business, operations and financial results.
Failure to meet productivity objectives under our internal business transformation initiatives could adversely impact our competitiveness and harm our operating results.
We are pursuing business transformation initiatives to update technology, increase innovation and obtain operating efficiencies. As part of these initiatives, we seek to improve our productivity, flexibility, quality, functionality and cost savings by investing in the development and implementation of global platforms and integration of our business processes and functions to achieve economies of scale. For example, we are evaluating our site activation processes and procedures, including technology enablement platforms, and implementing changes to accelerate site start-up timelines and provide greater transparency to clients and investigator sites. These various initiatives may not yield their intended gains, or be completed in timely manner, which may impact our competitiveness and our ability to meet our growth objectives and, as a result, materially and adversely affect our business, operating results and financial condition.

18
If we are unsuccessful at investing in growth opportunities, our business could be materially and adversely affected.
We continue to invest significantly in growth opportunities, including the development and acquisition of new data, technologies and services to meet our clients’ needs. For example, we are expanding our services and technology offerings, such as the development of a cloud-based platform with a growing number of applications to support commercial operations for life sciences companies (e.g., multi-channel marketing, marketing campaign management, customer relationship management, incentive compensation management, targeting and segmentation, performance management and other applications). We also continue to invest significantly in growth opportunities in emerging markets, such as the development, launch and enhancement of services in China, India, Russia, Turkey, and other countries. We believe healthcare spending in these emerging markets will continue to grow over the next five years, and we consider our presence in these markets to be an important focus of our growth strategy.
There is no assurance that our investment plans or growth strategy will be successful or will produce a sufficient or any return on our investments. Further, if we are unable to develop new technologies and services, clients do not purchase our new technologies and services, our new technologies and services do not work as intended or there are delays in the availability or adoption of our new technologies and services, then we may not be able to grow our business or growth may occur slower than anticipated. Additionally, although we expect continued growth in healthcare spending in emerging markets, such spending may occur more slowly or not at all, and we may not benefit from our investments in these markets.
We plan to fund growth opportunities with cash from operations or from future financings. There can be no assurance that those sources will be available in sufficient amounts to fund future growth opportunities when needed.
Any of the foregoing could have a material and adverse effect on our operating results and financial condition.
Data protection, privacy and similar laws in the United States and around the world restrict access, use and disclosure of personal information, and failure to comply with or adapt to changes in these laws could materially and adversely harm our business.
The confidentiality, collection, use and disclosure of personal data, including individually identifiable health information and clinical trial patient-specific information, are subject to governmental regulation generally in the country that the personal data were collected or used. For example, United States federal regulations under the Health Insurance Portability and Accountability Act of 1996 (“HIPAA”) create specific requirements for the protection of the privacy and security of individual health information. These provisions apply to both “covered entities” (primarily health care providers and health insurers) and their “business associates” or service providers. As there are some instances where we are a HIPAA “business associate” of a “covered entity,” we can be directly liable for mishandling protected health information. Under HIPAA’s enforcement scheme, we can be subject to significant penalties in connection with HIPAA violations, along with the potential for significant other expenditures related to these activities. These rules require individuals’ written authorization in many situations, in addition to any required informed consent, before protected health information may be used for research. We are both directly and indirectly affected by the privacy provisions surrounding individual authorizations because many investigators with whom we are involved in clinical trials are directly subject to them as a HIPAA “covered entity” and because we obtain identifiable health information from third parties that are subject to such regulations. The laws and regulations related to the protection of personal health information in connection with research activities are under re-evaluation, particularly in the United States, and changes to these regulations could have a material adverse impact on our ability to provide some of our services in their current form or maintain our profitability. In general, patient health information is among the most sensitive (and highly regulated) of personal information and laws and regulations around the United States and the world are designed to ensure that information about an individual’s healthcare is properly protected from inappropriate access, use and disclosure. Laws restricting access, use and disclosure of patient health information also include the European Union’s (“EU”) General Data Protection Regulation, Canada’s Personal Information Protection and Electronic Documents Act and other data protection, privacy, data security and similar national, state/provincial and local laws. In the EU personal data includes any information that relates to an identified or identifiable natural person with health information carrying additional obligations, including obtaining the explicit consent from the individual for collection, use or disclosure of the information. In addition, we are subject to EU rules with respect to cross-border transfers of such data out of the EU (along with similar data transfer requirements in other countries). The United States, the EU and its member states, and other countries where we have operations, such as China, Japan, Malaysia, Philippines, Russia, South Korea and Singapore, continue to issue new privacy and data protection rules and regulations that relate to personal data and health information.

19
We have established frameworks, models, processes and technologies to manage privacy and security for many data types, from a variety of sources, and under myriad privacy and data protection laws worldwide. In addition, we rely on our data suppliers to deliver information to us in a form and in a manner that complies with applicable privacy and data protection laws. These laws are complex and there is no assurance that the safeguards and controls employed by us or our data suppliers will be sufficient to prevent a breach of these laws, or that claims will not be filed against us or our data suppliers despite such safeguards and controls. Failure to comply with such laws, certain certification/registration and annual re-certification/registration provisions associated with these data protection and privacy regulations, and similar rules in various jurisdictions, or to resolve any serious privacy complaints, may result in, among other things, regulatory sanctions, criminal prosecution, civil liability, negative publicity, damage to our reputation, or data being blocked from use or liability under contractual provisions. For example, in July 2015, indictments were issued by the Seoul Central District Prosecutors’ Office in South Korea against IMS Korea and two of its employees, among others, alleging improper handling of sensitive health information in violation of applicable privacy laws. See Item 3 “Legal Proceedings” for additional information.
Laws and expectations relating to privacy continue to evolve, and we continue to adapt to changing needs. For example, the definition of “personally identifiable information” and “personal data” continues to evolve and broaden and many new laws and regulations are being enacted. In addition, certain long-established programs have been (or are at risk of being) declared invalid (such as the EU-U.S. Safe Harbor framework that operated for many years but was struck down by European courts in 2015), so that this area remains in a state of flux. Changes to these programs may adversely impact our ability to provide services to our clients or develop new products or services. Federal, state and foreign governments are contemplating or have proposed or adopted additional legislation governing the collection, possession, use or dissemination of personal data, such as personal health information, and personal financial data as well as security breach notification rules for loss or theft of such data. Additional legislation or regulation of this type might, among other things, require us to implement new security measures and processes or bring within the legislation other personal data not currently regulated, each of which may require substantial expenditures or limit our ability to offer some of our services. Additionally, changes in these laws (including newly released interpretations of these laws by courts and regulatory bodies) may limit our data access, use and disclosure, and may require increased expenditures by us or may dictate that we not offer certain types of services. Any of the foregoing may have a material adverse impact on our ability to provide services to our clients or maintain our profitability.
There is ongoing concern from privacy advocates, regulators and others regarding data protection and privacy issues, and the number of jurisdictions with data protection and privacy laws has been increasing. Also, there are ongoing public policy discussions regarding whether the standards for de-identified, anonymous or pseudonymized health information are sufficient, and the risk of re-identification sufficiently small, to adequately protect patient privacy. These discussions may lead to further restrictions on the use of such information. There can be no assurance that these initiatives or future initiatives will not adversely affect our ability to access and use data or to develop or market current or future services.
Data protection, privacy and similar laws protect more than patient information, and although they vary by jurisdiction, these laws can extend to employee information, business contact information, provider information and other information relating to identifiable individuals. Failure to comply with these laws may result in, among other things, civil and criminal liability, negative publicity, damage to our reputation and liability under contractual provisions. In addition, compliance with such laws may require increased costs to us or may dictate that we not offer certain types of services.
The occurrence of any of the foregoing could impact our ability to provide the same level of service to our clients, require us to modify our offerings or increase our costs, which could materially and adversely affect our operating results and financial condition.
Our success depends on our ability to protect our intellectual property rights.
Our success depends, in part, upon our ability to develop, use and protect our proprietary methodologies, analytics, systems, technologies and other intellectual property. Existing laws of the various countries in which we provide services or solutions offer only limited protection of our intellectual property rights, and the protection in some countries may be very limited. We rely upon a combination of trade secrets, confidentiality policies, nondisclosure, invention assignment and other contractual arrangements, and patent, copyright and trademark laws, to protect our intellectual property rights. These laws are subject to change at any time and certain agreements may not be fully enforceable, which could further restrict our ability to protect our innovations. Our intellectual property rights may not prevent competitors from independently developing services similar to or duplicative of ours. Further, the steps we take in this regard might not be adequate to prevent or deter infringement or other misappropriation of our intellectual property by competitors, former employees or other third parties, and we might not be able to detect unauthorized use of, or take appropriate and timely steps to enforce, our intellectual property rights.

20
Our ability to obtain, protect and enforce our intellectual property rights is subject to general litigation or third-party opposition risks, as well as the uncertainty as to the scope of protection, registrability, patentability, validity and enforceability of our intellectual property rights in each applicable country. Governments may adopt regulations, and government agencies or courts may render decisions, requiring compulsory licensing of intellectual property rights. When we seek to enforce our intellectual property rights we may be subject to claims that the intellectual property rights are invalid or unenforceable. Litigation may be necessary in the future to enforce our intellectual property rights and to protect our confidential and proprietary information. Litigation brought to protect and enforce our intellectual property rights could be costly, time consuming and distracting to management and could result in the impairment or loss of portions of our intellectual property rights. Furthermore, our efforts to enforce our intellectual property rights may be met with defenses, counterclaims and countersuits attacking the validity and enforceability of our intellectual property rights. Our inability to protect our proprietary technology against unauthorized copying or use, as well as any costly litigation or diversion of our management’s attention and resources, could delay further sales or the implementation of our solutions, impair the functionality of our solutions, delay introductions of new solutions, result in our substituting inferior or more costly technologies into our solutions, or injure our reputation and harm our operating results and financial condition.
The theft or unauthorized use or publication of our trade secrets and other confidential business information could reduce the differentiation of our services and harm our business; the value of our investment in development or business acquisitions could be reduced; and third parties might make claims against us related to losses of their confidential or proprietary information. In addition, we may not be able to discover or determine the extent of any unauthorized use of our proprietary rights. Third parties that license our proprietary rights also may take actions that diminish the value of our proprietary rights or reputation. The protection of our intellectual property may require the expenditure of significant financial and managerial resources. Moreover, the steps we take to protect our intellectual property may not adequately protect our rights or prevent third parties from infringing or misappropriating our proprietary rights. These incidents and claims could harm our business, reduce revenue, increase expenses and harm our reputation.
We may be subject to claims by others that we are infringing on their intellectual property rights.
Third parties may assert claims that we or our clients infringe their intellectual property rights and these claims, with or without merit, could be expensive to litigate, cause us to incur substantial costs and divert management resources and attention in defending the claim. In some jurisdictions, plaintiffs can also seek injunctive relief that may limit the operation of our business or prevent the marketing and selling of our services that infringe on the plaintiff’s intellectual property rights. To resolve these claims, we may enter into licensing agreements with restrictive terms or significant fees, stop selling, be required to implement costly redesigns to the affected services, or pay damages to satisfy contractual obligations to others. If we do not resolve these claims in advance of a trial, there is no guarantee that we will be successful in court. These outcomes may have a material adverse impact on our business, operating results and financial condition.
In addition, certain contracts with our suppliers or clients contain provisions whereby we indemnify, subject to certain limitations, the counterparty for damages suffered as a result of claims related to intellectual property infringement and the use of data. Claims made under these provisions could be expensive to litigate and could result in significant payments.
We rely on licenses from third parties to certain technology and intellectual property rights for some of our services and the licenses we currently have could terminate or expire.
Some of our business services rely on technology or intellectual property rights owned and controlled by others. Our licenses to this technology or these intellectual property rights could be terminated or could expire. We may be unable to replace these licenses in a timely manner. Failure to renew these licenses, or renewals of these licenses on less advantageous terms, could harm our operating results and financial condition.
Our financial results may be adversely affected if we underprice our contracts, overrun our cost estimates or fail to receive approval for or experience delays in documenting change orders.
Most of our Research & Development Solutions contracts are either fee for service contracts or fixed-fee contracts. Our past financial results have been, and our future financial results may be, adversely impacted if we initially underprice our contracts or otherwise overrun our cost estimates and are unable to successfully negotiate a change order. Change orders typically occur when the scope of work we perform needs to be modified from that originally contemplated by our contract with the client. Modifications can occur, for example, when there is a change in a key clinical trial assumption or parameter or a significant change in timing. Where we are not successful in converting out-of-scope work into change orders under our current contracts, we bear the cost of the additional work. Such underpricing, significant cost overruns or delay in documentation of change orders could have a material adverse effect on our business, results of operations, financial condition or cash flows.

21
The relationship of backlog to revenues varies over time.
Backlog represents future revenues for our Research & Development Solutions business from work not yet completed or performed under signed binding commitments and signed contracts. Once work begins on a project, revenue is recognized over the duration of the project. Projects may be terminated or delayed by the client or delayed by regulatory authorities for reasons beyond our control. To the extent projects are delayed, the timing of our revenue could be affected. In the event that a client cancels a contract, we typically would be entitled to receive payment for all services performed up to the cancellation date and subsequent client-authorized services related to terminating the canceled project. Typically, however, we have no contractual right to the full amount of the revenue reflected in our backlog in the event of a contract cancellation. The duration of the projects included in our backlog, and the related revenue recognition, range from a few weeks to many years. Our backlog may not be indicative of our future revenues from our Research & Development Solutions business, and we may not realize all the anticipated future revenue reflected in our backlog. A number of factors may affect backlog, including:
• the size, complexity and duration of the projects;
• the percentage of full services versus functional services;
• the cancellation or delay of projects; and
• change in the scope of work during the course of a project.
Although an increase in backlog will generally result in an increase in revenues to be recognized over time (depending on the level of cancellations), an increase in backlog at a particular point in time does not necessarily correspond directly to an increase in revenues during a particular period. The extent to which contracts in backlog will result in revenue depends on many factors, including but not limited to delivery against projected schedules, the need for scope changes (change orders), contract cancellations and the nature, duration, size, complexity and phase of the contracts, each of which factors can vary significantly from time to time.
The rate at which our backlog converts to revenue may vary over time for a variety of reasons. The revenue recognition on larger, more global projects could be slower than on smaller, less global projects for a variety of reasons, including but not limited to an extended period of negotiation between the time the project is awarded to us and the actual execution of the contract, as well as an increased timeframe for obtaining the necessary regulatory approvals. Additionally, the increased complexity of clinical trials and the need to enroll precise patient populations could extend the length of clinical trials causing revenue to be recognized over a longer period of time. Further, delayed projects will remain in backlog, unless otherwise canceled by the client, and will not generate revenue at the rate originally expected. Thus, the relationship of backlog to realized revenues may vary over time.
Our business depends on the continued effectiveness and availability of our information systems, including the information systems we use to provide our services to our clients, and failures of these systems may materially limit our operations.
Due to the global nature of our business and our reliance on information systems to provide our services, we intend to increase our use of web-enabled and other integrated information systems in delivering our services. We also provide access to similar information systems to certain of our clients in connection with the services we provide them. As the breadth and complexity of our information systems continue to grow, we will increasingly be exposed to the risks inherent in the development, integration and ongoing operation of evolving information systems, including:
• disruption, impairment or failure of data centers, telecommunications facilities or other key infrastructure platforms;
• security breaches of, cyberattacks on and other failures or malfunctions in our critical application systems or their associated hardware; and
• excessive costs, excessive delays or other deficiencies in systems development and deployment.

22
The materialization of any of these risks may impede the processing of data, the delivery of databases and services, and the day-to-day management of our business and could result in the corruption, loss or unauthorized disclosure of proprietary, confidential or other data. While we have disaster recovery plans in place, they might not adequately protect us in the event of a system failure. While many of our operations have disaster recovery plans in place, we currently do not have excess or standby computer processing or network capacity everywhere in the world to avoid disruption in the receipt, processing and delivery of data in the event of a system failure. Despite any precautions we take, damage from fire, floods, hurricanes, power loss, telecommunications failures, computer viruses, break-ins and similar events at our various computer facilities could result in interruptions in the flow of data to our servers and from our servers to our clients. Corruption or loss of data may result in the need to repeat a clinical trial at no cost to the client, but at significant cost to us, the termination of a contract or damage to our reputation.
In addition, any failure by our computer environment to provide sufficient processing or network capacity to transfer data could result in interruptions in our service. In the event of a delay in the delivery of data, we could be required to transfer our data collection operations to an alternative provider of server hosting services. Such a transfer could result in significant delays in our ability to deliver services to our clients and increase our costs. Additionally, significant delays in system enhancements or inadequate performance of new or upgraded systems once completed could damage our reputation and harm our business. Finally, long-term disruptions in the infrastructure caused by events such as natural disasters, the outbreak of war, the escalation of hostilities and acts of terrorism, particularly involving cities in which we have offices, could adversely affect our businesses. Although we carry property and business interruption insurance, our coverage might not be adequate to compensate us for all losses that may occur.
We have continued to undertake significant programs to optimize business processes with respect to our services. Our inability to effectively manage the implementation and adapt to new processes designed into new or upgraded systems in a timely and cost-effective manner may result in disruption to our business and negatively affect our operations.
We have entered into agreements with certain vendors to provide systems development and integration services that develop or license to us the IT platform for programs to optimize our business processes. If such vendors fail to perform as required or if there are substantial delays in developing, implementing and updating the IT platform, our client delivery may be impaired, and we may have to make substantial further investments, internally or with third parties, to achieve our objectives. Additionally, our progress may be limited by parties with existing or claimed patents who seek to enjoin us from using preferred technology or seek license payments from us. Meeting our objectives is dependent on a number of factors which may not take place as we anticipate, including obtaining adequate technology-enabled services, creating IT-enabled services that our clients will find desirable and implementing our business model with respect to these services. Also, increased IT-related expenditures may negatively impact our profitability.
We may experience challenges with the acquisition, development, enhancement or deployment of technology necessary for our business.
We operate in businesses that require sophisticated computer systems and software for data collection, data processing, cloud-based platforms, analytics, cryptography, statistical projections and forecasting, mobile computing, social media analytics and other applications and technologies, particularly in our Technology & Analytics Solutions and Research & Development Solutions businesses. We seek to address our technology risks by increasing our reliance on the use of innovations by cross-industry technology leaders and adapt these for our biopharmaceutical and healthcare industry clients. Some of these technologies supporting the industries we serve are changing rapidly and we must continue to adapt to these changes in a timely and effective manner at an acceptable cost. We also must continue to deliver data to our clients in forms that are easy to use while simultaneously providing clear answers to complex questions. There can be no guarantee that we will be able to develop, acquire or integrate new technologies, that these new technologies will meet our clients’ needs or achieve expected investment goals, or that we will be able to do so as quickly or cost-effectively as our competitors. Significant technological change could render certain of our services obsolete. Moreover, the introduction of new services embodying new technologies could render certain of our existing services obsolete. Our continued success will depend on our ability to adapt to changing technologies, manage and process ever-increasing amounts of data and information and improve the performance, features and reliability of our services in response to changing client and industry demands. We may experience difficulties that could delay or prevent the successful design, development, testing, introduction or marketing of our services. New services, or enhancements to existing services, may not adequately meet the requirements of current and prospective clients or achieve any degree of significant market acceptance. These types of failures could have a material adverse effect on our operating results and financial condition.

23
Consolidation in the industries in which our clients operate may reduce the volume of services purchased by consolidated clients following an acquisition or merger, which could materially harm our operating results and financial condition.
Mergers or consolidations among our clients have in the past and could in the future reduce the number of our clients and potential clients. When companies consolidate, overlapping services previously purchased separately are usually purchased only once by the combined entity, leading to loss of revenue. Other services that were previously purchased by one of the merged or consolidated entities may be deemed unnecessary or cancelled. If our clients merge with or are acquired by other entities that are not our clients, or that use fewer of our services, they may discontinue or reduce their use of our services. There can be no assurance as to the degree to which we may be able to address the revenue impact of such consolidation. Any of these developments could materially harm our operating results and financial condition.
We may be adversely affected by client or therapeutic concentration.
Although we did not have any client that represented 10% or more of our revenues in 2018, 2017 and 2016, we derive the majority of our revenues from a number of large clients. If any large client decreases or terminates its relationship with us, our business, results of operations or financial condition could be materially adversely affected.
Additionally, conducting multiple clinical trials for different clients in a single therapeutic class involving drugs with the same or similar chemical action has in the past and may in the future adversely affect our business if some or all of the clinical trials are canceled because of new scientific information or regulatory judgments that affect the drugs as a class or if industry consolidation results in the rationalization of drug development pipelines. Similarly, marketing and selling drugs for different biopharmaceutical companies with similar chemical actions subjects us to risk if new scientific information or regulatory judgment prejudices the drugs as a class, which may lead to compelled or voluntary prescription limitations or withdrawal of some or all of such drugs from the market.
Our business is subject to international economic, political and other risks that could negatively affect our results of operations and financial condition.
We have significant operations in countries that may require complex arrangements to deliver services throughout the world for our clients. Additionally, we have established operations in locations remote from our most developed business centers. As a result, we are subject to heightened risks inherent in conducting business internationally, including the following:
• required compliance with a variety of local laws and regulations which may be materially different than those to which we are subject in the United States or which may change unexpectedly; for example, conducting a single clinical trial across multiple countries is complex, and issues in one country, such as a failure to comply with local regulations or restrictions, may affect the progress of the clinical trial in the other countries, for example, by limiting the amount of data necessary for a clinical trial to proceed, resulting in delays or potential cancellation of contracts, which in turn may result in loss of revenue;
• the United States or foreign countries could enact legislation or impose regulations or other restrictions, including unfavorable labor regulations, tax policies or economic sanctions, which could have an adverse effect on our ability to conduct business in or expatriate profits from the countries in which we operate, including hiring, retaining and overseeing qualified management personnel for managing operations in multiple countries, differing employment practices and labor issues, and tax-related risks, including the imposition of taxes and the lack of beneficial treaties, that result in a higher effective tax rate for us;
• foreign countries are expanding or may expand their regulatory framework with respect to patient informed consent, protection and compensation in clinical trials, which could delay or inhibit our ability to conduct clinical trials in such jurisdictions;
• the regulatory or judicial authorities of foreign countries may not enforce legal rights and recognize business procedures in a manner in which we are accustomed or would reasonably expect;
• local, economic, political and social conditions, including potential hyperinflationary conditions, political instability, and potential nationalization, repatriation, expropriation, price controls or other restrictive government actions, including changes in political and economic conditions may lead to changes in the business environment in which we operate, as well as changes in foreign currency exchange rates;

24
• immigration laws are subject to legislative change and varying standards of application and enforcement due to political forces, economic conditions or other events (including proposals in the U.S. to change limitations on temporary and permanent workers), and local immigration laws may require us to meet certain other legal requirements as a condition to obtaining or maintaining entry visas, which may impact our ability to provide services to our clients;
• potential violations of local laws or anti-bribery laws, such as the United States Foreign Corrupt Practices Act (“FCPA”), and the UK Bribery Act, may cause difficulty in managing foreign operations, as well as significant consequences to us if those laws are violated;
• regulatory changes and economic conditions leading up to and following the UK’s likely exit from the EU (“Brexit”), including uncertainties as to its effect on trade laws, tariffs, instability and volatility in the global financial and currency markets, conflicting or redundant regulatory regimes in Europe, such as the European Medicines Agency (“EMA”) possible relocation from UK to a country within the European Union, and political stability;
• clients in foreign jurisdictions may have longer payment cycles, and it may be more difficult to collect receivables in foreign jurisdictions; and
• natural disasters, pandemics or international conflict, including terrorist acts, could interrupt our services, endanger our personnel or cause project delays or loss of clinical trial materials or results.
These risks and uncertainties could negatively impact our ability to, among other things, perform large, global projects for our clients. Furthermore, our ability to deal with these issues could be affected by applicable United States laws and the need to protect our assets. Any such risks could have an adverse impact on our financial condition and results of operations.
Exchange rate fluctuations may affect our results of operations and financial condition.
Because a large portion of our revenues and expenses are denominated in currencies other than the United States dollar and our financial statements are reported in United States dollars, changes in foreign currency exchange rates could significantly affect our results of operations and financial condition. Exchange rate fluctuations between local currencies and the United States dollar create risk in several ways, including:
• Foreign Currency Translation Risk. The revenue and expenses of our foreign operations are generally denominated in local currencies and translated into United States dollars for financial reporting purposes. Accordingly, exchange rate fluctuations will affect the translation of foreign results into United States dollars for purposes of reporting our consolidated results.
• Foreign Currency Transaction Risk. We are subject to foreign currency transaction risk for fluctuations in exchange rates during the period of time between the consummation and cash settlement of a transaction. We earn revenue from our service contracts over a period of several months and, in some cases, over several years. Accordingly, exchange rate fluctuations during this period may affect our profitability with respect to such contracts.
We may limit these risks through exchange rate fluctuation provisions stated in our service contracts, or we may hedge our transaction risk with foreign currency exchange contracts or options. We have not, however, hedged all of our foreign currency transaction risk, and we may experience fluctuations in financial results from our operations outside the United States and foreign currency transaction risk associated with our service contracts.

25
Due to the global nature of our business, we may be exposed to liabilities under anti-corruption laws, including the United States Foreign Corrupt Practices Act, the United Kingdom Bribery Act and various international anti-corruption laws, and any allegation or determination that we violated these laws could have a material adverse effect on our business.
We are required to comply with the FCPA, the UK Bribery Act and other international anti-corruption laws, which prohibit companies from engaging in bribery including corruptly or improperly offering, promising, or providing money or anything else of value to non-United States officials and certain other recipients. In addition, the FCPA imposes certain books, records, and accounting control obligations on public companies and other issuers. We operate in parts of the world in which corruption can be common and compliance with anti-bribery laws may conflict with local customs and practices. Our global operations face the risk of unauthorized payments or offers being made by employees, consultants, sales agents, and other business partners outside of our control or without our authorization. It is our policy to implement safeguards to prohibit these practices by our employees and business partners with respect to our operations. However, irrespective of these safeguards, or as a result of monitoring compliance with such safeguards, it is possible that we or certain other parties may discover or receive information at some point that certain employees, consultants, sales agents, or other business partners may have engaged in corrupt conduct for which we might be held responsible. Violations of the FCPA, the UK Bribery Act or other international anti-corruption laws may result in restatements of, or irregularities in, our financial statements as well as severe criminal or civil sanctions, and we may be subject to other liabilities, which could negatively affect our business, operating results and financial condition. In some cases, companies that violate the FCPA may be debarred by the United States government and/or lose their United States export privileges. Changes in anti-corruption laws or enforcement priorities could also result in increased compliance requirements and related costs which could adversely affect our business, financial condition and results of operations. In addition, the United States or other governments may seek to hold us liable for successor liability FCPA violations or violations of other anti-corruption laws committed by companies in which we invest or that we acquired or will acquire.
We face risks related to sales to government entities.
We derive a portion of our revenue from sales to government entities in the United States. In general, our contracts with United States government entities are terminable at will by the government entity at any time. Government demand and payment for our services may be affected by public-sector budgetary cycles and funding authorizations, including government shutdowns. Government contracts are subject to oversight, including special rules on accounting, expenses, reviews and security. Failure to comply with these rules could result in civil and criminal penalties and sanctions, including termination of contracts, fines and suspensions, or debarment from future business with the United States government. As a result, failure to comply with these rules could have an adverse effect on our future business, reputation, operating results and financial condition.
If we are unable to successfully develop and market new services or enter new markets, our growth, results of operations or financial condition could be adversely affected.
A key element of our growth strategy is the successful development and marketing of new services or entering new markets that complement or expand our existing business. As we develop new services or enter new markets, including services targeted at participants in the broader healthcare industry, we may not have or adequately build the competencies necessary to perform such services satisfactorily, may not receive market acceptance for such services or may face increased competition. If we are unable to succeed in developing new services, entering new markets or attracting a client base for our new services or in new markets, we will be unable to implement this element of our growth strategy, and our future business, reputation, results of operations and financial condition could be adversely affected.
Our Research & Development Solutions business could subject us to potential liability that may adversely affect our results of operations and financial condition.
Our Research & Development Solutions business involves the testing of new drugs on patients in clinical trials and, if marketing approval is granted, the availability of these drugs to be prescribed to patients. Our involvement in the clinical trials and development process creates a risk of liability for personal injury to or death of patients, particularly those with life-threatening illnesses, resulting from adverse reactions to the drugs administered during testing or after product launch, respectively. For example, we have from time to time been sued and may be sued in the future by individuals alleging personal injury due to their participation in clinical trials and seeking damages from us under a variety of legal theories. Although we maintain the types and amounts of insurance we view as customary in the industries and countries in which we operate, if we are required to pay damages or incur defense costs in connection with any personal injury claim that is outside the scope of indemnification agreements we have with our clients, if any indemnification agreement is not performed in accordance with its terms or if our liability exceeds the amount of any applicable indemnification limits or available insurance coverage, our financial condition, results of operations and reputation could be materially and adversely affected. We maintain professional liability insurance, including liability for completed operations coverage. In the future, we may not be able to get adequate insurance for these types of risks at reasonable rates.
26
We also contract with physicians to serve as investigators in conducting clinical trials. If the investigators commit errors or make omissions during a clinical trial that result in harm to clinical trial patients or after a clinical trial to a patient using the drug after it has received regulatory approval, claims for personal injury or liability damages may result. Additionally, if the investigators engage in fraudulent behavior, clinical trial data may be compromised, which may require us to repeat the clinical trial or subject us to liability. We do not believe we are legally responsible for the medical care rendered by such third-party investigators, and we would vigorously defend any claims brought against us. However, it is possible we could be found liable for claims with respect to the actions of third-party investigators, which may adversely affect our financial condition, results of operations and reputation.
Some of our services involve direct interaction with clinical trial subjects or volunteers and subcontracting into a network of Phase I clinical facilities, which could create potential liability that may adversely affect our results of operations, financial condition and reputation.
We subcontract into a network of facilities where Phase I clinical trials are conducted, which ordinarily involve testing an investigational drug on a limited number of healthy individuals, typically 20 to 80 persons, to determine such drug’s basic safety. Failure to operate such a facility in accordance with applicable regulations could result in that facility being shut down, which could disrupt our operations. Additionally, we face risks associated with adverse events resulting from the administration of such drugs to healthy volunteers and the professional malpractice of medical care providers. Any professional malpractice or negligence by such investigators, nurses or other subcontracted employees could potentially result in liability to us in the event of personal injury to or death of a healthy volunteer in clinical trials, and could also cause us reputational harm. This liability, particularly if it were to exceed the limits of any indemnification agreements and insurance coverage we may have, may adversely affect our financial condition, results of operations and reputation.
Our Contract Sales & Medical Solutions business could result in liability to us if a drug causes harm to a patient. While we are generally indemnified and insured against such risks, we may still suffer financial losses.
When we market drugs under contract for a biopharmaceutical company, we could suffer liability for harm allegedly caused by those drugs, either as a result of a lawsuit against the biopharmaceutical company to which we are joined, a lawsuit naming us or any of our subsidiaries or an action launched by a regulatory body. While we are generally indemnified by the biopharmaceutical company for the action of the drugs we market on its behalf, and we carry insurance to cover harm caused by our negligence in performing services, it is possible that we could nonetheless incur financial losses, regulatory penalties or both. In particular, any claim could result in potential liability for us if the claim is outside the scope of the indemnification agreement we have with the biopharmaceutical company, the biopharmaceutical company does not abide by the indemnification agreement as required or the liability exceeds the amount of any applicable indemnification limits or available insurance coverage. Such a finding could have an adverse impact on our financial condition, results of operations and reputation. Furthermore, negative publicity associated with harm caused by drugs we helped to market could have an adverse effect on our business and reputation.
Our insurance may not cover all of our indemnification obligations and other liabilities associated with our operations.
We maintain insurance designed to provide coverage for ordinary risks associated with our operations and our ordinary indemnification obligations. The coverage provided by such insurance may not be adequate for all claims we may make or may be contested by our insurance carriers. If our insurance is not adequate or available to pay liabilities associated with our operations, or if we are unable to purchase adequate insurance at reasonable rates in the future, our profitability may be adversely impacted.
If we are unable to attract suitable investigators and patients for our clinical trials, our clinical development business might suffer.
The timely recruitment of investigators and patients for clinical trials is essential to our Research & Development Solutions business. Investigators are typically located at hospitals, clinics or other sites and supervise the administration of the investigational drug to patients during the course of a clinical trial. Patients generally include people from the communities in which the clinical trials are conducted. Our clinical development business could be adversely affected if we are unable to attract suitable and willing investigators or patients for clinical trials on a consistent basis. For example, if we are unable to engage investigators to conduct clinical trials as planned or enroll sufficient patients in clinical trials, we might need to expend additional funds to obtain access to resources or else be compelled to delay or modify the clinical trial plans, which may result in additional costs to us.

27
If we lose the services of key personnel or are unable to recruit additional qualified personnel, our business could be adversely affected.
Our success substantially depends on the collective performance, contributions and expertise of our personnel including senior management and key personnel, qualified professional, scientific and technical operating staff and qualified sales representatives for our contract sales services. There is significant and increasing competition for qualified personnel, particularly those with higher educational degrees, such as a medical degree, a Ph.D. or an equivalent degree, or relevant experience in the industry and in the locations in which we operate. In addition, the departure of our key employees, or our inability to continue to identify, attract and retain qualified personnel or replace any departed personnel in a timely fashion, may impact our ability to grow our business and compete effectively in our industry and may negatively affect our ability to meet financial and operational goals.
Disruptions in the credit and capital markets and unfavorable general economic conditions could negatively affect our business, results of operations and financial condition.
Disruptions in the credit and capital markets could have negative effects on our business that may be difficult to predict or anticipate, including the ability of our clients, vendors, contractors and financing sources to meet their contractual obligations. Although we are unable to quantify the impact it has had on us, we are aware of a limited number of instances in our Research & Development Solutions business during the past several years where cancellations, changes in scope and failure to pay timely were attributable, at least in part, to difficulty in our clients’ ability to obtain financing. In the future such actions by our clients could, if they involve a significant amount of business with us, have a material adverse effect on our results of operations.
Our effective income tax rate may fluctuate for a variety of reasons, including the Tax Cuts and Jobs Act enacted in 2017 (the “Tax Act”), which may adversely affect our operations, earnings and earnings per share.
Our effective income tax rate is influenced by our projected profitability in the various taxing jurisdictions in which we operate. Changes in a jurisdiction’s income tax rates and the distribution of our profits and losses among such jurisdictions may have a significant impact on our effective income tax rate, which in turn could have an adverse effect on our net income and earnings per share. Factors that may affect our effective income tax rate include, but are not limited to:
• the requirement to exclude from our quarterly worldwide effective income tax calculations losses in jurisdictions where no income tax benefit can be recognized;
• actual and projected full year pre-tax income;
• changes in the value of deferred tax assets and liabilities;
• the repatriation of foreign earnings to the United States;
• changes in tax laws in various jurisdictions, including the Tax Act;
• audits by taxing authorities; and
• the establishment of valuation allowances against deferred income tax assets if we determined that it is more likely than not that future income tax benefits will not be realized.
In addition, our effective income tax rate is influenced by U.S. tax law which has been substantially modified by the Tax Act. Currently regulations have been issued in proposed form, and if the application of these provisions are modified to change the interpretation to us it could have an adverse impact on our effective income tax rate:
• Base Erosion and Anti-Abuse Tax (“BEAT”);
• Global Intangible Low-Taxed Income (“GILTI”);
• Deduction for net business interest limited to 30% of adjusted taxable income; and
• Performance-based compensation and commissions now subject to $1 million limit.

28
All of these items described above may cause fluctuations in our effective income tax rate through increased U.S. tax liability and/or the loss of tax attributes in any given year that could adversely affect our results of operations and impact our earnings and earnings per share. Additional information regarding our income taxes is presented in Note 16 to our audited consolidated financial statements included in this Annual Report on Form 10-K.
Changes in accounting standards issued by the Financial Accounting Standards Board (“FASB”), including ASC 606 “Revenue from Contracts with Customers” (ASC 606), or other standard-setting bodies may adversely affect our financial statements.
We are required to prepare our financial statements in accordance with generally accepted accounting principles in the United States of America (“GAAP”), which is periodically revised and/or expanded. From time to time, we are required to adopt new or revised accounting standards issued by recognized authoritative bodies, including the FASB and the SEC. It is possible that future accounting standards we are required to adopt, such as amended guidance for leases, may require additional changes to the current accounting treatment that we apply to our financial statements and may require us to make significant changes to our reporting systems. Such changes could result in a material adverse impact on our results of operations and financial condition.
For example, effective January 1, 2018, we were required to adopt ASC 606. Under this new standard, the Company is required to recognize revenue for its clinical trial arrangements on a percentage of completion basis. This change in revenue recognition requires significant estimates of project costs that will need to be updated and adjusted on a regular basis. These updates and adjustments are likely to result in variability in our revenue recognition from period to period that may cause unexpected variability in our operating results. See Note 1 to our audited consolidated financial statements included elsewhere in this Annual Report on Form 10-K for details regarding ASC 606.
Our relationships with existing or potential clients who are in competition with each other may adversely impact the degree to which other clients or potential clients use our services, which may adversely affect our results of operations.
The biopharmaceutical industry is highly competitive, with biopharmaceutical companies each seeking to persuade payers, providers and patients that their drug therapies are better and more cost-effective than competing therapies marketed or being developed by competing firms. In addition to the adverse competitive interests that biopharmaceutical companies have with each other, biopharmaceutical companies also have adverse interests with respect to drug selection and reimbursement with other participants in the healthcare industry, including payers and providers. Biopharmaceutical companies also compete to be first to market with new drug therapies. We regularly provide services to biopharmaceutical companies who compete with each other, and we sometimes provide services or funding to such clients regarding competing drugs in development. Our existing or future relationships with our biopharmaceutical clients may therefore deter other biopharmaceutical clients from using our services or may result in our clients seeking to place limits on our ability to serve other biopharmaceutical industry participants in connection with drug development activities. In addition, our further expansion into the broader healthcare market may adversely impact our relationships with biopharmaceutical clients, and such clients may elect not to use our services, reduce the scope of services that we provide to them or seek to place restrictions on our ability to serve clients in the broader healthcare market with interests that are adverse to theirs. A loss of clients or reductions in the level of revenues from a client could have a material adverse effect on our results of operations, business and prospects.
If we are unable to successfully identify, acquire and integrate existing businesses, services and technologies, our business, results of operations and financial condition could be adversely impacted.
We anticipate that a portion of our future growth may come from acquiring existing businesses, services or technologies. The success of any acquisition will depend upon, among other things, our ability to effectively integrate acquired personnel, operations, services and technologies into our business and to retain the key personnel and clients of our acquired businesses. In addition, we may be unable to identify suitable acquisition opportunities or obtain any necessary financing on commercially acceptable terms. We may also spend time and money investigating and negotiating with potential acquisition targets but not complete the transaction. Any future acquisition could involve other risks, including, among others, the assumption of additional liabilities and expenses, difficulties and expenses in connection with integrating the acquired companies and achieving the expected benefits, issuances of potentially dilutive securities or interest-bearing debt, loss of key employees of the acquired companies, transaction costs, diversion of management’s attention from other business concerns and, with respect to the acquisition of foreign companies, the inability to overcome differences in foreign business practices, language and customs. Our failure to identify potential acquisitions, complete targeted acquisitions and integrate completed acquisitions could have a material adverse effect on our business, financial condition and results of operations.

29
Investments in our clients’ businesses or drugs and our related commercial rights strategies could have a negative impact on our financial performance.
We may enter into arrangements with our clients or other drug companies in which we take on some of the risk of the potential success or failure of their businesses or drugs, including making strategic investments in our clients or other drug companies, providing financing to clients or other drug companies or acquiring an interest in the revenues from clients’ drugs or in entities developing a limited number of drugs. Our financial results would be adversely affected if these investments or the underlying drugs result in losses or do not achieve the level of success that we anticipate and/or our return or payment from the drug investment or financing is less than our direct and indirect costs with respect to these arrangements.
Our results of operations may be adversely affected if we fail to realize the full value of our goodwill and intangible assets.
We assess the realizability of our indefinite-lived intangible assets and goodwill annually and conduct an interim evaluation whenever events or changes in circumstances, such as operating losses or a significant decline in earnings associated with the acquired business or asset, indicate that these assets may be impaired. For example, we recognized $40 million of impairment losses during the year ended December 31, 2017, for goodwill and intangible assets in Encore Health Resources LLC (“Encore”), which we sold in the third quarter of 2017. Our ability to realize the value of the goodwill and indefinite-lived intangible assets will depend on the future cash flows of the businesses we have acquired, which in turn depend in part on how well we have integrated these businesses into our own business. If we are not able to realize the value of the goodwill and indefinite-lived intangible assets, we may be required to incur material charges relating to the impairment of those assets. Such impairment charges could materially and adversely affect our operating results and financial condition.
We face risks arising from the restructuring of our operations.
From time to time, we have adopted restructuring plans to improve our operating efficiency through various means such as reduction of overcapacity, elimination of non-billable support roles or other realignment of resources. Restructuring presents significant potential risks of events occurring that could adversely affect us, including:
• actual or perceived disruption of service or reduction in service standards to clients;
• the failure to preserve supplier relationships and distribution, sales and other important relationships and to resolve conflicts that may arise;
• loss of sales as we reduce or eliminate staffing on non-core services;
• diversion of management attention from ongoing business activities; and
• the failure to maintain employee morale and retain key employees.
Further, any such restructuring would result in charges that, if material, could harm our results of operations and significantly reduce our cash position or increase debt. In addition, we may incur certain unforeseen costs once any restructuring activities are implemented. Further, if we determine to effect any restructuring, we can give no assurance that any projected cost reductions resulting from such restructuring activities will be achieved within the expected timeframe, or at all.
Because of these and other factors, we cannot predict whether we will realize the purpose and anticipated benefits of these measures and, if we do not, our business and results of operations may be adversely affected.
Additionally, there may be delays in implementing the restructuring activities or a failure to achieve the anticipated levels of cost savings and efficiency as a result of the restructuring activities, each of which could materially and adversely impact our business and results of operations. Further restructuring or reorganization activities may also be required in the future beyond what is currently planned, which could further enhance the risks associated with these activities.

30
Risks Relating to Our Industry
The biopharmaceutical services industry is highly competitive.
The biopharmaceutical services industry is highly competitive. Our business often competes with other biopharmaceutical services companies, internal discovery departments, development departments, sales and marketing departments, information technology departments and other departments within our clients, some of which could be considered large biopharmaceutical services companies in their own right with greater resources than ours. We also compete with universities, teaching hospitals, governments agencies and others. If we do not compete successfully, our business will suffer. The industry is highly fragmented, with numerous smaller specialized companies and a handful of companies with global capabilities similar to certain of our own capabilities. Increased competition has led to price and other forms of competition, such as acceptance of less favorable contract terms, that could adversely affect our operating results. There are few barriers to entry for companies considering offering any one or more of the services we offer. Because of their size and focus, these companies might compete effectively against us, which could have a material adverse impact on our business.
Our future growth and success will depend on our ability to successfully compete with other companies that provide similar services in the same markets, some of which may have financial, marketing, technical and other advantages. We also expect that competition will continue to increase as a result of consolidation among these various companies. Large technology companies with substantial resources, technical expertise and greater brand power could also decide to enter or further expand in the markets where our business operates and compete with us. If one or more of our competitors or potential competitors were to merge or partner with another of our competitors, or if a new entrant emerged with substantial resources, the change in the competitive landscape could adversely affect our ability to compete effectively. We compete on the basis of various factors, including breadth and depth of services, reputation, reliability, quality, innovation, security, price and industry expertise and experience. In addition, our ability to compete successfully may be impacted by the growing availability of health information from social media, government health information systems and other free or low-cost sources. Consolidation or integration of wholesalers, retail pharmacies, health networks, payers or other healthcare stakeholders may lead any of them to provide information services directly to clients or indirectly through a designated service provider, resulting in increased competition from firms that may have lower costs to market (e.g., no data supply costs). Any of the above may result in lower demand for our services, which could result in a material adverse impact on our operating results and financial condition.
Outsourcing trends in the biopharmaceutical industry and changes in aggregate spending and research and development budgets could adversely affect our operating results and growth rate.
Economic factors and industry trends that affect biopharmaceutical companies affect our Research & Development Solutions business. Biopharmaceutical companies continue to seek long-term strategic collaborations with global contract research organizations with favorable pricing terms. Competition for these collaborations is intense and we may decide to forego an opportunity or we may not be selected, in which case a competitor may enter into the collaboration and our business with the client, if any, may be limited. In addition, if the biopharmaceutical industry reduces its Research & Development Solutions activities or reduces its outsourcing of clinical trials and sales and marketing projects or such outsourcing fails to grow at projected rates, our operations and financial condition could be materially and adversely affected. We may also be negatively impacted by consolidation and other factors in the biopharmaceutical industry, which may slow decision making by our clients or result in the delay or cancellation of clinical trials. Our commercial services may be affected by reductions in new drug launches and increases in the number of drugs losing patent protection. All of these events could adversely affect our business, results of operations or financial condition.
Our business may be materially and adversely impacted by factors affecting the biopharmaceutical and healthcare industries.
The vast majority of our revenue is generated from sales to the biopharmaceutical and healthcare industries. The clients we serve in these industries are commonly subject to financial pressures, including, but not limited to, increased costs, reduced demand for their products, reductions in pricing and reimbursement for products and services, formulary approval and placement, government approval to market their products and limits on the manner by which they market their products, loss of patent exclusivity (whether due to patent expiration or as a result of a successful legal challenge) and the proliferation of or changes to regulations applicable to these industries. To the extent our clients face such pressures, or they change how they utilize our offerings, the demand for our services, or the prices our clients are willing to pay for those services, may decline. Any such decline could have a material adverse effect on our business, operating results and financial condition.

31
We may be affected by healthcare reform and potential additional reforms.
The United States Congress continues to consider healthcare reform legislation and impose health industry cost containment measures, which may significantly impact the biopharmaceutical industry. In addition, numerous government bodies are considering or have adopted various healthcare reforms and may undertake, or are in the process of undertaking, efforts to control growing healthcare costs through legislation, regulation and voluntary agreements with medical care providers and biopharmaceutical companies. We are uncertain as to the effects of these recent reforms on our business and are unable to predict what legislative proposals, if any, will be adopted in the future. If regulatory cost containment efforts limit the profitability of new drugs, our clients may reduce their research and development spending or promotional, marketing and sales expenditures, which could reduce the business they outsource to us. Similarly, if regulatory requirements are relaxed or simplified drug approval procedures are adopted, the demand for our services could decrease.
Foreign and domestic government bodies may also adopt healthcare legislation or regulations that are more burdensome than existing regulations. For example, product safety concerns and recommendations by the Drug Safety Oversight Board could change the regulatory environment for drug products, and new or heightened regulatory and licensing requirements may increase our expenses or limit or delay our ability to offer some of our services. Additionally, new or heightened regulatory requirements may have a negative impact on the ability of our clients to conduct industry-sponsored clinical trials, which could reduce the need for our services.
Actions by government regulators or clients to limit a prescription’s scope or withdraw an approved drug from the market could adversely affect our business and result in a loss of revenues.
Government regulators have the authority, after approving a drug, to regulate or limit its scope of prescription or withdraw it from the market completely based on safety concerns. Similarly, clients may act to voluntarily limit the scope of prescription of drugs or withdraw them from the market. In the past, we have provided services with respect to drugs that have been limited and/or withdrawn. If we are providing services to clients for drugs that are limited or withdrawn, we may be required to narrow the scope of or terminate our services with respect to such drugs, which would prevent earning the full amount of revenues anticipated under the related service contracts with negative impacts to our financial results.
If we do not keep pace with rapid technological changes, our services may become less competitive or obsolete.
The biopharmaceutical industry is subject to rapid technological changes. Our current competitors or other businesses might develop technologies or services that are more effective or commercially attractive than, or render obsolete, our current or future technologies and services. If our competitors introduce superior technologies or services, including in the provision of clinical services, and if we cannot make enhancements to remain competitive, our competitive position would be harmed. If we are unable to compete successfully, we may lose clients or be unable to attract new clients, which could lead to a decrease in our revenue and financial condition.
Laws restricting biopharmaceutical sales and marketing practices may adversely impact demand for our services.
There have been a significant number of laws, legislative initiatives and regulatory actions over the years that seek to limit biopharmaceutical sales and marketing practices. For example, three states in 2006 and 2007 passed laws restricting the use of prescriber identifiable information for the purpose of promoting branded prescription medicines. Although these laws were subsequently declared to be unconstitutional based on a decision of the U.S. Supreme Court in Sorrell v. IMS Health in 2011, we are unable to predict whether, and in what form, other initiatives may be introduced or actions taken at the state or Federal levels to limit biopharmaceutical sales and marketing practices. In addition, while we will continue to seek to adapt our services to comply with the requirements of these laws (to the extent applicable to our services), if enacted, there can be no assurance that our efforts to adapt our offerings will be successful and provide the same financial contribution to us. There can also be no assurance that future legislative initiatives will not adversely affect our ability to develop or market current or future offerings, or that any future laws will not diminish the demand for our services, all of which could, over time, result in a material adverse impact on our operating results and financial condition.

32
Our Research & Development Solutions clients face intense competition from lower cost generic products, which may lower the amount that they spend on our services.
Our Research & Development Solutions clients face increasing competition from lower cost generic products, which in turn may affect their ability to pursue research and development activities with us. In the United States, EU and Japan, political pressure to reduce spending on prescription drugs has led to legislation and other measures which encourages the use of generic products. In addition, proposals emerge from time to time in the United States and other countries for legislation to further encourage the early and rapid approval of generic drugs. Loss of patent protection for a product typically is followed promptly by generic substitutes, reducing our clients’ sales of that product and their overall profitability. Availability of generic substitutes for our clients’ drugs may adversely affect their results of operations and cash flow, which in turn may mean that they would not have surplus capital to invest in research and development and drug commercialization, including in our services. If competition from generic products impacts our clients’ finances such that they decide to curtail our services, our revenues may decline and this could have a material adverse effect on our business.
Risks Relating to Our Indebtedness
Restrictions imposed in the Senior Secured Credit Facilities and other outstanding indebtedness, including the indentures governing IQVIA Holdings Inc. outstanding notes, may limit our ability to operate our business and to finance our future operations or capital needs or to engage in other business activities.
The terms of the Senior Secured Credit Facilities (as defined below) restrict IQVIA and its restricted subsidiaries from engaging in specified types of transactions. These covenants restrict the ability of IQVIA and its restricted subsidiaries, among other things, to:
• incur liens;
• make investments and loans;
• incur indebtedness or guarantees;
• issue preferred stock of a restricted subsidiary;
• issue disqualified equity;
• engage in mergers, acquisitions and asset sales;
• declare dividends, make payments or redeem or repurchase equity interests;
• alter the business IQVIA and its restricted subsidiaries conduct;
• make restricted payments;
• enter into agreements limiting restricted subsidiary distributions;
• prepay, redeem or purchase certain indebtedness; and
• engage in certain transactions with affiliates.
In addition, the revolving credit facility and the term A and B loans under our Credit Agreement (as defined below) require IQVIA to comply with a quarterly maximum senior secured net leverage ratio test and minimum interest coverage ratio test. IQVIA’s ability to comply with these financial covenants can be affected by events beyond our control, and IQVIA may not be able to satisfy them. Additionally, the restrictions contained in the indentures governing the outstanding notes could also limit our ability to plan for or react to market conditions, meet capital needs or make acquisitions or otherwise restrict our activities or business plans.

33
A breach of any of these covenants could result in a default under the Senior Secured Credit Facilities or the indentures governing the outstanding notes, which could trigger acceleration of our indebtedness and may result in the acceleration of or default under any other debt to which a cross-acceleration or cross-default provision applies, which could have a material adverse effect on our business, operations and financial results. In the event of any default under the Senior Secured Credit Facilities, the applicable lenders could elect to terminate borrowing commitments and declare all borrowings and loans outstanding, together with accrued and unpaid interest and any fees and other obligations, to be due and payable. In addition, or in the alternative, the applicable lenders could exercise their rights under the security documents entered into in connection with the Senior Secured Credit Facilities. IQVIA and the other subsidiary guarantors have pledged substantially all of their tangible and intangible assets (subject to customary exceptions) as collateral under the Senior Secured Credit Facilities, including the stock and the assets of certain of our current and future wholly owned United States subsidiaries and a portion of the stock of certain of our non-United States subsidiaries.
If we were unable to repay or otherwise refinance these borrowings and loans when due, the applicable lenders could proceed against the collateral granted to them to secure that indebtedness, which could force us into bankruptcy or liquidation. In the event the applicable lenders accelerate the repayment of our borrowings, we and our subsidiaries may not have sufficient assets to repay that indebtedness. Any acceleration of amounts due under the Credit Agreement governing the Senior Secured Credit Facilities or the exercise by the applicable lenders of their rights under the security documents would likely have a material adverse effect on us.
Despite our level of indebtedness, we are able to incur more debt and undertake additional obligations. Incurring such debt or undertaking such additional obligations could further exacerbate the risks to our financial condition.
Although our Credit Agreement, which governs the Senior Secured Credit Facilities of our wholly owned subsidiary through which we conduct our operations, IQVIA Inc., contains restrictions on the incurrence of additional indebtedness, these restrictions are subject to a number of qualifications and exceptions and the indebtedness incurred in compliance with these restrictions could increase. In addition, the receivables financing facility for our special purpose subsidiary, IQVIA Funding, LLC (“IQVIA Funding”) limits borrowing based on the amount of receivables purchased by IQVIA Funding from certain of our other subsidiaries, but when supported by the value of such purchased receivables, the debt under our receivables financing facility can increase.
While the Credit Agreement also contains restrictions on our and our restricted subsidiaries’ ability to make loans and investments, these restrictions are subject to a number of qualifications and exceptions, and the investments incurred in compliance with these restrictions could be substantial.
Restrictive covenants in our other indebtedness may limit our flexibility in our current and future operations, particularly our ability to respond to changes in our business or to pursue our business strategies.
The terms contained in certain of our indebtedness, including credit facilities and any future indebtedness of ours, may include a number of restrictive covenants that impose significant operating and financial restrictions, including restrictions on our and our restricted subsidiaries’ ability to take actions that we believe may be in our interest. These agreements, among other things, limit our ability to:
• incur additional debt;
• provide guarantees in respect of obligations of other persons;
• issue redeemable stock and preferred stock;
• pay dividends or distributions or redeem or repurchase capital stock;
• prepay, redeem or repurchase debt;
• make loans, investments and capital expenditures;
• enter into transactions with affiliates;
• create or incur liens;
• make distributions from our subsidiaries;
• sell assets and capital stock of our subsidiaries;

34
• make acquisitions; and
• consolidate or merge with or into, or sell substantially all of our assets to, another person.
A breach of the covenants or restrictions under the agreements governing our other indebtedness could result in a default under the applicable indebtedness. Such default may allow the creditors to accelerate the related debt and may result in the acceleration of any other debt to which a cross-acceleration or cross-default provision applies. In the event our lenders and noteholders accelerate the repayment of our borrowings, we cannot assure that we and our subsidiaries would have sufficient assets to repay such indebtedness.
Our financial results, our substantial indebtedness and our credit ratings could adversely affect the availability and terms of future financing.
Interest rate fluctuations and our ability to deduct interest expense may affect our results of operations and financial condition.
Because we have variable rate debt, fluctuations in interest rates affect our business. We attempt to minimize interest rate risk and lower our overall borrowing costs through the utilization of derivative financial instruments, primarily interest rate caps and swaps. We have entered into interest rate caps and swaps with financial institutions that have reset dates and critical terms that match those of our senior secured term loan credit facility. Accordingly, any change in market value associated with the interest rate caps and swaps is offset by the opposite market impact on the related debt. Because we do not attempt to hedge all of our variable rate debt, we may incur higher interest costs for the portion of our variable rate debt which is not hedged.
In addition, the deduction for our interest expense may be limited, which could have an adverse impact on our taxes and net income.
Risks Relating to Ownership of Our Common Stock
Provisions of the corporate governance documents of IQVIA could make an acquisition of IQVIA difficult and may prevent attempts by its stockholders to replace or remove its management, even if beneficial to its stockholders.
Our certificate of incorporation and Delaware bylaws and the General Corporation Law of Delaware (“DGCL”) contain provisions that could make it difficult for a third party to acquire IQVIA even if doing so might be beneficial to its stockholders, including:
• the division of the board of directors into three classes and the election of each class for three-year terms;
• subject to the Shareholders Agreement dated May 3, 2016 (the “Shareholders Agreement”), the sole ability of the board of directors to fill a vacancy created by the death or resignation of a director or the expansion of the board of directors;
• advance notice requirements for stockholder proposals and director nominations;
• limitations on the ability of stockholders to call special meetings and to take action by written consent;
• the approval of holders of at least seventy-five percent (75%) of the outstanding shares of IQVIA entitled to vote on any amendment, alteration, change, addition or repeal of the Delaware bylaws is required to amend, alter, change, add to or repeal the Delaware bylaws;
• the required approval of holders of at least seventy-five percent (75%) of the outstanding shares of IQVIA to remove directors, which removal may only be for cause, subject to different requirements in the case of directors elected by a voting group of stockholders and the terms of the Shareholders Agreement; and
• the ability of the board of directors to issue new series of, and designate the terms of, preferred stock, without stockholder approval, which could be used to, among other things, institute a rights plan that would have the effect of significantly diluting the stock ownership of a potential hostile acquirer, likely preventing acquisitions that have not been approved by the board of directors.

35
In addition, IQVIA is subject to Section 203 of the DGCL regulating corporate takeovers, although our board of directors adopted a resolution approving the Merger pursuant to which shares of common stock were acquired, by among others, the TPG Shareholders. Section 203, subject to certain exceptions, prohibits a Delaware corporation from engaging in any “business combination” with any “interested stockholder” for a period of three years following the date that such stockholder became an interested stockholder unless:
• prior to such date, the board of directors of the corporation approved either the business combination or the transaction that resulted in the stockholder becoming an interested stockholder;
• upon consummation of the transaction that resulted in the stockholder becoming an interested stockholder, the interested stockholder owned at least 85% of the voting stock of the corporation outstanding at the time the transaction commenced, excluding those shares owned by persons who are directors and also officers, and employee stock plans in which employee participants do not have the right to determine confidentially whether shares held subject to the plan will be tendered in a tender or exchange offer; or
• on or subsequent to such date, the business combination is approved by the board of directors and authorized at an annual or special meeting of stockholders, and not by written consent, by the affirmative vote of at least two-thirds of the outstanding voting stock that is not owned by the interested stockholder.
In general, Section 203 defines “business combination” to include mergers or consolidations between a Delaware corporation and an interested stockholder, transactions with an interested stockholder involving the assets or stock of the corporation or its majority-owned subsidiaries and transactions which increase an interested stockholder’s percentage ownership of stock. In general, Section 203 defines an “interested stockholder” as any entity or person beneficially owning 15% or more of the outstanding voting stock of the corporation and any entity or person affiliated with or controlling or controlled by such entity or person. These provisions may frustrate or prevent any attempts by stockholders to replace members of the board of directors. Because IQVIA’s board is responsible for appointing the members of management, these provisions could in turn affect any attempt to replace current members of management. As a result, stockholders of IQVIA may lose their ability to sell their stock for a price in excess of the prevailing market price due to these protective measures, and efforts by stockholders to change the direction or management of IQVIA may be unsuccessful.
Our operating results and share price may be volatile, which could cause the value of our stockholders’ investments to decline.
Our quarterly and annual operating results may fluctuate in the future, and such fluctuations may be significant. In addition, securities markets worldwide have experienced, and are likely to continue to experience, significant price and volume fluctuations. This market volatility, as well as general economic, market or political conditions, could subject the market price of our shares to wide price fluctuations regardless of our operating performance. Our operating results and the trading price of our shares may fluctuate in response to various factors, including:
• market conditions in the broader stock market;
• actual or anticipated fluctuations in our quarterly and annual financial and operating results;
• introduction of new services by us or our competitors;
• issuance of new or changed securities analysts’ reports or recommendations;
• sales, or anticipated sales, of large blocks of our stock;
• additions or departures of key personnel;
• regulatory or political developments;
• litigation and governmental investigations;
• changing economic conditions; and
• exchange rate fluctuations.

36
These and other factors, many of which are beyond our control, may cause our operating results and the market price for our shares to fluctuate substantially. While we believe that operating results for any particular quarter are not necessarily a meaningful indication of future results, fluctuations in our quarterly operating results could limit or prevent investors from readily selling their shares and may otherwise negatively affect the market price and liquidity of our shares. In addition, in the past, when the market price of a stock has been volatile, holders of that stock have sometimes instituted securities class action litigation against the company that issued the stock. If any of our stockholders brought a lawsuit against us, we could incur substantial costs defending the lawsuit. Such a lawsuit could also divert the time and attention of our management from our business, which could significantly harm our profitability and reputation.
There may be sales of a substantial amount of our common stock by our current stockholders, and these sales could cause the price of our common stock to fall.
As of February 12, 2019, there were 197,599,861 shares of common stock outstanding. Approximately 10.9% of the outstanding shares of our common stock is held by parties to the Shareholders Agreement.
Sales of substantial amounts of our common stock in the public market, or the perception that such sales will occur, could adversely affect the market price of our common stock and make it difficult for us to raise funds through securities offerings in the future. For example, as restrictions on resale end, the market price of our common stock could decline if the holders of currently restricted shares sell them or are perceived by the market as intending to sell them.
Stockholders that are a party to the Shareholders Agreement may require us to register their shares for resale under the federal securities laws, subject to certain requirements. Under the Shareholders Agreement, we are required to pay the registration expenses associated with the registration of such shares, not including the underwriting discounts, commissions and transfer taxes. Registration of those shares would allow those stockholders to immediately resell their shares in the public market. Any such sales or the anticipation of such sales may cause the market price of our common stock to decline. In 2018, the parties to the Shareholders Agreement sold approximately 21.4 million shares of our common stock, of which we repurchased approximately 6.0 million shares.
In addition, we may use our cash, cash generated from operations or dispositions of assets or businesses and/or proceeds from any new financing arrangements or issuances of debt or equity securities to repurchase shares, including the repurchase of shares from our stockholders that are a party to the Shareholders Agreement.
Since we have no current plans to pay regular cash dividends on our common stock, stockholders may not receive any return on investment unless they sell their common stock for a price greater than that which they paid for it.
Although we have previously declared dividends to our stockholders prior to our initial public offering in May 2013, we do not currently anticipate paying any regular cash dividends on our common stock. Any decision to declare and pay dividends in the future will be made at the discretion of our Board and will depend on, among other things, our results of operations, financial condition, cash requirements, contractual restrictions and other factors that our Board may deem relevant. In addition, our ability to pay dividends is, and may be, limited by covenants of existing and any future outstanding indebtedness we or our subsidiaries incur, including under our existing credit facilities. Therefore, any return on investment in our common stock is solely dependent upon the appreciation of the price of our common stock on the open market, which may not occur.
Our certificate of incorporation contains a provision renouncing any interest and expectancy in certain corporate opportunities identified by certain of our affiliates, even if such corporate opportunities are ones that we might reasonably be deemed to have pursued or had the ability or desire to pursue.
Our certificate of incorporation provides that our company renounces any interest or expectancy in the business opportunities of the TPG Shareholders, the Bain Capital, CPP Investment Board Private Holdings Inc. (“CPP Shareholder”), and Leonard Green & Partners, L.P. (“LGP Shareholders”), and their affiliates (other than our company and our subsidiaries) and all of their respective partners, principals, directors, officers, members, managers, managing directors and/or employees, and each such person will have no obligation to offer us such opportunities. This provision applies to these stockholders (and associated parties) only for so long as a nominee designated by the stockholder under the Shareholders Agreement continues to serve on the board. Stockholders are deemed to have notice of and have consented to this provision of our certificate of incorporation.
Therefore, a director or officer of our company who also serves as a director, officer, member, manager, or employee of such stockholders may pursue certain business opportunities, including acquisitions, that may be complementary to its business and, as a result, such opportunities may not be available to us. These potential conflicts of interest could have a material adverse effect on the business, financial condition, results of operations, or prospects of our company if attractive corporate opportunities are allocated by such stockholders to themselves or their other affiliates instead of to us.

37
Item 1B. Unresolved Staff Comments
None.
Item 2. Properties
As of December 31, 2018, we had approximately 307 offices located in approximately 84 countries. Our executive headquarters are located adjacent to Research Triangle Park, North Carolina and in Danbury, Connecticut. We own facilities in Barcelona, Spain; Buenos Aires, Argentina; Caracas, Venezuela; Los Ruices, Venezuela; Lisbon, Portugal; and Bangalore, India. All of our other offices are leased. Our properties are geographically distributed to meet our worldwide operating requirements, and none of our properties are individually material to our business operations. Many of our leases have an option to renew, and we believe that we will be able to successfully renew expiring leases on terms satisfactory to us. We believe that our facilities are adequate for our operations and that suitable additional space will be available if needed.
Item 3. Legal Proceedings
We are involved in a variety of legal and tax proceedings, claims and litigation that arise from time to time in the ordinary course of business. These actions may be commenced by various parties, including competitors, clients, current or former employees, government agencies or others. We record a provision with respect to a proceeding, claim or litigation when it is probable that a liability has been incurred and the amount of the loss can be reasonably estimated. However, even in instances where we have recorded an estimated liability, we are unable to predict with certainty the final outcome of the matter or whether resolution of the matter will materially affect our operating results, financial position or cash flows. As additional information becomes available, we adjust our assessment and estimates of such liabilities accordingly.
Further, we routinely enter into agreements with our suppliers to acquire data and with our clients to sell data, all in the normal course of business. In these agreements, we sometimes agree to indemnify and hold harmless the other party for any damages such other party may suffer as a result of potential intellectual property infringement and other claims related to the use of the data. We have not accrued liability with respect to these matters, as the exposure is considered remote.
Based on our review of the latest information available, management does not expect the impact of pending legal and tax proceedings, claims and litigation, either individually or in the aggregate, to have a material adverse effect on our operating results, financial position or cash flows. However, one or more unfavorable outcomes in any claim or litigation against us could have a material adverse effect for the period in which it is resolved. The following is a summary of the more significant legal matters involving the company.
Our wholly-owned subsidiary, IMS Government Solutions Inc., is primarily engaged in providing services under contracts with the United States government. United States government contracts are subject to extensive legal and regulatory requirements and, from time to time, agencies of the United States government have the ability to investigate whether contractors’ operations are being conducted in accordance with such requirements. IMS Government Solutions discovered potential noncompliance with various contract clauses and requirements under its General Services Administration Contract (the “GSA Contract”) which was awarded in 2002 to its predecessor company, Synchronous Knowledge Inc. (Synchronous Knowledge Inc. was acquired by IMS Health in May 2005). The potential noncompliance arose from two primary areas: first, at the direction of the government, work performed under one task order was invoiced under another task order without the appropriate modifications to the orders being made; and second, personnel who did not meet strict compliance with the labor categories component of the qualification requirements of the GSA Contract were assigned to contracts. Upon discovery of the potential noncompliance, we began remediation efforts, promptly disclosed the potential noncompliance to the United States government and were accepted into the Department of Defense Voluntary Disclosure Program. We filed a Voluntary Disclosure Program Report on August 29, 2008. We are currently unable to determine the outcome of all of these matters pending the resolution of the Voluntary Disclosure Program process and the ultimate liability arising from these matters could exceed our current reserves.

38
On February 13, 2014, a group of approximately 1,200 medical doctors and 900 private individuals filed a civil lawsuit with the Seoul Central District Court against IMS Korea and two other defendants, KPA and the Korean Pharmaceutical Information Center (“KPIC”). The civil lawsuit alleges KPA and KPIC collected their personal information in violation of applicable privacy laws without the necessary consent through a software system installed on pharmacy computer systems in Korea, and that personal information was transferred to IMS Korea and sold to pharmaceutical companies. On September 11, 2017, the District Court issued a final decision that the encryption in use by the defendants since June 2014 was adequate to meet the requirements of the Korean Personal Information Privacy Act (“PIPA”) and the sharing of non-identified information for market research purposes was allowed under PIPA. The District Court also found an earlier version of encryption was insufficient to meet PIPA requirements, but no personal data had been leaked or re-identified. The District Court did not award any damages to plaintiffs. Approximately 280 medical doctors and 200 private individuals appealed the District Court decision. The Company believes the appeal is without merit and intends to vigorously defend its position.
On July 23, 2015, indictments were issued by the Seoul Central District Prosecutors’ Office in South Korea against 24 individuals and companies alleging improper handling of sensitive health information in violation of, among others, South Korea’s Personal Information Protection Act. IMS Korea and two of its employees were among the individuals and organizations indicted. Although there is no assertion that IMS Korea used patient identified health information in any of its offerings, prosecutors allege that certain of IMS Korea’s data suppliers should have obtained patient consent when they converted sensitive patient information into non-identified data and that IMS Korea had not taken adequate precautions to reduce the risk of re-identification. We believe the indictment is without merit that we acted in compliance with all applicable laws at all times and intend to vigorously defend our position.
On January 10, 2017, IQVIA Inc., IMS Health Incorporated and IMS Software Services, Inc. (collectively “IQVIA Parties”) filed a lawsuit in the U.S. District Court for the District of New Jersey against Veeva Systems, Inc. (“Veeva”) alleging Veeva unlawfully used IQVIA Parties intellectual property to improve Veeva data offerings, to promote and market Veeva data offerings and to improve Veeva technology offerings. IQVIA Parties seek injunctive relief, appointment of a monitor, the award of compensatory and punitive damages and reimbursement of all litigation expenses, including reasonable attorneys’ fees and costs. On March 13, 2017, Veeva filed counterclaims alleging anticompetitive business practices in violation of the Sherman Act and state laws. Veeva claims damages in excess of $200 million, and is seeking punitive damages and litigation costs, including attorneys’ fees. We believe the counterclaims are without merit, reject all counterclaims raised by Veeva and intend to vigorously defend IQVIA Parties’ position and pursue our claims against Veeva.
For additional information, see Note 12 to our audited consolidated financial statements included elsewhere in this Annual Report on Form 10-K.
Item 4. Mine Safety Disclosures
Not applicable.

39
PART II
Item 5. Market for Registrant’s Common Equity, Related Stockholder Matters and Issuer Purchases of Equity Securities
Market Information for Common Stock
Our common stock trades on the NYSE under the symbol “IQV.”
Holders of Record
On February 12, 2019, we had approximately 40 stockholders of record as reported by our transfer agent. Holders of record are defined as those stockholders whose shares are registered in their names in our stock records and do not include beneficial owners of common stock whose shares are held in the names of brokers, dealers or clearing agencies.
Dividend Policy
We do not currently intend to pay dividends on our common stock, and no dividends were declared or paid in 2018 or 2017. However, we expect to reevaluate our dividend policy on a regular basis and may, subject to compliance with the covenants contained in our credit facilities and other considerations, determine to pay dividends in the future. The declaration, amount and payment of any future dividends on shares of our common stock will be at the sole discretion of our Board, which may take into account general and economic conditions, our financial condition and results of operations, our available cash and current and anticipated cash needs, capital requirements, contractual, legal, tax and regulatory restrictions, the implications of the payment of dividends by us to our stockholders or by our subsidiaries to us, and any other factors that our Board may deem relevant. Our long-term debt arrangements contain usual and customary restrictive covenants that, among other things, place limitations on our ability to declare dividends. For additional information regarding these restrictive covenants, see Part II, Item 7 “Management’s Discussion and Analysis of Financial Condition and Results of Operations—Liquidity and Capital Resources” and Note 10 to our audited consolidated financial statements included elsewhere in this Annual Report on Form 10-K.
Recent Sales of Unregistered Securities
We did not sell any unregistered equity securities in 2018.

40
Purchases of Equity Securities by the Issuer
On October 30, 2013, our Board of Directors (the “Board”) approved an equity repurchase program (the “Repurchase Program”) authorizing the repurchase of up to $125 million of either our common stock or vested in-the-money employee stock options, or a combination thereof. Our Board increased the stock repurchase authorization under the Repurchase Program with respect to the repurchase of our common stock by $600 million, $1.5 billion, $2 billion and $1.5 billion in 2015, 2016, 2017 and 2018, respectively, which increased the total amount that has been authorized under the Repurchase Program to $5.725 billion. The Repurchase Program does not obligate us to repurchase any particular amount of common stock or vested in-the-money employee stock options, and it may be modified, extended, suspended or discontinued at any time. The timing and amount of repurchases are determined by our management based on a variety of factors such as the market price of our common stock, our corporate requirements, and overall market conditions. Purchases of our common stock may be made in open market transactions effected through a broker-dealer at prevailing market prices, in block trades, or in privately negotiated transactions. We may also repurchase shares of our common stock pursuant to a trading plan meeting the requirements of Rule 10b5-1 under the Exchange Act, which would permit shares of our common stock to be repurchased when we might otherwise be precluded from doing so by law. Repurchases of vested in-the-money employee stock options were made through transactions between us and our employees (other than our executive officers, who were not eligible to participate in the program), and this aspect of the Repurchase Program expired in November 2013. The Repurchase Program for common stock does not have an expiration date.
From inception of the Repurchase Program through December 31, 2018, we have repurchased a total of $5,440 million of our securities under the Repurchase Program.
During the year ended December 31, 2018, we repurchased 12.6 million shares of our common stock at an average market price per share of $111.23 for an aggregate purchase price of $1,396 million under the Repurchase Program. These amounts include 6 million shares of our common stock that we repurchased directly from underwriters in connection with two secondary public offerings of shares of our common stock held by certain of our sponsors for an aggregate purchase price of $659 million. For additional information regarding our equity repurchases, see Part II, Item 7 “Management’s Discussion and Analysis of Financial Condition and Results of Operations—Liquidity and Capital Resources” and Note 13 to our audited consolidated financial statements included elsewhere in this Annual Report on Form 10-K.
As of December 31, 2018, we had remaining authorization to repurchase up to $285 million of our common stock under the Repurchase Program. In addition, from time to time, we have repurchased and may continue to repurchase common stock through private or other transactions outside of the Repurchase Program. On February 13, 2019, our Board authorized an increase in the post-merger share repurchase authorization by $2.0 billion, resulting in approximately $2.3 billion remaining authorization.
Since the Merger, we have repurchased 56.4 million shares of our common stock at an average market price per share of $89.12 for an aggregate purchase price of $5,026 million. This includes shares withheld from employees to satisfy certain tax obligations due in connection with grants of stock under the Quintiles IMS Holdings, Inc. 2017 Incentive and Stock Award Plan (the “Plan”). The Plan provides for the withholding of shares to satisfy tax obligations. It does not specify a maximum number of shares that can be withheld for this purpose. The shares of common stock withheld to satisfy tax withholding obligations may be deemed to be “issuer purchases” of shares that are required to be disclosed pursuant to this Item.
The following table summarizes the monthly equity repurchase activity for the three months ended December 31, 2018 and the approximate dollar value of shares that may yet be purchased pursuant to the Repurchase Program.
Period Total Number ofShares Purchased
Average PricePaid per Share
Total Number ofShares Purchased as
Part of PubliclyAnnounced
Plans or Programs
Approximate DollarValue of Shares That
May Yet Be PurchasedUnder the
Plans or Programs (in millions, except per share data)
October 1, 2018 – October 31, 2018 1.4 $ 120.53 1.4 $ 719 November 1, 2018 – November 30, 2018 2.9 $ 122.09 2.9 $ 362 December 1, 2018 – December 31, 2018 0.7 $ 110.45 0.7 $ 285 5.0 5.0

41
Stock Performance Graph
This performance graph shall not be deemed “filed” for purposes of Section 18 of the Exchange Act or incorporated by reference into any filing of IQVIA Holdings Inc. under the Exchange Act or under the Securities Act, except as shall be expressly set forth by specific reference in such filing.
The following graph shows a comparison from December 31, 2013 through December 31, 2018 of the cumulative total return for our common stock, the Standard & Poor’s 500 Stock Index (“S&P 500”) and a select peer group. The peer group consists of Cerner Corporation, Charles River Laboratories, Inc., Dun & Bradstreet Corporation, Equifax Inc., ICON plc, IHS Markit Ltd., Laboratory Corporation of America Holdings, Nielsen N.V., PRA Health Sciences, Inc., Syneos Health (formerly INC Research Holdings), Thomson Reuters Corporation and Verisk Analytics, Inc. The companies in our peer group are publicly traded information services, information technology or contract research companies, and thus share similar business model characteristics to IQVIA, or provide services to similar customers as IQVIA. Many of these companies are also used by our compensation committee for purposes of compensation benchmarking.
The graph assumes that $100 was invested in IQVIA, the S&P 500 and the peer group as of the close of market on December 31, 2013, assumes the reinvestments of dividends, if any. The S&P 500 and our peer group are included for comparative purposes only. They do not necessarily reflect management’s opinion that the S&P 500 and our peer group are an appropriate measure of the relative performance of the stock involved, and they are not intended to forecast or be indicative of possible future performance of our common stock.
12/31/2013 12/31/2014 12/31/2015 12/31/2016 12/31/2017 12/31/2018
IQVIA $ 100 $ 127 $ 148 $ 164 $ 211 $ 251 Peer Group $ 100 $ 111 $ 121 $ 124 $ 142 $ 132 S&P 500 $ 100 $ 111 $ 111 $ 121 $ 145 $ 136

42
Item 6. Selected Financial Data
We have derived the following consolidated statements of income data for 2018, 2017 and 2016 and consolidated balance sheet data as of December 31, 2018 and 2017 from our audited consolidated financial statements included elsewhere in this Annual Report on Form 10-K. We have derived the following consolidated statements of income data for 2015 and 2014 and consolidated balance sheet data as of December 31, 2016, 2015 and 2014 from our audited consolidated financial statements not included in this Annual Report on Form 10-K. You should read the consolidated financial data set forth below in conjunction with our consolidated financial statements and related notes included elsewhere in this Annual Report on Form 10-K and the information under Part II, Item 7, “Management’s Discussion and Analysis of Financial Condition and Results of Operations.” Effective January 1, 2018, we adopted the requirements of Accounting Standards Update (“ASU”) 2014-09, Revenue from Contracts with Customers (Topic 606) (“ASU 2014-09”) and ASU 2017-07, “Compensation—Retirement Benefits (Topic 715): Improving the Presentation of Net Periodic Pension Cost and Net Periodic Postretirement Benefit Cost” (“ASU 2017-07”) using the full retrospective method. As a result of the adoption of ASU 2014-09 and ASU 2017-07, the Company retrospectively adjusted related presentations. On October 3, 2016, we completed the Merger. We have included the results of operations of IMS Health from the date of the Merger and of acquired businesses from the respective date of acquisition. As a result, our period to period results of operations vary depending on the dates and sizes of the acquisitions. Accordingly, this selected financial data is not necessarily comparable or indicative of our future results. You should read this selected consolidated financial data in conjunction with our audited consolidated financial statements and related footnotes included elsewhere in this Annual Report on Form 10-K.
Year Ended December 31,
(in millions, except per share data) 2018 2017(4) 2016(4)(5) 2015 2014
Statement of Income Data: Revenues $ 10,412 $ 9,702 $ 6,815 $ 5,737 $ 5,460 Costs of revenue, exclusive of depreciation and amortization 6,746 6,301 4,748 4,116 3,959 Selling, general and administrative expenses 1,716 1,622 1,016 815 781 Depreciation and amortization 1,141 1,011 289 128 121 Impairment charges(1) — 40 28 2 — Restructuring costs 68 63 71 30 9 Merger related costs(2) — — 87 — — Income from operations 741 665 576 646 590 Interest expense, net 406 339 140 97 97 Loss on extinguishment of debt 2 19 31 8 — Other expense (income), net 5 13 (11) 2 (8)
Income before income taxes and equity in earnings (losses) of unconsolidated affiliates 328 294 416 539 501
Income tax expense (benefit)(3) 59 (992) 325 159 149 Income before equity in earnings (losses) of unconsolidated affiliates 269 1,286 91 380 352
Equity in earnings (losses) of unconsolidated affiliates 15 10 (4) 8 5 Net income 284 1,296 87 388 357
Net income attributable to non-controlling interests (25) (19) (15) (1) — Net income attributable to IQVIA Holdings Inc. $ 259 $ 1,277 $ 72 $ 387 $ 357
Year Ended December 31,
(in millions, except per share data) 2018 2017(4) 2016(4)(5) 2015 2014
Earnings per share attributable to common stockholders: Basic $ 1.27 $ 5.86 $ 0.48 $ 3.15 $ 2.78 Diluted $ 1.24 $ 5.74 $ 0.47 $ 3.08 $ 2.72 Cash dividends declared per common share $ — $ — $ — $ — $ — Weighted average common shares outstanding: Basic 203.7 217.8 149.1 123.0 128.0 Diluted 208.2 222.6 152.0 125.6 131.1

43
Year Ended December 31,
(in millions) 2018 2017(4) 2016(4)(5) 2015 2014
Statement of Cash Flow Data: Net cash provided by (used in):
Operating activities $ 1,254 $ 970 $ 860 $ 476 $ 433 Investing activities (810) (1,190) 1,731 (67) (173)Financing activities (452) (72) (2,284) (249) (130)
Other Financial Data: Capital expenditures $ (459) $ (369) $ (164) $ (78) $ (83)Cash dividend paid to common stockholders — — — — —
As of December 31,
(in millions) 2018 2017(4) 2016(4)(5) 2015 2014
Balance Sheet Data: Cash and cash equivalents $ 891 $ 959 $ 1,198 $ 977 $ 867 Investments in debt, equity and other securities 88 54 53 33 35 Trade accounts receivable and unbilled services, net 2,394 2,097 1,816 1,166 975 Property and equipment, net 434 440 406 188 190 Total assets 22,549 22,857 21,312 3,926 3,296 Total long-term liabilities 12,061 11,457 9,609 2,668 2,528 Total debt(6) 11,056 10,269 7,219 2,501 2,306 Total stockholders’ equity (deficit) 6,954 8,244 8,781 (336) (704)
(1) In 2017, we recognized $40 million of impairment losses for declines in fair value of goodwill and identifiable intangible assets in Encore, which we sold in the third quarter of 2017. In 2016, we recognized $28 million of impairment losses for declines in fair value of goodwill ($23 million) and identifiable intangible assets ($5 million) in Encore. In 2015, we wrote down $2 million related to long-lived assets.
(2) Merger related costs include the direct and incremental costs associated with the Merger. (3) Income tax expense in 2018 includes $(35) million related to finalization of SAB 118 and the impacts of GILTI and FDII. Income tax expense in
2017 includes $(966) million related to the enactment of the Tax Act and $(261) million related to purchase accounting amortization as a result of the Merger. Income tax expense in 2016 includes $252 million related to a change in our indefinitely reinvested assertion on our cumulative foreign earnings as a result of the Merger.
(4) As a result of the adoption of ASU 2014-09, we retrospectively adjusted 2017 and 2016 related presentations.(5) Includes the acquisition of IMS Health effective October 3, 2016. (6) Excludes $49 million, $44 million, $19 million, $33 million and $22 million of unamortized discounts and debt issuance costs as of December 31,
2018, 2017, 2016, 2015 and 2014.

44
Item 7. Management’s Discussion and Analysis of Financial Condition and Results of Operations
You should read the following discussion and analysis of our financial condition and results of operations together with our consolidated financial statements and the related notes included elsewhere in this Annual Report on Form 10-K. Some of the information contained in this discussion and analysis or set forth elsewhere in this Annual Report, including information with respect to our plans and strategy for our business, includes forward-looking statements that involve risks and uncertainties. You should read the “Risk Factors” section of this Annual Report for a discussion of important factors that could cause actual results to differ materially from the results described in or implied by the forward-looking statements contained in the following discussion and analysis.
Overview
IQVIA is a leading global provider of advanced analytics, technology solutions and contract research services to the life sciences industry. Formed through the Merger of IMS Health and Quintiles, IQVIA applies human data science – leveraging the analytic rigor and clarity of data science to the ever-expanding scope of human science – to enable companies to reimagine and develop new approaches to clinical development and commercialization, speed innovation, and accelerate improvements in healthcare outcomes. Powered by the IQVIA CORE™, we deliver unique and actionable insights at the intersection of large scale analytics, transformative technology and extensive domain expertise, as well as execution capabilities to help biotech, medical device, and pharmaceutical companies, medical researchers, government agencies, payers and other healthcare stakeholders tap into a deeper understanding of diseases, human behaviors and scientific advances, in an effort to advance their path toward cures. With more than 58,000 employees, we conduct operations in more than 100 countries.
We renamed two of our reportable segments during the second quarter of 2018. The reportable segment formerly known as Commercial Solutions is now named Technology & Analytics Solutions and the reportable segment formerly known as Integrated Engagement Services is now named Contract Sales & Medical Solutions. This is a name change only and there are no changes to the composition of either segment.
We are managed through three reportable segments, Technology & Analytics Solutions, Research & Development Solutions and Contract Sales & Medical Solutions. Technology & Analytics Solutions provides critical information, technology solutions and real-world insights and services to our life science clients. Research & Development Solutions, which primarily serves biopharmaceutical clients, is engaged in research and development and provides clinical research and clinical trial services. Contract Sales & Medical Solutions provides contract sales to both biopharmaceutical clients and the broader healthcare market.
For a description of our service offerings within our segments, refer to “Business” within Part I, Item 1, of this Annual Report on Form 10-K.
Effective January 1, 2018, we adopted the requirements of Accounting Standards Update (“ASU”) 2014-09, Revenue from Contracts with Customers (Topic 606) (“ASU 2014-09”) and ASU 2017-07, “Compensation—Retirement Benefits (Topic 715): Improving the Presentation of Net Periodic Pension Cost and Net Periodic Postretirement Benefit Cost” (“ASU 2017-07”) using the full retrospective method. As a result of the adoption of ASU 2014-09 and ASU 2017-07, we retrospectively adjusted 2017 and 2016 related presentations in our consolidated financial statements and amounts and disclosures set forth in this Annual Report on Form 10-K reflect these changes. See Note 1 to our audited consolidated financial statements included elsewhere in this Annual Report on Form 10-K for more information about these changes.
Industry Outlook
For information about the industry outlook and markets that we operate in, refer to “Our Market Outlook” within Part I, Item I of this Annual Report on Form 10-K.

45
Business Combinations
We have completed and will continue to consider strategic business combinations to enhance our capabilities and offerings in certain areas, including various individually immaterial acquisitions during the years ended December 31, 2018 and 2017. In October 2016, we completed the Merger to better serve our clients across their entire product lifecycle by (i) increasing the efficiency of healthcare companies’ commercial organizations through enhanced analytics and outsourcing services; (ii) improving clinical trial design, recruitment, and execution; and (iii) creating real-world information solutions based on the use of medicines by actual patients in normal situations.
These transactions were accounted for as business combinations and the acquired results of operations are included in our consolidated financial information since the acquisition date with a non-controlling interest for the portion that we do not own. See Note 14 to our audited consolidated financial statements included elsewhere in this Annual Report on Form 10-K for additional information with respect to these business combinations.
Sources of Revenue
Total revenues are comprised of revenues from the provision of our services. We do not have any material product revenues.
Costs and Expenses
Our costs and expenses are comprised primarily of our costs of revenue, reimbursed expenses and selling, general and administrative expenses. Costs of revenue include compensation and benefits for billable employees and personnel involved in production, trial monitoring, data management and delivery, and the costs of acquiring and processing data for our information offerings; costs of staff directly involved with delivering technology-related services offerings and engagements, related accommodations and the costs of data purchased specifically for technology services engagements; and other expenses directly related to service contracts such as courier fees, laboratory supplies, professional services and travel expenses. As noted above, reimbursed expenses are comprised principally of payments to investigators who oversee clinical trials and travel expenses for our clinical monitors and sales representatives. Selling, general and administrative expenses include costs related to sales, marketing, and administrative functions (including human resources, legal, finance, quality assurance, compliance and general management) for compensation and benefits, travel, professional services, training and expenses for information technology, facilities and depreciation and amortization.
Foreign Currency Translation
In 2018, approximately 40% of our revenues were denominated in currencies other than the United States dollar, which represents approximately 55 currencies. Because a large portion of our revenues and expenses are denominated in currencies other than the United States dollar and our financial statements are reported in United States dollars, changes in foreign currency exchange rates can significantly affect our results of operations. The revenue and expenses of our foreign operations are generally denominated in local currencies and translated into United States dollars for financial reporting purposes. Accordingly, exchange rate fluctuations will affect the translation of foreign results into United States dollars for purposes of reporting our consolidated results. As a result, we believe that providing the impact of fluctuations in foreign currency rates on certain financial results can facilitate the analysis of period-to-period comparisons of business performance that excludes the effects of foreign currency rate fluctuations. The constant currency information assumes the same foreign currency exchange rates that were in effect for the comparable prior-year period were used in translation of the current period results.

46
Consolidated Results of Operations
For information regarding our results of operations for Technology & Analytics Solutions, Research & Development Solutions and Contract Sales & Medical Solutions, refer to “Segment Results of Operations” later in this section.
Revenues
Change Year Ended December 31, 2018 vs. 2017 2017 vs. 2016
(dollars in millions) 2018 2017 2016 $ % $ %
Revenues $ 10,412 $ 9,702 $ 6,815 $ 710 7.3% $ 2,887 42.4%
2018 compared to 2017
In 2018, our revenues increased $710 million, or 7.3%, as compared to 2017. This increase was comprised of constant currency revenue growth of approximately $664 million, or 6.8%, and a positive impact of approximately $46 million from the effects of foreign currency fluctuations. The constant currency revenue growth was comprised of a $444 million increase in Technology & Analytics Solutions, a $332 million increase in Research & Development Solutions and a $112 million decrease in Contract Sales & Medical Solutions.
2017 compared to 2016
In 2017, our revenues increased $2,887 million, or 42.4%, as compared to 2016. This increase was comprised of constant currency revenue growth of approximately $2,869 million, or 42.1%, and a positive impact of approximately $18 million from the effects of foreign currency fluctuations. The constant currency revenue growth was comprised of a $2,508 million increase in Technology & Analytics Solutions, which includes $2,557 million from the Merger, partially offset by lower revenue from Encore during the first half of 2017 and the sale of Encore at the beginning of the third quarter of 2017, a $371 million increase in Research & Development Solutions and a $10 million decrease in Contract Sales & Medical Solutions.
Costs of Revenue, exclusive of Depreciation and Amortization
Year Ended December 31, (dollars in millions) 2018 2017 2016
Costs of revenue, exclusive of depreciation and amortization $ 6,746 $ 6,301 $ 4,748 % of revenues 64.8% 64.9% 69.7%
2018 compared to 2017
When compared to 2017, costs of revenue, exclusive of depreciation and amortization, in 2018 increased $445 million, or 7.1%. This increase included a constant currency increase of approximately $421 million, or 6.7%, and a negative impact of approximately $24 million from the effects of foreign currency fluctuations. The constant currency growth was comprised of a $361 million increase in Technology & Analytics Solutions, a $151 million increase in Research & Development Solutions and a $91 million decrease in Contract Sales & Medical Solutions.
As a percent of revenues, costs of revenue remained flat compared to 2017.
2017 compared to 2016
When compared to 2016, costs of revenue, exclusive of depreciation and amortization, in 2017 increased $1,553 million, or 32.7%. This increase included a constant currency increase of approximately $1,555 million, or 32.8%, partially offset by a positive impact of approximately $2 million from the effects of foreign currency fluctuations. The constant currency growth was comprised of a $1,263 million increase in Technology & Analytics Solutions, which included $1,302 million from the Merger, partially offset by lower costs from Encore during the first half of 2017 and the sale of Encore at the beginning of the third quarter of 2017, a $290 million increase in Research & Development Solutions and a $2 million increase in Contract Sales & Medical Solutions.
As a percent of revenues, costs of revenue declined in 2017 to 64.9% as compared to 69.7% in 2016. This decline was primarily due to the fact that 2017 includes a lower proportion of revenues from the lower margin Contract Sales & Medical Solutions segment, primarily as a result of the Merger.

47
Selling, General and Administrative Expenses
Year Ended December 31, (dollars in millions) 2018 2017 2016
Selling, general and administrative expenses $ 1,716 $ 1,622 $ 1,016 % of revenues 16.5% 16.7% 14.9%
2018 compared to 2017
The $94 million increase in selling, general and administrative expenses in 2018 as compared to 2017 included a constant currency increase of approximately $86 million, or 5.3%, and a negative impact of approximately $8 million from the effects of foreign currency fluctuations. The constant currency growth primarily consisted of a $47 million increase in Technology & Analytics Solutions, a $33 million increase in Research & Development Solutions and a $10 million increase in general corporate and unallocated expenses. These increases were partially offset by a $4 million decrease in Contract Sales & Medical Solutions.
2017 compared to 2016
The $606 million increase in selling, general and administrative expenses in 2017 as compared to 2016 included a constant currency increase of approximately $599 million, or 59.0%, and a negative impact of approximately $7 million from the effects of foreign currency fluctuations. The constant currency growth primarily consisted of a $491 million increase in Technology & Analytics Solutions, primarily from the Merger, a $6 million increase in Research & Development Solutions and a $111 million increase in general corporate and unallocated expenses. These increases were partially offset by a $9 million decrease in Contract Sales & Medical Solutions.
Depreciation and Amortization
Year Ended December 31, (dollars in millions) 2018 2017 2016
Depreciation and amortization $ 1,141 $ 1,011 $ 289 % of revenues 11.0% 10.4% 4.2%
The $130 million increase in depreciation and amortization in 2018 as compared to 2017 was primarily due to higher intangible asset balances as a result of acquisitions occurring in 2017 and 2018, increased amortization due to higher capitalized software balances and foreign currency fluctuations.
The $722 million increase in depreciation and amortization in 2017 as compared to 2016 was primarily due to the approximately $6.4 billion of intangible assets acquired in the Merger.
Impairment Charges
Year Ended December 31, (in millions) 2018 2017 2016
Impairment charges $ — $ 40 $ 28
During 2017 and 2016, we recognized $40 million and $28 million, respectively, of impairment losses for declines in fair value of goodwill and identifiable intangible assets in Encore. See Note 8 to our audited consolidated financial statements included elsewhere in this Annual Report on Form 10-K for additional information with respect to impairment charges.
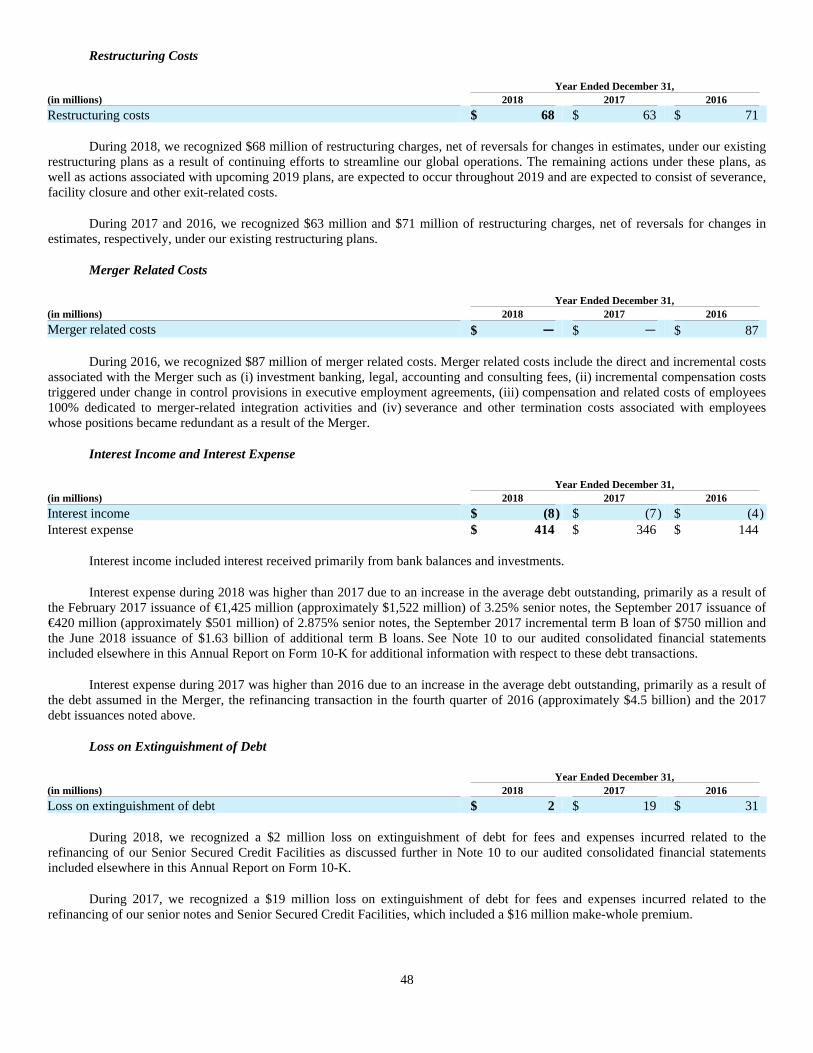
48
Restructuring Costs
Year Ended December 31, (in millions) 2018 2017 2016
Restructuring costs $ 68 $ 63 $ 71
During 2018, we recognized $68 million of restructuring charges, net of reversals for changes in estimates, under our existing restructuring plans as a result of continuing efforts to streamline our global operations. The remaining actions under these plans, as well as actions associated with upcoming 2019 plans, are expected to occur throughout 2019 and are expected to consist of severance, facility closure and other exit-related costs.
During 2017 and 2016, we recognized $63 million and $71 million of restructuring charges, net of reversals for changes in estimates, respectively, under our existing restructuring plans.
Merger Related Costs
Year Ended December 31, (in millions) 2018 2017 2016
Merger related costs $ — $ — $ 87
During 2016, we recognized $87 million of merger related costs. Merger related costs include the direct and incremental costs associated with the Merger such as (i) investment banking, legal, accounting and consulting fees, (ii) incremental compensation costs triggered under change in control provisions in executive employment agreements, (iii) compensation and related costs of employees 100% dedicated to merger-related integration activities and (iv) severance and other termination costs associated with employees whose positions became redundant as a result of the Merger.
Interest Income and Interest Expense
Year Ended December 31, (in millions) 2018 2017 2016
Interest income $ (8) $ (7) $ (4)Interest expense $ 414 $ 346 $ 144
Interest income included interest received primarily from bank balances and investments.
Interest expense during 2018 was higher than 2017 due to an increase in the average debt outstanding, primarily as a result of the February 2017 issuance of €1,425 million (approximately $1,522 million) of 3.25% senior notes, the September 2017 issuance of €420 million (approximately $501 million) of 2.875% senior notes, the September 2017 incremental term B loan of $750 million and the June 2018 issuance of $1.63 billion of additional term B loans. See Note 10 to our audited consolidated financial statements included elsewhere in this Annual Report on Form 10-K for additional information with respect to these debt transactions.
Interest expense during 2017 was higher than 2016 due to an increase in the average debt outstanding, primarily as a result of the debt assumed in the Merger, the refinancing transaction in the fourth quarter of 2016 (approximately $4.5 billion) and the 2017 debt issuances noted above.
Loss on Extinguishment of Debt
Year Ended December 31, (in millions) 2018 2017 2016
Loss on extinguishment of debt $ 2 $ 19 $ 31
During 2018, we recognized a $2 million loss on extinguishment of debt for fees and expenses incurred related to the refinancing of our Senior Secured Credit Facilities as discussed further in Note 10 to our audited consolidated financial statements included elsewhere in this Annual Report on Form 10-K.
During 2017, we recognized a $19 million loss on extinguishment of debt for fees and expenses incurred related to the refinancing of our senior notes and Senior Secured Credit Facilities, which included a $16 million make-whole premium.

49
In the fourth quarter of 2016, we recognized a $31 million loss on extinguishment of debt related to the refinancing of our Senior Secured Credit Facilities. The loss on extinguishment of debt included an $8 million make-whole premium, $9 million of unamortized debt issuance costs and $14 million of unamortized discount.
See “—Liquidity and Capital Resources” for more information on these transactions.
Other Expense (Income), Net
Year Ended December 31, (in millions) 2018 2017 2016
Other expense (income), net $ 5 $ 13 $ (11)
Other expense, net for 2018 primarily consisted of an increase in fair value of acquisition-related contingent consideration and foreign currency net losses partially offset by positive returns on pension assets.
Other expense, net for 2017 primarily consisted of foreign currency net losses partially offset by higher return on pension assets and investment gains. The foreign currency losses in 2017 were primarily the result of the combination of changes in intercompany loan balances from corporate legal entity integration and a weaker U.S. dollar.
Other income, net for 2016 primarily consisted of a gain on the sale of a cost basis investment partially offset by foreign currency net losses.
Income Tax Expense (Benefit)
Year Ended December 31, (dollars in millions) 2018 2017 2016
Income tax expense (benefit) $ 59 $ (992) $ 325 Effective income tax rate 18.0% (337.4)% 78.1%
On December 22, 2017, the U.S. government enacted the Tax Act. The Tax Act is comprehensive legislation that includes provisions that lower the federal corporate income tax rate from 35% to 21% beginning in 2018 and imposes a one-time transition tax on undistributed foreign earnings. ASC 740 “Income Taxes” generally requires the effects of the tax law change to be recorded in the period of enactment. However, the SEC staff issued Staff Accounting Bulletin No. 118 (“SAB 118”) to address situations when a registrant does not have the necessary information available, prepared, or analyzed (including computations) in reasonable detail to complete the accounting for certain income tax effects of the Tax Act. During the fourth quarter of 2017, we recognized the tax impacts related to the transition tax on undistributed foreign earnings and the impact to deferred tax assets and liabilities and included these amounts in our consolidated financial statements on a provisional basis. During the fourth quarter of 2018, we completed our accounting for SAB 118 that resulted in a full year benefit of $35 million related to the transition tax. Additionally, in 2018 as a result of the new provisions of the Tax Act, we recorded a benefit of $25 million related to Foreign Derived Intangible Income (“FDII”) as well as a tax expense of $35 million related to GILTI. Our effective income tax rate was also favorably impacted by a tax benefit of $188 million related to purchase accounting amortization of approximately $813 million as a result of the Merger.
For 2017, we recorded a provisional deferred tax benefit of $966 million related to the revaluation of deferred taxes at the newly enacted 21% rate and the reversal of the deferred tax liability on undistributed foreign earnings net of the newly enacted transition tax. We no longer consider any of our foreign earnings to be indefinitely reinvested. Our effective income tax rate was also favorably impacted by a tax benefit of $261 million related to purchase accounting amortization of approximately $763 million as a result of the Merger.
In 2016, due to the Merger, we reevaluated our indefinite reinvestment assertion based on the need for cash in the United States, including funding the Repurchase Program and potential acquisitions. Accordingly, we changed our assertion with respect to $2,801 million of foreign earnings, including $1,865 million of IMS Health’s previously undistributed historical foreign earnings. Deferred income taxes of $625 million were recorded in 2016 related to non-indefinitely reinvested foreign earnings. Of that amount, $373 million was recorded through purchase accounting related to IMS Health’s historical foreign earnings and the remainder of $252 million was recorded through deferred income tax expense.
In January of 2019, the U.S. Treasury Department issued final regulations regarding the transition tax. We are in the process of reviewing these regulations to determine if there is an impact on our effective income tax rate.

50
Equity in Earnings (Losses) of Unconsolidated Affiliates
Year Ended December 31, (in millions) 2018 2017 2016
Equity in earnings (losses) of unconsolidated affiliates $ 15 $ 10 $ (4)
Equity in earnings (losses) of unconsolidated affiliates primarily included earnings from our investment in NovaQuest Pharma Opportunities Fund III, L.P. See Note 4 to our audited consolidated financial statements included elsewhere in this Annual Report on Form 10-K for additional information with respect to this fund.
Net Income Attributable to Non-controlling Interests
Year Ended December 31, (in millions) 2018 2017 2016
Net income attributable to non-controlling interests $ (25) $ (19) $ (15)
Net income attributable to non-controlling interests primarily included Quest’s interest in Q2 Solutions.
Segment Results of Operations
Revenues and profit by segment are as follows:
Segment Revenues Segment Profit (in millions) 2018 2017 2016 2018 2017 2016
Technology & Analytics Solutions $ 4,137 $ 3,682 $ 1,148 $ 1,023 $ 996 $ 235 Research & Development Solutions 5,465 5,105 4,737 1,128 957 875 Contract Sales & Medical Solutions 810 915 930 59 74 78 Total 10,412 9,702 6,815 2,210 2,027 1,188 General corporate and unallocated (260) (248) (137)Depreciation and amortization (1,141) (1,011) (289)Impairment charges — (40) (28)Restructuring costs (68) (63) (71)Merger related costs — — (87)Consolidated $ 10,412 $ 9,702 $ 6,815 $ 741 $ 665 $ 576
Certain costs are not allocated to our segments and are reported as general corporate and unallocated expenses. These costs primarily consist of stock-based compensation and expenses for corporate overhead functions such as senior leadership, finance, human resources, information technology, facilities and legal. In addition, we do not allocate depreciation and amortization, impairment charges, restructuring costs, or merger related costs to our segments.

51
Technology & Analytics Solutions
Year Ended December 31, Change (dollars in millions) 2018 2017 2016 2018 vs. 2017 2017 vs. 2016
Revenues $ 4,137 $ 3,682 $ 1,148 $ 455 12.4% $ 2,534 220.7%Costs of revenue, exclusive of depreciation and amortization 2,343 1,967 695 376 19.1 1,272 183.0 Selling, general and administrative expenses 771 719 218 52 7.2 501 229.8 Segment profit $ 1,023 $ 996 $ 235 $ 27 2.7% $ 761 323.8%
Revenues
2018 compared to 2017
Technology & Analytics Solutions’ revenues were $4,137 million in 2018, an increase of $455 million, or 12.4%, over 2017. This increase was comprised of constant currency revenue growth of approximately $444 million, or 12.1%, and a positive impact of approximately $11 million from the effects of foreign currency fluctuations. The constant currency growth resulted primarily from revenue growth in the Americas region as well as the Europe and Africa region. The revenue growth in these regions was due to higher revenues across technology solutions and real-world and analytical services as well as incremental revenue from acquisitions.
2017 compared to 2016
Technology & Analytics Solutions’ revenues were $3,682 million in 2017, an increase of $2,534 million, or 220.7%, over 2016. This increase was comprised of constant currency revenue growth of approximately $2,508 million, or 218.5%, and a positive impact of approximately $26 million from the effects of foreign currency fluctuations. The constant currency increase included the incremental impact from the Merger of $2,557 million, including post-Merger acquisitions, partially offset by a decline in revenue from Encore during the first half of 2017 and the sale of Encore at the beginning of the third quarter of 2017.
Costs of Revenue, exclusive of Depreciation and Amortization
2018 compared to 2017
Technology & Analytics Solutions’ costs of revenue, exclusive of depreciation and amortization, were $2,343 million in 2018, an increase of $376 million over 2017. This increase was comprised of constant currency growth of approximately $361 million, or 18.4%, and a negative impact of approximately $15 million from the effects of foreign currency fluctuations. The constant currency increase was primarily due to an increase in compensation and related expenses to support revenue growth and incremental costs from acquisitions.
2017 compared to 2016
Technology & Analytics Solutions’ costs of revenue, exclusive of depreciation and amortization, were $1,967 million in 2017, an increase of $1,272 million over 2016. This increase was comprised of constant currency growth of approximately $1,263 million, or 181.7%, and a negative impact of approximately $9 million from the effects of foreign currency fluctuations. The constant currency increase included the incremental impact from the Merger of $1,302 million, including post-Merger acquisitions, partially offset by lower costs from Encore due to lower revenue volumes during the first half of 2017 and the sale of Encore at the beginning of the third quarter of 2017.

52
Selling, General and Administrative Expenses
2018 compared to 2017
Technology & Analytics Solutions’ selling, general and administrative expenses increased $52 million in 2018 as compared to 2017. This increase was comprised of a constant currency increase of approximately $47 million, or 6.5%, and a negative impact of approximately $5 million from the effects of foreign currency fluctuations. The constant currency increase was primarily related to an increase in compensation and related expenses from higher headcount to support growth and incremental costs from acquisitions.
2017 compared to 2016
Technology & Analytics Solutions’ selling, general and administrative expenses increased $501 million in 2017 as compared to 2016. This increase was comprised of a constant currency increase of approximately $491 million, or 225.2%, and a negative impact of approximately $10 million from the effects of foreign currency fluctuations. The constant currency increase was primarily due to the incremental impact from the Merger, including post-Merger acquisitions.
Research & Development Solutions
Year Ended December 31, Change (dollars in millions) 2018 2017 2016 2018 vs. 2017 2017 vs. 2016
Revenues $ 5,465 $ 5,105 $ 4,737 $ 360 7.1% $ 368 7.8%Costs of revenue, exclusive of depreciation and amortization 3,721 3,566 3,283 155 4.3 283 8.6 Selling, general and administrative expenses 616 582 579 34 5.8 3 0.5 Segment profit $ 1,128 $ 957 $ 875 $ 171 17.9% $ 82 9.4%
Backlog
Research and Development Solutions contracted backlog was $17.13 billion at December 31, 2018 and we expect approximately $4.8 billion of this backlog to convert to revenue in the next 12 months. Contracted backlog was $14.84 billion at December 31, 2017. The December 31, 2017 backlog amount has been updated to reflect the adoption of the new revenue standard.
Backlog represents, at a particular point in time, future revenues from work not yet completed or performed under signed contracts. Once work begins on a project, revenues are recognized over the duration of the project. Backlog denominated in foreign currencies are valued each month using the actual average foreign exchange rates in effect during the month.
We believe that backlog may not be a consistent indicator of future revenues because backlog has been and likely will be affected by a number of factors, including the variable size and duration of projects, many of which are performed over several years, cancellations, and changes to the scope of work during the course of projects. Projects that have been delayed remain in backlog, but the timing of the revenue generated may differ from the timing originally expected. Additionally, projects may be terminated or delayed by the customer or delayed by regulatory authorities. In the event that a client cancels a contract, we typically would be entitled to receive payment for all services performed up to the cancellation date and subsequent client-authorized services related to winding down the canceled project. For more details regarding risks related to our backlog, see Part I, Item IA, “Risk Factors—Risks Related to our Business—The relationship of backlog to revenues varies over time.”
Revenues
2018 compared to 2017
Research & Development Solutions’ revenues were $5,465 million in 2018, an increase of $360 million, or 7.1%, over 2017. This increase was comprised of constant currency revenue growth of approximately $332 million, or 6.5%, and a positive impact of approximately $28 million from the effects of foreign currency fluctuations.
The constant currency growth primarily included volume-related increases in clinical, data management and life cycle safety services, increased lab testing volumes and incremental revenue from acquisitions.
53
2017 compared to 2016
Research & Development Solutions’ revenues were $5,105 million in 2017, an increase of $368 million, or 7.8%, over 2016. This increase was comprised of constant currency revenue growth of approximately $371 million, or 7.8%, partially offset by a negative impact of approximately $3 million from the effects of foreign currency fluctuations.
The constant currency revenue growth primarily included volume-related increases from our clinical solutions and services and our clinical trial support services as well as revenue from acquisitions, partially offset by lower revenue from early clinical development services, due to a facility closure in Europe in 2016.
Costs of Revenue, exclusive of Depreciation and Amortization
2018 compared to 2017
Research & Development Solutions’ costs of revenue, exclusive of depreciation and amortization, increased $155 million, or 4.3%, in 2018 as compared to 2017. This increase included a constant currency increase of approximately $151 million, or 4.2%, and a negative impact of approximately $4 million from the effects of foreign currency fluctuations.
The constant currency increase was primarily due to an increase in reimbursed expenses and an increase in compensation and related expenses as well as incremental costs from acquisitions. Compensation and related expenses increased as a result of headcount to support revenue growth and our next generation of clinical development capabilities, which include analytics-driven methods and technology to optimize trial design.
2017 compared to 2016
Research & Development Solutions’ costs of revenue, exclusive of depreciation and amortization, increased $283 million, or 8.6%, in 2017 as compared to 2016. This increase included a constant currency increase of approximately $290 million, or 8.8%, partially offset by a positive impact of approximately $7 million from the effects of foreign currency fluctuations.
The constant currency increase was primarily due to an increase in reimbursed expenses, compensation and related expenses and the impact from post-Merger acquisitions. The increase in compensation and related expenses resulted from (i) an increase in billable headcount resulting from the higher volume of constant currency revenue, (ii) our continued investment in our global delivery network (“GDN”) that enables us to provide standardized, centrally-managed services from seven hub locations across five countries, and (iii) an increase in competition for qualified personnel in certain markets.
Selling, General and Administrative Expenses
2018 compared to 2017
Research & Development Solutions’ selling, general and administrative expenses increased $34 million, or 5.8%, in 2018 as compared to 2017, which included a constant currency increase of approximately $33 million, or 5.7%, and a negative impact of approximately $1 million from the effects of foreign currency fluctuations. The constant currency increase was primarily related to higher compensation and related expenses due to increased headcount to support growth and our next generation of clinical development capabilities, as well as incremental costs from acquisitions.
2017 compared to 2016
Research & Development Solutions’ selling, general and administrative expenses increased $3 million, or 0.5%, in 2017 as compared to 2016, which included a constant currency increase of approximately $6 million, or 1.0%, partially offset by a positive impact of approximately $3 million from the effects of foreign currency fluctuations. The constant currency increase was primarily due to the impact of post-Merger acquisitions, partially offset by lower incentive compensation and bad debt expense.

54
Contract Sales & Medical Solutions
Year Ended December 31, Change (dollars in millions) 2018 2017 2016 2018 vs. 2017 2017 vs. 2016
Revenues $ 810 $ 915 $ 930 $ (105) (11.5)% $ (15) (1.6)%Costs of revenue, exclusive of depreciation and amortization 682 768 770 (86) (11.2) (2) (0.3)Selling, general and administrative expenses 69 73 82 (4) (5.5) (9) (11.0)Segment profit $ 59 $ 74 $ 78 $ (15) (20.3)% $ (4) (5.1)%
Revenues
2018 compared to 2017
Contract Sales & Medical Solutions’ revenues were $810 million in 2018, a decrease of $105 million, or 11.5%, over 2017. This decrease was comprised of a constant currency revenue decline of approximately $112 million, or 12.2%, partially offset by a positive impact of approximately $7 million from the effects of foreign currency fluctuations. The decline in constant currency revenues was largely due to cancellations in 2017 in the Americas region and reduced volume in the Asia-Pacific region.
2017 compared to 2016
Contract Sales & Medical Solutions’ revenues were $915 million in 2017, a decrease of $15 million, or 1.6%, over 2016. This decrease was comprised of a constant currency revenue decline of approximately $10 million, or 1.1%, and a negative impact of approximately $5 million from the effects of foreign currency fluctuations. The decline in constant currency revenues was due to lower demand in Japan and North America, which was also a result of cancellations that occurred in 2017. The decline was also due to a $9 million benefit from the acceleration of revenue in the second quarter of 2016 that did not recur in 2017 related to a contract modification on a sales force arrangement that fixed a portion of the contract price that was previously not determinable until future sales-based royalties were known, partially offset by revenue from new projects starting up, primarily in Europe.
Costs of Revenue, exclusive of Depreciation and Amortization
2018 compared to 2017
Contract Sales & Medical Solutions’ costs of revenue, exclusive of depreciation and amortization, decreased $86 million, or 11.2%, in 2018 as compared to 2017. This decrease included a constant currency decline of approximately $91 million, or 11.8%, partially offset by approximately $5 million from the negative effects of foreign currency fluctuations. The constant currency cost of revenue decrease was due to a decrease in compensation and related expenses resulting from a decrease in billable headcount.
2017 compared to 2016
Contract Sales & Medical Solutions’ costs of revenue, exclusive of depreciation and amortization, decreased $2 million, or 0.3%, in 2017 as compared to 2016. This decrease included constant currency growth of approximately $2 million, or 0.3%, more than offset by approximately $4 million from the positive effects of foreign currency fluctuations. The constant currency cost of revenue growth was due to an increase in compensation and related expenses resulting from an increase in billable headcount in Europe as a result of an increase in new projects starting up in the 2017 period.
Selling, General and Administrative Expenses
2018 compared to 2017
Contract Sales & Medical Solutions’ selling, general and administrative expenses decreased $4 million, or 5.5%, in 2018 as compared to 2017, primarily due to lower compensation and related expenses resulting from a reduction in headcount.
2017 compared to 2016
Contract Sales & Medical Solutions’ selling, general and administrative expenses decreased $9 million, or 11.0%, in 2017 as compared to 2016, primarily due to lower compensation and related expenses resulting from a decrease in headcount.

55
Liquidity and Capital Resources
Overview
We assess our liquidity in terms of our ability to generate cash to fund our operating, investing and financing activities. Our principal source of liquidity is operating cash flows. In addition to operating cash flows, other significant factors that affect our overall management of liquidity include: capital expenditures, acquisitions, investments, debt service requirements, dividends, equity repurchases, adequacy of our revolving credit and receivables financing facilities, and access to the capital markets.
We manage our worldwide cash requirements by monitoring the funds available among our subsidiaries and determining the extent to which those funds can be accessed on a cost-effective basis. The repatriation of cash balances from certain of our subsidiaries could have adverse tax consequences; however, those balances are generally available without legal restrictions to fund ordinary business operations. We have and expect to transfer cash from those subsidiaries to the United States and to other international subsidiaries when it is cost effective to do so.
We had a cash balance of $891 million at December 31, 2018 ($212 million of which was in the United States), a decrease from $959 million at December 31, 2017.
Based on our current operating plan, we believe that our available cash and cash equivalents, future cash flows from operations and our ability to access funds under our revolving credit and receivables financing facilities will enable us to fund our operating requirements and capital expenditures and meet debt obligations for at least the next 12 months. We regularly evaluate our debt arrangements, as well as market conditions, and from time to time we may explore opportunities to modify our existing debt arrangements or pursue additional financing arrangements that could result in the issuance of new debt securities by us or our affiliates. We may use our existing cash, cash generated from operations or dispositions of assets or businesses and/or proceeds from any new financing arrangements or issuances of debt or equity securities to repay or reduce some of our outstanding obligations, to repurchase shares from our stockholders or for other purposes. As part of our ongoing business strategy, we also continually evaluate new acquisition, expansion and investment possibilities or other strategic growth opportunities, as well as potential dispositions of assets or businesses, as appropriate, including dispositions that may cause us to recognize a loss on certain assets. Should we elect to pursue any such transaction, we may seek to obtain debt or equity financing to facilitate those activities. Our ability to enter into any such potential transactions and our use of cash or proceeds is limited to varying degrees by the terms and restrictions contained in our existing debt arrangements. We cannot provide assurances that we will be able to complete any such financing arrangements or other transactions on favorable terms or at all.
Equity Repurchase Program
On October 30, 2013, our Board approved the Repurchase Program authorizing the repurchase of up to $125 million of either our common stock or vested in-the-money employee stock options, or a combination thereof. Our Board increased the stock repurchase authorization under the Repurchase Program with respect to the repurchase of our common stock by $600 million, $1.5 billion, $2 billion and $1.5 billion in 2015, 2016, 2017 and 2018, respectively, which increased the total amount that has been authorized under the Repurchase Program to $5.725 billion. The Repurchase Program does not obligate us to repurchase any particular amount of common stock or vested in-the-money employee stock options, and it may be modified, suspended or discontinued at any time. The timing and amount of repurchases are determined by our management based on a variety of factors such as the market price of our common stock, our corporate requirements, and overall market conditions. Purchases of our common stock may be made in open market transactions effected through a broker-dealer at prevailing market prices, in block trades, or in privately negotiated transactions. The Repurchase Program for common stock does not have an expiration date.
During the year ended December 31, 2018, we repurchased 12.6 million shares of our common stock at an average market price per share of $111.23 for an aggregate purchase price of $1,396 million under the Repurchase Program. These amounts include 6.0 million shares of our common stock, which we repurchased directly from underwriters in connection with two secondary public offerings of shares of our common stock held by certain of our sponsors for an aggregate purchase price of $659 million. During the year ended December 31, 2017, we repurchased 30.9 million shares of our common stock for approximately $2.6 billion. These amounts include 9.7 million shares of our common stock, which we repurchased from certain of our principal stockholders in a private transaction for approximately $750 million and 10.1 million shares of our common stock, which we repurchased directly from underwriters in connection with three separate underwritten, secondary public offerings of shares of our common stock held by certain of our principal stockholders for approximately $935 million in the aggregate in May, September and November 2017. Additional information regarding the Repurchase Program is presented in Part II, Item 5 “Market for Registrant’s Common Equity, Related Stockholder Matters and Issuer Purchases of Equity Securities” and Note 13 to our audited consolidated financial statements included elsewhere in this Annual Report on Form 10-K.

56
As of December 31, 2018, we had remaining authorization to repurchase up to $285 million of our common stock under our Repurchase Program. In addition, from time to time, we have repurchased and may continue to repurchase common stock through private or other transactions outside of our Repurchase Program. On February 13, 2019, our Board authorized an increase in the post-merger share repurchase authorization by $2.0 billion, resulting in approximately $2.3 billion remaining authorization.
Debt
As of December 31, 2018, we had $11.1 billion of total indebtedness, excluding $880 million of available borrowings under our revolving credit facilities. See Note 10 to our audited consolidated financial statements included elsewhere in this Annual Report on Form 10-K for additional details regarding our credit arrangements.
Senior Secured Credit Agreement and Senior Notes
At December 31, 2018, our Fourth Amended and Restated Credit Agreement, as amended (the “Credit Agreement”) provided financing through several senior secured credit facilities (collectively, the “Senior Secured Credit Facilities”) of up to approximately $6,959 million, which consisted of $6,079 million principal amount of debt outstanding and $880 million of available borrowing capacity on the $1,500 million revolving credit facility that expires in 2023. The revolving credit facility is comprised of a $675 million senior secured revolving facility available in U.S. dollars, a $600 million senior secured revolving facility available in U.S. dollars, Euros, Swiss Francs and other foreign currencies, and a $225 million senior secured revolving facility available in U.S. dollars and Yen. The term A loans and revolving credit facility under the Credit Agreement mature in June 2023, while the term B loans under the Credit Agreement mature in 2024 and 2025. We are required to make scheduled quarterly payments on the term A loans equal to 1.25% of the original principal amount, with the remaining balance paid at maturity. We are required to make scheduled quarterly payments on the term B loans equal to approximately 0.25% of the original principal amount, with the remaining balance paid at maturity. In addition, beginning with fiscal year ending December 31, 2017, we were required to apply 50% of excess cash flow (as defined in the Credit Agreement), subject to a reduction to 25% or 0% depending upon our senior secured first lien net leverage ratio, for prepayment of the term loans, with any such prepayment to be applied toward principal payments due in subsequent quarters. We are also required to pay an annual commitment fee that ranges from 0.20% to 0.35% in respect of any unused commitments under the revolving credit facility. The Senior Secured Credit Facilities are collateralized by substantially all of our assets and the assets of our material domestic subsidiaries including 100% of the equity interests of substantially all of our material domestic subsidiaries and 66% of the equity interests of substantially all of our first-tier material foreign subsidiaries and their domestic subsidiaries.
2018 Financing Transactions
On April 6, 2018, we amended our credit agreement to increase our revolving credit facility borrowing capacity to $1.5 billion.
On June 11, 2018, we amended our credit agreement (the “Amendment”) to extend the maturity of our existing term A loans and revolving credit facility to 2023 and reduce the applicable interest rate to LIBOR plus a margin ranging from 1.25% to 2.00%. In connection with this Amendment, we recognized a $2 million loss on extinguishment of debt, which includes fees and related expenses.
Under the Amendment, we also placed additional term B loans. The additional term B loans will mature in 2025 and were comprised of $950 million of U.S. dollar denominated term B loans and €583 million ($681 million) Euro denominated term B loans. The U.S. dollar denominated term B loans bear interest based on the U.S. Dollar LIBOR plus a margin ranging from 1.75% to 2.00%. The Euro denominated term B loans bear interest based on the Euro LIBOR with a floor ranging from 0.50% to 0.75%, plus a margin of 2.00%. The proceeds of the additional term B loans were used to pay down the revolving credit facility and $650 million of existing term B loans due 2024 and to pay fees and expenses in connection with the transactions.

57
2017 Financing Transactions
During the first quarter of 2017, we issued €1.425 billion (approximately $1,522 million) of senior notes due 2025. The senior notes mature on March 15, 2025 and bear an annual interest rate of 3.25%, which is paid semi-annually on March 15 and September 15, beginning on September 15, 2017. Also, during the first quarter of 2017, we refinanced our term B loans in which the maturity was extended to 2024 and the interest rate margin on the loan denominated in U.S. dollars was reduced from 2.50% to 2.00% and the interest rate margin on the loan denominated in Euros was reduced from 2.75% to 2.00%.
During the third quarter of 2017, we issued €420 million (approximately $501 million) of senior notes due 2025. The senior notes mature on September 15, 2025 and bear an interest rate of 2.875%, which is paid semi-annually on March 15 and September 15, beginning on March 15, 2018. Also, during the third quarter of 2017, we entered into an amendment to provide for an incremental term B loan of $750 million and an increase in restricted payment capacity. The term B loan will mature in 2025 and bears a floating interest rate of LIBOR plus 2.00% per year. The net proceeds from the senior notes due 2025 and the incremental term B loan were used for the redemption of the outstanding 4.125% Euro denominated senior notes due 2023, to pay down the revolving credit facility, to pay certain fees and expenses and for other general corporate purposes, including the repurchase of our common stock and acquisitions.
Receivables Financing Facility
On December 5, 2014, we entered into a four-year arrangement to securitize certain of our accounts receivable. Under the receivables financing facility, certain of our accounts receivable are sold on a non-recourse basis by certain of our consolidated subsidiaries to another of our consolidated subsidiaries, a bankruptcy-remote special purpose entity (“SPE”). The SPE obtained a term loan and revolving loan commitment from a third-party lender, secured by liens on the assets of the SPE, to finance the purchase of the accounts receivable, which includes a $275 million term loan and a $25 million revolving loan commitment. The revolving loan commitment may be increased by an additional $35 million as amounts are repaid under the term loan. IQVIA has guaranteed the performance of the obligations of existing and future subsidiaries that sell and service the accounts receivable under the receivables financing facility. The assets of the SPE are not available to satisfy any of our obligations or any obligations of our subsidiaries. On December 15, 2017, we amended our receivables financing facility to extend the original term of the facility to December 15, 2020. In addition, the applicable margin (over LIBOR) changed to 90 bps regardless of our credit rating. Prior to the amendment, the margin was based on our credit rating and could range from 85 bps to 135 bps. As of December 31, 2018, no additional amounts of revolving loans were available under the receivables financing facility.
Restrictive Covenants
Our Credit Agreement provides for certain covenants and events of default customary for similar instruments, including a covenant not to exceed a specified ratio of consolidated senior secured net indebtedness to Consolidated EBITDA, as defined in the Credit Agreement and a covenant to maintain a specified minimum interest coverage ratio. If an event of default occurs under any of our financing arrangements, the creditors under such financing arrangements will be entitled to take various actions, including the acceleration of amounts due under such arrangements, and in the case of the lenders under the Credit Agreement, other actions permitted to be taken by a secured creditor. Our long-term debt arrangements contain usual and customary restrictive covenants that, among other things, place limitations on our ability to declare dividends. For additional information regarding these restrictive covenants, see Part II, Item 5 “Market for Registrant’s Common Equity, Related Stockholder Matters and Issuer Purchases of Equity Securities—Dividend Policy” and Note 10 to our audited consolidated financial statements included elsewhere in this Annual Report on Form 10-K. At December 31, 2018, we were in compliance in all material respects with the financial covenants under our financing arrangements.

58
Years ended December 31, 2018, 2017 and 2016
Cash Flow from Operating Activities
Year Ended December 31, (in millions) 2018 2017 2016
Net cash provided by operating activities $ 1,254 $ 970 $ 860
2018 compared to 2017
Cash provided by operating activities increased $284 million in 2018 as compared to 2017. The increase is primarily due to higher cash-related net income of $135 million as well as higher accounts payable and accrued expenses, partially offset by an increase in accounts receivable and unbilled services due to timing of invoicing and higher payments for interest.
2017 compared to 2016
Cash provided by operating activities increased $110 million in 2017 as compared to 2016. Cash flows from operating activities reflects higher cash-related net income of $640 million, offset by higher payments for interest, income taxes and normal fluctuations in cash collections from clients and accounts payable. Cash collections from clients can vary significantly each year depending on the timing of cash receipts under contractual payment terms relative to the recognition of revenue over a project lifecycle and the timing of renewals.
Cash Flow from Investing Activities
Year Ended December 31, (in millions) 2018 2017 2016
Net cash (used in) provided by investing activities $ (810) $ (1,190) $ 1,731
2018 compared to 2017
Cash used in investing activities decreased $380 million in 2018 as compared to 2017. The decrease was primarily due to lower cash used for the acquisition of businesses ($545 million) partially offset by an increase in cash used for acquisition of property, equipment and software ($90 million), an increase in investments in equity securities ($23 million) and an increase in investments in unconsolidated affiliates ($32 million).
2017 compared to 2016
During 2017, we had net cash outflows from investing activities, while during 2016, we had net cash inflows. The decrease of $2,921 million in our net cash flows from investing activities was primarily due to cash from the acquisition of businesses, including the Merger in 2016 ($1,887 million), cash used for the acquisition of businesses in 2017 ($854 million) and higher cash used for the acquisition of property, equipment and software in 2017 ($205 million).
Cash Flow from Financing Activities
Year Ended December 31, (in millions) 2018 2017 2016
Net cash used in financing activities $ (452) $ (72) $ (2,284)
2018 compared to 2017
Cash used in financing activities increased $380 million in 2018 as compared to 2017. The increase in cash used in financing activities was primarily related to lower net borrowings under our credit facilities ($1,470 million), partially offset by less cash used to repurchase common stock ($1,215 million).
2017 compared to 2016
Cash used in financing activities decreased $2,212 million in 2017 as compared to 2016. The decrease in cash used in financing activities was primarily related to higher net borrowings under our credit facilities ($3,781 million), partially offset by higher cash used to repurchase common stock ($1,523 million).

59
Contingencies
We are exposed to certain known contingencies that are material to our investors. The facts and circumstances surrounding these contingencies and a discussion of their effect on us are in Note 12 to our audited consolidated financial statements included elsewhere in this Annual Report on Form 10-K. These contingencies may have a material effect on our liquidity, capital resources or results of operations. In addition, even where our reserves are adequate, the incurrence of any of these liabilities may have a material effect on our liquidity and the amount of cash available to us for other purposes.
We believe that we have made appropriate arrangements in respect of the future effect on us of these known contingencies. We also believe that the amount of cash available to us from our operations, together with cash from financing, will be sufficient for us to pay any known contingencies as they become due without materially affecting our ability to conduct our operations and invest in the growth of our business.
Off-Balance Sheet Arrangements
We do not have any off-balance sheet arrangements except for operating leases entered into in the normal course of business.
Contractual Obligations and Commitments
Below is a summary of our future payment commitments by year under contractual obligations as of December 31, 2018:
(in millions) 2019 2020 - 2021 2022 - 2023 Thereafter Total
Long-term debt, including interest(1) $ 508 $ 1,287 $ 3,257 $ 8,167 $ 13,219 Operating leases 167 244 159 119 689 Data acquisition 289 467 135 4 895 Purchase obligations(2) 17 22 15 8 62 Commitments to unconsolidated affiliates(3) — — — — — Benefit obligations(4) 25 27 29 81 162 Uncertain income tax positions(5) 17 — — — 17 Total $ 1,023 $ 2,047 $ 3,595 $ 8,379 $ 15,044
(1) Interest payments on our debt are based on the interest rates in effect on December 31, 2018. (2) Purchase obligations are defined as agreements to purchase goods or services that are enforceable and legally binding and that specify all significant
terms, including fixed or minimum quantities to be purchased, fixed, minimum or variable pricing provisions and the approximate timing of the transactions.
(3) We are currently committed to invest $120 million in private equity funds. As of December 31, 2018, we have funded approximately $78 million of these commitments and we have approximately $42 million remaining to be funded which has not been included in the above table as we are unable to predict when these commitments will be paid.
(4) Amounts represent expected future benefit payments for our pension and postretirement benefit plans, as well as expected contributions for 2019 for our funded pension benefit plans. We made cash contributions totaling approximately $31 million to our defined benefit plans in 2018, and we estimate that we will make contributions totaling approximately $25 million to our defined benefit plans in 2019. Due to the potential impact of future plan investment performance, changes in interest rates, changes in other economic and demographic assumptions and changes in legislation in foreign jurisdictions, we are not able to reasonably estimate the timing and amount of contributions that may be required to fund our defined benefit plans for periods beyond 2019.
(5) As of December 31, 2018, our liability related to uncertain income tax positions was approximately $106 million, $89 million of which has not been included in the above table as we are unable to predict when these liabilities will be paid due to the uncertainties in the timing of the settlement of the income tax positions.
60
Application of Critical Accounting Policies
Note 1 to the audited consolidated financial statements provided elsewhere in this Annual Report on Form 10-K describes the significant accounting policies used in the preparation of the consolidated financial statements. The preparation of our consolidated financial statements requires management to make estimates and assumptions that affect the reported amounts of assets and liabilities, and the disclosure of contingent assets and liabilities at the date of the financial statements, as well as the reported amounts of revenues and expenses during the period. Our estimates are based on historical experience and various other assumptions we believe are reasonable under the circumstances. We evaluate our estimates on an ongoing basis and make changes to the estimates and related disclosures as experience develops or new information becomes known. Actual results may differ from those estimates.
We believe the following critical accounting policies affect our more significant judgments and estimates used in the preparation of our consolidated financial statements.
Revenue Recognition
Our arrangements are primarily service contracts that range in duration from a few months to several years. In some cases, contracts provide for variable consideration that is contingent upon the occurrence of uncertain future events, such as performance incentives (including royalty payments or penalty clauses that can either increase or decrease the transaction price). We estimate the amount of variable consideration at the expected value or at the most likely amount depending on the type of consideration. Estimated amounts are included in the transaction price to the extent it is probable based on available information (historical, current and forecasted). Cash payments made to customers as incentives to induce the customers to enter into service agreements with us are amortized as a reduction of revenue over the period the services are performed. We record revenues net of any tax assessments by governmental authorities, such as value added taxes, that are imposed on and concurrent with specific revenue generating transactions.
We derive the majority of our revenues in the Technology & Analytics Solutions segment from various information and technology services offerings. Technology services offerings may contain multiple performance obligations consisting of a mix of small and large-scale services and consulting projects, multi-year outsourcing contracts and Software-as-a-Service (“SaaS”) arrangements. These arrangements typically have terms ranging from several weeks to three years, with a majority having terms of one year or less. For arrangements that include multiple performance obligations, the transaction price is allocated to the identified performance obligations based on their relative standalone selling prices. For these contracts, the standalone selling prices are based on our normal pricing practices when sold separately with consideration of market conditions and other factors, including customer demographics and geographic location.
The majority of revenue in our Research & Development Solutions segment is recognized over time using a cost-based input method since there is no single output measure that would fairly depict the transfer of control over the life of the performance obligation. Progress on the performance obligation is measured by the proportion of actual costs incurred to the total costs expected to complete the contract. Costs included in the measure of progress include direct labor and third-party costs (such as payments to investigators and travel expenses for our clinical monitors). This cost-based method of revenue recognition requires us to make estimates of costs to complete our projects on an ongoing basis. Significant judgment is required to evaluate assumptions related to these estimates. These significant estimates of project costs are updated and adjusted on a regular basis. These updates and adjustments are likely to result in variability in our revenue recognition from period to period that may cause unexpected variability in our operating results. At any point in time, we are working on thousands of active client projects, which are governed by individual contracts. Most projects are customized based on the needs of the client, the type of services being provided, therapeutic indication of the drug, geographic locations and other variables. Project specific terms related to pricing, billing terms and the scope and type of services to be provided are generally negotiated and contracted on a project-by-project basis. Changes in the scope of work are common, especially under long-term contracts, and generally result in a change in contract value. In such situations, we enter into negotiations for a contract amendment to reflect the change in scope and the related price. Depending on the complexity of the amendment, the negotiation process can take from a few weeks for a simple adjustment to several months for a complex amendment. Management may authorize the project team to commence work on activities outside the contract scope while we negotiate and finalize the contract amendment. In these limited cases, if we are not able to obtain a contract amendment from the client, our profit margin on the arrangement may be impacted. This result occurs because our costs of delivery are expensed as they are incurred, while revenue is not recognized unless the client has agreed to the changes in scope and renegotiated pricing terms in a form that meets the definition of a contract under Accounting Standards Codification Topic 606 “Revenue from Contracts with Customers.”
61
The majority of revenue in our Contract Sales & Medical Solutions segment is from contract sales to the biopharmaceutical industry and broader healthcare market and recognized over time using a single measure of progress dependent on the performance obligation. Some of our Contract Sales & Medical Solutions contracts contain multiple performance obligations with distinct promises including recruiting, sales force automation and deployment of sales representatives. The nature of the terms of these performance obligations will vary based on the customized needs of the customer. For contracts that have multiple performance obligations, the standalone selling prices of our performance obligations are not directly observable since they are rarely sold standalone. Therefore, we estimate the standalone selling prices using an expected cost plus a margin approach under which expected costs of satisfying a performance obligation are forecasted and added to an appropriate margin for that distinct good or service.
See Note 1 to our audited consolidated financial statements included elsewhere in this Annual Report on Form 10-K for further discussion.
Accounts Receivable and Unbilled Services
Accounts receivable represents amounts billed to clients. Revenues recognized in excess of billings are classified as unbilled services. The realization of these amounts is based on the client’s willingness and ability to pay us. We have an allowance for doubtful accounts based on management’s estimate of probable losses we expect to incur resulting from a client failing to pay us. Our allowance for doubtful accounts, and losses from clients failing to pay us, have not been material to our results of operations. If any of these estimates change or actual results differs from expected results, then an adjustment is recorded in the period in which the amounts become reasonably estimable. These adjustments could have a material effect on our results of operations.
Investments in Unconsolidated Affiliates—Equity Method Investments
We have investments in unconsolidated affiliates that are accounted for under the equity method of accounting. Periodically, we review our investments for a decline in value which we believe may be other than temporary. Should we identify such a decline, we will record a loss through earnings to establish a new cost basis for the investment. These losses could have a material adverse effect on our results of operations.
Income Taxes
Certain items of income and expense are not recognized on our income tax returns and financial statements in the same year, which creates timing differences. The income tax effect of these timing differences results in (1) deferred income tax assets that create a reduction in future income taxes and (2) deferred income tax liabilities that create an increase in future income taxes. Recognition of deferred income tax assets is based on management’s belief that it is more likely than not that the income tax benefit associated with certain temporary differences, income tax operating loss and capital loss carryforwards and income tax credits, would be realized. We recorded a valuation allowance to reduce our deferred income tax assets for those deferred income tax items for which it was more likely than not that realization would not occur. We determined the amount of the valuation allowance based, in part, on our assessment of future taxable income and in light of our ongoing income tax strategies. If our estimate of future taxable income or tax strategies changes at any time in the future, we would record an adjustment to our valuation allowance. Recording such an adjustment could have a material effect on our financial condition or results of operations.
Income tax expense is based on the distribution of profit before income tax among the various taxing jurisdictions in which we operate, adjusted as required by the income tax laws of each taxing jurisdiction. Changes in the distribution of profits and losses among taxing jurisdictions may have a significant impact on our effective income tax rate. We do not consider the undistributed earnings of our foreign subsidiaries to be indefinitely reinvested outside of the United States. Accordingly, we have provided a deferred income tax liability related to those undistributed earnings. The associated foreign income taxes on our foreign earnings could be available as a credit in the United States on our income taxes. We recognize foreign tax credits to the extent that the recognition is supported by projected foreign source income. See Note 16 to our audited consolidated financial statements included elsewhere in the Annual Report on Form 10-K for details regarding the Tax Cuts and Jobs Act and the impact on our consolidated financial statements.

62
Business Combinations
We use the acquisition method to account for business combinations, and accordingly, the identifiable assets acquired, the liabilities assumed and any non-controlling interest in the acquiree are recorded at their estimated fair values on the date of the acquisition. We use significant judgments, estimates and assumptions in determining the estimated fair value of assets acquired, liabilities assumed and non-controlling interest including expected future cash flows, discount rates that reflect the risk associated with the expected future cash flows and estimated useful lives.
When a business combination involves contingent consideration, we recognize a liability equal to the estimated fair value of the contingent consideration obligation at the date of the acquisition. The estimate of fair value of a contingent consideration liability requires subjective assumptions to be made regarding future business results including revenues and net new business, discount rates that reflect the risk associated with the expected future cash flows and probabilities assigned to various potential business result scenarios. We reassess the estimated fair value of the contingent consideration each financial reporting period over the term of the arrangement. Any resulting changes are recognized in earnings and could have a material effect on our results of operations.
Goodwill, Tangible and Identifiable Intangible Assets
We have recorded and allocated to our reporting units the excess of the cost over the fair value of the net assets acquired, known as goodwill. The recoverability of the goodwill and indefinite-lived intangible assets are evaluated annually for impairment, or if and when events or circumstances indicate a possible impairment. We review the carrying values of other identifiable intangible assets if the facts and circumstances indicate a possible impairment. Goodwill and indefinite-lived intangible assets are not amortized, and other identifiable intangible assets are amortized over their estimated useful lives. We believe that the risk of an impairment to goodwill or indefinite-lived intangible assets is currently very low.
For goodwill, we perform a qualitative analysis to determine whether it is more likely than not that the estimated fair value of a reporting unit is less than its book value. This includes a qualitative analysis of macroeconomic conditions, industry and market considerations, internal cost factors, financial performance, fair value history and other company specific events. If this qualitative analysis indicates that it is more likely than not that estimated fair value is less than the book value for the respective reporting unit, we apply a two-step impairment test in which we determine whether the estimated fair value of the reporting unit is in excess of its carrying value. If the carrying value of the net assets assigned to the reporting unit exceeds the estimated fair value of the reporting unit, we perform the second step of the impairment test to determine the implied estimated fair value of the reporting unit’s goodwill. We determine the implied estimated fair value of goodwill by determining the present value of the estimated future cash flows for each reporting unit and comparing the reporting unit’s risk profile and growth prospects to selected, reasonably similar publicly traded companies. The inherent subjectivity of applying a discounted cash flow and market comparables approach to valuing our assets and liabilities could have a significant impact on our analysis. Any future impairment could have a material adverse effect on our financial condition or results of operations.
For indefinite-lived intangible assets, we perform a qualitative analysis to determine whether it is more likely than not that the estimated fair value of the indefinite-lived intangible asset is less than its carrying value. If this qualitative analysis indicates that it is more likely than not that the estimated fair value is less than the carrying value of the indefinite-lived intangible asset, we determine the estimated fair value of the indefinite-lived intangible asset (trade name) by determining the present value of the estimated royalty payments on an after-tax basis that it would be required to pay the owner for the right to use such trade name. If the carrying amount exceeds the estimated fair value, an impairment loss is recognized in an amount equal to the excess. Any future impairment could have a material adverse effect on our financial condition or results of operations.
We review the carrying values of property and equipment if the facts and circumstances suggest that a potential impairment may have occurred. If this review indicates that carrying values will not be recoverable, as determined based on undiscounted cash flows over the remaining depreciation or amortization period, we will reduce carrying values to estimated fair value. The inherent subjectivity of our estimates of future cash flows could have a significant impact on our analysis. Any future write-offs of long-lived assets could have a material adverse effect on our financial condition or results of operations.

63
Stock-based Compensation
We measure compensation cost for stock-based payment awards (stock options and stock appreciation rights) granted to employees and non-employee directors at fair value using the Black-Scholes-Merton option-pricing model and for performance awards using the Monte Carlo simulation model. Stock-based compensation expense includes stock-based awards granted to employees and non-employee directors and has been reported in selling, general and administrative expenses in our consolidated statements of income based upon the classification of the individuals who were granted stock-based awards.
The Black-Scholes-Merton option-pricing model requires the use of subjective assumptions, including share price volatility, the expected life of the award, risk-free interest rate and the fair value of the underlying common shares on the date of grant. In developing our assumptions, we take into account the following:
• We calculate expected volatility based on reported data for selected reasonably similar publicly traded companies for which the historical information is available. We plan to continue to use the guideline peer group volatility information until the historical volatility of our common shares is relevant to measure expected volatility for future award grants;
• We determine the risk-free interest rate by reference to implied yields available from United States Treasury securities with a remaining term equal to the expected life assumed at the date of grant;
• We estimate the dividend yield to be zero as we do not currently anticipate paying any future dividends;
• We estimate the average expected life of the award based on our historical experience; and
• We estimate forfeitures based on our historical analysis of actual forfeitures.
Pensions and Other Postretirement Benefits
We provide retirement benefits to certain employees, including defined benefit pension plans and postretirement medical plans. The determination of benefit obligations and expense is based on actuarial models. In order to measure benefit costs and obligations using these models, critical assumptions are made with regard to the discount rate, expected return on plan assets, cash balance crediting rate, lump sum conversion rate and the assumed rate of compensation increases. In addition, retiree medical care cost trend rates are a key assumption used exclusively in determining costs for our postretirement health care and life insurance benefit plans. Management reviews these critical assumptions at least annually. Other assumptions involve demographic factors such as turnover, retirement and mortality rates. Management reviews these assumptions periodically and updates them when deemed appropriate to do so.
The discount rate is the rate at which the benefit obligations could be effectively settled and is determined annually by management. For United States plans, the discount rate is based on results of a modeling process in which the plans’ expected cash flow (determined on a projected benefit obligation basis) is matched with spot rates developed from a yield curve comprised of high-grade (Moody’s Aa and above, or Standard and Poor’s AA and above) non-callable corporate bonds to develop the present value of the expected cash flow, and then determining the single rate (discount rate), which when applied to the expected cash flow derives that same present value. In the United Kingdom specifically, the discount rate is set based on the yields on a universe of high quality non-callable corporate bonds denominated in the British Pound, appropriate to the duration of plan liabilities. For the other non-United States plans, the discount rate is based on the current yield of an index of high quality corporate bonds. As a sensitivity measure, a 25 basis point increase in the discount rate for our United States plan and United Kingdom plans, absent any offsetting changes in other assumptions, would result in a less than $1 million increase in pension expense at December 31, 2018.
Under the United States qualified retirement plan, participants have a notional retirement account that increases with pay and investment credits. The rate used to determine the investment credit (cash balance crediting rate) varies monthly. At retirement, the account is converted to a monthly retirement benefit.

64
In selecting an expected return on plan asset assumption, we consider the returns being earned by each plan investment category in the fund, the rates of return expected to be available for reinvestment and long-term economic forecasts for the type of investments held by the plan. The actual return on plan assets will vary from year to year versus this assumption. We believe it is appropriate to use long-term expected forecasts in selecting the expected return on plan assets. As such, there can be no assurance that our actual return on plan assets will approximate the long-term expected forecasts. As a sensitivity measure, a 25 basis point change in the expected return on assets (“EROA”) assumption for our United States plan, absent any offsetting changes in other assumptions, would result in a less than $1 million increase or decrease in pension expense at December 31, 2018. For our United Kingdom plans, a 25 basis point change in the EROA assumption, absent any offsetting changes in other assumptions, would result in a less than $1 million increase or decrease in pension expense at December 31, 2018. While we believe that the assumptions used are reasonable, differences in actual experience or changes in assumptions may materially affect our pension and postretirement obligations and future expense.
We utilize a corridor approach to amortizing unrecognized gains and losses in the pension and postretirement plans. Amortization occurs when the accumulated unrecognized net gain or loss balance exceeds the criterion of 10% of the larger of the beginning balances of the projected benefit obligation or the market-related value of the plan assets. The excess unrecognized gain or loss balance is then amortized using the straight-line method over the average remaining service life of active employees expected to receive benefits. At December 31, 2018, the weighted-average remaining service life of active employees was approximately 20 years.
Foreign Currency
We have significant investments in non-United States countries. Therefore, changes in the value of foreign currencies affect our consolidated financial statements when translated into United States dollars. For all operations outside the United States where we have designated the local currency as the functional currency, assets and liabilities are translated using end-of-period exchange rates; revenues, expenses and cash flows are translated using average rates of exchange prevailing during the period the transactions occurred. Translation gains and losses are included as an adjustment to the accumulated other comprehensive income (loss) component of stockholders’ equity. In addition, gains and losses from foreign currency transactions, such as those resulting from the settlement and revaluation of third-party and intercompany foreign receivables and payables, are included in the determination of net income (loss).
For operations outside the United States that are considered to be highly inflationary or where the United States dollar is designated as the functional currency, monetary assets and liabilities are remeasured using end-of-period exchange rates, whereas non-monetary accounts are remeasured using historical exchange rates, and all remeasurement and transaction adjustments are recognized in other expense (income), net.
Recently Issued Accounting Standards
Information relating to recently issued accounting standards is included in Note 1 to our audited consolidated financial statements included elsewhere in this Annual Report on Form 10-K.
Item 7A. Quantitative and Qualitative Disclosures About Market Risk
Market risk is the potential loss arising from adverse changes in market rates and prices. In the ordinary course of business, we are exposed to various market risks and we regularly evaluate our exposure to such changes. Our overall risk management strategy seeks to balance the magnitude of the exposure and the cost and availability of appropriate financial instruments. The following analyses present the sensitivity of our financial instruments to hypothetical changes that are reasonably possible over a one-year period.
Foreign Currency Exchange Rates
We transact business in more than 100 countries and approximately 55 currencies and are subject to risks associated with fluctuating foreign currency exchange rates. Our objective is to reduce earnings and cash flow volatility associated with foreign currency exchange rate movements. Accordingly, we enter into foreign currency forward contracts to minimize the impact of foreign exchange movements on non–functional currency assets and liabilities. We also enter into foreign currency forward contracts to hedge certain forecasted foreign currency cash flows related to service contracts and to hedge non-United States dollar anticipated intercompany royalties. It is our policy to enter into foreign currency transactions only to the extent necessary to meet our objectives as stated above. We do not enter into foreign currency transactions for investment or speculative purposes. The principal currencies hedged are the Euro, the British Pound, the Japanese Yen, the Swiss Franc and the Canadian dollar.

65
The contractual value of our foreign exchange derivative instruments, all of which were foreign exchange forward contracts, was approximately $202 million at December 31, 2018. The fair value of these contracts is subject to change as a result of potential changes in foreign exchange rates. We assess our market risk based on changes in foreign exchange rates utilizing a sensitivity analysis. The sensitivity analysis measures the potential loss in fair values based on a hypothetical 10% change in foreign currency exchange rates. The potential loss in fair value for foreign exchange forward contracts based on a hypothetical 10% decrease in the value of the United States dollar or, in the case of non-United States dollar related contracts, the currency being purchased, was $5 million at December 31, 2018. However, the change in the fair value of the foreign exchange forward contracts would likely be offset by a change in the value of the future service contract revenue, royalty or balance sheet exposure being hedged caused by the currency exchange rate fluctuation. The estimated fair values of the foreign exchange forward contracts were determined based on quoted market prices.
Exchange rate fluctuations affect the United States dollar value of foreign currency revenue and expenses and may have a significant effect on our results. Excluding the impacts from any outstanding or future hedging transactions, a hypothetical 10% change in average exchange rates used to translate all foreign currencies to the United States dollar would have impacted income before income taxes for 2018 by approximately $125 million. The actual impact of exchange rate movements in the future could differ materially from this hypothetical analysis, based on the mix of foreign currencies and the timing and magnitude of individual exchange rate movements.
Additionally, commencing in 2016, we designated a portion of our foreign currency denominated debt as a hedge of our net investment in foreign subsidiaries to reduce the volatility in stockholders’ equity caused by changes in the Euro exchange rate with respect to the United States dollar. As of December 31, 2018, these borrowings (net of original issue discount) were €4,590 million ($5,253 million). A hypothetical 10% decrease in the value of the United States dollar would lead to a potential loss in fair value of $525 million. However, this change in fair value would be offset by the change in value of the hedged portion of our net investment in foreign subsidiaries caused by the currency exchange rate fluctuation.
Interest Rates
Because we have variable rate debt, fluctuations in interest rates affect our business. We attempt to minimize interest rate risk and lower our overall borrowing costs through the utilization of derivative financial instruments, primarily interest rate caps and swaps. We have entered into interest rate caps and swaps with financial institutions that have reset dates and critical terms that match the underlying debt. Accordingly, any change in market value associated with the interest rate caps and swaps is offset by the opposite market impact on the related debt. As of December 31, 2018, we had approximately $6.4 billion of variable rate indebtedness and interest rate caps and swaps with a notional value of $2.0 billion. Because we do not attempt to hedge all of our variable rate debt, we may incur higher interest costs for the portion of our variable rate debt that is not hedged. Excluding debt covered by hedges, each quarter-point increase or decrease in the interest rate on our variable rate debt would result in our interest expense changing by approximately $12 million per year.
Marketable Securities
At December 31, 2018, we held investments in marketable equity securities. These investments are classified as either trading securities or available-for-sale securities and are recorded at fair value. These securities are subject to price risk. As of December 31, 2018, the fair value of these investments was $47 million based on the quoted market value of the securities. The potential loss in fair value resulting from a hypothetical decrease of 10% in quoted market values was approximately $5 million at December 31, 2018.

66
Item 8. Financial Statements and Supplementary Data
MANAGEMENT’S REPORT ON INTERNAL CONTROL OVER FINANCIAL REPORTING
The management of IQVIA Holdings Inc. (the “Company”) is responsible for establishing and maintaining adequate internal control over financial reporting. Internal control over financial reporting is a process designed to provide reasonable assurance regarding the reliability of financial reporting and the preparation of financial statements for external purposes in accordance with generally accepted accounting principles. A company’s internal control over financial reporting includes those policies and procedures that pertain to the maintenance of records that, in reasonable detail, accurately and fairly reflect the transactions and dispositions of the assets of the company; provide reasonable assurance that transactions are recorded as necessary to permit preparation of financial statements in accordance with generally accepted accounting principles, and that receipts and expenditures of the company are being made only in accordance with authorizations of management and directors of the company; and provide reasonable assurance regarding prevention or timely detection of unauthorized acquisition, use, or disposition of the company’s assets that could have a material effect on the financial statements.
Because of its inherent limitations, internal control over financial reporting may not prevent or detect misstatements. Also, projections of any evaluation of effectiveness to future periods are subject to the risk that controls may become inadequate because of changes in conditions, or that the degree of compliance with the policies or procedures may deteriorate.
Management assessed the effectiveness of the Company’s internal control over financial reporting as of December 31, 2018. In making this assessment, management used the framework established in Internal Control—Integrated Framework (2013) issued by the Committee of Sponsoring Organizations of the Treadway Commission (COSO). As a result of this assessment and based on the criteria in the COSO framework, management has concluded that, as of December 31, 2018, the Company’s internal control over financial reporting was effective.
The effectiveness of the Company’s internal control over financial reporting as of December 31, 2018 has been audited by PricewaterhouseCoopers LLP, an independent registered public accounting firm, as stated in their report which appears herein. /s/ Ari Bousbib
/s/ Michael R. McDonnell
Ari BousbibChairman, Chief Executive Officer and President(Principal Executive Officer)
Michael R. McDonnellExecutive Vice President and Chief Financial Officer(Principal Financial Officer)
February 19, 2019

67
REPORT OF INDEPENDENT REGISTERED PUBLIC ACCOUNTING FIRM
To the Board of Directors and Stockholders of IQVIA Holdings Inc.
Opinions on the Financial Statements and Internal Control over Financial Reporting
We have audited the accompanying consolidated balance sheets of IQVIA Holdings Inc. and its subsidiaries (the “Company”) as of December 31, 2018 and 2017, and the related consolidated statements of income, comprehensive (loss) income, stockholders’ equity (deficit) and cash flows for each of the three years in the period ended December 31, 2018, including the related notes and financial statement schedules listed in the index appearing under Item 15(a)(2) (collectively referred to as the “consolidated financial statements”). We also have audited the Company’s internal control over financial reporting as of December 31, 2018, based on criteria established in Internal Control - Integrated Framework (2013) issued by the Committee of Sponsoring Organizations of the Treadway Commission (COSO).
In our opinion, the consolidated financial statements referred to above present fairly, in all material respects, the financial position of the Company as of December 31, 2018 and 2017, and the results of its operations and its cash flows for each of the three years in the period ended December 31, 2018 in conformity with accounting principles generally accepted in the United States of America. Also in our opinion, the Company maintained, in all material respects, effective internal control over financial reporting as of December 31, 2018, based on criteria established in Internal Control - Integrated Framework (2013) issued by the COSO.
Basis for Opinions
The Company’s management is responsible for these consolidated financial statements, for maintaining effective internal control over financial reporting, and for its assessment of the effectiveness of internal control over financial reporting, included in the accompanying Management’s Report on Internal Control over Financial Reporting. Our responsibility is to express opinions on the Company’s consolidated financial statements and on the Company’s internal control over financial reporting based on our audits. We are a public accounting firm registered with the Public Company Accounting Oversight Board (United States) (“PCAOB”) and are required to be independent with respect to the Company in accordance with the U.S. federal securities laws and the applicable rules and regulations of the Securities and Exchange Commission and the PCAOB.
We conducted our audits in accordance with the standards of the PCAOB. Those standards require that we plan and perform the audits to obtain reasonable assurance about whether the consolidated financial statements are free of material misstatement, whether due to error or fraud, and whether effective internal control over financial reporting was maintained in all material respects.
Our audits of the consolidated financial statements included performing procedures to assess the risks of material misstatement of the consolidated financial statements, whether due to error or fraud, and performing procedures that respond to those risks. Such procedures included examining, on a test basis, evidence regarding the amounts and disclosures in the consolidated financial statements. Our audits also included evaluating the accounting principles used and significant estimates made by management, as well as evaluating the overall presentation of the consolidated financial statements. Our audit of internal control over financial reporting included obtaining an understanding of internal control over financial reporting, assessing the risk that a material weakness exists, and testing and evaluating the design and operating effectiveness of internal control based on the assessed risk. Our audits also included performing such other procedures as we considered necessary in the circumstances. We believe that our audits provide a reasonable basis for our opinions.

68
Definition and Limitations of Internal Control over Financial Reporting
A company’s internal control over financial reporting is a process designed to provide reasonable assurance regarding the reliability of financial reporting and the preparation of financial statements for external purposes in accordance with generally accepted accounting principles. A company’s internal control over financial reporting includes those policies and procedures that (i) pertain to the maintenance of records that, in reasonable detail, accurately and fairly reflect the transactions and dispositions of the assets of the company; (ii) provide reasonable assurance that transactions are recorded as necessary to permit preparation of financial statements in accordance with generally accepted accounting principles, and that receipts and expenditures of the company are being made only in accordance with authorizations of management and directors of the company; and (iii) provide reasonable assurance regarding prevention or timely detection of unauthorized acquisition, use, or disposition of the company’s assets that could have a material effect on the financial statements.
Because of its inherent limitations, internal control over financial reporting may not prevent or detect misstatements. Also, projections of any evaluation of effectiveness to future periods are subject to the risk that controls may become inadequate because of changes in conditions, or that the degree of compliance with the policies or procedures may deteriorate.
/s/ PricewaterhouseCoopers LLP
Raleigh, North Carolina February 19, 2019 We have served as the Company’s auditor since 2002.

69
IQVIA HOLDINGS INC. AND SUBSIDIARIESCONSOLIDATED STATEMENTS OF INCOME
Year Ended December 31, (in millions, except per share data) 2018 2017 2016
Revenues $ 10,412 $ 9,702 $ 6,815 Costs of revenue, exclusive of depreciation and amortization 6,746 6,301 4,748 Selling, general and administrative expenses 1,716 1,622 1,016 Depreciation and amortization 1,141 1,011 289 Impairment charges — 40 28 Restructuring costs 68 63 71 Merger related costs — — 87
Income from operations 741 665 576 Interest income (8) (7) (4)Interest expense 414 346 144 Loss on extinguishment of debt 2 19 31 Other expense (income), net 5 13 (11)
Income before income taxes and equity in earnings (losses) of unconsolidated affiliates 328 294 416
Income tax expense (benefit) 59 (992) 325 Income before equity in earnings (losses) of unconsolidated affiliates 269 1,286 91
Equity in earnings (losses) of unconsolidated affiliates 15 10 (4)Net income 284 1,296 87
Net income attributable to non-controlling interests (25) (19) (15)Net income attributable to IQVIA Holdings Inc. $ 259 $ 1,277 $ 72
Earnings per share attributable to common stockholders: Basic $ 1.27 $ 5.86 $ 0.48 Diluted $ 1.24 $ 5.74 $ 0.47
Weighted average common shares outstanding: Basic 203.7 217.8 149.1 Diluted 208.2 222.6 152.0
The accompanying notes are an integral part of these consolidated financial statements.
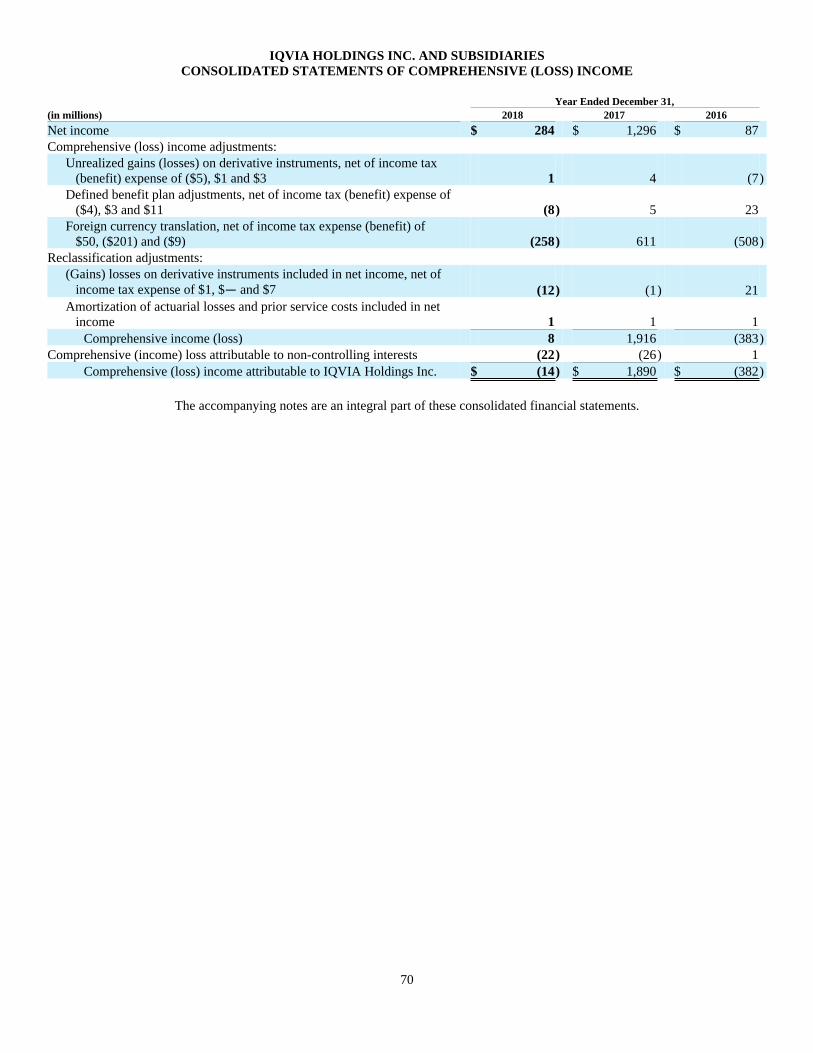
70
IQVIA HOLDINGS INC. AND SUBSIDIARIESCONSOLIDATED STATEMENTS OF COMPREHENSIVE (LOSS) INCOME
Year Ended December 31, (in millions) 2018 2017 2016
Net income $ 284 $ 1,296 $ 87 Comprehensive (loss) income adjustments:
Unrealized gains (losses) on derivative instruments, net of income tax (benefit) expense of ($5), $1 and $3 1 4 (7)Defined benefit plan adjustments, net of income tax (benefit) expense of ($4), $3 and $11 (8) 5 23 Foreign currency translation, net of income tax expense (benefit) of $50, ($201) and ($9) (258) 611 (508)
Reclassification adjustments: (Gains) losses on derivative instruments included in net income, net of income tax expense of $1, $— and $7 (12) (1) 21 Amortization of actuarial losses and prior service costs included in net income 1 1 1
Comprehensive income (loss) 8 1,916 (383)Comprehensive (income) loss attributable to non-controlling interests (22) (26) 1
Comprehensive (loss) income attributable to IQVIA Holdings Inc. $ (14) $ 1,890 $ (382)
The accompanying notes are an integral part of these consolidated financial statements.

71
IQVIA HOLDINGS INC. AND SUBSIDIARIESCONSOLIDATED BALANCE SHEETS
December 31, (in millions, except per share data) 2018 2017
ASSETS Current assets:
Cash and cash equivalents $ 891 $ 959 Trade accounts receivable and unbilled services, net 2,394 2,097 Prepaid expenses 151 146 Income taxes receivable 69 47 Investments in debt, equity and other securities 47 46 Other current assets and receivables 322 259
Total current assets 3,874 3,554 Property and equipment, net 434 440 Investments in debt, equity and other securities 41 8 Investments in unconsolidated affiliates 101 70 Goodwill 11,800 11,850 Other identifiable intangibles, net 5,951 6,591 Deferred income taxes 109 109 Deposits and other assets 239 235
Total assets $ 22,549 $ 22,857
LIABILITIES AND STOCKHOLDERS’ EQUITY Current liabilities:
Accounts payable $ 437 $ 322 Accrued expenses 1,858 1,664 Unearned income 1,007 985 Income taxes payable 100 72 Current portion of long-term debt 100 103 Other current liabilities 32 10
Total current liabilities 3,534 3,156 Long-term debt, less current portion 10,907 10,122 Deferred income taxes 736 895 Other liabilities 418 440
Total liabilities 15,595 14,613 Commitments and contingencies (Note 1) Stockholders’ equity:
Common stock and additional paid-in capital, 400.0 shares authorized at December 31, 2018 and 2017, $0.01 par value, 251.5 and 249.5 shares issued at December 31, 2018 and 2017, respectively 10,901 10,782 Retained earnings 807 538 Treasury stock, at cost, 54.0 and 41.4 shares at December 31, 2018 and 2017, respectively (4,770) (3,374)Accumulated other comprehensive (loss) income (224) 49
Equity attributable to IQVIA Holdings Inc.’s stockholders 6,714 7,995 Non-controlling interests 240 249
Total stockholders’ equity 6,954 8,244 Total liabilities and stockholders’ equity $ 22,549 $ 22,857
The accompanying notes are an integral part of these consolidated financial statements.

72
IQVIA HOLDINGS INC. AND SUBSIDIARIESCONSOLIDATED STATEMENTS OF CASH FLOWS
Year Ended December 31, (in millions) 2018 2017 2016
Operating activities: Net income $ 284 $ 1,296 $ 87 Adjustments to reconcile net income to cash provided by operating activities:
Depreciation and amortization 1,141 1,011 289 Amortization of debt issuance costs and discount 11 9 30 Amortization of accumulated other comprehensive loss on terminated interest rate swaps — 3 3 Stock-based compensation 113 106 80 Impairment of goodwill and identifiable intangible assets — 40 28 Gain on disposals of property and equipment, net — (1) (1)(Earnings) loss from unconsolidated affiliates (15) (10) 8 Loss (gain) on investments, net 3 (8) (13)(Benefit from) provision for deferred income taxes (177) (1,221) 115 Excess income tax benefits from stock-based award activities — — (41)
Changes in operating assets and liabilities: Accounts receivable and unbilled services (297) (141) (177)Prepaid expenses and other assets (66) (54) (8)Accounts payable and accrued expenses 368 90 160 Unearned income 7 (68) 230 Income taxes payable and other liabilities (118) (82) 70
Net cash provided by operating activities 1,254 970 860 Investing activities:
Acquisition of property, equipment and software (459) (369) (164)Net cash (paid for) assumed from acquisition of businesses (309) (854) 1,887 Disposition of business, net of cash disposed — 12 — (Purchases) sales of marketable securities, net (4) 2 (40)Investments in unconsolidated affiliates, net of payments received (17) 15 (17)(Investments in) proceeds from sale of equity securities (23) — 41 Proceeds from corporate owned life insurance policies — — 21 Other 2 4 3
Net cash (used in) provided by investing activities (810) (1,190) 1,731 Financing activities:
Proceeds from issuance of debt 1,631 5,242 466 Payment of debt issuance costs (22) (50) (7)Repayment of debt (732) (2,883) (1,949)Proceeds from revolving credit facility 2,445 1,921 172 Repayment of revolving credit facility (2,329) (1,767) — Principal payments on capital lease obligations — (2) (2)Proceeds related to employee stock purchase and option plans 15 91 97 Repurchase of common stock (1,405) (2,620) (1,097)Distributions to non-controlling interest, net (31) — — Contingent consideration and deferred purchase price payments (24) (4) (5)Excess income tax benefits from stock-based award activities — — 41
Net cash used in financing activities (452) (72) (2,284)Effect of foreign currency exchange rate changes on cash (60) 53 (86)(Decrease) increase in cash and cash equivalents (68) (239) 221 Cash and cash equivalents at beginning of period 959 1,198 977 Cash and cash equivalents at end of period $ 891 $ 959 $ 1,198
The accompanying notes are an integral part of these consolidated financial statements.

73
IQVIA HOLDINGS INC. AND SUBSIDIARIESCONSOLIDATED STATEMENTS OF STOCKHOLDERS’ EQUITY (DEFICIT)
(in millions)
CommonStockShares
TreasuryStockShares
CommonStock
AdditionalPaid-InCapital
Retained Earnings
(Accumulated Deficit)
TreasuryStock
AccumulatedOther
Comprehensive(Loss) Income
Non-controllingInterests Total
Balance, December 31, 2015 119.4 — $ 1 $ 8 $ (462) $ — $ (111) $ 228 $ (336)ASC 606 implementation — — — — (42) — 1 — (41)Balance, December 31, 2015, Adjusted 119.4 — 1 8 (504) — (110) 228 (377)Issuance of common stock 130.4 — 1 10,522 — — — — 10,523 Repurchase of common stock before October 3, 2016 (1.5) — — (46) (52) — — — (98)Repurchase of common stock on or after October 3, 2016 — (12.9) — — — (1,000) — — (1,000)Stock-based compensation — — — 76 — — — — 76 Income tax benefits from stock-based award activities — — — 41 — — — — 41 Investment by non-controlling interest — — — (1) — — — — (1)Net income — — — — 72 — — 15 87 Unrealized loss on derivative instruments, net of tax — — — — — — (7) — (7)Defined benefit plan adjustments, net of tax — — — — — — 23 — 23 Foreign currency translation, net of tax — — — — — — (492) (16) (508)Reclassification adjustments, net of tax — — — — — — 22 — 22 Balance, December 31, 2016 248.3 (12.9) 2 10,600 (484) (1,000) (564) 227 8,781 Issuance of common stock 3.7 — — — — — — — — Repurchase of common stock — (28.5) — — — (2,374) — — (2,374)Repurchase and retirement of common stock (2.5) — — — (255) — — — (255)Stock-based compensation — — — 180 — — — — 180 Distribution to non-controlling interest — — — — — — — (4) (4)Net income — — — — 1,277 — — 19 1,296 Unrealized gain on derivative instruments, net of tax — — — — — — 4 — 4 Defined benefit plan adjustments, net of tax — — — — — — 5 — 5 Foreign currency translation, net of tax — — — — — — 604 7 611 Balance, December 31, 2017 249.5 (41.4) 2 10,780 538 (3,374) 49 249 8,244 Issuance of common stock 2.0 — 1 10 — — — — 11 Repurchase of common stock — (12.6) — — — (1,396) — — (1,396)Stock-based compensation — — — 108 — — — — 108 Distributions to non-controlling interest, net — — — — — — — (31) (31)Net income — — — — 259 — — 25 284 Unrealized gain on derivative instruments, net of tax — — — — — — 1 — 1 Defined benefit plan adjustments, net of tax — — — — — — (8) — (8)Foreign currency translation, net of tax — — — — — — (255) (3) (258)Reclassification adjustments, net of tax — — — — — — (11) — (11)Other — — — — 10 — — — 10 Balance, December 31, 2018 251.5 (54.0) $ 3 $ 10,898 $ 807 $ (4,770) $ (224) $ 240 $ 6,954
The accompanying notes are an integral part of these consolidated financial statements.

74
IQVIA HOLDINGS INC. AND SUBSIDIARIES Notes to Consolidated Financial Statements
1. Summary of Significant Accounting Policies
The Company
With more than 58,000 employees, IQVIA Holdings Inc. (together with its subsidiaries, the “Company” or “IQVIA”) conducts business in more than 100 countries. IQVIA is a leading global provider of advanced analytics, technology solutions and contract research services to the life sciences industry.
On October 3, 2016, Quintiles Transnational Holdings Inc. (“Quintiles”) completed its previously announced merger of equals transaction (the “Merger”) with IMS Health Holdings, Inc. (“IMS Health”). Pursuant to the terms of the merger agreement dated as of May 3, 2016 between Quintiles and IMS Health (the “Merger Agreement”), IMS Health was merged with and into Quintiles, and the separate corporate existence of IMS Health ceased, with Quintiles continuing as the surviving corporation (the “Surviving Corporation”). Immediately prior to the completion of the Merger, Quintiles reincorporated as a Delaware corporation. The Surviving Corporation changed its name to Quintiles IMS Holdings, Inc (“QuintilesIMS”). At the effective time of the Merger, each issued and outstanding share of IMS Health common stock, par value $0.01 per share (“IMS Health common stock”), was automatically converted into 0.3840 of a share of the Company’s common stock, par value $0.01 per share. In addition, immediately following the effective time of the Merger, Quintiles Transnational Corp (“Quintiles Corp.”), a direct subsidiary of Quintiles, was merged with and into IMS Health Incorporated, following which IMS Health Incorporated will continue as a direct, wholly-owned subsidiary of the Surviving Corporation. See Note 14 for additional information regarding the Merger.
On November 6, 2017, the Company filed a Certificate of Amendment to its Amended and Restated Certificate of Incorporation (the “Certificate of Amendment”) to effect a change of the Company’s name from “Quintiles IMS Holdings, Inc.” to “IQVIA Holdings Inc.”.
On November 15, 2017, shares of the Company commenced trading under an updated New York Stock Exchange ticker symbol, “IQV” (formerly the shares traded under the ticker symbol “Q”).
The Company renamed two of its reportable segments during the second quarter of 2018. The reportable segment formerly known as Commercial Solutions is now named Technology & Analytics Solutions and the reportable segment formerly known as Integrated Engagement Services is now named Contract Sales & Medical Solutions. This is a name change only and there are no changes to the composition of either segment.
Principles of Consolidation
The accompanying consolidated financial statements include the accounts and operations of the Company, its subsidiaries and investments in which the Company has control. Amounts pertaining to the non-controlling ownership interests held by third parties in the operating results and financial position of the Company’s majority-owned subsidiaries are reported as non-controlling interests. Intercompany accounts and transactions have been eliminated in consolidation.
Use of Estimates
The preparation of financial statements in accordance with generally accepted accounting principles in the United States of America (“GAAP”) requires management to make estimates and assumptions that affect the reported amounts of assets and liabilities, and the disclosure of contingent assets and liabilities, at the date of the financial statements, as well as the reported amounts of revenues and expenses during the period. These estimates are based on historical experience and various other assumptions believed reasonable under the circumstances. The Company evaluates its estimates on an ongoing basis and makes changes to the estimates and related disclosures as experience develops or new information becomes known. Actual results may differ from those estimates.

75
Foreign Currencies
The Company’s financial statements are reported in United States dollars and, accordingly, the Company’s results of operations are impacted by fluctuations in exchange rates that affect the translation of its revenues and expenses denominated in foreign currencies into United States dollars for purposes of reporting its consolidated financial results. Assets and liabilities recorded in foreign currencies on the books of foreign subsidiaries are translated at the exchange rate on the balance sheet date. Revenues, costs and expenses are translated at average rates of exchange during the year. Translation adjustments resulting from this process are charged or credited to the accumulated other comprehensive (loss) income (“AOCI”) component of stockholders’ equity. The Company is subject to foreign currency transaction risk for fluctuations in exchange rates during the period of time between the consummation and cash settlement of a transaction. The Company earns revenue from its service contracts over a period of several months and, in some cases, over a period of several years. Accordingly, exchange rate fluctuations during this period may affect the Company’s profitability with respect to such contracts.
For operations outside the United States that are considered to be highly inflationary or where the United States dollar is designated as the functional currency, monetary assets and liabilities are remeasured using end-of-period exchange rates, whereas non-monetary accounts are remeasured using historical exchange rates, and all remeasurement and transaction adjustments are recognized in other expense (income), net. Other expense (income), net, includes foreign currency net losses for 2018, 2017 and 2016 of approximately $8 million, $40 million and $6 million, respectively. The higher foreign currency losses in 2017 were primarily the result of the combination of changes in intercompany loan balances from corporate legal entity integration and a weaker U.S. dollar.
Cash Equivalents
The Company considers all highly liquid investments with an initial maturity of three months or less when purchased to be cash equivalents.
Investments in Marketable Securities
Investments in marketable securities are classified as either trading or available-for-sale and measured at fair market value. Realized and unrealized gains and losses on available-for-sale and trading securities are included in other expense (income), net, on the accompanying consolidated statements of income.
Equity Method Investments
The Company’s investments in and advances to unconsolidated affiliates are accounted for under the equity method if the Company exercises significant influence or has an investment in a limited partnership that is considered to be greater than minor. These investments and advances are classified as investments in and advances to unconsolidated affiliates on the accompanying consolidated balance sheets. The Company records its pro rata share of the earnings, adjusted for accretion of basis difference, of these investments in equity in earnings (losses) of unconsolidated affiliates on the accompanying consolidated statements of income. The Company reviews its investments in and advances to unconsolidated affiliates for impairment whenever events or changes in circumstances indicate that the carrying amounts may not be recoverable.
Derivatives
The Company uses derivative instruments to manage exposures to interest rates and foreign currencies. Derivatives are recorded on the balance sheet at fair value at each balance sheet date utilizing pricing models for non-exchange-traded contracts. At inception, the Company designates whether or not the derivative instrument is an effective hedge of an asset, liability or firm commitment which is then classified as either a cash flow hedge or a fair value hedge. If determined to be an effective cash flow hedge, changes in the fair value of the derivative instrument are recorded as a component of AOCI until realized. The Company includes the impact from these hedges in the same line item as the hedged item on the consolidated statements of cash flows. Changes in fair value of effective fair value hedges are recorded in earnings as an offset to the changes in the fair value of the related hedged item. Hedge ineffectiveness, if any, is immediately recognized in earnings. Changes in the fair values of derivative instruments that are not an effective hedge are recognized in earnings. When it is probable that a hedged forecasted transaction will not occur, the Company discontinues hedge accounting for the affected portion of the forecasted transaction and reclassifies gains or losses that were accumulated in AOCI to earnings in other expense (income), net for foreign exchange derivatives and interest expense for interest rate derivatives on the consolidated statements of income. Cash flows are classified consistent with the underlying hedged item. The Company has entered, and may in the future enter, into derivative contracts (caps, swaps, forwards, calls or puts, warrants, for example) related to its debt, investments in marketable equity securities and forecasted foreign currency transactions.

76
Accrued Loyalty
The Company owns businesses that manage co-pay reimbursements on behalf of its pharmaceutical customers. These customers prefund the reimbursements and the Company includes this cash on its balance sheet. The Company draws on this cash to pay pharmacies as consumers use these programs. Accrued loyalty was $186 million and $143 million as of December 31, 2018 and 2017, respectively, and included within accrued expenses on the consolidated balance sheet.
Allowance for Doubtful Accounts
The Company’s allowance for doubtful accounts is determined based on a variety of factors that affect the potential collectability of the related receivables, including length of time the receivables are past due, client credit ratings, financial stability of the client, specific one-time events and client payment history. In addition, in circumstances where the Company is made aware of a specific client’s inability to meet its financial obligations, a specific allowance is established. The accounts are individually evaluated on a regular basis and reserves are established as deemed appropriate based on the above criteria.
Receivables Financing Facility
Advances received under the Company’s receivables financing facility are accounted for as borrowings secured by the receivables and included in net cash provided by financing activities. The Company services the collateralized accounts receivables and the cash flows for the underlying receivables are included in cash provided by operating activities. The collateralized accounts receivables are included in trade accounts receivable and unbilled services, net.
Business Combinations
Business combinations are accounted for using the acquisition method of accounting. The identifiable assets acquired, the liabilities assumed, and any non-controlling interest in the acquiree are recorded at their estimated fair values on the date of the acquisition. Goodwill represents the excess of the purchase price over the estimated fair value of the net assets acquired, including the amount assigned to identifiable intangible assets. When a business combination involves contingent consideration, the Company recognizes a liability equal to the estimated fair value of the contingent consideration obligation at the date of the acquisition. Subsequent changes in the estimated fair value of the contingent consideration are recognized in earnings in the period of the change. Acquisition-related costs are expensed as incurred. The consolidated financial statements include the results of operations of business combinations since the acquisition date.
Long-Lived Assets
Property and equipment are stated at cost and are depreciated using the straight-line method over the shorter of the asset’s estimated useful life or the lease term, if related to leased property, as follows:
Buildings and leasehold improvements 3 - 40 yearsEquipment 3 - 10 yearsFurniture and fixtures 5 - 10 yearsTransportation equipment 3 - 20 years
Definite-lived identifiable intangible assets are amortized primarily using an accelerated method that reflects the pattern in which the Company expects to benefit from the use of the asset over its estimated remaining useful life as follows:
Trademarks and trade names 1 - 17 yearsContract backlog and client relationships 1 - 25 yearsSoftware and related assets 1 - 9 yearsDatabases 1 - 9 yearsNon-compete agreements and other 2 - 5 years
Goodwill and indefinite-lived identifiable intangible assets, which consist of a trade name, are not amortized but evaluated for impairment annually, or more frequently if events or changes in circumstances indicate an impairment.

77
Included in software and related items is the capitalized cost of internal-use software used in supporting the Company’s business. Qualifying costs incurred during the application development stage are capitalized and amortized over their estimated useful lives. Costs are capitalized from completion of the preliminary project stage and when it is considered probable that the software will be used to perform its intended function, up until the time the software is placed into service. The Company recognized $179 million, $134 million and $44 million of amortization expense in 2018, 2017 and 2016, respectively, related to software and related assets.
The carrying values of property, equipment and intangible and other long-lived assets are reviewed for recoverability if the facts and circumstances suggest that a potential impairment may have occurred. If this review indicates that carrying values will not be recoverable, as determined based on undiscounted cash flow projections, the Company will record an impairment charge to reduce carrying values to estimated fair value. There were no impairments recognized in 2018. See Note 8 for information regarding the impairment charges recognized in 2017 and 2016.
Revenue Recognition
The Company’s arrangements are primarily service contracts that range in duration from a few months to several years. The Company recognizes revenue when control of these services is transferred to the customer for an amount, referred to as the transaction price, that reflects the consideration to which the Company is expected to be entitled in exchange for those goods or services. The Company determines revenue recognition utilizing the following five steps: (1) identification of the contract with a customer, (2) identification of the performance obligations in the contract (promised goods or services that are distinct), (3) determination of the transaction price, (4) allocation of the transaction price to the performance obligations, and (5) recognition of revenue when, or as, the Company transfers control of the product or service for each performance obligation. Cash payments made to customers as incentives to induce customers to enter into service agreements with the Company are amortized as a reduction of revenue over the period the services are performed. The Company records revenues net of any tax assessments by governmental authorities, such as value added taxes, that are imposed on and concurrent with specific revenue generating transactions.
The Company derives the majority of its revenues in the Technology & Analytics Solutions segment from various information and technology service offerings. Information offerings (primarily under fixed-price contracts) typically include multiple performance obligations including an ongoing subscription-based deliverable for which revenue is recognized ratably as earned over the contract period, and/or a one-time deliverable of data offerings for which revenue is recognized upon delivery. The customer is able to benefit from the provision of data as it is received. The Company’s subscription arrangements typically have terms ranging from one to three years and are generally non-cancelable and do not contain refund-type provisions. Technology services offerings may contain multiple performance obligations consisting of a mix of small and large-scale services and consulting projects, multi-year outsourcing contracts and Software-as-a-Service (“SaaS”) arrangements. These arrangements typically have terms ranging from several weeks to three years, with a majority having terms of one year or less. For arrangements that include multiple performance obligations, the transaction price is allocated to the identified performance obligations based on their relative standalone selling prices. For these contracts, the standalone selling prices are based on the Company’s normal pricing practices when sold separately with consideration of market conditions and other factors, including customer demographics and geographic location. Revenues for services engagements where the transfer of control occurs ratably over time are recognized on a straight-line basis over the term of the arrangement. Revenues from time and material contracts are recognized based on hours as the services are provided. Revenues from fixed price ad hoc services and consulting contracts are recognized over the contract term based on the ratio of the number of hours incurred for services provided during the period compared to the total estimated hours to be incurred over the entire arrangement (hours-based). Technology services offerings meet the over time criterion, as another party would not need to substantially re-perform the work already completed to satisfy the remaining obligations if the services were migrated.
The majority of the Company’s contracts within the Research & Development Solutions segment are service contracts for clinical research that represent a single performance obligation. The Company provides a significant integration service resulting in a combined output, which is clinical trial data that meets the relevant regulatory standards and can be used by the customer to progress to the next phase of a clinical trial or solicit approval of a treatment by the applicable regulatory body. The performance obligation is satisfied over time as the output is captured in data and documentation that is available for the customer to consume over the course of the arrangement and furthers progress of the clinical trial. The Company recognizes revenue over time using a cost-based input method since there is no single output measure that would fairly depict the transfer of control over the life of the performance obligation. Progress on the performance obligation is measured by the proportion of actual costs incurred to the total costs expected to complete the contract. Costs included in the measure of progress include direct labor and third-party costs (such as payments to investigators and travel expenses for the Company’s clinical monitors). This cost-based method of revenue recognition requires the Company to make estimates of costs to complete its projects on an ongoing basis. Significant judgment is required to evaluate assumptions related to these estimates. The effect of revisions to estimates related to the transaction price or costs to complete a project are recorded in the period in which the estimate is revised. Most contracts may be terminated upon 30 to 90 days notice by the customer; however, in the event of termination, most contracts require payment for services rendered through the date of termination, as well as for subsequent services rendered to close out the contract.

78
The Company derives the majority of its revenues in its Contract Sales & Medical Solutions segment by providing contract sales and market access professionals to customers within the biopharmaceutical industry on a fee-for-service basis. Some of the Company’s Contract Sales & Medical Solutions contracts contain multiple performance obligations with distinct promises including recruiting, sales force automation and deployment of sales representatives. The nature of the terms of these performance obligations will vary based on the customized needs of the customer. For contracts that have multiple performance obligations, the standalone selling prices of the Company’s performance obligations are not directly observable since they are rarely sold standalone. Therefore, the Company estimates the standalone selling prices using an expected cost plus a margin approach under which expected costs of satisfying a performance obligation are forecasted and added to an appropriate margin for that distinct good or service. The Company utilizes a single measure of progress for each performance obligation to recognize revenue, which includes deployment of sales representatives based on employee days worked; recruiting based on candidates recruited; sales force automation set-up based on hours worked; and sales force automation hosting and maintenance based on usage. These services meet the over time criterion as the customer consumes the benefit as activities are performed and another party would not need to substantially re-perform the work already completed to satisfy the remaining obligations if the services were migrated to another party.
Variable Consideration
In some cases, contracts provide for variable consideration that is contingent upon the occurrence of uncertain future events, such as performance incentives (including royalty payments or penalty clauses that can either increase or decrease the transaction price). Variable consideration is estimated at the expected value or at the most likely amount depending on the type of consideration. Estimated amounts are included in the transaction price to the extent it is probable that a significant reversal of cumulative revenue recognized will not occur when the uncertainty associated with the variable consideration is resolved. The estimate of variable consideration and determination of whether to include estimated amounts in the transaction price are based largely on an assessment of its anticipated performance and all information (historical, current and forecasted) that is reasonably available to the Company and reevaluated each reporting period.
Reimbursed Expenses
The Company includes reimbursed expenses in revenues and costs of revenue as the Company is primarily responsible for fulfilling the promise to provide the specified service, including the integration of the related services into a combined output to the customer, which are inseparable from the integrated service. These costs include such items as payments to investigators and travel expenses for the Company’s clinical monitors and sales representatives, over which the Company has discretion in establishing prices. The Company controls the good or service and has inventory risk on contractually reimbursable expenses, as sometimes the Company is unable to obtain reimbursement from the customer for costs incurred.
Change Orders
Changes in the scope of work are common, especially under long-term contracts, and generally result in a change in transaction price. Change orders are evaluated on a contract-by-contract basis to determine if they should be accounted for as a new contract or as part of the existing contract. Generally, services from change orders are not distinct from the original performance obligation. As a result, the effect that the contract modification has on the contract revenue, and measure of progress, is recognized as an adjustment to revenue when it occurs.
Costs of Revenue
Costs of revenue include (i) compensation and benefits for billable employees and personnel involved in production, data management and delivery, and the costs of acquiring and processing data for the Company’s information offerings; (ii) costs of staff directly involved with delivering technology-related services offerings and engagements, and the costs of data purchased specifically for technology services engagements; (iii) reimbursed expenses that are comprised principally of payments to investigators who oversee clinical trials and travel expenses for the Company’s clinical monitors and sales representatives; and (iv) other expenses directly related to service contracts such as courier fees, laboratory supplies, professional services and travel expenses.
Trade Receivables, Unbilled Services and Unearned Income
In general, billings and payments are established by contractual provisions including predetermined payment schedules, which may or may not correspond to the timing of the transfer of control of the Company’s services under the contract. In general, the Company’s intention in its invoicing (payment terms) is to maintain cash neutrality over the life of the contract. Upfront payments, when they occur, are intended to cover certain expenses the Company incurs at the beginning of the contract. Neither the Company nor its customers view such upfront payments and contracted payment schedules as a means of financing. Unbilled services primarily arise from long-term contracts when a cost-based or hours-based input method of revenue recognition is utilized and revenue recognized exceeds the amount billed to the customer.

79
Unearned income consists of advance payments and billings in excess of revenue recognized. As the contracted services are subsequently performed and the associated revenue is recognized, the unearned income balance is reduced by the amount of the revenue recognized during the period. Unearned income is classified as a current liability on the condensed consolidated balance sheet as the Company expects to recognize the associated revenue in less than one year.
Concentration of Credit Risk
Financial instruments that subject the Company to credit risk primarily consist of cash and cash equivalents, marketable securities and accounts receivable. The Company maintains its cash and cash equivalent balances with high-quality financial institutions and, consequently, the Company believes that such funds are subject to minimal credit risk. Investment policies have been implemented that limit purchases of marketable securities to investment grade securities. Substantially all revenues for Technology & Analytics Solutions, Research & Development Solutions and Contract Sales & Medical Solutions are earned by performing services under contracts with various pharmaceutical, biotechnology, medical device and healthcare companies. The concentration of credit risk is equal to the outstanding accounts receivable and unbilled services balances, less the unearned income related thereto, and such risk is subject to the financial and industry conditions of the Company’s clients. The Company does not require collateral or other securities to support client receivables. Credit losses have been immaterial and reasonably within management’s expectations.
Restructuring Costs
Restructuring costs, which primarily include termination benefits and facility closure costs, are recorded at estimated fair value. Key assumptions in determining the restructuring costs include the terms and payments that may be negotiated to terminate certain contractual obligations and the timing of employees leaving the Company.
Merger Related Costs
Merger related costs include the direct and incremental costs associated with business combinations including (i) acquisition related costs such as investment banking, legal, accounting and consulting fees (see Note 14), (ii) incremental compensation costs triggered under change in control provisions in executive employment agreements, (iii) compensation and related costs of employees 100% dedicated to merger-related integration activities and (iv) severance and other termination costs associated with redundant employees. There were no merger related costs recognized in 2018 or 2017. During 2016, the Company recognized $87 million of merger related costs, which includes $36 million of acquisition related costs. All of these costs are related to the Merger. Merger related costs for all other business combinations have been immaterial and are included within selling, general and administrative expenses on the consolidated statements of income.
Legal Costs
Legal costs are expensed as incurred.
Debt Fees
Fees incurred to issue debt are generally deferred and amortized as a component of interest expense over the estimated term of the related debt using the effective interest rate method.
Contingencies
The Company records accruals for claims, suits, investigations and proceedings when it is probable that a liability has been incurred and the amount of the loss can be reasonably estimated. The Company reviews claims, suits, investigations and proceedings at least quarterly and records or adjusts accruals related to such matters to reflect the impact and status of any settlements, rulings, advice of counsel or other information pertinent to a particular matter. Legal costs associated with contingencies are charged to expense as incurred.
The Company is party to legal proceedings incidental to its business. While the outcome of these matters could differ from management’s expectations, the Company does not believe the resolution of these matters will have a material adverse effect to the Company’s financial statements.

80
Income Taxes
Income tax expense includes United States (“U.S.”) federal, state and international income taxes. Certain items of income and expense are not reported in income tax returns and financial statements in the same year. The income tax effects of these differences are reported as deferred income taxes. Valuation allowances are provided to reduce the related deferred income tax assets to an amount which will, more likely than not, be realized. As a result of the Tax Cuts and Jobs Act (the “Tax Act”) enacted on December 22, 2017, the Company no longer considers the undistributed earnings of its foreign subsidiaries to be indefinitely reinvested and will record deferred income taxes on these earnings, as applicable. The Company has recorded its U.S. deferred taxes based on the Federal corporate income tax rate of 21%. The Company accounts for Global Intangible Low Taxed Income (“GILTI”) and the Base Erosion and Anti-Abuse Tax (“BEAT”) as period costs if and when incurred. Interest and penalties related to unrecognized income tax benefits are recognized as a component of income tax expense as discussed further in Note 16. Additionally, as a result of the Tax Act the Company is required to make an accounting policy election in relation to the reduction or loss of cash tax savings from net operating losses in its valuation allowance assessments, by either electing the tax law ordering approach or the incremental cash tax savings approach. The Company has made the election to use the incremental cash tax savings approach as its policy.
Pensions and Other Postretirement Benefits
The Company provides retirement benefits to certain employees, including defined benefit pension plans and postretirement medical plans. The determination of benefit obligations and expense is based on actuarial models. In order to measure benefit costs and obligations using these models, critical assumptions are made with regard to the discount rate, expected return on plan assets, cash balance crediting rate, lump sum conversion rate and the assumed rate of compensation increases. In addition, retiree medical care cost trend rates are a key assumption used exclusively in determining costs for the Company’s postretirement health care and life insurance benefit plans. Management reviews these critical assumptions at least annually. Other assumptions involve demographic factors such as turnover, retirement and mortality rates. Management reviews these assumptions periodically and updates them when their experience deems it appropriate to do so.
The discount rate is the rate at which the benefit obligations could be effectively settled and is determined annually by management. For United States plans, the discount rate is based on results of a modeling process in which the plans’ expected cash flow (determined on a projected benefit obligation basis) is matched with spot rates developed from a yield curve comprised of high-grade (Moody’s Aa and above, or Standard and Poor’s AA and above) non-callable corporate bonds to develop the present value of the expected cash flow, and then determining the single rate (discount rate), which when applied to the expected cash flow derives that same present value. In the United Kingdom specifically, the discount rate is set based on the yields on a universe of high quality non-callable corporate bonds denominated in the British Pound, appropriate to the duration of plan liabilities. For the non-United States plans, the discount rate is based on the current yield of an index of high quality corporate bonds.
The Company estimates the service and interest cost components of net periodic benefit cost for the Company’s United States and United Kingdom pension benefit plans by utilizing a full yield curve approach in the estimation of these components by applying the specific spot rates along the yield curve used in the determination of the benefit obligation to each of the underlying projected cash flows based on time until payment.
Under the United States qualified retirement plan, participants have a notional retirement account that increases with pay and investment credits. The rate used to determine the investment credit (cash balance crediting rate) varies monthly. At retirement, the account is converted to a monthly retirement benefit.
In selecting an expected return on plan asset assumption, the Company considers the returns being earned by each plan investment category in the fund, the rates of return expected to be available for reinvestment and long-term economic forecasts for the type of investments held by the plan. The actual return on plan assets will vary from year to year versus this assumption. The Company believes it is appropriate to use long-term expected forecasts in selecting the expected return on plan assets. As such, there can be no assurance that the Company’s actual return on plan assets will approximate the long-term expected forecasts. While the Company believes that the assumptions used are reasonable, differences in actual experience or changes in assumptions may materially affect its pension and postretirement benefit obligations and future expense.
The Company’s estimated long-term rate of return on plan assets is based on the principles of capital market theory that maintain that over the long run, prudent investment risk taking is rewarded with incremental returns and that combining non-correlated assets can maximize risk adjusted portfolio returns. Long-term return estimates are developed by asset category based on actual class return data, historical relationships between asset classes and risk factors and peer plan data. Long-term return estimates for the Company’s United Kingdom pension plans are developed by asset category based on actual class return data, historical relationships between asset classes and risk factors.

81
The Company utilizes a corridor approach to amortizing unrecognized gains and losses in the pension and postretirement benefit plans. Amortization occurs when the accumulated unrecognized net gain or loss balance exceeds the criterion of 10% of the larger of the beginning balances of the projected benefit obligation or the market-related value of the plan assets. The excess unrecognized gain or loss balance is then amortized using the straight-line method over the average remaining service life of active employees expected to receive benefits.
Stock-based Compensation
The Company accounts for stock-based compensation for stock options and stock appreciation rights under the fair value method and uses the Black-Scholes-Merton model to estimate the value of such stock-based awards granted to its employees and non-executive directors. Expected volatility is based upon the historical volatility of a peer group for a period equal to the expected term, as the Company does not have adequate history to calculate its own volatility and believes the expected volatility will approximate the historical volatility of the peer group. The Company does not currently anticipate paying dividends. The expected term represents the period of time the grants are expected to be outstanding. The risk-free interest rate is based on the United States Treasury yield curve in effect at the time of the grant.
The Company accounts for its stock-based compensation for restricted stock awards and restricted stock units based on the closing market price of the Company’s common stock on the date of grant. The Company accounts for its stock-based compensation for performance awards based on the closing market price of the Company’s common stock on the date of grant and for performance awards that include market conditions, upon the Monte Carlo simulation model.
Earnings Per Share
The calculation of earnings per share is based on the weighted average number of common shares or common stock equivalents outstanding during the applicable period. The dilutive effect of common stock equivalents is excluded from basic earnings per share and is included in the calculation of diluted earnings per share. Potentially dilutive securities include outstanding stock options and unvested restricted stock units, restricted stock and performance awards. Employee equity share options, restricted stock units, restricted stock, performance awards and similar equity instruments granted by the Company are treated as potential common shares outstanding in computing diluted earnings per share. Diluted shares outstanding are calculated based on the average share price for each fiscal period using the treasury stock method. Under the treasury stock method, the amount the employee must pay for exercising stock options, the amount of compensation cost for future service that the Company has not yet recognized, and the amount of benefits that would be recorded in additional paid-in capital when the award becomes deductible for tax purposes are assumed to be used to repurchase shares.
Treasury Stock
The Company records treasury stock purchases under the cost method. Upon reissuance of treasury stock, amounts in excess of the acquisition cost are credited to additional paid in capital. If the Company reissues treasury stock at an amount below its acquisition cost and additional paid in capital associated with prior treasury stock transactions is insufficient to cover the difference between the acquisition cost and the reissue price, this difference is recorded in retained earnings.
Recently Issued Accounting Standards
Accounting pronouncements adopted
In June 2018, the FASB issued new accounting guidance that largely aligns the accounting for share-based payment awards issued to employees and nonemployees. Under the new guidance, the existing employee guidance will apply to nonemployee share-based transactions (as long as the transaction is not effectively a form of financing), with the exception of specific guidance related to the attribution of compensation cost. The cost of nonemployee awards will continue to be recorded as if the grantor had paid cash for the goods or services. The Company adopted this new accounting guidance on January 1, 2018. The adoption of this new accounting guidance did not have a material effect on the Company’s consolidated financial statements.

82
In March 2017, the FASB issued new accounting guidance that requires the service cost component of net periodic benefit cost be presented in the same income statement line item as other employee compensation costs and requires that the other components of net periodic benefit expense be recognized in the non-operating section of the income statement (“ASU 2017-07”). In addition, only the service cost component of net periodic benefit expense is eligible for capitalization when applicable. The Company adopted this new accounting guidance on January 1, 2018. The Company retrospectively adjusted the presentation of the other components of net periodic pension and postretirement benefit cost in the income statements. See “Adjustments to Previously Reported Financial Statements from the Adoption of Accounting Pronouncements” included elsewhere in Note 1 for further details regarding the effects of the adoption of ASU 2017-07.
In January 2017, the FASB issued new accounting guidance that changes the definition of a business to clarify when a set of assets does not constitute a business. Under the new definition, when substantially all of the fair value of gross assets acquired (or disposed of) is concentrated in a single identifiable asset or a group of similar identifiable assets, the set of assets is generally not a business. The Company adopted this new accounting guidance on January 1, 2018. The adoption of this new accounting guidance did not have a material effect on the Company’s consolidated financial statements.
In October 2016, the FASB issued new accounting guidance that requires the income tax consequences of an intra-entity transfer of an asset, other than inventory, to be recognized when the transfer occurs. The Company adopted this new accounting guidance on January 1, 2018. The adoption of this new accounting guidance did not have a material effect on the Company’s consolidated financial statements.
In January 2016, the FASB issued new accounting guidance that modifies how entities measure equity investments and present changes in the fair value of financial liabilities (“ASU 2016-01”). The Company adopted this new accounting guidance on January 1, 2018. The adoption of this new accounting guidance did not have a material effect on the Company’s consolidated financial statements. See Note 4 for additional information regarding the adoption of ASU 2016-01, “Financial Instruments – Overall (Topic 825-10): Recognition and Measurement of Financial Assets and Financial Liabilities.”
In May 2014, the FASB and the International Accounting Standards Board issued a converged standard on the recognition of revenue from contracts with customers (“ASU 2014-09”). The objective of the new standard is to establish a single comprehensive revenue recognition model that is designed to create greater comparability of financial statements across industries and jurisdictions. Under the new standard, revenue is recognized to depict the transfer of goods or services to customers in amounts that reflect the consideration to which the company expects to be entitled in exchange for those goods or services. The Company adopted ASU 2014-09 on January 1, 2018 using the full retrospective method. See “Revenue Recognition” and “Adjustments to Previously Reported Financial Statements from the Adoption of Accounting Pronouncements” included elsewhere in Note 1 for further discussion regarding the effects of the adoption of ASU 2014-09.
Adjustments to Previously Reported Financial Statements from the Adoption of Accounting Pronouncements
The following table presents the effect of the adoption of ASU 2014-09 on the Company’s consolidated balance sheet as of December 31, 2017:
December 31, 2017
(in millions) As Previously
Reported As Recast
Trade accounts receivable and unbilled services, net $ 1,993 $ 2,097 Total current assets 3,450 3,554 Deferred income taxes 98 109 Total assets 22,742 22,857 Unearned income 733 985 Total current liabilities 2,904 3,156 Deferred income taxes 918 895 Total liabilities 14,384 14,613 Retained earnings 655 538 Accumulated other comprehensive income 46 49 Equity attributable to IQVIA Holdings Inc.’s stockholders 8,109 7,995 Total stockholders’ equity 8,358 8,244 Total liabilities and stockholders’ equity 22,742 22,857

83
The following table presents the effect of the adoption of ASU 2014-09 and ASU 2017-07 on the Company’s consolidated statements of income for the years ended December 31, 2017 and 2016:
Year Ended December 31, 2017 2016
(in millions, except per share amounts) As Previously
Reported As Recast As Previously
Reported As Recast
Total revenues $ 9,739 $ 9,702 $ 6,878 $ 6,815 Cost of revenues, exclusive of depreciation and amortization 6,301 6,301 4,750 4,748 Selling, general and administrative expenses 1,605 1,622 1,011 1,016 Income from operations 719 665 642 576 Other expense (income), net 30 13 (8) (11)Income before income taxes and equity in earnings of unconsolidated affiliates
331 294 479 416
Income tax (benefit) expense (987) (992) 345 325 Income before equity in earnings of unconsolidated affiliates 1,318 1,286 134 91 Net income 1,328 1,296 130 87 Net income attributable to IQVIA Holdings Inc. 1,309 1,277 115 72 Earnings per share attributable to common stockholders:
Basic $ 6.01 $ 5.86 $ 0.77 $ 0.48 Diluted $ 5.88 $ 5.74 $ 0.76 $ 0.47
The cumulative effect of adopting the above standards is reflected in the consolidated statements of stockholders’ equity (deficit) as an adjustment to the December 31, 2015 balance. Adoption of the above standards had no impact to cash from or used in operating, financing, or investing activities on the Company’s consolidated statements of cash flows for the years ended December 31, 2017 or 2016.
Accounting pronouncements being evaluated
In August 2018, the FASB issued new accounting guidance that clarifies and aligns the accounting for implementation costs for hosting arrangements with the requirements for capitalizing implementation costs incurred to develop or obtain internal-use software. The new accounting guidance will be effective for the Company on January 1, 2020. Early adoption is permitted. The Company is currently evaluating the impact of this new accounting guidance on its consolidated financial statements.
In August 2018, the FASB issued new accounting guidance that modifies the disclosure requirements for employers that sponsor defined benefit pension or other postretirement plans. The new accounting guidance will be effective for the Company on January 1, 2021. Early adoption is permitted. The Company is currently evaluating the impact of this new accounting guidance on its consolidated financial statements.
In August 2018, the FASB issued new accounting guidance that modifies the disclosure requirements in Topic 820, Fair Value Measurement, by removing certain disclosure requirements related to the fair value hierarchy, modifying existing disclosure requirements related to measurement uncertainty and adding new disclosure requirements, such as disclosing the changes in unrealized gains and losses for the period included in other comprehensive income for recurring Level 3 fair value measurements held at the end of the reporting period and disclosing the range and weighted average of significant unobservable inputs used to develop Level 3 fair value measurements. The new accounting guidance will be effective for the Company on January 1, 2020. Early adoption is permitted. The Company is currently evaluating the impact of this new accounting guidance on its consolidated financial statements.
In February 2018, the FASB issued new accounting guidance that will allow a reclassification from accumulated other comprehensive income to retained earnings for “stranded income tax effects” resulting from the Tax Act. Because the income statement impact related to the reduction of the historical corporate income tax rate under the Tax Act is required to be included in income tax expense, the guidance acknowledges that the income tax effects of items within accumulated other comprehensive income (“stranded income tax effects”) do not reflect the appropriate income tax rate. The new accounting guidance will be effective for the Company on January 1, 2019. The Company is still considering the impacts of this guidance and expects to elect the option to not reclassify from accumulated other comprehensive income to retained earnings for “stranded income tax effects” resulting from the Tax Act.

84
In August 2017, the FASB issued new accounting guidance that will allow more financial and nonfinancial hedging strategies to be eligible for hedge accounting. It also amends the presentation and disclosure requirements and changes how companies assess hedge effectiveness. It is intended to more closely align hedge accounting with risk management strategies, simplify the application of hedge accounting, and increase transparency as to the scope and results of hedging programs. The new accounting guidance will be effective for the Company on January 1, 2019. The adoption of this new accounting guidance is not expected to have a material effect on the Company’s consolidated financial statements.
In January 2017, the FASB issued new accounting guidance that simplifies the measurement of goodwill by eliminating the step two impairment test. Step two measures a goodwill impairment loss by comparing the implied fair value of goodwill with the carrying amount of that goodwill. The new guidance requires a comparison of the Company’s fair value of a reporting unit with the carrying amount and the Company is required to recognize an impairment charge for the amount by which the carrying amount exceeds the fair value. The new accounting guidance will be effective for the Company on January 1, 2020. Early adoption is permitted. The Company is currently evaluating the impact of this new accounting guidance on its consolidated financial statements.
In February 2016, the FASB issued new accounting guidance that requires lessees to recognize almost all leases on their balance sheet as a right-of-use asset and a lease liability. The income statement will reflect lease expense for operating leases, and amortization and interest expense for financing leases. The Company plans to adopt the new standard on its effective date of January 1, 2019. The Company plans to elect the practical expedients upon transition that will retain the lease classification and initial direct costs for any leases that exist prior to adoption of the new guidance. The Company also plans to elect the transition method that allows comparative periods to be presented in the year of adoption in accordance with existing guidance. The adoption of the new standard is expected to result in an increase in total assets of approximately 2.3% and an increase in total liabilities of approximately 3.2% on the Company’s consolidated balance sheet. The adoption of this standard is not expected to result in a material impact on the Company’s consolidated results of operations or cash flows. The balance sheet impact of the new standard will be finalized upon adoption in the first quarter of 2019 and is therefore subject to change.
2. Revenues by Geography, Concentration of Credit Risk and Remaining Performance Obligations
The Company attributes revenues to geographical region based upon where the services are performed. The following tables represent revenues by geographical region and reportable segment for the years ended December 31, 2018, 2017 and 2016:
Year Ended December 31, 2018
(in millions) Technology &
Analytics Solutions Research &
Development Solutions Contract Sales & Medical Solutions Total
Revenues: Americas $ 2,087 $ 2,553 $ 358 $ 4,998 Europe and Africa 1,520 1,693 235 3,448 Asia-Pacific 530 1,219 217 1,966
Total revenues $ 4,137 $ 5,465 $ 810 $ 10,412
Year Ended December 31, 2017
(in millions) Technology &
Analytics Solutions Research &
Development Solutions Contract Sales & Medical Solutions Total
Revenues: Americas $ 1,801 $ 2,375 $ 430 $ 4,606 Europe and Africa 1,372 1,663 251 3,286 Asia-Pacific 509 1,067 234 1,810
Total revenues $ 3,682 $ 5,105 $ 915 $ 9,702
Year Ended December 31, 2016
(in millions) Technology &
Analytics Solutions Research &
Development Solutions Contract Sales & Medical Solutions Total
Revenues: Americas $ 608 $ 2,205 $ 441 $ 3,254 Europe and Africa 392 1,587 240 2,219 Asia-Pacific 148 945 249 1,342
Total revenues $ 1,148 $ 4,737 $ 930 $ 6,815

85
No individual country, except for the United States and the United Kingdom, accounted for 10% or more of total revenues for the year ended December 31, 2018. For the year ended December 31, 2018, revenues in the United States and the United Kingdom accounted for 43% and 11% of total revenue, respectively.
No individual country, except for the United States, accounted for 10% or more of total revenues for the years ended December 31, 2017 and 2016. For those periods, revenue in the United States accounted for 42% and 43% of total revenues, respectively.
No individual customer represented 10% or more of total revenues for the years ended December 31, 2018, 2017 or 2016.
Transaction Price Allocated to the Remaining Performance Obligations
As of December 31, 2018, approximately $18.6 billion of revenue is expected to be recognized in the future from remaining performance obligations. The Company expects to recognize revenue on approximately 35% of these remaining performance obligations over the next twelve months, with the balance recognized thereafter. The customer contract transaction price allocated to the remaining performance obligations differs from backlog in that it does not include wholly unperformed contracts under which the customer has a unilateral right to cancel the arrangement. The Company applied the practical expedient that permits the omission of prior period information about its remaining performance obligations. No other practical expedients were applied.
3. Trade Accounts Receivable, Unbilled Services and Unearned Income
Trade accounts receivables and unbilled services consist of the following:
December 31, (in millions) 2018 2017
Trade accounts receivable: Billed $ 1,279 $ 1,229 Unbilled services 1,130 883
Trade accounts receivable and unbilled services 2,409 2,112 Allowance for doubtful accounts (15) (15)
Trade accounts receivable and unbilled services, net $ 2,394 $ 2,097
Unbilled services and unearned income was as follows:
December 31, (in millions) 2018 2017 Change
Unbilled services $ 1,130 $ 883 $ 247 Unearned income (1,007) (985) (22)
Net balance $ 123 $ (102) $ 225
Unbilled services, which is comprised of approximately equal parts of unbilled receivables and contract assets as of December 31, 2018, increased by $247 million as compared to December 31, 2017. Contract assets are unbilled services for which invoicing is based on the timing of certain milestones related to service contracts for clinical research whereas unbilled receivables are billable upon the passage of time. Unearned income increased by $22 million over the same period resulting in an increase of $225 million in the net balance of unbilled services and unearned income between December 31, 2018 and 2017. These fluctuations are primarily due to timing of payments and invoicing related to the Company’s Research & Development Solutions contracts.
Bad debt expense recognized on the Company’s receivables and unbilled services was de minimis for the years ended December 31, 2018, 2017 and 2016.

86
4. Investments
Debt, Equity and Other Securities
Current
The Company’s short-term investments in debt, equity and other securities consist primarily of trading investments in mutual funds and are measured at fair value with realized and unrealized gains and losses recorded in other expense (income), net on the accompanying consolidated statements of income.
Long-term
ASU 2016-01 became effective on January 1, 2018. ASU 2016-01 requires entities to measure equity investments (except those accounted for under the equity method, those that result in consolidation of the investee and certain other investments) at fair value and recognize any changes in fair value in net income at the end of each reporting period. Entities can no longer classify equity investments as trading or available for sale and can no longer recognize unrealized holding gains and losses on equity securities classified previously as available for sale in other comprehensive income (loss). Entities can no longer use the cost method of accounting as it was previously applied for equity securities that do not have readily determinable fair values.
For equity investments that do not have readily determinable fair values and do not qualify for the existing practical expedient in Accounting Standards Codification (“ASC”) 820 “Fair Value Measurement” (“ASC 820”) to estimate fair value using the net asset value per share of the investment, the guidance provides a new measurement alternative. Entities may choose to measure those investments at cost, less any impairment, plus or minus changes resulting from observable price changes in orderly transactions for the identical or a similar investment of the same issuer at each reporting period.
During the fourth quarter of 2018, the Company recorded the cumulative adoption of ASU 2016-01 within stockholders’ equity.
In February 2018, the Company made an investment in COTA, Inc. (“COTA”) for a minority ownership interest. The Company’s investment in COTA does not meet the criteria to be accounted for under the equity method or to be consolidated and as a result is subject to ASU 2016-01 noted above. The Company’s investment in COTA does not have a readily determinable fair value and does not qualify for the existing practical expedient in ASC 820. The Company has elected to utilize the new measurement alternative provided for in ASC 321 “Investments – Equity Securities.” The Company’s minority interest in COTA was $20 million as of December 31, 2018.
Unconsolidated Affiliates
The Company accounts for its investments in and advances to unconsolidated affiliates under the equity method of accounting and records its pro rata share of its losses or earnings from these investments in equity in earnings (losses) of unconsolidated affiliates. The following is a summary of the Company’s investments in and advances to unconsolidated affiliates:
December 31, (in millions) 2018 2017
NovaQuest Pharma Opportunities Fund III, L.P. (“NQ Fund III”) $ 30 $ 33 NovaQuest Pharma Opportunities Fund IV, L.P. (“NQ Fund IV”) 13 7 NovaQuest Pharma Opportunities Fund V, L.P. (“NQ Fund V”) 14 — NovaQuest Private Equity Fund I, L.P. (“NQ PE Fund I”) 4 — CenduitTM (“Cenduit”) 4 14 NostraData Pty Ltd. (“NostraData”) 7 8 TransMed Systems, Inc. (“TransMed”) 20 — Other 9 8 $ 101 $ 70

87
NovaQuest Pharma Opportunities Funds
The Company has committed to invest up to $50 million as a limited partner in NQ Fund III. As of December 31, 2018, the Company has funded approximately $43.5 million and has approximately $6.5 million of remaining funding commitments. As of December 31, 2018 and 2017, the Company had a 10.9% ownership interest in NQ Fund III.
The Company has committed to invest up to $20 million as a limited partner in NQ Fund IV. As of December 31, 2018, the Company has funded approximately $17.0 million and has approximately $3.0 million of remaining funding commitments. As of December 31, 2018 and 2017, the Company had a 2.5% ownership interest in NQ Fund IV.
In April 2018, the Company committed to invest up to $45 million and $5 million as a limited partner in NQ Fund V and NQ PE Fund I, respectively. As of December 31, 2018, the Company has funded approximately $13.5 million and has approximately $31.5 million of remaining funding commitments in NQ Fund V and it has funded approximately $3.8 million and has approximately $1.2 million of remaining funding commitments in NQ PE Fund I. As of December 31, 2018, the Company had a 7.9% and 5.2% ownership interest in NQ Fund V and NQ PE Fund I, respectively.
Cenduit
In May 2007, the Company and Thermo Fisher Scientific Inc. (“Thermo Fisher”) completed the formation of a joint venture, Cenduit. The Company contributed its Interactive Response Technology operations in India and the United States. Thermo Fisher contributed its Fisher Clinical Services Interactive Response Technology operations in three locations — the United Kingdom, the United States and Switzerland. Additionally, each company contributed $4 million in initial capital. The Company and Thermo Fisher each own 50% of Cenduit. Cenduit provides project related services to the Company on an as needed basis.
NostraData
In November 2015, IMS Health made a 10.25 million AUD (approximately 9 million USD) investment in NostraData for a 24% equity interest. NostraData provides data to the Company on an as needed basis.
TransMed
In August 2018, the Company made a $20 million investment in TransMed and had a 31% equity interest as of December 31, 2018.
See Note 18 for information regarding related party transactions.
Variable Interest Entities
As of December 31, 2018, the Company’s investments in unconsolidated variable interest entities (“VIEs”) and its estimated maximum exposure to loss were as follows:
(in millions)
Investments inUnconsolidated
VIEs
MaximumExposure to
Loss
NQ Fund III $ 30 $ 37 NQ Fund IV 13 16 NQ Fund V 14 46 NQ PE Fund I 4 5 Pappas Life Science Ventures V, L.P. 1 5 $ 62 $ 109
The Company has determined that these funds are VIEs but that the Company is not the primary beneficiary as it does not have a controlling financial interest in these funds. However, because the Company has the ability to exercise significant influence, it accounts for its investments in these funds under the equity method of accounting and records its pro rata share of earnings and losses in equity in earnings (losses) of unconsolidated affiliates on the accompanying consolidated statements of income. The investment assets of unconsolidated VIEs are included in investments in and advances to unconsolidated affiliates on the accompanying consolidated balance sheets.

88
5. Derivatives
Foreign Exchange Risk Management
The Company transacts business in more than 100 countries and is subject to risks associated with fluctuating foreign exchange rates. Accordingly, the Company enters into foreign currency forward contracts to (i) hedge certain forecasted foreign exchange cash flows arising from service contracts (“Service Contract Hedging”) and (ii) hedge non-United States dollar anticipated intercompany royalties (“Royalty Hedging”). It is the Company’s policy to enter into foreign currency transactions only to the extent necessary to reduce earnings and cash flow volatility associated with foreign exchange rate movements. The Company does not enter into foreign currency transactions for investment or speculative purposes. The principal currencies hedged are the Euro, the British Pound, the Japanese Yen, the Swiss Franc and the Canadian dollar.
Service Contract Hedging and Royalty Hedging contracts are designated as hedges and are carried at fair value, with changes in the fair value recorded to AOCI. The change in fair value is reclassified from AOCI to earnings in the period in which the hedged transaction occurs. These contracts have various expiration dates through November 2019.
As of December 31, 2018, the Company had open Service Contract Hedging and Royalty Hedging contracts to hedge certain forecasted foreign currency cash flow transactions occurring in 2019 with notional amounts totaling $202 million. As of December 31, 2017, the Company had open Service Contract Hedging and Royalty Hedging contracts to hedge certain forecasted foreign currency cash flow transactions occurring in 2018. For accounting purposes these hedges are considered highly effective. As of December 31, 2018 and 2017, the Company had recorded gross unrealized gains (losses) of $5 million and ($3) million and $5 million and ($4) million, respectively, related to these contracts. Upon expiration of the hedge instruments in 2019, the Company will reclassify the unrealized holding gains and losses on the derivative instruments included in AOCI into earnings. The unrealized gains (losses) are included in other current assets and liabilities on the accompanying consolidated balance sheets as of December 31, 2018 and 2017.
Interest Rate Risk Management
The Company purchases interest rate caps and has entered into interest rate swap agreements for purposes of managing its exposure to interest rate fluctuations.
In April 2014, IMS Health purchased three United States dollar denominated interest rate caps (“2014 Caps”) with a total notional value of $1 billion at strike prices between 2% and 3%. These caps commenced at various times between April 2014 and April 2016 and expire in April 2019. The 2014 Caps are accounted for as cash flow hedges. As of December 31, 2018, only two of the 2014 Caps remain unexpired, with a notional value of $700 million. IMS Health also entered into United States dollar and Euro denominated interest rate swap agreements in April 2014 (“2014 Swaps”) to hedge interest rate exposure on notional amounts of approximately $600 million of its borrowings. The 2014 Swaps commenced between April and June 2014 and expire at various times through March 2021. As of December 31, 2018, only two of the 2014 Swaps remain unexpired, with a notional value of $432 million. On these agreements, the Company pays a fixed rate ranging from 1.6% to 2.1% and receives a variable rate of interest equal to the greater of three-month United States dollar London Interbank Offered Rate (“LIBOR”), three-month Euro Interbank Offered Rate (“EURIBOR”) or the equivalent to LIBOR, and 1%. During 2017, the 2014 Swaps ceased to be considered highly effective for accounting purposes and as such, the Company discontinued hedge accounting and prospective changes in the fair value of the Swaps are recognized in earnings.
On June 3, 2015, the Company entered into seven forward starting interest rate swaps (“2015 Swaps”) in an effort to limit its exposure to changes in the variable interest rate on its Senior Secured Credit Facilities (as defined below). Interest on the swaps began accruing on June 30, 2016, and the interest rate swaps expire at various times through March 2020. As of December 31, 2018, only four of the 2015 Swaps were still outstanding. The Company pays a fixed rate ranging from 1.9% to 2.1% and receives a variable rate of interest equal to the three-month LIBOR on these agreements.
The critical terms of the 2015 Swaps are substantially the same as the underlying borrowings. These interest rate swaps are being accounted for as cash flow hedges as these transactions were executed to hedge the Company’s interest payments and for accounting purposes are considered highly effective. As such, the effective portion of the hedges is recorded as unrealized gains (losses) on derivatives included in AOCI and the ineffective portion of the hedges is recognized in earnings.

89
On July 19, 2018, the Company entered into two forward starting interest rate swaps (“2018 Swaps”) with a total notional value of $500 million in an effort to limit its exposure to changes in the variable interest rate on its Senior Secured Credit Facilities (as defined below). Interest on the 2018 Swaps begins accruing on June 28, 2019 and the interest rate swaps expire on June 28, 2024. The Company pays a fixed rate of 3.0% and receives a variable rate of interest equal to the three-month LIBOR on the 2018 Swaps.
The fair value of these interest rate swaps represents the present value of the anticipated net payments the Company will make to the counterparty, which, when they occur, are reflected as interest expense on the consolidated statements of income. These interest rate swaps will result in a total debt mix of approximately 50% fixed rate debt and 50% variable rate debt, before the additional protection arising from the interest rate caps.
Net Investment Risk Management
The Company designates its foreign currency denominated debt as a hedge of its net investment in certain foreign subsidiaries to reduce the volatility in stockholders’ equity caused by changes in the Euro exchange rate with respect to the United States dollar, which is accounted for as a cash flow hedge. As of December 31, 2018, these borrowings (net of original issue discount) were €4,590 million ($5,253 million). The effective portion of foreign exchange gains or losses on the remeasurement of the debt is recognized in the cumulative translation adjustment component of AOCI with the related offset in long-term debt. Those amounts would be reclassified from AOCI to earnings upon the sale or substantial liquidation of these net investments. The amount of foreign exchange gains related to the net investment hedge included in the cumulative translation adjustment component of AOCI for the year ended December 31, 2018 was $228 million.
The fair values of the Company’s derivative instruments and the line items on the accompanying consolidated balance sheets to which they were recorded are summarized in the following table:
December 31, 2018 December 31, 2017
(in millions) Balance SheetClassification Assets Liabilities Notional Assets Liabilities Notional
Derivatives designated as hedging instruments: Foreign exchange forward contracts
Other current assets and liabilities $ 5 $ 3 $ 202 $ 5 $ 4 $ 282
Interest rate swaps
Other assets and liabilities 3 9 890 — 1 405
Interest rate caps
Deposits and other assets 1 — 700 1 — 700
Derivatives not designated as hedging instruments: Interest rate swaps Other liabilities — 5 432 — 8 447 Total derivatives $ 9 $ 17 $ 6 $ 13
The pre-tax effect of the Company’s cash flow hedging instruments on other comprehensive (loss) income is summarized in the following table:
Year Ended December 31, (in millions) 2018 2017 2016
Foreign exchange forward contracts $ (9) $ (5) $ 16 Interest rate derivatives (6) 9 8
Total $ (15) $ 4 $ 24
The Company expects approximately $6 million of pre-tax unrealized gains related to its foreign exchange contracts and interest rate derivatives included in AOCI at December 31, 2018 to be reclassified into earnings within the next twelve months.

90
6. Fair Value Measurements
The Company records certain assets and liabilities at fair value. Fair value is defined as the price that would be received to sell an asset or paid to transfer a liability in the principal or most advantageous market for the asset or liability in an orderly transaction between market participants at the measurement date. A three-level fair value hierarchy that prioritizes the inputs used to measure fair value is described below. This hierarchy requires entities to maximize the use of observable inputs and minimize the use of unobservable inputs. The three levels of inputs used to measure fair value are as follows:
• Level 1—Quoted prices in active markets for identical assets or liabilities.
• Level 2—Observable inputs other than quoted prices included in Level 1, such as quoted prices for similar assets and liabilities in active markets; quoted prices for identical or similar assets and liabilities in markets that are not active; or other inputs that are observable or can be corroborated by observable market data.
• Level 3—Unobservable inputs that are supported by little or no market activity. This includes certain pricing models, discounted cash flow methodologies and similar techniques that use significant unobservable inputs.
The carrying values of cash, cash equivalents, accounts receivable and accounts payable approximated their fair values at December 31, 2018 and 2017 due to their short-term nature. At December 31, 2018 and 2017, the fair value of total debt approximated $10,850 million and $10,432 million, respectively, as determined under Level 1 and Level 2 measurements for these financial instruments.
Recurring Fair Value Measurements
The following table summarizes the fair value of the Company’s financial assets and liabilities that are measured and reported at fair value on a recurring basis as of December 31, 2018:
(in millions) Level 1 Level 2 Level 3 Total
Assets: Marketable securities $ 63 $ — $ — $ 63 Derivatives — 9 — 9
Total $ 63 $ 9 $ — $ 72
Liabilities: Derivatives $ — $ 17 $ — $ 17 Contingent consideration — — 123 123
Total $ — $ 17 $ 123 $ 140
The following table summarizes the fair value of the Company’s financial assets and liabilities that are measured and reported at fair value on a recurring basis as of December 31, 2017:
(in millions) Level 1 Level 2 Level 3 Total
Assets: Marketable securities $ 46 $ — $ — $ 46 Derivatives — 6 — 6
Total $ 46 $ 6 $ — $ 52
Liabilities: Derivatives $ — $ 13 $ — $ 13 Contingent consideration — — 69 69
Total $ — $ 13 $ 69 $ 82

91
Below is a summary of the valuation techniques used in determining fair value:
Marketable securities—The Company values trading and available-for-sale securities using the quoted market value of the securities held.
Derivatives—Derivatives consist of foreign exchange contracts and interest rate caps and swaps. The fair value of foreign exchange contracts is based on observable market inputs of spot and forward rates or using other observable inputs. The fair value of the interest rate caps and swaps is the estimated amount that the Company would receive or pay to terminate such agreements, taking into account market interest rates and the remaining time to maturities or using market inputs with mid-market pricing as a practical expedient for bid-ask spread.
Contingent consideration—The Company values contingent consideration related to business combinations using a weighted probability calculation of potential payment scenarios discounted at rates reflective of the risks associated with the expected future cash flows. Key assumptions used to estimate the fair value of contingent consideration include various financial metrics (revenue performance targets and operating forecasts) and the probability of achieving the specific targets.
The following table summarizes the changes in Level 3 financial assets and liabilities measured on a recurring basis for the year ended December 31:
Contingent Consideration (in millions) 2018 2017 2016
Balance as of January 1 $ 69 $ 18 $ 4 Business combinations 53 57 19 Contingent consideration paid (24) (4) (4)Revaluations included in earnings and foreign currency translation adjustments 25 (2) (1)Balance as of December 31 $ 123 $ 69 $ 18
The current portion of contingent consideration is included within accrued expenses and the long-term portion is included within other liabilities on the accompanying consolidated balance sheets. Revaluations of contingent consideration are recognized in other expense (income), net on the accompanying consolidated statements of income.
Non-recurring Fair Value Measurements
Certain assets are carried on the accompanying consolidated balance sheets at cost and are not remeasured to fair value on a recurring basis. These assets include equity investments that do not have readily determinable fair values that are assessed for impairment quarterly or annually and when a triggering event occurs, and goodwill and identifiable intangible assets that are tested for impairment annually and when a triggering event occurs. See Note 4 and 8 for additional information.
As of December 31, 2018, assets carried on the balance sheet and not remeasured to fair value on a recurring basis totaled approximately $17,878 million and were identified as Level 3. These assets are comprised of cost and equity method investments of $127 million, goodwill of $11,800 million and other identifiable intangibles, net of $5,951 million.
Cost and Equity Method Investments—The inputs available for valuing investments in non-public portfolio companies are generally not easily observable. The valuation of non-public investments requires significant judgment by the Company due to the absence of quoted market values, inherent lack of liquidity and the long-term nature of such assets. When a triggering event occurs, the Company considers a wide range of available market data when assessing the estimated fair value. Such market data includes observations of the trading multiples of public companies considered comparable to the private companies being valued as well as publicly disclosed merger transactions involving comparable private companies. In addition, valuations are adjusted to account for company-specific issues, the lack of liquidity inherent in a non-public investment and the fact that comparable public companies are not identical to the companies being valued. Such valuation adjustments are necessary because in the absence of a committed buyer and completion of due diligence similar to that performed in an actual negotiated sale process, there may be company-specific issues that are not fully known that may affect value. Further, a variety of additional factors are reviewed by the Company, including, but not limited to, financing and sales transactions with third parties, current operating performance and future expectations of the particular investment, changes in market outlook and the third-party financing environment. Because of the inherent uncertainty of valuations, estimated valuations may differ significantly from the values that would have been used had a ready market for the securities existed, and the differences could be material.

92
Goodwill—Goodwill represents the difference between the purchase price and the fair value of the identifiable tangible and intangible net assets resulting from business combinations. The Company performs a qualitative analysis to determine whether it is more likely than not that the estimated fair value of a reporting unit is less than its book value. This includes a qualitative analysis of macroeconomic conditions, industry and market considerations, internal cost factors, financial performance, fair value history and other company specific events. If this qualitative analysis indicates that it is more likely than not that the estimated fair value is less than the book value for the respective reporting unit, the Company applies a two-step impairment test in which the Company determines whether the estimated fair value of the reporting unit is in excess of its carrying value. If the carrying value of the net assets assigned to the reporting unit exceeds the estimated fair value of the reporting unit, the Company performs the second step of the impairment test to determine the implied estimated fair value of the reporting unit’s goodwill. The Company determines the implied estimated fair value of goodwill by determining the present value of the estimated future cash flows for each reporting unit and comparing the reporting unit’s risk profile and growth prospects to selected, reasonably similar publicly traded companies. See Note 8 for additional information.
Definite-lived Intangible Assets—If a triggering event occurs, the Company determines the estimated fair value of definite-lived intangible assets by determining the present value of the expected cash flows. See Note 8 for additional information.
Indefinite-lived Intangible Asset—If a qualitative analysis indicates that it is more likely than not that the estimated fair value is less than the carrying value of an indefinite-lived intangible asset, the Company determines the estimated fair value of the indefinite-lived intangible asset (trade name) by determining the present value of the estimated royalty payments on an after-tax basis that it would be required to pay the owner for the right to use such trade name. If the carrying amount exceeds the estimated fair value, an impairment loss is recognized in an amount equal to the excess.
7. Property and Equipment
The major classes of property and equipment were as follows:
December 31, (in millions) 2018 2017
Land, buildings and leasehold improvements $ 326 $ 324 Equipment 521 446 Furniture and fixtures 82 81 Transportation equipment 72 72 Property and equipment, gross 1,001 923 Less accumulated depreciation (567) (483)Property and equipment, net $ 434 $ 440
Property and equipment depreciation expense was as follows:
Year Ended December 31, (in millions) 2018 2017 2016
Depreciation expense $ 125 $ 125 $ 79
8. Goodwill and Identifiable Intangible Assets
As of December 31, 2018, the Company has approximately $5,951 million of identifiable intangible assets, of which approximately $18 million, relating to a trade name, is deemed to be indefinite-lived and, accordingly, is not being amortized. Amortization expense associated with identifiable definite-lived intangible assets was as follows:
Year Ended December 31, (in millions) 2018 2017 2016
Amortization expense $ 1,016 $ 886 $ 210
Estimated amortization expense for existing identifiable intangible assets is expected to be approximately $1,052 million, $997 million, $839 million, $489 million and $405 million for the years ending December 31, 2019, 2020, 2021, 2022 and 2023, respectively. Estimated amortization expense can be affected by various factors, including future acquisitions or divestitures of service and/or licensing and distribution rights or impairments.

93
The following is a summary of identifiable intangible assets:
As of December 31, 2018 As of December 31, 2017
(in millions) Gross
Amount AccumulatedAmortization
NetAmount
GrossAmount
AccumulatedAmortization
NetAmount
Definite-lived identifiable intangible assets: Client relationships and backlog $ 4,620 $ (863) $ 3,757 $ 4,604 $ (474) $ 4,130 Trademarks, trade names and other 526 (108) 418 528 (59) 469 Databases 1,828 (823) 1,005 1,876 (468) 1,408 Software and related assets 1,279 (543) 736 927 (382) 545 Non-compete agreements 27 (10) 17 24 (3) 21 $ 8,280 $ (2,347) $ 5,933 $ 7,959 $ (1,386) $ 6,573
Indefinite-lived identifiable intangible assets: Trade names $ 18 $ — $ 18 $ 18 $ — $ 18
The following is a summary of goodwill by segment for the years ended December 31, 2018 and 2017:
(in millions) Technology &
Analytics Solutions
Research &Development
Solutions Contract Sales & Medical Solutions Consolidated
Balance as of December 31, 2016 $ 9,415 $ 1,196 $ 116 $ 10,727 Business combinations 403 178 — 581 Impairment (40) — — (40)Impact of foreign currency fluctuations and other 570 11 1 582 Balance as of December 31, 2017 10,348 1,385 117 11,850 Business combinations 135 49 18 202 Impact of foreign currency fluctuations and other (244) (7) (1) (252)Balance as of December 31, 2018 $ 10,239 $ 1,427 $ 134 $ 11,800
During 2017 and 2016, the Company determined there was sufficient indication that the carrying value of Encore Health Resources LLC (“Encore”) should be reviewed for impairment that resulted in recognized impairment losses of $40 million and $28 million, respectively, for declines in fair value of goodwill and identifiable intangible assets. Subsequent to the sale of Encore in 2017, there were no remaining accumulated goodwill impairment losses as of December 31, 2018 or 2017.
9. Accrued Expenses
Accrued expenses consist of the following:
December 31, (in millions) 2018 2017
Compensation, including bonuses, fringe benefits and payroll taxes $ 660 $ 656 Restructuring 74 84 Interest 45 45 Client contract related 678 565 Professional fees 91 76 Contingent consideration and deferred purchase price 90 59 Other 220 179 $ 1,858 $ 1,664

94
10. Credit Arrangements
The following is a summary of the Company’s revolving credit facilities at December 31, 2018:
Facility Interest Rates
$1,500 million (revolving credit facility) LIBOR in the relevant currency borrowed plus a margin of 1.50% at December 31, 2018
$25 million (receivables financing facility) LIBOR Market Index Rate (2.50% at December 31, 2018) plus 0.90%£10 million (approximately $13 million) general banking facility
Bank’s base rate of 0.75% at December 31, 2018 plus 1%
The following table summarizes the Company’s debt at the dates indicated:
December 31, (dollars in millions) 2018 2017
Senior Secured Credit Facilities: Term A Loan due 2023—U.S. Dollar LIBOR at average floating rates of 4.30% $ 812 $ 844 Term A Loan due 2023—Euro LIBOR at average floating rates of 1.50% 416 453 Term B Loan due 2024—U.S. Dollar LIBOR at average floating rates of 4.80% 535 1,188 Term B Loan due 2024—Euro LIBOR at average floating rates of 2.75% 1,346 1,423 Term B Loan due 2025—U.S. Dollar LIBOR at average floating rates of 4.80% 741 748 Term B Loan due 2025—U.S. Dollar LIBOR at average floating rates of 4.27% 945 — Term B Loan due 2025—Euro LIBOR at average floating rates of 2.50% 664 —
Revolving Credit Facility due 2023: U.S. Dollar denominated borrowings—U.S. Dollar LIBOR at average floating rates of 3.91% 620 529
5.0% Senior Notes due 2026—U.S. Dollar denominated 1,050 1,050 2.875% Senior Notes due 2025—Euro denominated 481 503 3.25% Senior Notes due 2025—Euro denominated 1,631 1,707 3.5% Senior Notes due 2024—Euro denominated 715 749 4.875% Senior Notes due 2023—U.S. Dollar denominated 800 800 Receivables financing facility due 2020—U.S. Dollar LIBOR at average floating rates of 3.40% 300 275 Principal amount of debt 11,056 10,269 Less: unamortized discount and debt issuance costs (49) (44)Less: current portion (100) (103)Long-term debt $ 10,907 $ 10,122
Contractual maturities of long-term debt at December 31, 2018 are as follows: (in millions) 2019 $ 100 2020 400 2021 100 2022 100 2023 2,434 Thereafter 7,922 $ 11,056
At December 31, 2018, there were bank guarantees totaling approximately £1.6 million (approximately $2.0 million) issued against the availability of the general banking facility with a European headquartered bank through their operations in the United Kingdom.

95
Senior Secured Credit Agreement and Senior Notes
2018 Financing Transactions
At December 31, 2018, the Company’s Fourth Amended and Restated Credit Agreement, as amended (the “Credit Agreement”) provided financing through several senior secured credit facilities (collectively, the “Senior Secured Credit Facilities”) of up to approximately $6,959 million, which consisted of $6,079 million principal amounts of debt outstanding (as detailed in the table above) and $880 million of available borrowing capacity on the $1,500 million revolving credit facility that expires in 2023.
On June 11, 2018, the Company entered into Amendment No. 4 (the “Amendment”) to its Fourth Amended and Restated Credit Agreement that amended the terms of the existing term A loans and revolving credit facility to extend the maturity from 2021 to 2023 and reduce the applicable interest rate from LIBOR plus a margin ranging from 1.75% to 2.50% to LIBOR plus a margin ranging from 1.25% to 2.00%. In connection with the Amendment, the Company recognized a $2 million loss on extinguishment of debt, which includes fees and related expenses. The amendments with respect to the revolving credit facility and the term A loans became effective on June 13, 2018.
Under the Amendment, the Company also placed additional term B loans. The additional term B loans will mature in 2025 and were comprised of $950 million of U.S. dollar denominated term B loans and €583 million ($681 million) Euro denominated term B loans. The U.S. dollar denominated term B loans bear interest based on the U.S. Dollar LIBOR plus a margin ranging from 1.75% to 2.00%. The Euro denominated term B loans bear interest based on the Euro LIBOR with a floor ranging from 0.50% to 0.75%, plus a margin of 2.00%. The proceeds of the additional term B loans were used to pay down the revolving credit facility and $650 million of existing term B loans due 2024 and to pay fees and expenses in connection with the transactions.
On April 6, 2018, the Company entered into Amendment No. 3 to its Fourth Amended and Restated Credit Agreement that increased the amount of commitments available to the Company and certain of its subsidiaries to $1,500 million under the revolving credit facility. No other terms of the credit agreement were amended.
2017 Financing Transactions
On September 14, 2017, the Company’s wholly owned subsidiary, IQVIA Inc. (formerly Quintiles IMS Incorporated) (the “Issuer”), issued €420 million (approximately $501 million) aggregate principal amount of 2.875% senior notes due 2025 (the “2025 Notes”). The 2025 Notes, which are unsecured obligations of the Issuer, mature on September 15, 2025 and bear an interest rate of 2.875%, which is paid semi-annually on March 15 and September 15 of each year, beginning on March 15, 2018. The 2025 Notes may be redeemed prior to their final stated maturity, subject to a customary make-whole premium at any time prior to September 15, 2020 (subject to a certain customary “equity claw” redemption right) and thereafter subject to a redemption premium declining from 1.438% to 0%. On September 18, 2017, the Company amended its senior credit facility agreement (the “No. 2 Amendment”) to provide for an incremental term B loan of $750 million and to increase the facility’s restricted payment capacity, specifically an increase to the total net leverage ratio conditions for unlimited restricted investments from 4.25-to-1.00 to 4.50-to-1.00 and for dividends and distributions from 4.00-to-1.00 to 4.50-to-1.00. The new term B loan will mature in 2025 and bear a floating interest rate of LIBOR plus 2.00% per year.
On March 7, 2017, the Company refinanced all of its term B loans due 2021—U.S. dollar denominated (approximately $1,700 million) and its term B loans due 2021—Euro denominated (approximately $765 million) with an extended and repriced term B loan facility due in 2024 for an aggregate principal amount of approximately $2,479 million comprised of $1,200 million U.S. dollar denominated term B loans and €1,200 million ($1,279 million) Euro denominated term B loans. The U.S. dollar denominated term B loans bear interest based on the U.S. Dollar LIBOR with a floor of 0.75%, plus a margin of 2.00%. The Euro denominated term B loans bear interest based on the Euro LIBOR with a floor of 0.75%, plus a margin of 2.00%. In connection with this refinancing, the Company recognized a $3 million loss on extinguishment of debt, which includes fees and related expenses.
On February 28, 2017, the Issuer issued €1,425 million (approximately $1,522 million) aggregate principal amount of 3.25% senior notes due 2025 (the “2017 Notes”). The 2017 Notes, which are unsecured obligations of the Issuer, mature on March 15, 2025 and bear an interest rate of 3.25%, which is paid semi-annually on March 15 and September 15 of each year, beginning on September 15, 2017. The 2017 Notes may be redeemed prior to their final stated maturity, subject to a customary make-whole premium at any time prior to March 15, 2020 (subject to a certain customary “equity claw” redemption right) and thereafter subject to annually declining redemption premiums at any time prior to March 15, 2022. During March 2017, the proceeds of the 2017 Notes were used to pay fees and expenses related to the notes offering and the refinancing referenced above and other general corporate purposes, including the repurchase of the Company’s common stock.

96
The net proceeds from the offering of the 2025 Notes and the No. 2 Amendment were used to refinance certain indebtedness, including the redemption of the outstanding 4.125% Euro denominated senior notes due 2023 (the “4.125% Notes”), to pay down the revolving credit facility, to pay fees and expenses related to the offering of the 2025 Notes and the No. 2 Amendment and for other general corporate purposes, including the repurchase of the Company’s common stock and acquisitions. In connection with this refinancing, the Company recognized a $16 million loss on extinguishment of debt, which includes the 4.125% Notes make-whole premium.
Receivables Financing Facility
On December 15, 2017, the Company amended its receivables financing facility to extend the original term of the facility to December 15, 2020. In addition, the applicable margin (over LIBOR) changed to 90 bps regardless of the Company’s credit rating. Prior to the amendment, the margin was based on the Company’s credit rating and could range from 85 bps to 135 bps.
On December 5, 2014, the Company entered into a four-year arrangement to securitize certain of its accounts receivable. Under the receivables financing facility, certain of the Company’s accounts receivable are sold on a non-recourse basis by certain of its consolidated subsidiaries to another of its consolidated subsidiaries, a bankruptcy-remote special purpose entity (“SPE”). The SPE obtained a term loan and revolving loan commitment from a third-party lender, secured by liens on the assets of the SPE, to finance the purchase of the accounts receivable, which includes a $275 million term loan and a $25 million revolving loan commitment. The revolving loan commitment may be increased by an additional $35 million as amounts are repaid under the term loan. The Company has guaranteed the performance of the obligations of existing and future subsidiaries that sell and service the accounts receivable under the receivables financing facility. The assets of the SPE are not available to satisfy any of the Company’s obligations or any obligations of its subsidiaries. As of December 31, 2018, no additional amounts of revolving loans were available under the receivables financing facility.
Restrictive Covenants
The Company’s debt agreements provide for certain covenants and events of default customary for similar instruments, including a covenant not to exceed a specified ratio of consolidated senior secured net indebtedness to Consolidated EBITDA, as defined in the Credit Agreement and a covenant to maintain a specified minimum interest coverage ratio. If an event of default occurs under any of the Company’s or the Company’s subsidiaries’ financing arrangements, the creditors under such financing arrangements will be entitled to take various actions, including the acceleration of amounts due under such arrangements, and in the case of the lenders under the Credit Agreement, other actions permitted to be taken by a secured creditor. The Company’s long-term debt arrangements contain usual and customary restrictive covenants that, among other things, place limitations on the Company’s ability to declare dividends. At December 31, 2018, the Company was in compliance in all material respects with the financial covenants under the Company’s financing arrangements.

97
11. Leases
The Company leases facilities under operating leases, many of which contain renewal and escalation clauses. The Company also leases certain equipment and motor vehicles under operating leases. The leases expire at various dates through 2029 with options to cancel certain leases at various intervals. Rental expenses under these agreements were $197 million, $197 million and $127 million in 2018, 2017 and 2016, respectively.
The following is a summary of future minimum payments under operating leases that have initial or remaining non-cancelable lease terms in excess of one year at December 31, 2018:
(in millions) Operating
Leases
2019 $ 167 2020 136 2021 108 2022 90 2023 69 Thereafter 119 Total minimum lease payments $ 689
12. Contingencies
The Company and its subsidiaries are involved in legal and tax proceedings, claims and litigation arising in the ordinary course of business. Management periodically assesses the Company’s liabilities and contingencies in connection with these matters based upon the latest information available. For those matters where management currently believes it is probable that the Company will incur a loss and that the probable loss or range of loss can be reasonably estimated, the Company has recorded reserves in the consolidated financial statements based on its best estimates of such loss. In other instances, because of the uncertainties related to either the probable outcome or the amount or range of loss, management is unable to make a reasonable estimate of a liability, if any. However, even in many instances where the Company has recorded an estimated liability, the Company is unable to predict with certainty the final outcome of the matter or whether resolution of the matter will materially affect the Company’s results of operations, financial position or cash flows. As additional information becomes available, the Company adjusts its assessments and estimates of such liabilities accordingly.
The Company routinely enters into agreements with its suppliers to acquire data and with its clients to sell data, all in the normal course of business. In these agreements, the Company sometimes agrees to indemnify and hold harmless the other party for any damages such other party may suffer as a result of potential intellectual property infringement and other claims related to the use of the data. The Company has not accrued a liability with respect to these matters, as the exposure is considered remote.
Based on its review of the latest information available, management does not expect the impact of pending legal and tax proceedings, claims and litigation, either individually or in the aggregate, to have a material adverse effect on the Company’s results of operations, cash flows or financial position. However, one or more unfavorable outcomes in any claim or litigation against the Company could have a material adverse effect for the period in which it is resolved. The following is a summary of certain legal matters involving the Company.
The Company’s wholly-owned subsidiary, IMS Government Solutions Inc. (“IMS Government Solutions”), is primarily engaged in providing services under contracts with the United States government. United States government contracts are subject to extensive legal and regulatory requirements and, from time to time, agencies of the United States government have the ability to investigate whether contractors’ operations are being conducted in accordance with such requirements. IMS Government Solutions discovered potential noncompliance with various contract clauses and requirements under its General Services Administration Contract (the “GSA Contract”), which was awarded in 2002 to its predecessor company, Synchronous Knowledge Inc. (Synchronous Knowledge Inc. was acquired by IMS Health in May 2005). The potential noncompliance arose from two primary areas: first, at the direction of the government, work performed under one task order was invoiced under another task order without the appropriate modifications to the orders being made; and second, personnel who did not meet strict compliance with the labor categories component of the qualification requirements of the GSA Contract were assigned to contracts. The Company is currently unable to determine the outcome of all of these matters pending the resolution of the Voluntary Disclosure Program process and the ultimate liability arising from these matters could exceed the Company’s current reserves.

98
On February 13, 2014, a group of approximately 1,200 medical doctors and 900 private individuals filed a civil lawsuit with the Seoul Central District Court against IMS Korea and two other defendants, KPA and the Korean Pharmaceutical Information Center (“KPIC”). The civil lawsuit alleges KPA and KPIC collected their personal information in violation of applicable privacy laws without the necessary consent through a software system installed on pharmacy computer systems in Korea, and that personal information was transferred to IMS Korea and sold to pharmaceutical companies. On September 11, 2017, the District Court issued a final decision that the encryption in use by the defendants since June 2014 was adequate to meet the requirements of the Korean Personal Information Privacy Act (“PIPA”) and the sharing of non-identified information for market research purposes was allowed under PIPA. The District Court also found an earlier version of encryption was insufficient to meet PIPA requirements, but no personal data had been leaked or re-identified. The District Court did not award any damages to plaintiffs. Approximately 280 medical doctors and 200 private individuals appealed the District Court decision. The Company believes the appeal is without merit and intends to vigorously defend its position.
On July 23, 2015, indictments were issued by the Seoul Central District Prosecutors’ Office in South Korea against 24 individuals and companies alleging improper handling of sensitive health information in violation of, among others, South Korea’s Personal Information Protection Act. IMS Korea and two of its employees were among the individuals and organizations indicted. Although there is no assertion that IMS Korea used patient identified health information in any of its offerings, prosecutors allege that certain of IMS Korea’s data suppliers should have obtained patient consent when they converted sensitive patient information into non-identified data and that IMS Korea had not taken adequate precautions to reduce the risk of re-identification. The Company believes the indictment is without merit as it acted in compliance with all applicable laws at all times and intends to vigorously defend its position.
On January 10, 2017, IQVIA Inc., IMS Health Incorporated and IMS Software Services, Inc. (collectively “IQVIA Parties”) filed a lawsuit in the U.S. District Court for the District of New Jersey against Veeva Systems, Inc. (“Veeva”) alleging Veeva unlawfully used IQVIA Parties intellectual property to improve Veeva data offerings, to promote and market Veeva data offerings and to improve Veeva technology offerings. IQVIA Parties seek injunctive relief, appointment of a monitor, the award of compensatory and punitive damages and reimbursement of all litigation expenses, including reasonable attorneys’ fees and costs. On March 13, 2017, Veeva filed counterclaims alleging anticompetitive business practices in violation of the Sherman Act and state laws. Veeva claims damages in excess of $200 million, and is seeking punitive damages and litigation costs, including attorneys’ fees. The Company believes the counterclaims are without merit, reject all counterclaims raised by Veeva and intend to vigorously defend IQVIA Parties’ position and pursue the Company’s claims against Veeva.
13. Stockholders’ Equity
Preferred Stock
The Company is authorized to issue 1.0 million shares of preferred stock, $0.01 per share par value. No shares of preferred stock were issued and outstanding as of December 31, 2018 or 2017.
Equity Repurchase Program
On October 30, 2013, the Company’s Board of Directors (the “Board”) approved an equity repurchase program (the “Repurchase Program”) authorizing the repurchase of up to $125 million of either the Company’s common stock or vested in-the-money employee stock options, or a combination thereof. The Board increased the stock repurchase authorization under the Repurchase Program with respect to the repurchase of its common stock by $600 million, $1.5 billion, $2 billion and $1.5 billion in 2015, 2016, 2017 and 2018, respectively, which increased the total amount that has been authorized under the Repurchase Program to $5.725 billion. The Repurchase Program does not obligate the Company to repurchase any particular amount of common stock or vested in-the-money employee stock options, and it may be modified, extended, suspended or discontinued at any time.
As of December 31, 2018, the Company has remaining authorization to repurchase up to $285 million of its common stock under the Repurchase Program. In addition, from time to time, the Company has repurchased and may continue to repurchase common stock through private or other transactions outside of the Repurchase Program. On February 13, 2019, the Board authorized an increase in the post-merger share repurchase authorization by $2.0 billion, resulting in approximately $2.3 billion remaining authorization.

99
2018 Offerings
In November 2018, the Company completed an underwritten secondary public offering of 6,000,000 shares of its common stock held by certain of the Company’s principal stockholders (the “November 2018 Selling Stockholders”), of which the Company repurchased 2,000,000 shares for an aggregate purchase price of approximately $247 million. The Company did not offer any stock in this transaction and did not receive any proceeds from the sale of the shares by the November 2018 Selling Stockholders. Pursuant to an agreement with the underwriter, the Company’s per-share purchase price for repurchased shares was the same as the per-share purchase price payable by the underwriter to the November 2018 Selling Stockholders.
In June 2018, the Company completed an underwritten secondary public offering of 12,000,000 shares of its common stock held by certain of the Company’s principal stockholders (the “June Selling Stockholders”), of which the Company repurchased 4,000,000 shares for an aggregate purchase price of approximately $412 million. The Company did not offer any stock in this transaction and did not receive any proceeds from the sale of the shares by the June Selling Stockholders. Pursuant to an agreement with the underwriter, the Company’s per-share purchase price for repurchased shares was the same as the per-share purchase price payable by the underwriter to the June Selling Stockholders.
2017 Offerings
In September 2017, the Company completed an underwritten secondary public offering of 9,000,000 shares of its common stock held by certain of the Company’s principal stockholders (the “September Selling Stockholders”), of which the Company repurchased 4,000,000 shares for an aggregate purchase price of approximately $380 million. The Company did not offer any stock in this transaction and did not receive any proceeds from the sale of the shares by the September Selling Stockholders. Pursuant to an agreement with the underwriter, the Company’s per-share purchase price for repurchased shares was the same as the per-share purchase price payable by the underwriter to the September Selling Stockholders.
On May 24, 2017, an automatic shelf registration statement (including a prospectus) relating to the offering of an unspecified amount of common stock was filed by the Company with the Securities and Exchange Commission and became effective upon filing. The registration statement will expire three years after the date of filing. Additionally, in May, the Company completed an underwritten secondary public offering of 10,571,003 shares of its common stock held by certain of the Company’s principal stockholders (the “May Selling Stockholders”), of which the Company repurchased 3,571,003 shares for an aggregate purchase price of approximately $300 million. The Company did not offer any stock in this transaction and did not receive any proceeds from the sale of the shares by the May Selling Stockholders. Pursuant to an agreement with the underwriter, the Company’s per-share purchase price for repurchased shares was the same as the per-share purchase price payable by the underwriter to the May Selling Stockholders.
In February 2017, the Company entered into a share repurchase agreement with certain of the Company’s principal stockholders under the Repurchase Program. Pursuant to that agreement, the Company purchased an aggregate of 9,677,420 shares of the Company’s common stock in a private transaction for an aggregate purchase price of approximately $750 million. This transaction was consummated on February 28, 2017.
Other Equity Repurchases
In November 2017, the Company completed an underwritten secondary public offering of 10,000,000 shares of its common stock held by certain of the Company’s principal stockholders (the “November Selling Stockholders”), of which the Company repurchased 2,500,000 shares for an aggregate purchase price of approximately $255 million. These shares were repurchased outside of the Company’s existing Repurchase Program. The Company did not offer any stock in this transaction and did not receive any proceeds from the sale of the shares by the November Selling Stockholders. Pursuant to an agreement with the underwriter, the Company’s per-share purchase price for repurchased shares was the same as the per-share purchase price payable by the underwriter to the November Selling Stockholders.
Summary
Below is a summary of the share repurchases made both under and outside of the Repurchase Program:
Year Ended December 31, (in millions, except per share data) 2018 2017 2016
Number of shares of common stock repurchased 12.6 30.9 14.3 Aggregate purchase price $ 1,396 $ 2,620 $ 1,098 Average price per share $ 111.23 $ 84.80 $ 76.57

100
Non-controlling Interests
The Company contributed businesses to a joint venture with Quest Diagnostics Incorporated (“Quest”) that was recorded at book value (carryover basis) because the Company owns 60% of the joint venture and maintains control of these businesses. As a result, Quest’s non-controlling interest in the joint venture, referred to as Q2 Solutions, is equal to 40%. Quest’s non-controlling interest was $240 million at December 31, 2018. During the year ended December 31, 2018, Q2 Solutions distributed dividends of $41 million to Quest and received a $10 million contribution from Quest to fund ongoing operational and strategic activities.
14. Business Combinations
IMS Health
On October 3, 2016, pursuant to the terms of the Merger Agreement, IMS Health merged with and into Quintiles, with Quintiles continuing as the Surviving Corporation. The combination of Quintiles and IMS Health capabilities and resources creates an information and technology enabled healthcare service provider with a full suite of end-to-end clinical and commercial offerings. The Merger was accounted for as a business combination with Quintiles considered the accounting and the legal acquirer. Immediately prior to the completion of the Merger, Quintiles reincorporated as a Delaware corporation. The Surviving Corporation changed its name to Quintiles IMS Holdings, Inc. At the effective time of the Merger, IMS Health common stock was automatically converted into 0.3840 of a share of the Company’s common stock. In addition, IMS Health equity awards held by current employees and certain members of the former IMS Health board of directors were converted into the Company’s equity awards after giving effect to the exchange ratio. The terms of these awards, including vesting provisions, are substantially consistent to those of the historical IMS Health equity awards. All of the Company’s and IMS Health’s performance units outstanding at the date of the Merger were converted into restricted stock units with service based vesting requirements. The merger consideration was approximately $10.4 billion (based on the closing price of the Company’s common stock on October 3, 2016), and consisted of the fair value of the Company’s common stock issued (approximately 126.6 million shares) in exchange for the IMS Health common stock as well as the fair value of the vested portion of the converted IMS Health equity awards. The Merger-date value of former IMS Health stock-based awards was valued using the Black-Scholes-Merton model and apportioned between Merger consideration (purchase price) and unearned compensation to be recognized in expense as earned in future periods based on remaining service periods. In connection with the IMS Health acquisition, the Company recorded goodwill, primarily attributable to the assembled workforce of IMS Health and the expected synergies, which was assigned to the Technology & Analytics Solutions segment ($9,688 million), the Research & Development Solutions segment ($533 million) and the Contract Sales & Medical Solutions segment ($67 million). The goodwill is not deductible for income tax purposes.
The following table summarizes the estimated fair value of the net assets acquired at the date of the acquisition:
(in millions) IMS Health
Assets acquired: Cash and cash equivalents $ 2,031 Accounts receivable and unbilled services 528 Prepaid expenses 85 Other current assets 145 Property and equipment 247 Goodwill 10,288 Other identifiable intangibles 6,435 Deferred income tax asset – long-term 25 Other long-term assets 71
Liabilities assumed: Accounts payable and accrued expenses (700)Unearned income (175)Current portion of long-term debt (88)Other current liabilities (45)Long-term debt, less current portion (6,070)Deferred income tax liability – long-term (2,104)Other long-term liabilities (248)
Net assets acquired $ 10,425

101
The other identifiable intangible assets consisted of the following:
(in millions) IMS Health
Client relationships $ 3,960 Trade names 385 Databases 1,820 Software 270 Total other identifiable intangibles $ 6,435
Amortized over a weighted average useful life (in years) 18
Acquisition Related Costs
Acquisition related costs include the direct and incremental costs associated with mergers and acquisitions such as investment banking, legal, accounting and consulting fees. The Company recognized approximately $36 million of acquisition related costs associated with the IMS Health merger during the year ended December 31, 2016, which are included with merger related costs on the consolidated statement of income. Acquisition related costs for all other acquisitions were immaterial and are not presented.
Unaudited Pro Forma Information
The following unaudited pro forma information presents the financial results as if the acquisition of IMS Health had occurred on January 1, 2016 with pro forma adjustments to give effect to (i) an increase in depreciation and amortization expense for fair value adjustments of property, plant and equipment and intangible assets, (ii) an increase in stock-based compensation expense resulting from the exchange of the vested IMS Health equity awards for the Company’s equity awards and (iii) the related income tax effects. The pro forma results do not include any cost synergies, costs or other effects pertaining to the integration of IMS Health. Accordingly, such pro forma amounts are not necessarily indicative of the results that actually would have occurred for the periods presented below had the IMS Health acquisition been completed on January 1, 2016, nor are they indicative of the future operating results of the Company.
The following table summarizes the pro forma results:
(in millions, except earnings per share) Year Ended
December 31, 2016
Total revenues $ 9,235 Net loss attributable to IQVIA Holdings Inc. $ (1)Earnings per share attributable to common stockholders:
Basic $ — Diluted $ —
Pro forma information is not presented for any other acquisitions as the aggregate operations of the acquired businesses were not significant to the overall operations of the Company.
The Company’s consolidated statements of income for the year ended December 31, 2016 includes $806 million of revenues related to the IMS Health acquisition. Following the closing of the IMS Health acquisition, the Company began integrating IMS Health’s operations. As a result, computing a separate measure of IMS Health’s stand-alone profitability for periods after the acquisition date is impracticable.
Other Acquisitions
The Company also completed a number of individually immaterial acquisitions during the year ended December 31, 2018. The Company’s assessment of fair value and the purchase price allocation related to these acquisitions is preliminary and subject to change upon completion. Further adjustments may be necessary as additional information related to the fair values of assets acquired and liabilities assumed is assessed during the measurement period (up to one year from the acquisition date). The accompanying consolidated financial statements include the results of the acquisitions subsequent to each respective closing date.

102
The following table provides certain financial information for these individually immaterial acquisitions, including the preliminary allocations of the purchase prices to certain tangible and intangible assets acquired and goodwill:
(in millions) Amortization
Period 2018 2017
Total cost of acquisitions, net of cash acquired(1) $ 372 $ 923 Amounts recorded in the Consolidated Balance Sheets:
Goodwill $ 202 $ 581 Portion of goodwill deductible for income tax purposes 15 235
Intangible assets: Client relationships 8-14 years $ 126 $ 285 Backlog 2 years 10 15 Non-compete agreements 3-5 years 4 14 Software 1-6 years 44 61 Trade names 2-10 years 8 17
Total intangible assets $ 192 $ 392
(1) Total cost of acquisitions, net of cash acquired, includes contingent consideration and deferred purchase payments of $63 million and $69 million for the years ended December 31, 2018 and 2017, respectively.
15. Restructuring
From time to time, the Company takes restructuring actions to adapt to changing market conditions. These actions include closing facilities, consolidating functional activities, eliminating redundant positions, aligning resources with customer requirements and taking actions to improve process efficiencies. There were restructuring plans approved in each of 2018, 2017 and 2016 for these activities. Additionally, in 2016, the Company also acquired certain restructuring plans.
The 2018 management approved plans resulted in approximately $68 million of restructuring expense, net of reversals, which consisted of severance, facility closure costs and other exit-related costs. The 2017 management approved plans resulted in approximately $61 million of restructuring expense, net of reversals, which consisted of severance, facility closure costs and other exit-related costs. The 2016 management approved plans resulted in approximately $33 million of restructuring expense, net of reversals, which consisted of severance, facility closure costs and other exit-related costs.
The following amounts were recorded for the restructuring plans:
(in millions) Severance andRelated Costs Exit Costs Total
Balance at December 31, 2016 $ 99 $ 3 $ 102 Expense, net of reversals 59 4 63 Payments (77) (4) (81)Foreign currency translation and other (1) 1 — Balance at December 31, 2017 80 4 84 Expense, net of reversals 45 23 68 Payments (76) (6) (82)Foreign currency translation and other (2) 6 4 Balance at December 31, 2018 $ 47 $ 27 $ 74
The reversals were due to changes in estimates primarily resulting from the redeployment of staff and higher than expected voluntary terminations. Restructuring costs are not allocated to the Company’s reportable segments as they are not part of the segment performance measures regularly reviewed by management. The Company expects the majority of the restructuring accruals at December 31, 2018 will be paid in 2019.

103
16. Income Taxes
On December 22, 2017, the U.S. government enacted the Tax Act. The Tax Act is comprehensive legislation that includes provisions that lower the federal corporate income tax rate from 35% to 21% beginning in 2018 and imposes a one-time transition tax on undistributed foreign earnings. ASC 740 “Income Taxes” generally requires the effects of the tax law change to be recorded in the period of enactment. However, the SEC staff issued Staff Accounting Bulletin No. 118 (“SAB 118”) to address situations when a registrant does not have the necessary information available, prepared, or analyzed (including computations) in reasonable detail to complete the accounting for certain income tax effects of the Tax Act. SAB 118 allows companies to record provisional amounts during a measurement period not to extend beyond one year of the enactment date to address ongoing guidance and tax interpretations. Subsequent changes to provisional amounts are reported in income tax expense in the period in which they are determined. The Company recognized the tax impacts related to the transition tax on undistributed foreign earnings and the impact to deferred tax assets and liabilities and included these provisional amounts based on reasonable estimates in its consolidated financial statements for the year ended December 31, 2017. After further analysis of regulatory guidance and available elections, in the third quarter of 2018, the Company decided to utilize net operating losses against the 2017 transition tax and preserve foreign tax credits for future use. Accordingly, the Company recorded a $27 million provisional benefit related to the transition tax. During the fourth quarter, the Company completed the accounting for SAB 118 which resulted in a full year benefit of $35 million, inclusive of the $27 million provisional benefit recorded in the third quarter, related to the transition tax. This benefit of $35 million reduced the effective tax rate by 10.7 percentage points for the year ended December 31, 2018
The U.S. Treasury Department has also released proposed regulations related to the business interest expense limitations, foreign tax credit guidance, BEAT, GILTI and transition tax provisions of the Tax Act. This proposed guidance is not authoritative and is subject to change in the regulatory review process. The Company has considered these proposed regulations in its effective income tax rate for the year ended December 31, 2018. As these proposed regulations are finalized, the guidance may have an impact on our effective income tax rate.
The components of income before income taxes and equity in earnings (losses) of unconsolidated affiliates are as follows:
Year Ended December 31, (in millions) 2018 2017 2016
Domestic $ (521) $ (527) $ (125)Foreign 849 821 541 $ 328 $ 294 $ 416
The components of income tax expense attributable to continuing operations are as follows:
Year Ended December 31, (in millions) 2018 2017 2016
Current expense: Federal and state $ 17 $ (3) $ 64 Foreign 233 222 129
250 219 193 Deferred (benefit) expense:
Federal and state (170) (1,167) 151 Foreign (21) (44) (19)
(191) (1,211) 132 $ 59 $ (992) $ 325
As a result of the Tax Act, the Company recorded a provisional deferred tax benefit of $966 million related to the revaluation of deferred taxes at the newly enacted 21% rate and reversal of the deferred tax liability on undistributed earnings net of the newly enacted transition tax for the year ended December 31, 2017. The Company finalized its accounting for SAB 118 in the fourth quarter of 2018 and recorded a full year benefit of $35 million.

104
The differences between the Company’s consolidated income tax expense attributable to continuing operations and the expense computed at the United States statutory income tax rate of 21% in 2018 and 35% in both 2017 and 2016 were as follows:
Year Ended December 31, (in millions) 2018 2017 2016
Federal income tax expense at statutory rate $ 69 $ 103 $ 146 State and local income taxes, net of federal effect (2) (14) (1)Research and development (20) (9) (11)Foreign nontaxable interest income — (7) (8)United States taxes recorded on foreign earnings(*) 40 6 252 Tax contingencies 16 17 2 Foreign Derived Intangible Income (“FDII”) (25) — — Foreign rate differential 27 (97) (58)Equity compensation (8) (19) — Tax Act impact (35) (966) — Other (3) (6) 3 $ 59 $ (992) $ 325
(*) Includes impact of GILTI, and other U.S. taxes on foreign earnings.
In 2018 the Company recorded a $35 million benefit related to finalizing the accounting related to SAB 118. Additionally, in 2018 the Company recorded a benefit of $25 million related to FDII, as well as a tax expense of $35 million related to GILTI, as a result of the new provisions of the Tax Act. Based on proposed guidance as of December 31, 2018 the Company determined that the provisions of BEAT and business interest expense limitation were not applicable.
In 2017, due to the Tax Act, the Company revalued its U.S. deferred tax assets and liabilities and recorded a benefit to deferred income taxes of $966 million.
In 2016, due to the Merger, the Company reevaluated its indefinite reinvestment assertion based on the need for cash in the United States, including funding the Repurchase Program and potential acquisitions. Accordingly, the Company changed its assertion with respect to $2,801 million of foreign earnings, including $1,865 million of IMS Health’s previously undistributed historical foreign earnings. Deferred income taxes of $625 million were recorded in 2016 related to non-indefinitely reinvested foreign earnings. Of that amount, $373 million was recorded through purchase accounting related to IMS Health’s historical foreign earnings and the remainder of $252 million was recorded through deferred income tax expense.
Undistributed earnings of the Company’s foreign subsidiaries amounted to approximately $3,548 million at December 31, 2018. With the enactment of the Tax Act, the Company does not consider any of its foreign earnings as indefinitely reinvested.
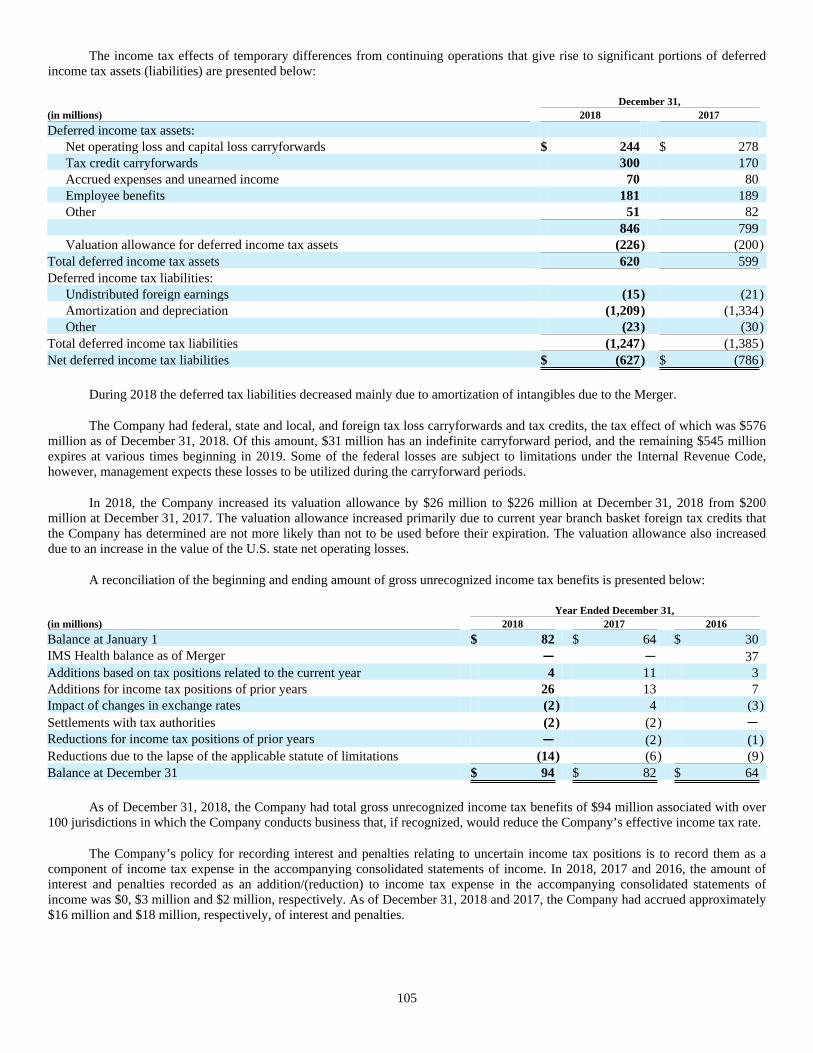
105
The income tax effects of temporary differences from continuing operations that give rise to significant portions of deferred income tax assets (liabilities) are presented below:
December 31, (in millions) 2018 2017
Deferred income tax assets: Net operating loss and capital loss carryforwards $ 244 $ 278 Tax credit carryforwards 300 170 Accrued expenses and unearned income 70 80 Employee benefits 181 189 Other 51 82
846 799 Valuation allowance for deferred income tax assets (226) (200)
Total deferred income tax assets 620 599 Deferred income tax liabilities:
Undistributed foreign earnings (15) (21)Amortization and depreciation (1,209) (1,334)Other (23) (30)
Total deferred income tax liabilities (1,247) (1,385)Net deferred income tax liabilities $ (627) $ (786)
During 2018 the deferred tax liabilities decreased mainly due to amortization of intangibles due to the Merger.
The Company had federal, state and local, and foreign tax loss carryforwards and tax credits, the tax effect of which was $576 million as of December 31, 2018. Of this amount, $31 million has an indefinite carryforward period, and the remaining $545 million expires at various times beginning in 2019. Some of the federal losses are subject to limitations under the Internal Revenue Code, however, management expects these losses to be utilized during the carryforward periods.
In 2018, the Company increased its valuation allowance by $26 million to $226 million at December 31, 2018 from $200 million at December 31, 2017. The valuation allowance increased primarily due to current year branch basket foreign tax credits that the Company has determined are not more likely than not to be used before their expiration. The valuation allowance also increased due to an increase in the value of the U.S. state net operating losses.
A reconciliation of the beginning and ending amount of gross unrecognized income tax benefits is presented below:
Year Ended December 31, (in millions) 2018 2017 2016
Balance at January 1 $ 82 $ 64 $ 30 IMS Health balance as of Merger — — 37 Additions based on tax positions related to the current year 4 11 3 Additions for income tax positions of prior years 26 13 7 Impact of changes in exchange rates (2) 4 (3)Settlements with tax authorities (2) (2) — Reductions for income tax positions of prior years — (2) (1)Reductions due to the lapse of the applicable statute of limitations (14) (6) (9)Balance at December 31 $ 94 $ 82 $ 64
As of December 31, 2018, the Company had total gross unrecognized income tax benefits of $94 million associated with over 100 jurisdictions in which the Company conducts business that, if recognized, would reduce the Company’s effective income tax rate.
The Company’s policy for recording interest and penalties relating to uncertain income tax positions is to record them as a component of income tax expense in the accompanying consolidated statements of income. In 2018, 2017 and 2016, the amount of interest and penalties recorded as an addition/(reduction) to income tax expense in the accompanying consolidated statements of income was $0, $3 million and $2 million, respectively. As of December 31, 2018 and 2017, the Company had accrued approximately $16 million and $18 million, respectively, of interest and penalties.

106
The Company believes that it is reasonably possible that a decrease of up to $8 million in gross unrecognized income tax benefits for federal, state and foreign exposure items may be necessary within the next 12 months due to lapse of statutes of limitations or uncertain tax positions being effectively settled. The Company believes that it is reasonably possible that a decrease of up to $14 million in gross unrecognized income tax benefits for foreign items may be necessary within the next 12 months due to payments. For the remaining uncertain income tax positions, it is difficult at this time to estimate the timing of the resolution.
The Company conducts business globally and, as a result, files income tax returns in the United States federal jurisdiction and various state and foreign jurisdictions. In the normal course of business, the Company is subject to examination by taxing authorities throughout the world. The following table summarizes the tax years that remain open for examination by tax authorities in the most significant jurisdictions in which the Company operates:
United States 2015-2017India 2006-2018Japan 2013-2017United Kingdom 2017Switzerland 2014-2017
In certain of the jurisdictions noted above, the Company operates through more than one legal entity, each of which has different open years subject to examination. The table above presents the open years subject to examination for the most material of the legal entities in each jurisdiction. Additionally, it is important to note that tax years are technically not closed until the statute of limitations in each jurisdiction expires. In the jurisdictions noted above, the statute of limitations can extend beyond the open years subject to examination.
Due to the geographic breadth of the Company’s operations, numerous tax audits may be ongoing throughout the world at any point in time. Income tax liabilities are recorded based on estimates of additional income taxes that may be due upon the conclusion of these audits. Estimates of these income tax liabilities are made based upon prior experience and are updated in light of changes in facts and circumstances. However, due to the uncertain and complex application of income tax regulations, it is possible that the ultimate resolution of audits may result in liabilities that could be materially different from these estimates. In such an event, the Company will record additional income tax expense or income tax benefit in the period in which such resolution occurs.

107
17. Employee Benefit Plans
Pension and Postretirement Benefit Plans
The Company sponsors both funded and unfunded defined benefit pension plans. These plans provide benefits based on various criteria, including, but not limited to, years of service and salary. The Company also sponsors an unfunded postretirement benefit plan in the United States that provides health and prescription drug benefits to retirees who meet the eligibility requirements. The Company uses a December 31 measurement date for all pension and postretirement benefit plans.
The following table summarizes changes in the benefit obligation, the plan assets and the funded status of the pension benefit plans:
Pension Benefits United States Plans Non-United States Plans December 31
(in millions) 2018 2017 2018 2017
Obligation and funded status: Change in benefit obligation: Projected benefit obligation at beginning of year $ 349 $ 308 $ 559 $ 508 Service costs 13 13 26 26 Interest cost 12 11 9 9 Actuarial (gains) losses (30) 25 (29) (2)Business combinations — — 1 — Benefits paid (9) (8) (21) (21)Contributions — — 2 1 Amendments — — 2 — Curtailments — — (3) — Settlements — — (12) (4)Foreign currency fluctuations and other — — (21) 42 Projected benefit obligation at end of year 335 349 513 559 Change in plan assets: Fair value of plan assets at beginning of year 360 312 391 348 Actual return on plan assets (24) 53 (2) 17 Contributions 3 3 29 21 Benefits paid (9) (8) (21) (21)Settlements — — (11) (4)Foreign currency fluctuations and other — — (20) 30 Fair value of plan assets at end of year 330 360 366 391 Funded status $ (5) $ 11 $ (147) $ (168)

108
The following table summarizes the amounts recognized in the consolidated balance sheets related to the pension benefit plans:
Pension Benefits
United States Plans Non-United States Plans December 31
(in millions) 2018 2017 2018 2017
Deposits and other assets $ 36 $ 55 $ 17 $ 15 Accrued expenses 2 2 11 8 Other long-term liabilities 38 42 153 175 AOCI 11 33 7 (3)
At December 31, 2018, the benefit obligation for other postretirement benefits was $2 million, with $1 million recorded in accrued expenses and $1 million included within other long-term liabilities; and the amount recognized in AOCI was $1 million.
The following table summarizes the accumulated benefit obligation for all pension benefit plans:
Pension Benefits
United States Plans Non-United States Plans December 31
(in millions) 2018 2017 2018 2017
Accumulated benefit obligation $ 330 $ 343 $ 476 $ 507
The following table provides the information for pension plans with an accumulated benefit obligation in excess of plan assets and projected benefit obligations in excess of plan assets:
Pension Benefits
United States Plans Non-United States Plans December 31
(in millions) 2018 2017 2018 2017
Plans with accumulated benefit obligation in excess of plan assets:
Accumulated benefit obligation $ 43 $ 45 $ 189 $ 442 Fair value of plan assets 3 3 59 301 Plans with projected benefit obligation in excess of plan assets:
Projected benefit obligation $ 43 $ 46 $ 223 $ 492 Fair value of plan assets 3 3 59 309

109
The components of net periodic benefit cost changes in plan assets and benefit obligations recognized in other comprehensive loss were as follows:
Pension Benefits
United States Plans Non-United States Plans Year Ended December 31,
(in millions) 2018 2017 2016 2018 2017 2016
Service cost $ 13 $ 13 $ 4 $ 26 $ 26 $ 18 Interest cost 12 11 3 9 9 5 Expected return on plan assets (27) (24) (6) (15) (14) (6)Amortization of actuarial losses — — — 1 1 1 Curtailment gain — — — (3) — — Settlement gain — — — (1) — — Net periodic benefit cost (2) — 1 17 22 18 Other changes in plan assets and benefit obligations recognized in other comprehensive loss:
Actuarial loss (gain) – current years 22 (4) (29) (15) (4) (5)Prior service cost - current year — — — 2 — — Curtailment gain - current year — — — 3 — — Settlement gain - current year — — — 1 — — Amortization of actuarial losses — — — (1) (1) (1)Total recognized in other comprehensive loss (income)
22 (4) (29) (10) (5) (6)
Total recognized in net periodic benefit cost and other comprehensive loss (income)
$ 20 $ (4) $ (28) $ 7 $ 17 $ 12
All components of net periodic benefit cost other than service cost are recorded in other expense (income), net on the accompanying consolidated statements of income.
On October 26, 2018, the High Court of the United Kingdom issued a judgement relating to Guaranteed Minimum Pensions (“GMPs”) in the Lloyds case. The judgement concluded the schemes should be amended to equalize pension benefits for men and women in relation to guaranteed minimum pension benefits. A preliminary assessment by the Company’s actuarial advisors estimated an impact of approximately $1.7 million between the two United Kingdom pension schemes, which has been recognized in AOCI as a prior service cost in 2018.
The components of other changes in plan assets and benefit obligations recognized in other comprehensive loss (income) related to the other postretirement benefits plan were $(1) million for the year ended December 31, 2018, and de minimis for the years ended December 31, 2017 and 2016. In addition, the amounts in AOCI that are expected to be recognized as components of net periodic benefit cost (credit) during 2019 for pension and other postretirement benefit plans are de minimis.
Assumptions
The weighted average assumptions used to determine net periodic benefit cost were as follows for the years ended December 31:
Pension Benefits Other
Postretirement Benefits
United States Plans Non-United States Plans 2018 2017 2016 2018 2017 2016 2018 2017 2016
Discount rate 3.69% 4.17% 3.62% 1.91% 1.89% 1.88% 2.90% 2.90% 2.40%Rate of compensation increases
3.00% 3.00% 3.00% 4.54% 5.17% 5.27% — — —
Expected return on plan assets
7.69% 7.94% 7.94% 4.17% 4.16% 4.26% — — —

110
The weighted average assumptions used to determine benefit obligations were as follows at December 31:
Pension Benefits Other Postretirement Benefits
United States Plans Non-United States Plans 2018 2017 2018 2017 2018 2017
Discount rate 4.42% 3.69% 1.98% 1.90% 3.80% 2.90%Rate of compensation increases
3.00% 3.00% 3.20% 4.54% — —
The discount rate represents the interest rate used to determine the present value of the future cash flows currently expected to be required to settle the Company’s defined benefit plan obligations. The discount rates are derived using weighted average yield curves on AA-rated corporate bonds. The cash flows from the Company’s expected benefit obligation payments are then matched to the yield curve to derive the discount rates. At December 31, 2018, the discount rate ranged from 3.80% to 4.46% for the Company’s United States pension plan and postretirement benefit plan. At December 31, 2018, the discount rate ranged from 2.32% to 2.90% for the Company’s United Kingdom pension plans. The United States and United Kingdom plans represent approximately 74% of the consolidated benefit obligation as of December 31, 2018. The discount rates in other non-U.S. countries ranged from 0.49% to 16.31% at December 31, 2018.
The Company’s assumption for the expected return on plan assets was determined by the weighted average of the long-term expected rate of return on each of the asset classes invested as of the balance sheet date. For plan assets invested in government bonds, the expected return was based on the yields on the relevant indices as of the balance sheet date. There is considerable uncertainty for the expected return on plan assets invested in equity and diversified growth funds. The expected rate of return on plan assets for the United States pension plans was 7.75% at January 1, 2019. Outside the United States, the range of applicable expected rates of return was 1.0% to 7.22% as of January 1, 2019, compared to 1.0% to 6.46% as of January 1, 2018. The expected return on assets (“EROA”) was $42 million and $38 million and the actual return on assets was ($26) million and $70 million for the years ended December 31, 2018 and 2017, respectively.
Under the Company’s United States qualified retirement plan, participants have a notional retirement account that increases with pay and investment credits. The rate used to determine the investment credit (cash balance crediting rate) varies monthly and is equal to 1/12th of the yield on 30-year U.S. Government Treasury Bonds, with a minimum of 0.25%. At retirement, the account is converted to a monthly retirement benefit.
At December 31, 2018, the Company’s health care cost trend rate for the next seven years was assumed to be 6.0% and the assumed ultimate cost trend rate was 5%. The Company assumed that ultimate cost trend rate is reached in 2021.
Assumed health care cost trend rates could have a significant effect on the amounts reported for the health care plans. A one-percentage-point change in assumed health care cost trend rates at December 31, 2018 would have a de minimis effect on the total of service and interest cost and on the accumulated postretirement benefit obligation.
Plan Assets
The Company’s pension plan weighted average asset allocations, by asset category, were as follows:
Plan Assets at December 31,
United States Plans Non-United States Plans Total Asset Category 2018 2017 2018 2017 2018 2017
Equity securities 67.58% 69.86% 45.22% 47.92% 55.83% 58.44%Debt securities 27.34 25.21 16.18 14.65 21.48 19.71 Real estate 5.08 4.93 — — 2.41 2.36 Other — — 38.60 37.43 20.28 19.49 Total 100.00% 100.00% 100.00% 100.00% 100.00% 100.00%

111
The target asset allocation for the Company’s pension plans were as follows:
Asset Category United States
Plans Non-UnitedStates Plans Total
Equity securities 60-80% 35-50% 45-65%Debt securities 20-30% 10-20% 10-30%Real estate 0-10% —% 0-5%Other —% 30-45% 10-30%
The following table summarizes United States plan assets measured at fair value:
December 31, 2018 December 31, 2017 Asset Category Level 1 Level 2 Total Level 1 Level 2 Total (in millions)
Domestic equities $ 31 $ — $ 31 $ 37 $ — $ 37 International equities 13 — 13 23 — 23 Corporate bonds 54 — 54 53 — 53 Real estate 16 — 16 18 — 18 Total assets in the fair value hierarchy 114 — 114 131 — 131 Common/collective trusts measured at net asset value (“NAV”)(1) — — 216 — — 229 Total $ 114 $ — $ 330 $ 131 $ — $ 360
The following table summarizes non-United States plan assets measured at fair value:
December 31, 2018 December 31, 2017 Asset Category Level 1 Level 2 Total Level 1 Level 2 Total (in millions)
International equities $ 2 $ 53 $ 55 $ — $ 66 $ 66 Debt issued by national, state or local government 2 57 59 2 55 57 Diversified growth fund — — — — 17 17 Investments funds — 8 8 — 7 7 Insurance contracts — 136 136 — 141 141 Other — 5 5 — 7 7 Total assets in the fair value hierarchy 4 259 263 2 293 295 Assets measured at NAV(1) — — 103 — — 96 Total $ 4 $ 259 $ 366 $ 2 $ 293 $ 391
(1) Certain investments that are measured at fair value using the net asset value per share (or its equivalent) practical expedient have not been classified in the fair value hierarchy. The fair value amounts presented in the above plan asset tables are intended to permit reconciliation of the fair value of plan assets in the fair value hierarchy to the plan asset amounts presented in the above funded status table as of December 31, 2018 and 2017.
Investments in mutual funds are valued at quoted market prices. Investments in common/collective trusts and pooled funds are valued at the NAV as reported by the trust. The NAV is based on the fair value of the underlying investments held by the fund less its liabilities. Insurance contracts are valued at the amount of the benefit liability. The Company has no Level 3 assets that rely on unobservable inputs to measure fair value.

112
Investment Policies and Strategies
The Company invests primarily in a diversified portfolio of equity and debt securities that provide for long-term growth within reasonable and prudent levels of risk. The asset allocation targets established by the Company are strategic and applicable to the plan’s long-term investing horizon. The portfolio is constructed and maintained to provide adequate liquidity to meet associated liabilities and minimize long-term expense and provide prudent diversification among asset classes in accordance with the principles of modern portfolio theory. The plan employs a diversified mix of actively managed investments around a core of passively managed index exposures in each asset class. Within each asset class, rapid market shifts, changes in economic conditions or an individual fund manager’s outlook may cause the asset allocation to fall outside the prescribed targets. The majority of the Company’s plan assets are measured quarterly against benchmarks established by the Company’s investment advisors and the Company’s Asset Management Committee, who review actual plan performance and have the authority to recommend changes as deemed appropriate. Assets are rebalanced periodically to their strategic targets to maintain the plan’s strategic risk/reward characteristics. The Company periodically conducts asset liability modeling studies to ensure that the investment strategy is aligned with the obligations of the plans and that the assets will generate income and capital growth to meet the cost of current and future benefits that the plans provide. The pension plans do not have investments in Company stock at December 31, 2018 or 2017.
The portfolio for the Company’s United Kingdom pension plans seek to invest in a range of suitable assets of appropriate liquidity that will generate in the most effective manner possible, income and capital growth to ensure that there are sufficient assets to meet benefit payments when they fall due, while controlling the long-term costs of the plans and avoiding short-term volatility of investment returns. The plans seek to achieve these objectives by investing in a mixture of real (equities) and monetary (fixed interest) assets. It recognizes that the returns on real assets, while expected to be greater over the long-term than those on monetary assets, are likely to be more volatile. A mixture across asset classes should nevertheless provide the level of returns required by the plans. The trustee periodically conducts asset liability modeling exercises to ensure the investments are aligned with the appropriate benchmark to better reflect the plans’ liabilities. The trustee also undertakes to review this benchmark on a regular basis.
Cash Flows
Contributions
The Company expects to contribute approximately $25 million in required contributions to its pension and postretirement benefit plans during 2019. The Company may make additional contributions into its pension plans in 2019 depending on, among other factors, how the funded status of those plans change or in order to meet minimum funding requirements as set forth in employee benefit and tax laws, plus additional amounts the Company may deem to be appropriate.
Estimated future benefit payments and subsidy receipts
The following benefit payments (net of expected participant contributions) for pension benefits are expected to be paid as follows:
(in millions) Pension Benefits
2019 $ 33 2020 33 2021 36 2022 38 2023 40 Years 2024 through 2028 234 $ 414
Benefit payments (net of expected participant contributions) for other postretirement benefits are expected to be de minimis over the periods presented.

113
Defined Contribution Plans
Defined contribution or profit sharing plans are offered in Australia, Austria, Belgium, Bulgaria, Canada, the Czech Republic, Denmark, Finland, France, Germany, Greece, Hong Kong, Hungary, India, Ireland, Israel, Japan, Malaysia, the Netherlands, New Zealand, Poland, Slovakia, South Africa, Sweden, Switzerland, Taiwan, Thailand, the United States and the United Kingdom. In some cases, these plans are required by local laws or regulations.
In the United States, the Company has a 401(k) plan under which the Company matches employee deferrals at varying percentages and specified limits of the employee’s salary. In 2018, 2017 and 2016, the Company expensed $49 million, $47 million and $39 million, respectively, related to matching contributions.
Certain key executives of the Company participate in an unfunded defined contribution executive retirement plan, assumed in the Merger, which was frozen to additional accruals for future service contributions in 2012. Participants continue to receive an annual investment credit based on the average of the annual yields at the end of each month on the AA-AAA rated 10 plus year maturity component of the Merrill Lynch United States Corporate Bond Master Index.
Plans Accounted for as Postretirement Benefits
The Company provides certain executives with postretirement medical, dental and life insurance benefits. These benefits are individually negotiated arrangements in accordance with their individual employment arrangements. The above tables do not include the Company’s expense or obligation associated with providing these benefits. The obligation related to these benefits was approximately $11 million as of December 31, 2018, and the Company’s expense for the year then ended was de minimis.
Stock Incentive Plans
Stock incentive plans provide incentives to eligible employees, officers and directors in the form of non-qualified stock options, incentive stock options, stock appreciation rights (“SARs”), restricted stock awards (“RSAs”), restricted stock units (“RSUs”), performance awards, covered annual incentive awards, cash-based awards and other stock-based awards, in each case subject to the terms of the stock incentive plans.
In April 2017, the Company’s 2017 Incentive and Stock Award Plan (the “2017 Plan”) was approved by the Company’s stockholders. The 2017 Plan consolidates the unused share pools under the Company’s 2014 Incentive and Stock Award Plan (the “2014 Plan”), the Company’s 2013 Stock Incentive Plan (the “2013 Plan”), the Company’s 2010 Equity Incentive Plan (the “2010 Plan”) and the Company’s 2008 Stock Incentive Plan (the “2008 Plan”), and together with the 2010 Plan, the 2013 Plan and the 2014 Plan (the “Prior Plans”), makes shares underlying outstanding awards granted under (but not ultimately delivered) the Prior Plans eligible for use in connection with new awards under the 2017 Plan. The 2017 Plan provides for the grant of stock options, SARs, restricted and deferred stock (including RSUs), performance awards, dividend equivalents, other stock-based awards and cash-based awards.
The fair value of stock options and SARs is estimated using the Black-Scholes-Merton option-pricing model. The fair value of restricted stock and RSUs is based on the closing market price of the Company’s common stock on the date of grant. The fair value of the performance shares related to compound annual earnings per share (“EPS”) growth and/or other internal performance measures is equal to the closing market price of the Company’s common stock on the date of grant. The fair value of performance shares related to relative total shareholder return (“TSR”) is determined based on a Monte Carlo simulation model.
The Company recognized stock-based compensation expense of $113 million, $106 million and $80 million in 2018, 2017 and 2016, respectively. Stock-based compensation expense is included in selling, general and administrative expenses on the accompanying consolidated statements of income. The associated future income tax benefit recognized was $19 million, $21 million and $24 million in 2018, 2017 and 2016, respectively. As of December 31, 2018, there was approximately $102 million of total unrecognized stock-based compensation expense related to outstanding non-vested stock-based compensation arrangements, which the Company expects to recognize over a weighted average period of 1.00 years.
As of December 31, 2018, there were 12.1 million shares available for future grants under all of the Company’s stock incentive plans.

114
The Company used the following assumptions when estimating the value of the stock-based compensation for stock options and SARs issued as follows:
Year Ended December 31, 2018 2017 2016
Expected volatility 22 – 24% 22 – 25% 20 – 30% Weighted average expected volatility 22% 24% 28% Expected dividends 0.0% 0.0% 0.0% Expected term (in years) 1.0 – 6.7 1.0 – 6.9 0.3 – 6.6 Risk-free interest rate 2.05 – 3.00% 1.16 – 2.32% 0.32 – 2.19%
Stock Options
The option price is determined by the Board at the date of grant and the options expire 10 years from the date of grant. The vesting schedule for options granted to employees is either (i) 25% per year beginning on the first anniversary of the date of grant; or (ii) 33% on the third anniversary of the date of grant and 67% on the fourth anniversary of the date of grant.
The Company’s stock option activity in 2018 is as follows:
(in millions, except number of options and exercise price) Number of Options
WeightedAverage
Exercise Price Aggregate
Intrinsic Value
Outstanding at December 31, 2017 4,080,632 $ 33.97 $ 261 Exercised (1,462,818) 32.88 Canceled (43,590) 63.44
Outstanding at December 31, 2018 2,574,224 $ 34.09 $ 211
The weighted average fair value per share of the options granted in 2016 was $17.91. The total intrinsic value of options exercised was approximately $117 million, $157 million and $155 million in 2018, 2017 and 2016, respectively. The Company received cash of approximately $48 million, $102 million and $101 million in 2018, 2017 and 2016, respectively, from options exercised.
Selected information regarding the Company’s stock options as of December 31, 2018 is as follows:
Options Outstanding Options Exercisable
Number ofOptions Exercise Price Range
WeightedAverage
Exercise Price
WeightedAverage
RemainingLife
(in Years) Number of
Options
WeightedAverage
Exercise Price
599,966 $ 8.34 — $ 15.11 $ 10.64 1.76 599,966 $ 10.64 589,373 17.11 — 26.05 22.72 2.09 589,373 22.72 534,537 28.13 — 40.00 31.68 3.48 534,537 31.68 597,416 44.45 — 64.67 57.91 6.13 468,928 56.24 252,932 $ 64.86 — $ 77.11 $ 65.06 6.19 174,032 $ 64.92
The weighted average remaining contractual life of the options outstanding and exercisable as of December 31, 2018 is 3.6 years and 3.4 years, respectively. The total aggregate intrinsic value of the exercisable stock options and the stock options expected to vest as of December 31, 2018 was approximately $211 million.

115
Stock Appreciation Rights – Stock Settled
The exercise price of the stock-settled SARs (“SSRs”) is equal to the closing market price of the Company’s common stock as of the grant date and expire on the tenth anniversary of the date of grant. The SSRs are eligible to vest either (i) in equal increments of 25% on each of the first four anniversaries of the date of grant or (ii) in three equal annual installments on each of the first three anniversaries of the date of grant.
The Company’s SSR activity in 2018 is as follows:
(in millions, except number of SSRs and exercise price) Number of SSRs
WeightedAverage
Exercise Price Aggregate
Intrinsic Value
Outstanding at December 31, 2017 2,924,770 $ 72.47 $ 74 Granted 1,787,168 96.13 Exercised (328,210) 71.42 Canceled (228,200) 86.22
Outstanding at December 31, 2018 4,155,528 $ 81.97 $ 142
The total intrinsic value of SSRs exercised was approximately $13 million in 2018.
The weighted average remaining contractual life of the SSRs outstanding and exercisable as of December 31, 2018 is 8.2 years and 7.1 years, respectively. The total aggregate intrinsic value of the exercisable SSRs and the SSRs expected to vest as of December 31, 2018 was approximately $139 million.
Stock Appreciation Rights – Cash Settled
The Company’s cash settled SARs (“CSRs”) require the Company to settle in cash an amount equal to the difference between the fair value of the Company’s common stock on the date of exercise and the grant price, multiplied by the number of CSRs being exercised. These awards either (i) vest 25% per year or (ii) vest 33% on the third anniversary of the date of grant and 67% on the fourth anniversary of the date of grant; or (iii) one-third per year beginning on the first anniversary of the date of grant.
The Company’s CSR activity in 2018 is as follows:
(in millions, except number of CSRs and grant price) Number of CSRs
WeightedAverage
Grant Price Aggregate
Intrinsic Value
Outstanding at December 31, 2017 337,115 $ 53.87 $ 15 Granted 15,716 95.23 Exercised (95,300) 48.31 Canceled (10,134) 69.92
Outstanding at December 31, 2018 247,397 $ 57.98 $ 14
As of December 31, 2018, 2017 and 2016, the weighted average fair value per share of the CSRs granted was $66.92, $52.53 and $34.25, respectively. The Company paid approximately $5 million, $4 million and $2 million to settle exercised CSRs in 2018, 2017 and 2016, respectively.
The weighted average remaining contractual life of the CSRs outstanding and exercisable as of December 31, 2018 is 5.6 years and 5.0 years, respectively. The total aggregate intrinsic value of the exercisable CSRs and the CSRs expected to vest as of December 31, 2018 was approximately $14 million.

116
Restricted Stock Units – Stock Settled
The Company’s RSUs will settle in shares of the Company’s common stock within 45 days of the applicable vesting date. In general, RSUs granted to employees vest either (i) 25% per year beginning on the first anniversary of the date of grant; (ii) one-third per year beginning on the first anniversary of the grant date; (iii) 33% on the third anniversary of the date of grant and 67% on the fourth anniversary of the date of grant or (iv) 100% at the end of the three-year period following the grant date. Members of the Company’s board of directors receive RSUs that are fully vested when granted.
The Company’s RSU activity in 2018 is as follows:
Number of RSUs
WeightedAverage Grant-Date
Fair Value
Outstanding at December 31, 2017 1,097,708 $ 76.71 Granted 160,462 101.16 Vested (799,011) 77.49 Canceled (73,701) 85.46
Outstanding at December 31, 2018 385,458 $ 83.60
As of December 31, 2018, there are 385,458 RSUs outstanding with an intrinsic value of approximately $45 million.
Restricted Stock Units – Cash Settled
The Company’s cash settled RSUs (“Cash RSUs”) require the Company to settle in cash an amount equal to the fair value of the Company’s common stock on the vest date multiplied by the number of vested Cash RSUs. These awards vest 100% at the end of the three-year period following the date of grant.
The Company’s Cash RSU activity in 2018 is as follows:
Number ofCash RSUs
WeightedAverage Grant-Date
Fair Value
Outstanding at December 31, 2017 9,015 $ 95.98 Granted 5,260 95.23 Canceled (914) 81.04
Outstanding at December 31, 2018 13,361 $ 96.70
As of December 31, 2018, there are 13,361 Cash RSUs outstanding with an intrinsic value of approximately $1.6 million.
Restricted Stock Awards
Restricted stock awards (“RSAs”) vest either (i) in equal increments of 50% on each of the second and fourth anniversaries of the grant date; (ii) one-third per year beginning on the first anniversary of the date of grant; or (iii) 25% on each of the second and third anniversaries of the grant date and 50% on the fourth anniversary of the date of grant.
The Company’s RSA activity in 2018 is as follows:
Number of RSAs
WeightedAverage Grant-Date
Fair Value
Outstanding at December 31, 2017 440,151 $ 79.05 Vested (4,084) 80.20
Outstanding at December 31, 2018 436,067 $ 79.04
As of December 31, 2018, there are 436,067 RSAs outstanding with an intrinsic value of approximately $51 million.

117
Performance Awards
The Company awarded performance awards that contain service, performance-based and/or market-based vesting criteria. Vesting occurs if the recipient remains employed and depends on the degree to which performance goals are achieved during the two-year or three-year performance period (as defined in the award agreements).
The Company’s performance award activity in 2018 is as follows:
Number of
Performance Awards
WeightedAverage Grant-Date
Fair Value
Outstanding at December 31, 2017 476,332 $ 85.84 Granted 438,111 104.42 Vested (3,500) 84.86 Canceled (60,367) 94.70
Outstanding at December 31, 2018 850,576 $ 94.78
As of December 31, 2018, there are 850,576 performance awards outstanding with an intrinsic value of approximately $99 million.
Employee Stock Purchase Plan
Prior to December 31, 2016, the Company sponsored an Employee Stock Purchase Plan (“ESPP”) that allowed eligible employees to authorize payroll deductions of up to 10% of their base salary to be applied toward the purchase of full shares of the Company’s common stock on the last day of the offering period. During 2016, the Company issued 0.1 million shares of common stock for purchases under the ESPP. Effective as of December 31, 2016, the ESPP was discontinued and participant contributions under the ESPP ceased. The final purchase of shares under the ESPP occurred on December 31, 2016.
Other
The Company sponsors a supplemental non-qualified deferred compensation plan, covering certain management employees, and maintains other statutory indemnity plans as required by local laws or regulations.
18. Related Party Transactions
During 2018, 2017 and 2016, the Company entered into a number of contracts with HUYA Bioscience International, LLC, primarily in Asia, in which the Company will provide up to approximately $34 million, $5 million and $(8) million net cancellations, respectively, of services on a fee for services basis at arm’s length and at market rates. In 2018, 2017 and 2016, the Company recognized revenue of approximately $10 million, $8 million and $6 million, respectively, for services under these agreements.
The Company has entered into other transactions with related parties including investments in and advances to unconsolidated affiliates that are discussed in Note 4.
19. Property, Equipment and Software by Geography
The following table represents the Company’s property, equipment and software, net, by geographic region, which is further broken down to show each country that accounts for 10% or more of the totals:
As of December 31, (in millions) 2018 2017
Property, equipment and software, net: Americas:
United States $ 856 $ 623 Other 23 27
Americas 879 650 Europe and Africa 221 259 Asia-Pacific 70 76
Total property, equipment and software, net $ 1,170 $ 985

118
20. Segments
The following table presents the Company’s operations by reportable segment. The Company is managed through three reportable segments, Technology & Analytics Solutions, Research & Development Solutions and Contract Sales & Medical Solutions. Technology & Analytics Solutions provides mission critical information, technology solutions and real-world insights and services to the Company’s life science clients. Research & Development Solutions, which primarily serves biopharmaceutical customers, provides outsourced clinical research and clinical trial related services. Contract Sales & Medical Solutions provides health care provider (including contract sales) and patient engagement services to both biopharmaceutical customers and the broader healthcare market. Prior period segment results have been recast to conform to immaterial changes to management reporting in 2017. The recast only impacts the fourth quarter of 2016 as the management reporting changes relate to IMS Health and these results are only reflected in our results since the date of the Merger on October 3, 2016.
Certain costs are not allocated to the Company’s segments and are reported as general corporate and unallocated expenses. These costs primarily consist of stock-based compensation and expenses for corporate overhead functions such as senior leadership, finance, human resources, information technology, facilities and legal. The Company does not allocate depreciation and amortization, restructuring costs, merger related costs or impairment charges to its segments. Asset information by segment is not presented, as this measure is not used by the chief operating decision maker to assess the Company’s performance.
Year Ended December 31,
(in millions) 2018 2017 2016
Revenues Technology & Analytics Solutions $ 4,137 $ 3,682 $ 1,148 Research & Development Solutions 5,465 5,105 4,737 Contract Sales & Medical Solutions 810 915 930
Total revenues 10,412 9,702 6,815 Costs of revenue Technology & Analytics Solutions 2,343 1,967 695 Research & Development Solutions 3,721 3,566 3,283 Contract Sales & Medical Solutions 682 768 770
Total costs of revenue 6,746 6,301 4,748 Selling, general and administrative expenses Technology & Analytics Solutions 771 719 218 Research & Development Solutions 616 582 579 Contract Sales & Medical Solutions 69 73 82 General corporate and unallocated 260 248 137
Total selling, general and administrative expenses 1,716 1,622 1,016 Segment profit Technology & Analytics Solutions 1,023 996 235 Research & Development Solutions 1,128 957 875 Contract Sales & Medical Solutions 59 74 78
Total segment profit 2,210 2,027 1,188 General corporate and unallocated (260) (248) (137)Depreciation and amortization (1,141) (1,011) (289)Impairment charges — (40) (28)Restructuring costs (68) (63) (71)Merger related costs — — (87)
Total income from operations $ 741 $ 665 $ 576

119
21. Earnings Per Share
The following table reconciles the basic to diluted weighted average shares outstanding:
Year Ended December 31, (in millions) 2018 2017 2016
Basic weighted average common shares outstanding 203.7 217.8 149.1 Effect of dilutive stock options and share awards 4.5 4.8 2.9 Diluted weighted average common shares outstanding 208.2 222.6 152.0
The following table presents the weighted average number of outstanding stock-based awards not included in the computation of diluted earnings per share because they are subject to performance conditions or the effect of including such stock-based awards in the computation would be anti-dilutive:
Year Ended December 31, (in millions) 2018 2017 2016
Shares subject to performance conditions 0.8 0.4 0.1 Shares subject to anti-dilutive stock-based awards 0.9 1.0 1.1 Total shares excluded from diluted earnings per share 1.7 1.4 1.2
The vesting of performance awards is contingent upon the achievement of certain performance targets. The performance awards are not included in diluted earnings per share until the performance targets have been met. Stock-based awards will have a dilutive effect under the treasury method when the respective period’s average market value of the Company’s common stock exceeds the exercise proceeds.
22. Comprehensive Income
Below is a summary of the components of AOCI:
(in millions)
ForeignCurrency
Translation Derivative
Instruments
DefinedBenefitPlans
IncomeTaxes Total
Balance at December 31, 2015, Adjusted $ (116) $ (14) $ (14) $ 34 $ (110)Other comprehensive (loss) income before reclassifications (501) (4) 34 (5) (476)Reclassification adjustments — 28 1 (7) 22 Balance at December 31, 2016 (617) 10 21 22 (564)Other comprehensive income before reclassifications 403 5 8 197 613 Reclassification adjustments — (1) 1 — — Balance at December 31, 2017 (214) 14 30 219 49 Other comprehensive loss before reclassifications (205) (4) (12) (41) (262)Reclassification adjustments — (11) 1 (1) (11)Balance at December 31, 2018 $ (419) $ (1) $ 19 $ 177 $ (224)

120
Below is a summary of the adjustments for (gains) losses reclassified from AOCI into the consolidated statements of income and the affected financial statement line item:
Year Ended December 31,
(in millions) Affected Financial Statement
Line Item 2018 2017 2016
Derivative instruments: Interest rate swaps and caps Interest expense $ — $ — $ 6 Foreign exchange forward contracts Revenues 1 7 19 Foreign exchange forward contracts Other expense (income), net (12) (8) 3 Total before income taxes (11) (1) 28 Income tax expense 1 — 7 Total net of income taxes $ (12) $ (1) $ 21
Defined benefit plans: Amortization of actuarial losses See Note 17 $ 1 $ 1 $ 1 Income tax expense — — — Total net of income taxes $ 1 $ 1 $ 1
23. Supplemental Cash Flow Information
The following table presents the Company’s supplemental cash flow information:
Year Ended December 31, (in millions) 2018 2017 2016
Supplemental Cash Flow Information: Interest paid $ 398 $ 320 $ 124 Income taxes paid, net of refunds $ 211 $ 195 $ 106
Non-cash Investing Activities: Fair value of consideration transferred in connection with business combinations $ — $ — $ 10,425

121
24. Quarterly Financial Data (Unaudited)
The following table summarizes the Company’s unaudited quarterly results of operations:
2018 (in millions, except per share data) First Quarter Second Quarter Third Quarter Fourth Quarter
Revenues $ 2,563 $ 2,567 $ 2,594 $ 2,688 Income from operations 183 170 181 207 Net income 73 68 67 76 Net income attributable to non-controlling interests (4) (7) (7) (7)Net income attributable to IQVIA Holdings Inc.(1) $ 69 $ 61 $ 60 $ 69
Basic earnings per share(2) $ 0.33 $ 0.30 $ 0.30 $ 0.34
Diluted earnings per share(2) $ 0.32 $ 0.29 $ 0.29 $ 0.34
2017 (in millions, except per share data) First Quarter Second Quarter Third Quarter Fourth Quarter
Revenues $ 2,360 $ 2,355 $ 2,466 $ 2,521 Income from operations 202 126 195 142 Net income 102 66 93 1,035 Net income attributable to non-controlling interests (2) (4) (5) (8)Net income attributable to IQVIA Holdings Inc.(3) $ 100 $ 62 $ 88 $ 1,027
Basic earnings per share(2) $ 0.43 $ 0.28 $ 0.41 $ 4.91
Diluted earnings per share(2) $ 0.43 $ 0.28 $ 0.40 $ 4.79
(1) During the fourth quarter of 2018, the Company identified and recorded certain adjustments related to prior periods and as a result increased pre-tax income by $22 million (net income by $15 million). The Company has evaluated the effects of the out of period adjustments and concluded they are not material to the fourth quarter 2018 financial results, nor to any of the previously issued annual or quarterly financial information.
(2) The sum of the quarterly per share amounts may not equal per share amounts reported for year-to-date periods. This is due to changes in the number of weighted average shares outstanding and the effects of rounding for each period.
(3) The significant increase during the fourth quarter of 2017 is due to the enactment of the Tax Act. See Note 16 for additional details.

122
Item 9. Changes in and Disagreements with Accountants on Accounting and Financial Disclosure
None.
Item 9A. Controls and Procedures
Evaluation of Disclosure Controls and Procedures
As required by Rule 13a-15 under the Exchange Act, as amended, we carried out an evaluation of the effectiveness of the design and operation of our disclosure controls and procedures under the supervision and with the participation of our management, including the Chief Executive Officer (“CEO”) and Chief Financial Officer (“CFO”). There are inherent limitations to the effectiveness of any system of disclosure controls and procedures, including the possibility of human error and the circumvention or overriding of the controls and procedures. Accordingly, even effective disclosure controls and procedures can only provide reasonable assurance of achieving their control objectives. Based upon our evaluation, our CEO and CFO concluded that our disclosure controls and procedures were effective to provide reasonable assurance that information required to be disclosed by us in the reports that we file or submit under the Exchange Act, as amended, is recorded, processed, summarized and reported within the time periods specified in the applicable rules and forms, and that it is accumulated and communicated to our management, including our CEO and CFO, as appropriate, to allow timely decisions regarding required disclosure.
Management’s Report on Internal Control over Financial Reporting
Our management’s report on internal control over financial reporting is set forth in Part II, Item 8 of this Annual Report on Form 10-K and is incorporated herein by reference.
Changes in Internal Control over Financial Reporting
There were no changes in our internal control over financial reporting during the quarter ended December 31, 2018 that materially affected, or are reasonably likely to materially affect, our internal control over financial reporting.
Item 9B. Other Information
None.
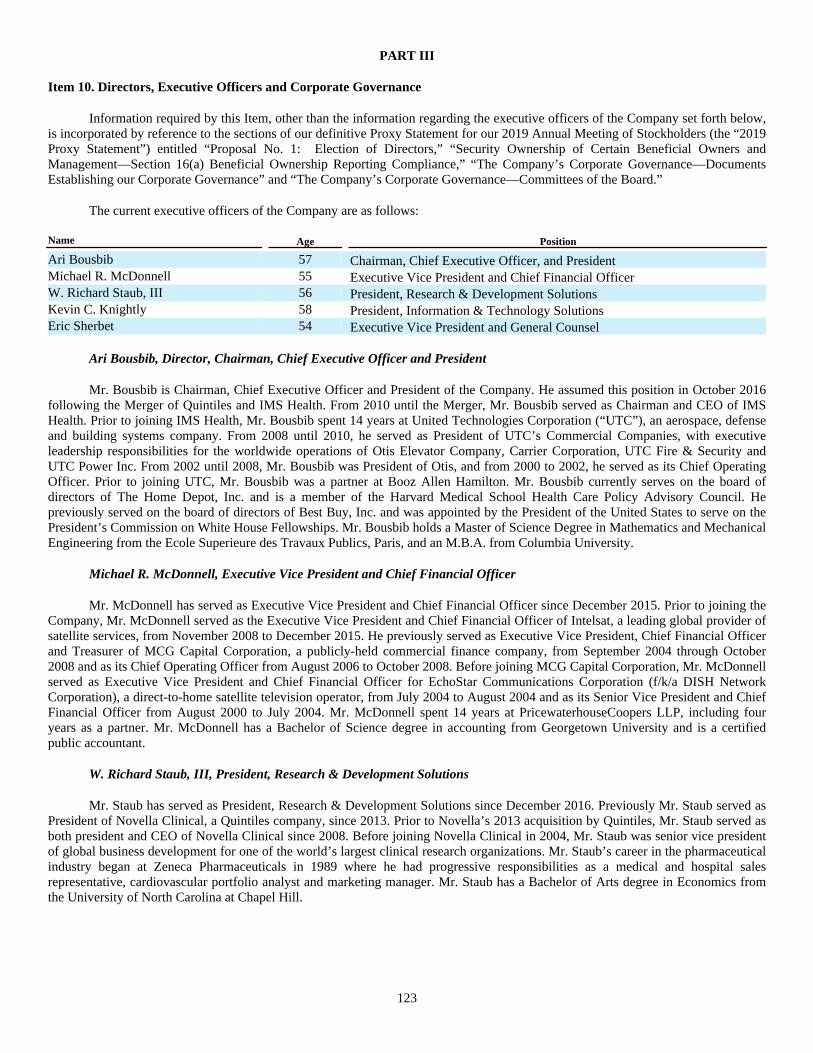
123
PART III
Item 10. Directors, Executive Officers and Corporate Governance
Information required by this Item, other than the information regarding the executive officers of the Company set forth below, is incorporated by reference to the sections of our definitive Proxy Statement for our 2019 Annual Meeting of Stockholders (the “2019 Proxy Statement”) entitled “Proposal No. 1: Election of Directors,” “Security Ownership of Certain Beneficial Owners and Management—Section 16(a) Beneficial Ownership Reporting Compliance,” “The Company’s Corporate Governance—Documents Establishing our Corporate Governance” and “The Company’s Corporate Governance—Committees of the Board.”
The current executive officers of the Company are as follows:
Name
Age
Position
Ari Bousbib 57 Chairman, Chief Executive Officer, and PresidentMichael R. McDonnell 55 Executive Vice President and Chief Financial OfficerW. Richard Staub, III 56 President, Research & Development SolutionsKevin C. Knightly 58 President, Information & Technology SolutionsEric Sherbet 54 Executive Vice President and General Counsel
Ari Bousbib, Director, Chairman, Chief Executive Officer and President
Mr. Bousbib is Chairman, Chief Executive Officer and President of the Company. He assumed this position in October 2016 following the Merger of Quintiles and IMS Health. From 2010 until the Merger, Mr. Bousbib served as Chairman and CEO of IMS Health. Prior to joining IMS Health, Mr. Bousbib spent 14 years at United Technologies Corporation (“UTC”), an aerospace, defense and building systems company. From 2008 until 2010, he served as President of UTC’s Commercial Companies, with executive leadership responsibilities for the worldwide operations of Otis Elevator Company, Carrier Corporation, UTC Fire & Security and UTC Power Inc. From 2002 until 2008, Mr. Bousbib was President of Otis, and from 2000 to 2002, he served as its Chief Operating Officer. Prior to joining UTC, Mr. Bousbib was a partner at Booz Allen Hamilton. Mr. Bousbib currently serves on the board of directors of The Home Depot, Inc. and is a member of the Harvard Medical School Health Care Policy Advisory Council. He previously served on the board of directors of Best Buy, Inc. and was appointed by the President of the United States to serve on the President’s Commission on White House Fellowships. Mr. Bousbib holds a Master of Science Degree in Mathematics and Mechanical Engineering from the Ecole Superieure des Travaux Publics, Paris, and an M.B.A. from Columbia University.
Michael R. McDonnell, Executive Vice President and Chief Financial Officer
Mr. McDonnell has served as Executive Vice President and Chief Financial Officer since December 2015. Prior to joining the Company, Mr. McDonnell served as the Executive Vice President and Chief Financial Officer of Intelsat, a leading global provider of satellite services, from November 2008 to December 2015. He previously served as Executive Vice President, Chief Financial Officer and Treasurer of MCG Capital Corporation, a publicly-held commercial finance company, from September 2004 through October 2008 and as its Chief Operating Officer from August 2006 to October 2008. Before joining MCG Capital Corporation, Mr. McDonnell served as Executive Vice President and Chief Financial Officer for EchoStar Communications Corporation (f/k/a DISH Network Corporation), a direct-to-home satellite television operator, from July 2004 to August 2004 and as its Senior Vice President and Chief Financial Officer from August 2000 to July 2004. Mr. McDonnell spent 14 years at PricewaterhouseCoopers LLP, including four years as a partner. Mr. McDonnell has a Bachelor of Science degree in accounting from Georgetown University and is a certified public accountant.
W. Richard Staub, III, President, Research & Development Solutions
Mr. Staub has served as President, Research & Development Solutions since December 2016. Previously Mr. Staub served as President of Novella Clinical, a Quintiles company, since 2013. Prior to Novella’s 2013 acquisition by Quintiles, Mr. Staub served as both president and CEO of Novella Clinical since 2008. Before joining Novella Clinical in 2004, Mr. Staub was senior vice president of global business development for one of the world’s largest clinical research organizations. Mr. Staub’s career in the pharmaceutical industry began at Zeneca Pharmaceuticals in 1989 where he had progressive responsibilities as a medical and hospital sales representative, cardiovascular portfolio analyst and marketing manager. Mr. Staub has a Bachelor of Arts degree in Economics from the University of North Carolina at Chapel Hill.

124
Kevin C. Knightly, President, Information & Technology Solutions
Mr. Knightly has served as President, Information & Technology Solutions since October 2016. Previously Mr. Knightly served as Senior Vice President, Information Offerings at IMS Health from April 2015 to October 2016. From January 2011 to March 2015, Mr. Knightly served as Senior Vice President, Supplier Management at IMS Health. Prior to that, Mr. Knightly served in a number of senior financial, operations, marketing and general management roles for IMS Health, including as Senior Vice President, Pharma Business Management from 2007 until 2010. Mr. Knightly holds a B.S. in Economics and Accounting from the College of the Holy Cross, and an M.B.A. from New York University’s Stern Business School.
Eric Sherbet, Executive Vice President, General Counsel and Secretary
Mr. Sherbet has served as our Executive Vice President and General Counsel since March 2018. Prior to joining us, he served as General Counsel and Secretary at Patheon N.V. from November 2014 until November 2017. Prior to joining Patheon, he was General Counsel and Corporate Secretary at InVentiv Health from April 2011 until October 2014. He also previously served as Vice President, Deputy General Counsel and Corporate Secretary at Foster Wheeler AG and before that, as Vice President, Corporate and Securities Law and Secretary with Avaya, Inc. Mr. Sherbet earned his law degree from New York University School of Law and received his bachelor’s degree in commerce/accounting from University of Virginia.
Item 11. Executive Compensation
Compensation
The information required by this item is set forth under the headings “Director Compensation,” “Compensation Discussion and Analysis,” “Compensation Committee Report,” “Compensation of Named Executive Officers,” and “Compensation Committee Interlocks and Insider Participation” in the 2019 Proxy Statement and is incorporated herein by reference.

125
Item 12. Security Ownership of Certain Beneficial Owners and Management and Related Stockholder Matters
Information in response to this Item, other than Securities Authorized for Issuance Under Equity Compensation Plans, will be set forth in the section entitled “Security Ownership of Certain Beneficial Owners and Management” in the Company’s 2019 Proxy Statement, which information is incorporated herein by reference.
Securities Authorized for Issuance Under Equity Compensation Plans
The following table provides certain information with respect to all of our equity compensation plans in effect as of December 31, 2018:
Equity Compensation Plan Information
Plan Category
Number of Securitiesto be issued Upon
Exercise ofOutstanding Options,Warrants and Rights
(a)
Weighted AverageExercise Price of
Outstanding Options,Warrants and Rights
(b)
Number of SecuritiesRemaining Available forFuture Issuance Under
Equity Compensation Plans(excluding securities
reflected in column (a))(c)
Equity compensation plans approved by security holders 7,889,412 (1) $ 63.66 (3) 12,071,242 (4)
Equity compensation plans not approved by security holders 26,727 (2) $ — — Total 7,916,139 $ 63.66 (3) 12,071,242
(1) Consists of: (i) 6,729,752 shares of common stock issuable upon the exercise of outstanding time-based stock options and underlying outstanding time-based SARs; (ii) 385,458 shares of common stock issuable in settlement of outstanding restricted stock units awarded and (ii) 774,202 shares of common stock issuable in settlement of outstanding performance units awarded. Excludes (i) 436,067 shares of common stock subject to outstanding awards of restricted stock and (ii) 76,374 shares of common stock subject to outstanding awards of performance stock.
(2) Consists of outstanding awards issued to certain executives with supplemental pension benefits in accordance with their individual employment arrangements under the IMS Health DCERP.
(3) The weighted-average exercise price includes all outstanding stock options and SARs but does not include restricted stock units, restricted stock, performance units or performance stock or IMS Health DCERP awards, all of which do not have an exercise price. If restricted stock units, performance units and other awards that constitute “rights” were included in this calculation, treating such awards as having an exercise price of $0, the weighted average exercise price of outstanding options, warrants and rights would be $54.30.
(4) Consists of all securities remaining available under our equity compensation plans. All of these shares are available for delivery under stock options, SARs, restricted stock, restricted stock units, performance awards or other forms of equity award authorized by the plans. Does not include 2,251,704 shares that would have remained available under our Employee Stock Purchase Plan had it not been discontinued as of December 31, 2016.
Item 13. Certain Relationships and Related Transactions and Director Independence
The information required by this item is set forth under the headings “The Company’s Corporate Governance,” and “Certain Relationships and Related Party Transactions” in the 2019 Proxy Statement and is incorporated herein by reference.
Item 14. Principal Accountant Fees and Services
The information required by this item is set forth under the headings “Proposal No. 2: Ratification of the Appointment of the Independent Registered Public Accounting Firm—Fees Paid to Independent Registered Public Accounting Firm” in the 2019 Proxy Statement and is incorporated herein by reference.

126
PART IV
Item 15. Exhibits and Financial Statement Schedules
(a) The following documents are filed as part of this report:
(1) Financial Statements
The following consolidated financial statements of IQVIA Holdings Inc. and its subsidiaries, and the independent registered public accounting firm’s report thereon, are included in Part II, Item 8 of this report:
Page
Management’s Report on Internal Control over Financial Reporting 66Report of Independent Registered Public Accounting Firm 67Consolidated Statements of Income 69Consolidated Statements of Comprehensive (Loss) Income 70Consolidated Balance Sheets 71Consolidated Statements of Cash Flows 72Consolidated Statements of Stockholders’ Equity (Deficit) 73Notes to Consolidated Financial Statements 74
(2) Financial Statement Schedules for the Years Ended December 31, 2018, 2017 and 2016
Schedule I—Condensed Financial Information of Registrant (Parent Company Only) 133Schedule II—Valuation and Qualifying Accounts 138
All other schedules are omitted, since the required information is not applicable or is not present in amounts sufficient to require submission of the schedule, or because the information required is included in the consolidated financial statements and notes thereto.
(3) Exhibits
The exhibits in the accompanying Exhibit Index preceding the signature page are filed or furnished as a part of this report and are incorporated herein by reference. The Company agrees to furnish to the SEC, upon request, copies of any long-term debt instruments that authorize an amount of securities constituting 10% or less of the total assets of IQVIA Holdings Inc. and its subsidiaries on a consolidated basis.

127
EXHIBIT INDEX
Incorporated by Reference
ExhibitNumber
Exhibit Description
FiledHerewith Form File No. Exhibit Filing Date
2.1* Agreement and Plan of Merger, dated as of May 3, 2016, by and between Quintiles Transnational Holdings Inc. and IMS Health Holdings, Inc. (which includes the Plan of Conversion dated as of May 3, 2016 as Exhibit A thereto).
8-K 001-35907 2.1 May 3, 2016
3.1 Amended and Restated Certificate of Incorporation of IQVIA Holdings Inc., effective November 6, 2017 (as amended through November 6, 2017).
10-K 001-35907 3.1 February 16, 2018
3.2 Amended and Restated Bylaws of IQVIA Holdings Inc., effective November 6, 2017
8-K 001-35907 3.2 November 7, 2017
4.1 Specimen Common Stock Certificate of Quintiles Transnational Holdings Inc. S-1/A 333-186708 4.1 April 26, 2013
4.2 Indenture dated as of May 12, 2015, among Quintiles Transnational Corp., the subsidiary guarantors listed therein and U.S. Bank National Association as trustee.
8-K 001-35907 4.1 May 13, 2015
4.3 Form of 4.875% Rule 144A Senior Note due 2023 (incorporated by reference to Exhibit A to Exhibit 4.1 filed May 13, 2015).
8-K 001-35907 4.2 May 13, 2015
4.4 Form of 4.875% Regulation S Senior Note due 2023 (incorporated by reference to Exhibit A to Exhibit 4.1 filed May 13, 2015).
8-K 001-35907 4.3 May 13, 2015
4.5 Indenture, dated as of September 28, 2016, among Quintiles IMS Incorporated, the Guarantors listed therein and U.S. Bank National Association, as Trustee.
8-K 001-35907 4.1 October 3, 2016
4.6 Senior Note Indenture, dated as of October 24, 2012, among IMS Health Incorporated, as Issuer, the Guarantors party thereto, and Wells Fargo Bank, National Association, as Trustee.
IMSHealth
S-1
333-193159 4.9 January 2, 2014
4.7 Senior Note Indenture, dated as of March 30, 2015, among IMS Health Incorporated, as Issuer, the Guarantors party thereto, and Deutsche Trustee Company Limited, as Trustee.
IMSHealth10-Q
001-36381 4.1 May 15, 2015
4.8 Indenture, dated February 28, 2017, among Quintiles IMS Incorporated, as Issuer, U.S. Bank National Association, as trustee of the Notes, and certain subsidiaries of the Issuer as guarantors.
8-K 001-35907 4.1 February 28, 2017
4.9 Indenture, dated September 14, 2017, among Quintiles IMS Incorporated, as Issuer, U.S. Bank National Association, as trustee of the Notes, and certain subsidiaries of the Issuer as guarantors.
8-K 001-35907 4.1 September 19, 2017
10.1 Fourth Amended and Restated Credit Agreement, dated as of October 3, 2016, by and among Quintiles IMS Incorporated, Quintiles IMS Holdings, Inc., the Guarantors party thereto and the Lenders party thereto (Annex B to Exhibit 10.9 filed October 3, 2016).
8-K 001-35907 10.9 October 3, 2016
10.2 Amendment No. 1, dated March 7, 2017, to Fourth Amended and Restated Credit Agreement, dated October 3, 2016, among Quintiles IMS Incorporated, Quintiles IMS Holdings, Inc., the Guarantors party thereto, Bank of America N.A., as administrative agent and collateral agent, the Incremental Term B-1 Euro Lenders party thereto and the other Lenders party thereto.
8-K 001-35907 10.1 March 8, 2017
10.3 Amendment No. 2, dated September 18, 2017, to Fourth Amended and Restated Credit Agreement, by and among Quintiles IMS Incorporated, Quintiles IMS Holdings, Inc., the Guarantors party thereto, Bank of America N.A., as administrative agent and collateral agent, the Incremental Term B-2 Dollar Lenders party thereto and the other Lenders party thereto.
8-K 001-35907 10.1 September 19, 2017
10.4 Amendment No. 3, dated April 6, 2018, to Fourth Amended and Restated Credit Agreement, dated October 3, 2016, by and among IQVIA Inc., IQVIA Holdings Inc., the other Borrowers party thereto, the other Guarantors party thereto, Bank of America, N.A., as administrative agent and collateral agent, and the Incremental Revolving Credit Lenders party thereto.
10-Q 001-35907 10.1 May 4, 2018
10.5 Amendment No. 4, dated June 11, 2018, to Fourth Amended and Restated Credit Agreement, dated October 3, 2016, among IQVIA Inc., IQVIA Holdings Inc., IQVIA AG, IQVIA Solutions Japan K.K., the other guarantors party thereto, Bank of America, N.A. as administrative agent and as collateral agent, the Lenders party thereto, the Incremental Term B-3 Dollar Lenders party thereto and the Incremental Term B-2 Euro Lenders party thereto.
8-K 001-35907 10.1 June 12, 2018

128
Incorporated by Reference
ExhibitNumber
Exhibit Description
FiledHerewith Form File No. Exhibit Filing Date
10.6 Senior Note Purchase Agreement, dated September 14, 2016, between IMS Health Incorporated, a wholly owned subsidiary of IMS Health Holdings, Inc., and the representative of the initial purchasers named therein.
10-Q 001-35907 10.10 November 3, 2016
10.7 Amended and Restated Pledge and Security Agreement, dated as of March 17, 2014, among Healthcare Technology Intermediate Holdings, Inc., IMS Health Incorporated, each of the grantors party thereto, and Bank of America, N.A., as Administrative Agent.
IMSHealthS-1/A
333-193159 10.33 March 24, 2014
10.8 U.S. Guaranty, dated as of March 17, 2014, among Healthcare Technology Intermediate Holdings, Inc., as Holdings, IMS Health Incorporated, as Parent Borrower, the other Guarantors party thereto from time to time, and Bank of America, N.A., as Administrative Agent.
IMSHealthS-1/A
333-193159 10.34 March 24, 2014
10.9 Stockholders Agreement, dated May 3, 2016, among Quintiles Transnational Holdings Inc. and the stockholders identified therein.
8-K 001-35907 10.4 May 3, 2016
10.10 Voting Agreement, dated May 3, 2016, by and among Quintiles Transnational Holdings Inc. and affiliates of TPG Global, LLC.
8-K 001-35907 10.1 May 3, 2016
10.11 Voting Agreement, dated May 3, 2016, by and between Quintiles Transnational Holdings Inc. and CPP Investment Board Private Holdings Inc.
8-K 001-35907 10.2 May 3, 2016
10.12† Form of Director Indemnification Agreement. S-1/A 333-186708 10.13 April 19, 2013
10.13 Form of Indemnification Agreement with each of the non-management directors of Quintiles IMS Holdings Inc.
8-K 001-35907 10.8 October 3, 2016
10.14† Description of Non-Employee Director Compensation, effective as of January 1, 2017.
10-K 001-35907 10.27 February 16, 2017
10.15† Form of Non-Competition, Non-Solicitation, Confidentiality and IP Agreement. 8-K 001-35907 10.2 October 19, 2015
10.16† Quintiles Transnational Holdings Inc. Annual Management Incentive Plan. S-1/A 333-186708 10.57 April 19, 2013
10.17† Quintiles Transnational Holdings Inc. 2008 Stock Incentive Plan. S-1 333-186708 10.17 February 15, 2013
10.18† Form of Stock Option Award Agreement for Senior Executives under the Quintiles Transnational Holdings Inc. 2008 Stock Incentive Plan.
S-1 333-186708 10.18 February 15, 2013
10.19† Form of Stock Option Award Agreement for Non-Employee Directors under the Quintiles Transnational Holdings Inc. 2008 Stock Incentive Plan.
S-1 333-186708 10.19 February 15, 2013
10.20† Quintiles Transnational Holdings Inc. 2013 Stock Incentive Plan. S-1/A 333-186708 10.22 April 19, 2013
10.21† Form of Award Agreement Awarding Nonqualified Stock Options to Employees under the Quintiles Transnational Holdings Inc. 2013 Stock Incentive Plan.
S-1/A 333-186708 10.23 April 19, 2013
10.22† Form of Award Agreement Awarding Incentive Stock Options to Employees under the Quintiles Transnational Holdings Inc. 2013 Stock Incentive Plan.
10-Q 001-35907 10.2 May 1, 2014
10.23† Form of Award Agreement Awarding Nonqualified Stock Options to Non-Employee Directors under the Quintiles Transnational Holdings Inc. 2013 Stock Incentive Plan.
S-1/A 333-186708 10.24 April 19, 2013
10.24† Form of Award Agreement Awarding Stock Appreciation Rights under the Quintiles Transnational Holdings Inc. 2013 Stock Incentive Plan.
S-1/A 333-186708 10.56 April 19, 2013
10.25† Form of Award Agreement Awarding Stock Appreciation Rights under the Quintiles IMS Holdings, Inc. 2013 Stock Incentive Plan effective February 2017.
10-K 001-35907 10.41 February 16, 2017
10.26† Form of Award Agreement Awarding Restricted Stock Units under the Quintiles Transnational Holdings Inc. 2013 Stock Incentive Plan prior to February 2015.
8-K 001-35907 10.1 November 26, 2013
10.27† Form of Award Agreement Awarding Restricted Stock Units under the Quintiles Transnational Holdings Inc. 2013 Stock Incentive Plan effective February 2015.
10-K 001-35907 10.34 February 12, 2015
10.28† Form of Award Agreement Awarding Performance Units under the Quintiles Transnational Holdings Inc. 2013 Stock Incentive Plan.
10-K 001-35907 10.35 February 12, 2015
10.29† Form of Award Agreement Awarding Performance Shares under the Quintiles IMS Holdings, Inc. 2013 Stock Incentive Plan effective February 2017.
10-K 001-35907 10.45 February 16, 2017

129
Incorporated by Reference
ExhibitNumber
Exhibit Description
FiledHerewith Form File No. Exhibit Filing Date
10.30† Form of Restricted Stock Award Agreement under the Quintiles Transnational Holdings Inc. 2013 Stock Incentive Plan.
10-Q 001-35907 10.3 November 3, 2016
10.31† Form of Award Agreement Awarding Restricted Stock Units under the Quintiles IMS Holdings, Inc. 2013 Stock Incentive Plan effective February 2017.
10-K 001-35907 10.47 February 16, 2017
10.32† Quintiles IMS Holdings, Inc. Defined Contribution Executive Retirement Plan. 8-K 001-35907 10.7 October 3, 2016
10.33† IMS Health Incorporated Defined Contribution Executive Retirement Plan, as amended and restated.
IMSHealth
S-1
333-193159 10.10 January 2, 2014
10.34† First Amendment to the IMS Health Incorporated Retirement Excess Plan, dated March 17, 2009.
IMSHealth
S-1
333-193159 10.12 January 2, 2014
10.35† Second Amendment to the IMS Health Incorporated Retirement Excess Plan, dated December 8, 2009.
IMSHealth
S-1
333-193159 10.13 January 2, 2014
10.36† Third Amendment to the IMS Health Incorporated Retirement Excess Plan, dated April 5, 2011.
IMSHealth
S-1
333-193159 10.14 January 2, 2014
10.37† Fourth Amendment to the IMS Health Incorporated Retirement Excess Plan (effective May 3, 2016).
IMSHealth10-Q
001-36381 10.3 July 28, 2016
10.38† Quintiles IMS Holdings, Inc. 2010 Equity Incentive Plan. 8-K 001-35907 10.5 October 3, 2016
10.39† Healthcare Technology Holdings, Inc. 2010 Equity Incentive Plan, as amended and restated.
IMSHealthS-1/A
333-193159 10.16 February 13, 2014
10.40† Form of IMS Time-and Performance-Based Stock Option Award Agreement under the 2010 Equity Incentive Plan.
IMSHealth
S-1
333-193159 10.17 January 2, 2014
10.41† Form of IMS Time-Based Stock Option Award Agreement under the 2010 Equity Incentive Plan.
IMSHealth
S-1
333-193159 10.18 January 2, 2014
10.42† Form of IMS Director Stock Option Award Agreement under the 2010 Equity Incentive Plan.
IMSHealth
S-1
333-193159 10.19 January 2, 2014
10.43† Form of IMS Restricted Stock Unit Award Agreement under the 2010 Equity Incentive Plan.
IMSHealth
S-1
333-193159 10.20 January 2, 2014
10.44† Form of IMS Director Restricted Stock Unit Award Agreement under the 2010 Equity Incentive Plan.
IMSHealth
S-1
333-193159 10.21 January 2, 2014
10.45† Form of IMS Rollover Stock Appreciation Right Award Agreement under the 2010 Equity Incentive Plan.
IMSHealth
S-1
333-193159 10.22 January 2, 2014
10.46† IMS Health Incorporated Savings Equalization Plan, as amended and restated effective as of January 1, 2011.
IMSHealth
S-1
333-193159 10.15 January 2, 2014
10.47† Quintiles IMS Holdings, Inc. 2014 Incentive and Stock Award Plan. 8-K 001-35907 10.6 October 3, 2016
10.48† Form of IMS Stock Appreciation Rights Agreement under the 2014 Incentive and Stock Award Plan.
IMSHealth
8-K
001-36381 10.1 February 10, 2015
10.49† Form of IMS Performance Share Award Agreement under the 2014 Incentive and Stock Award Plan.
IMSHealth
8-K
001-36381 10.2 February 10, 2015

130
Incorporated by Reference
ExhibitNumber
Exhibit Description
FiledHerewith Form File No. Exhibit Filing Date
10.50† 2014 IMS Health Annual Incentive Plan. IMSHealthS-1/A
333-193159 10.30 March 10, 2014
10.51† Quintiles IMS Holdings, Inc. 2017 Incentive and Stock Award Plan. DEF 14A 001-35907 Appendix B February 22, 2017
10.52† Form of Award Agreement Awarding Stock Appreciation Rights under the Quintiles IMS Holdings, Inc. 2017 Incentive and Stock Award Plan effective April 2017.
10-Q 001-35907 10.8 May 8, 2017
10.53† Form of Award Agreement Awarding Performance Shares under the Quintiles IMS Holdings, Inc. 2017 Incentive and Stock Award Plan effective April 2017.
10-Q 001-35907 10.9 May 8, 2017
10.54† Form of Award Agreement Awarding Restricted Stock Units under the Quintiles IMS Holdings, Inc. 2017 Incentive and Stock Award Plan effective April 2017.
10-Q 001-35907 10.10 May 8, 2017
10.55† Quintiles Transnational Holdings Inc. Change of Control Severance Plan, which covers among others our executive officers.
8-K 001-35907 10.1 November 6, 2015
10.56† Quintiles IMS Incorporated Employee Protection Plan, effective January 1, 2017. 10-K 001-35907 10.69 February 16, 2017
10.57† Quintiles IMS Incorporated Savings Equalization Plan, effective December 31, 2016.
10-K 001-35907 10.76 February 16, 2017
10.58† Quintiles Transnational Corp. Elective Deferred Compensation Plan, as amended and restated.
10-Q 001-35907 10.1 October 28, 2015
10.59† Quintiles IMS Holdings Inc. Non-Employee Director Deferral Plan, effective January 1, 2017.
10-K 001-35907 10.78 February 16, 2017
10.60† Amended and Restated Employment Agreement between IQVIA Holdings Inc. and Ari Bousbib, dated February 18, 2019.
X
10.61† Senior Management Nonstatutory Option Agreement between Healthcare Technology Holdings, Inc. and Ari Bousbib, dated December 1, 2010.
IMSHealthS-1/A
333-193159 10.23 February 13, 2014
10.62† Senior Management Nonstatutory Option Agreement between Healthcare Technology Holdings, Inc. and Ari Bousbib, dated December 1, 2010.
IMSHealthS-1/A
333-193159 10.24 February 13, 2014
10.63† Restricted Stock Unit Award Agreement between IMS Health Holdings, Inc. and Ari Bousbib dated February 12, 2014, incorporated herein by reference to Amendment 2 to the Company’s Registration Statement on Form S-1 filed with the SEC on March 10, 2014.
IMSHealthS-1/A
333-193159 10.29 March 10, 2014
10.64† Amendment No. 1, dated December 31, 2015, to Restricted Stock Unit Award Agreement between IMS Health Holdings, Inc. and Ari Bousbib dated February 12, 2014.
IMSHealth10-K
001-36381 10.33 February 19, 2016
10.65† Stock Appreciation Rights Agreement between IMS Health Holdings, Inc. and Ari Bousbib, dated February 10, 2015.
IMSHealth10-K
001-36381 10.34 February 19, 2016
10.66† Amendment No. 1, dated December 31, 2015, to Stock Appreciation Rights Agreement between IMS Health Holdings, Inc. and Ari Bousbib dated February 10, 2015.
IMSHealth10-K
001-36381 10.35 February 19, 2016
10.67† Restricted Stock Award Agreement between IMS Health Holdings, Inc. and Ari Bousbib dated December 31, 2015.
IMSHealth10-K
001-36381 10.36 February 19, 2016
10.68† Letter Agreement, dated October 14, 2015, between Michael McDonnell and Quintiles Transnational Corp.
8-K 001-35907 10.3 October 19, 2015
10.69† Initial Award Agreement Awarding Restricted Stock Units to Michael McDonnell under the Quintiles Transnational Holdings Inc. 2013 Stock Incentive Plan.
10-K 001-35907 10.29 February 11, 2016
10.70† Letter agreement between the Company and Michael R. McDonnell effective on October 3, 2016.
8-K 001-35907 10.1 October 3, 2016

131
Incorporated by Reference
ExhibitNumber
Exhibit Description
FiledHerewith Form File No. Exhibit Filing Date
10.71† Letter Agreement between the Company and W. Richard Staub, III, effective on December 1, 2016.
10-K 001-35907 10.104 February 16, 2017
10.72† Letter Agreement between the Company and Eric Sherbet, effective on March 1, 2018.
X
21.1 List of Subsidiaries of IQVIA Holdings Inc. X
23.1 Consent of PricewaterhouseCoopers LLP. X
31.1 Certification of Chief Executive Officer, pursuant to Rule 13a-14(a)/15d-14(a), as adopted pursuant to Section 302 of the Sarbanes-Oxley Act of 2002.
X
31.2 Certification of Executive Vice President and Chief Financial Officer, pursuant to Rule 13a-14(a)/15d-14(a), as adopted pursuant to Section 302 of the Sarbanes-Oxley Act of 2002.
X
32.1 Certification of Chief Executive Officer, pursuant to 18 U.S.C. Section 1350, as adopted pursuant to Section 906 of the Sarbanes-Oxley Act of 2002.
X
32.2 Certification of Executive Vice President and Chief Financial Officer, pursuant to 18 U.S.C. Section 1350, as adopted pursuant to Section 906 of the Sarbanes-Oxley Act of 2002.
X
101 Interactive Data Files Pursuant to Rule 405 of Regulation S-T: (i) Consolidated Statements of Income, (ii) Consolidated Statements of Comprehensive Income, (iii) Consolidated Balance Sheets, (iv) Consolidated Statements of Cash Flows, and (v) Notes to Consolidated Financial Statements.
X
† Indicates management contract or compensatory plan or arrangement.
* The Merger Agreement and the description thereof included herein have been included to provide investors and stockholders with information regarding the terms of the agreement. They are not intended to provide any other factual information about Quintiles or IMS Health or their respective subsidiaries or affiliates or stockholders. The representations, warranties and covenants contained in the Merger Agreement were made only for purposes of the Merger Agreement as of the specific dates therein, were solely for the benefit of the parties to the Merger Agreement, may be subject to limitations agreed upon by the contracting parties, including being qualified by confidential disclosures made for the purposes of allocating contractual risk among the parties to the Merger Agreement instead of establishing these matters as facts, and may be subject to standards of materiality applicable to the contracting parties that differ from those applicable to investors. Investors should not rely on the representations, warranties and covenants or any descriptions thereof as characterizations of the actual state of facts or condition of the parties thereto or any of their respective subsidiaries or affiliates. Moreover, information concerning the subject matter of representations and warranties may change after the date of the Merger Agreement, which subsequent information may or may not be fully reflected in public disclosures by Quintiles or IMS Health. Accordingly, investors should read the representations and warranties in the Merger Agreement not in isolation but only in conjunction with the other information about Quintiles or IMS Health and their respective subsidiaries that the respective companies include in reports, statements and other filings they make with the United States Securities and Exchange Commission.
Item 16. Form 10-K Summary
None.

132
SIGNATURES
Pursuant to the requirements of Section 13 or 15(d) of the Securities Exchange Act of 1934, the registrant has duly caused this report to be signed on its behalf by the undersigned, thereunto duly authorized.
IQVIA HOLDINGS INC.
By: /s/ Michael R. McDonnell
Name: Michael R. McDonnell
Title: Executive Vice President and Chief Financial Officer
Date: February 19, 2019
Pursuant to the requirements of the Securities Exchange Act of 1934, this report has been signed below by the following persons on behalf of the registrant in the capacities and on the dates indicated.
Signature
Title
Date
/s/ Ari Bousbib
Ari BousbibChairman, Chief Executive Officer and President; Director
(Principal Executive Officer)February 19, 2019
/s/ Michael R. McDonnell Michael R. McDonnell
Executive Vice President and Chief Financial Officer(Principal Financial Officer)
February 19, 2019
/s/ Emmanuel Korakis Emmanuel Korakis
Senior Vice President, Corporate Controller(Principal Accounting Officer)
February 19, 2019
/s/ John P. Connaughton John P. Connaughton
Director February 19, 2019
/s/ Jonathan J. Coslet Jonathan J. Coslet
Director February 19, 2019
/s/ John G. DanhaklJohn G. Danhakl
Director February 19, 2019
/s/ Michael J. Evanisko
Michael J. EvaniskoDirector February 19, 2019
/s/ James A. Fasano James A. Fasano
Director February 19, 2019
/s/ Colleen A. GogginsColleen A. Goggins
Director February 19, 2019
/s/ Jack M. GreenbergJack M. Greenberg
Director February 19, 2019
/s/ John M. Leonard, M.D. John M. Leonard, M.D.
Director February 19, 2019
/s/ Ronald A. Rittenmeyer Ronald A. Rittenmeyer
Director February 19, 2019
/s/ Todd B. Sisitsky
Todd B. SisitskyDirector February 19, 2019

133
(2) Financial Statement Schedules
Schedule I—Condensed Financial Information of Registrant
IQVIA HOLDINGS INC. (PARENT COMPANY ONLY) CONDENSED STATEMENTS OF INCOME
Year Ended December 31, (in millions) 2018 2017 2016
Selling, general and administrative expenses $ 2 $ 1 $ — Merger related costs — — 21
Loss from operations (2) (1) (21)Interest income — — — Other expense, net — — —
Loss before income taxes and equity in earnings of subsidiary (2) (1) (21)Income tax benefit (1) (3) (4)
(Loss) income before equity in earnings of subsidiary (1) 2 (17)Equity in earnings of subsidiary 260 1,275 89
Net income $ 259 $ 1,277 $ 72

134
IQVIA HOLDINGS INC. (PARENT COMPANY ONLY)CONDENSED STATEMENTS OF COMPREHENSIVE (LOSS) INCOME
Year Ended December 31, (in millions) 2018 2017 2016
Net income $ 259 $ 1,277 $ 72 Comprehensive (loss) income adjustments:
Unrealized gains (losses) on derivative instruments, net of income tax (benefit) expense of ($5), $1 and $3 1 4 (7)Defined benefit plan adjustments, net of income tax (benefit) expense of ($4), $3 and $11 (8) 5 23 Foreign currency translation, net of income tax expense (benefit) of $50, ($201) and ($9) (255) 604 (492)
Reclassification adjustments: (Gains) losses on derivative instruments included in net income, net of income tax expense of $1, $— and $7 (12) (1) 21 Amortization of actuarial losses and prior service costs included in net income 1 1 1
Comprehensive (loss) income $ (14) $ 1,890 $ (382)

135
IQVIA HOLDINGS INC. (PARENT COMPANY ONLY)CONDENSED BALANCE SHEETS
December 31, (in millions, except per share data) 2018 2017
ASSETS Current assets:
Cash and cash equivalents $ 1 $ 1 Income taxes receivable — — Other current assets and receivables — 1
Total current assets 1 2 Investment in subsidiary 9,667 9,659 Receivable from parent company — —
Total assets $ 9,668 $ 9,661
LIABILITIES AND STOCKHOLDERS’ EQUITY Current liabilities:
Accounts payable $ — $ — Income taxes payable — —
Total current liabilities — — Investment in subsidiary 2,954 1,666 Payable to subsidiary — —
Total liabilities 2,954 1,666 Commitments and contingencies Stockholders’ equity:
Common stock and additional paid-in capital, 400.0 shares authorized at December 31, 2018 and 2017, $0.01 par value, 251.5 and 249.5 shares issued and outstanding at December 31, 2018 and 2017, respectively 10,901 10,782 Retained earnings 807 538 Treasury stock, at cost, 54.0 and 41.4 shares at December 31, 2018 and 2017, respectively (4,770) (3,374)Accumulated other comprehensive (loss) income (224) 49
Total stockholders’ equity 6,714 7,995 Total liabilities and stockholders’ equity $ 9,668 $ 9,661

136
IQVIA HOLDINGS INC. (PARENT COMPANY ONLY)CONDENSED STATEMENTS OF CASH FLOWS
Year Ended December 31, (in millions) 2018 2017 2016
Operating activities: Net income $ 259 $ 1,277 $ 72 Adjustments to reconcile net income to cash provided by operating activities:
Subsidiary loss 143 91 91 Change in operating assets and liabilities:
Accounts payable and accrued expenses 2 (3) — Income taxes payable and other liabilities — 4 (4)
Net cash provided by operating activities 404 1,369 159 Investing activities:
Investment in subsidiary, net of dividends received 983 1,182 834 Net cash provided by investing activities 983 1,182 834
Financing activities: Proceeds related to employee stock purchase and option plans 15 91 97 Repurchase of common stock (1,405) (2,620) (1,097)Intercompany with subsidiary 3 (31) 14
Net cash used in financing activities (1,387) (2,560) (986)Effect of foreign currency exchange rate changes on cash — (2) — (Decrease) increase in cash and cash equivalents — (11) 7 Cash and cash equivalents at beginning of period 1 12 5 Cash and cash equivalents at end of period $ 1 $ 1 $ 12

137
IQVIA HOLDINGS INC. (PARENT COMPANY ONLY) NOTES TO CONDENSED FINANCIAL INFORMATION
The condensed parent company financial statements have been prepared in accordance with Rule 12-04, Schedule I of Regulation S-X as the restricted net assets of IQVIA Holdings Inc.’s (the “Company”) wholly-owned subsidiary, IQVIA Incorporated exceed 25% of the consolidated net assets of the Company. The ability of IQVIA Incorporated to pay dividends may be limited due to the restrictive covenants in the agreements governing its credit arrangements.
These condensed parent company financial statements include the accounts of IQVIA Holdings Inc. on a standalone basis (the “Parent”) and the equity method of accounting is used to reflect ownership interest in its subsidiary. Refer to the consolidated financial statements and notes presented elsewhere herein for additional information and disclosures with respect to these financial statements.
Since the Parent is part of a group that files a consolidated income tax return, in accordance with ASC 740, a portion of the consolidated amount of current and deferred income tax expense of the Company has been allocated to the Parent. The income tax benefit of $1 million, $3 million and $4 million in 2018, 2017 and 2016, respectively, represents the income tax benefit that will be or were already utilized in the Company’s consolidated United States federal and state income tax returns. If the Parent was not part of these consolidated income tax returns, it would not be able to recognize any income tax benefit, as it generates no revenue against which the losses could be used on a separate filer basis.
Below is a summary of the dividends paid to the Parent by IQVIA Incorporated in 2018, 2017 and 2016:
(in millions) Amount
Paid in December 2018 $ 339 Paid in November 2018 146 Paid in October 2018 132 Paid in September 2018 118 Paid in June 2018 414 Paid in May 2018 154 Paid in March 2018 54 Paid in February 2018 37
Total paid in 2018 $ 1,394
Paid in December 2017 $ 22 Paid in November 2017 362 Paid in September 2017 373 Paid in August 2017 168 Paid in May 2017 356 Paid in March 2017 1,237 Paid in February 2017 45 Paid in January 2017 3
Total paid in 2017 $ 2,566
Paid in December 2016 $ 503 Paid in November 2016 422 Paid in June 2016 89
Total paid in 2016 $ 1,014

138
Schedule II—Valuation and Qualifying Accounts
Deferred Tax Asset Valuation Allowance
Additions
(in millions)
Balance atBeginning
of Year Charged toExpenses
Charged toOther
Accounts(a) Additions
(Deductions)(b)
Balance atEnd ofYear
December 31, 2018 $ 200 $ 23 $ — $ 3 $ 226 December 31, 2017 $ 153 $ 52 $ — $ (5) $ 200 December 31, 2016 $ 22 $ 10 $ 129 $ (8) $ 153
(a) Recorded through purchase accounting transaction. (b) Impact of reductions recorded to expense and translation adjustments.

Exhibit 10.60
Execution Version
AMENDED AND RESTATED EMPLOYMENT AGREEMENT
AMENDED AND RESTATED EMPLOYMENT AGREEMENT, dated as of February 18, 2019 (the “Agreement”), between IQVIA Holdings Inc. (the “Company”) and Ari Bousbib (the “Executive”).
WHEREAS, the Company desires that the Executive continue to serve the Company as its Chief Executive Officer and President on the terms and conditions set forth herein.
NOW, THEREFORE, in consideration of the premises and mutual covenants herein and for other good and valuable consideration, the parties agree as follows:
1. General.
This Agreement shall govern the terms and conditions of the Executive’s continued employment with the Company on and after July 26, 2018 (the “Effective Date”). The Executive’s principal place of employment shall continue to be at the Company’s offices in New York, New York and Parsippany, New Jersey.
2. Employment, Duties and Agreements.
(a) Position. The Company hereby agrees to continue to employ the Executive as its Chief Executive Officer and President, and the Executive hereby agrees to continue in such position and agrees to serve the Company in such capacities during the employment period fixed by Section 4 hereof (the “Employment Period”). During the Employment Period, subject to the requirements of applicable law (including, without limitation, any rules or regulations of any exchange on which the common stock of the Company is listed, if applicable), the Company agrees to propose to the shareholders of the Company at each applicable annual meeting occurring during the Employment Period the re-election of the Executive as a member of the Board of Directors of the Company (the “Board”) and the Executive shall so serve if re-elected. In addition, and without further compensation, the Executive shall serve as a director and/or officer of one or more of the Company’s Affiliates (as defined below) if so elected or appointed from time to time. In the event the Executive’s employment with the Company terminates for any reason, the Executive’s membership on the Board and the Executive’s service as a director and/or officer of the Company and any of the Company’s Affiliates shall also terminate, and the Executive shall be deemed to resign from the Board and from all such director and officer positions immediately upon such termination of employment, in each case, unless otherwise agreed in writing by the Company and the Executive. The Executive shall have such duties and responsibilities as are consistent with the Executive’s position and as may be reasonably assigned by the Board from time to time. During the Employment Period, the Executive shall report to, and shall act in accordance with, all reasonable instructions and directions of the Board and all applicable policies and rules of the Company.
(b) Duties. During the Employment Period, excluding any periods of vacation and sick leave to which the Executive is entitled, the Executive shall devote his full working time, energy and attention, and his best efforts, abilities, experience and talent, to the performance of his duties and responsibilities hereunder and shall faithfully and diligently endeavor to promote the business and best interests of the Company.

-2-
(c) Outside Activities. During the Employment Period, the Executive may not, without the prior written consent of the Board, directly or indirectly, operate, participate in the management, operations or control of, or act as an executive, officer, consultant, agent or representative of, any type of business or service (other than as an executive of the Company); provided, that it shall not be a violation of the foregoing for the Executive to (i) manage his personal, familial, real estate, financial and legal affairs or trusts or (ii) serve as a director of (or similar position with) an educational, charitable, community, civic, religious or similar type of organization, with the approval of the Board, so long as, in each such case, such activities do not interfere with the performance of his duties and responsibilities to the Company as provided hereunder; and provided, further, that the Board shall not unreasonably withhold consent to the Executive serving as a director on the board of a company whose activities are not in competition, directly or indirectly, with those of the Company and the amount of time and attention required of the Executive to satisfy his obligations as such a director are not reasonably likely to, and do not, detract from the execution of his duties and responsibilities hereunder in any material respect. Such consent is hereby granted for the Executive to continue as a member of the board of directors of The Home Depot, Inc.
3. Compensation.
(a) Base Salary. As compensation for the agreements made by the Executive herein and the performance by the Executive of his obligations hereunder, during the Employment Period, the Company shall pay the Executive, pursuant to its normal and customary payroll procedures, a base salary at the rate of $1,700,000 per annum (the “Base Salary”). The Executive’s Base Salary shall be reviewed at least annually by the Board or the Leadership Development and Compensation Committee of the Board (the “Compensation Committee”) for increase only.
(b) Annual Bonus. During the Employment Period, the Executive shall be eligible, through participation in the Company’s annual bonus plan or program for its executives generally, as in effect from time to time (the “Bonus Plan”), to earn an annual bonus (the “Annual Bonus”) in each fiscal year during the Employment Period, with a target Annual Bonus of 200% of Base Salary, with the actual amount of the Annual Bonus paid to the Executive based on the achievement of performance objectives approved by the Board or the Compensation Committee (it being understood that the Executive may be eligible to earn an Annual Bonus in excess of the target Annual Bonus if performance for a fiscal year exceeds target performance to the extent determined by the Board or the Compensation Committee in accordance with the terms of the Bonus Plan). In addition, the Board or the Compensation Committee may, in its discretion, increase the Executive’s target Annual Bonus opportunity as a percentage of Base Salary. To the extent so earned, any Annual Bonus shall be paid in accordance with the Bonus Plan.
(c) Equity Awards. During the Employment Period the Executive shall be eligible to receive equity and equity-based awards in the discretion of the Board or the Compensation Committee and on such terms and conditions as determined by the Board or the Compensation Committee. Any equity and equity-based awards granted to the Executive, whether before or after the Effective Date, shall be governed by the terms and conditions of the applicable Company equity incentive plan(s), as may be in effect from time to time, and the award

-3-
agreements governing such equity or equity-based awards (any such plan and award agreements, collectively, the “Equity Agreements”).
(d) Benefits. During the Employment Period, except as specifically provided herein, (i) the Executive shall be entitled to participate in all savings and retirement plans, practices, policies and programs of the Company that are made available generally to other senior executive officers of the Company, including the IMS Health Retirement Plan, the IMS Health Savings Equalization Plan, and the IMS Health Retirement Excess Plan (in each case, or any successor plan), but excluding the IMS Health Defined Contribution Executive Retirement Plan and those plans maintained for legacy employees of Quintiles Transnational Holdings Inc., (ii) the Executive shall be entitled to be reimbursed up to $50,000 per year in the aggregate for home security and financial and estate planning expenses, tax preparation services and executive physical exams, (iii) the Executive shall be entitled to use a Company-leased automobile and be reimbursed for operating expenses relating to such automobile, (iv) the Executive shall be entitled to use the Company’s aircraft for business use and for up to 150 hours per year of personal use, subject, in the case of personal use, to the business needs of the Company, and the Executive’s family may accompany the Executive on any such travel, and (v) the Executive and/or the Executive’s family, as the case may be, shall be eligible for participation in, and shall receive all benefits under, all of the Company’s welfare benefit plans, practices, policies and programs, including, but not limited to, its disability and health insurance plans and vacation/sick/personal days provided by the Company, which are made available generally to other senior executive officers of the Company (for the avoidance of doubt, such plans, practices, policies or programs shall not include any plan, practice, policy or program which provides benefits in the nature of severance or continuation pay), subject, in each case, to the terms and conditions of the applicable Company plan, practice, policy or program and subject, in the case of any reimbursement, to the Company’s policies and procedures now in force or as such policies and procedures may be modified with respect to all senior executive officers of the Company.
(e) Reimbursement of Business Expenses. The Company shall reimburse the Executive for all reasonable business expenses upon the presentation of statements of such expenses in accordance with the Company’s policies and procedures now in force or as such policies and procedures may be modified with respect to all senior executive officers of the Company.
(f) Section 280G. If all, or any portion, of the payments provided under this Agreement, either alone or together with other payments or benefits which the Executive receives or is entitled to receive from the Company or any of its Affiliates (as defined below), would constitute an “excess parachute payment” within the meaning of Section 280G of the Internal Revenue Code of 1986, as amended (the “Code”), then the Executive shall be entitled to receive (i) an amount limited so that no portion thereof shall fail to be tax deductible under Section 280G of the Code (the “Limited Amount”), or (ii) if the amount otherwise payable or to be provided to the Executive (without regard to clause (i)) reduced by the excise tax imposed by Section 4999 of the Code and all applicable federal, state and local employment and income taxes (all computed at the highest applicable marginal rate) is greater than the Limited Amount, the amount otherwise payable to the Executive. If it is determined that the Limited Amount will maximize the Executive’s after-tax proceeds, payments and benefits shall be reduced to equal the Limited Amount in the following order: (i) first, by reducing cash severance payments (if and to

-4-
the extent such severance payments are deemed to be “parachute payments” within the meaning of Section 280G of the Code), (ii) second, by reducing other payments and benefits to which Q&A 24(c) of Section 1.280G-1 of the Treasury Regulations does not apply, and (iii) finally, by reducing all remaining payments and benefits (in the case of clauses (ii) and (iii), starting with those payments and benefits for which the amount required to be taken into account under Section 280G of the Code is the greatest). All determinations made pursuant this Section 3(f) will be made at the Company’s expense by the independent public accounting firm most recently serving as the Company’s outside auditors or such other accounting or benefits consulting group or firm as the Company may designate.
4. Employment Period.
The Employment Period shall terminate on the third anniversary of the Effective Date,
provided that on the third anniversary of the Effective Date and on each one-year anniversary thereafter, the Employment Period shall automatically be extended for additional one-year periods unless either party provides the other party with notice of non-renewal at least sixty (60) days before any such anniversary (the anniversary date on which the Employment Period terminates shall be referred to herein as the “Scheduled Termination Date”). For greater clarity, a non-renewal notice given as contemplated in this Section 4 shall be a Notice of Termination (as defined below) of employment, effective on the Scheduled Termination Date, for all purposes of this Agreement, and if given by the Company shall give rise to an involuntary separation from service (within the meaning of Section 409A of the Code) on the Scheduled Termination Date. If such Notice of Termination is given by the Company (an “Expiration Termination”), the Executive shall be entitled to receive the payments as set forth in Section 6(a) below. If such Notice of Termination is given by the Executive, the Executive shall only be entitled to receive the payments set forth in Section 6(c) below.
Notwithstanding the foregoing, the Executive’s employment hereunder may be terminated during the Employment Period prior to the Scheduled Termination Date upon the earliest to occur of any one of the following events (at which time the Employment Period shall be terminated):
(a) Death. The Executive’s employment hereunder shall terminate upon his death.
(b) Disability. The Company shall be entitled to terminate the Executive’s employment hereunder for “Disability” if, as a result of the Executive’s incapacity due to physical or mental illness or disability, the Executive shall have been unable to perform his duties hereunder for a period of six (6) consecutive months, and within thirty (30) days after written Notice of Termination is thereafter given the Executive shall not have returned to the full-time performance of his duties hereunder.
(c) Cause. The Company may terminate the Executive’s employment hereunder for Cause. For purposes of this Agreement, the term “Cause” shall mean: (i) a material breach by the Executive of this Agreement or any agreement governing the terms of any equity or equity incentive award granted to the Executive, (ii) a material breach by the Executive of any written policy of the Company or any of its Affiliates that is damaging to the financial condition or reputation of the Company or its Affiliates, (iii) the willful failure by the Executive to reasonably

-5-
and substantially perform his duties to the Company or any of its Affiliates, which failure is materially damaging to the financial condition or reputation of the Company or such Affiliate, (iv) the Executive’s willful misconduct or gross negligence which is injurious to the Company or any of its Affiliates, or (v) the commission by the Executive of a felony or other serious crime involving moral turpitude. In the case of clauses (i) and (ii) above, the Company shall permit the Executive up to fifteen (15) days to cure such breach or failure if reasonably susceptible to cure. If, subsequent to the Executive’s termination of employment for other than Cause, it is determined that the Executive’s employment could have been terminated for Cause, the Executive’s employment shall be deemed to have been terminated for Cause retroactively to the date the events giving rise to such Cause occurred. For purposes of this Agreement, “Affiliates” means all persons and entities directly or indirectly controlling, controlled by or under common control with respect to a specified person or entity, where control shall mean the possession, direct or indirect, of the power to direct or cause the direction of the management and policies of such person or entity, whether through the ownership of voting securities, by contract or otherwise.
(d) Without Cause. The Company may terminate the Executive’s employment hereunder during the Employment Period without Cause by giving a Notice of Termination (as defined in Section 5 below).
(e) Voluntarily. The Executive may voluntarily terminate his employment hereunder, without Good Reason, including as a result of Retirement, provided that the Executive provides the Company with notice of his intent to terminate his employment at least thirty (30) days, or, in the case of Retirement, at least one hundred and twenty (120) days, in advance of the Date of Termination (as defined in Section 5 below) in accordance with Section 5(a) below.
(f) For Good Reason. The Executive may terminate his employment hereunder for Good Reason, provided the Executive complies with all requirements of such a termination as provided hereunder and in Section 5 below. For purposes of this Agreement, “Good Reason” shall mean any of the following events or conditions occurring without the Executive’s express prior written consent, provided that the Executive shall have given written notice of such event or condition within a period not to exceed twenty (20) days of the Executive’s initial knowledge of the first existence of such event or condition, the Company shall not have remedied such event or condition within thirty (30) days after receipt of such notice and the Executive shall have actually terminated his employment within thirty (30) days thereafter: (i) a materially adverse alteration in the nature or status of the Executive’s title, duties, responsibilities (including reporting responsibilities) or the conditions of employment, provided, that a failure to re-appoint the Executive as Chairman of the Board or the Executive’s failure to be re-elected to the Board by the Company’s shareholders shall not constitute Good Reason hereunder, (ii) a material reduction in the Executive’s annual base salary or target annual bonus opportunity, (iii) a change of thirty-five (35) miles or more in the Executive’s principal place of employment, except for required travel on business to an extent substantially consistent with the Executive’s business travel obligations, (iv) the failure by the Company to pay to the Executive any material portion of the Executive’s compensation due hereunder, or (v) a material breach by the Company of this Agreement.

-6-
5. Termination Procedure.
(a) Notice of Termination. Any termination of the Executive’s employment by the Company or by the Executive during or upon the expiration of the Employment Period (other than a termination on account of the death of Executive) shall be communicated by written “Notice of Termination” to the other party hereto in accordance with Section 10(b) of this Agreement.
(b) Date of Termination. For purposes of this Agreement, “Date of Termination” shall mean (i) if the Executive’s employment is terminated by his death, the date of his death, (ii) if the Executive’s employment is terminated pursuant to Section 4(c) of this Agreement, on the date the Executive receives Notice of Termination from the Company, (iii) if the Executive voluntarily terminates his employment without Good Reason, the date specified in the notice given pursuant to Section 4(e) herein, which shall not be less than thirty (30) days after the Notice of Termination (or one hundred and twenty (120) days thereafter, in the case of Retirement), (iv) if the Executive terminates his employment for Good Reason, the date specified in the notice given by the Executive of the event constituting Good Reason, which shall comply with the time periods and procedural requirements provided in Section 4(f) of this Agreement, and (v) if the Executive’s employment is terminated for any other reason, the date on which a Notice of Termination is given or any later date (within thirty (30) days, or any alternative time period agreed upon by the parties, after the giving of such notice) set forth in such Notice of Termination, including the Scheduled Termination Date, as applicable.
6. Termination Payments.
(a) Without Cause, For Good Reason or an Expiration Termination. In the event the Employment Period terminates under this Agreement as a result of any of (x) the Company terminating the Executive’s employment without Cause, (y) the Executive terminating his employment for Good Reason, or (z) an Expiration Termination, the Company shall pay the Executive (A) within thirty (30) days following the Date of Termination, the Executive’s accrued but unpaid Base Salary through the Date of Termination; the Annual Bonus earned for the year prior to the Date of Termination if the Date of Termination occurs after year end but before the Annual Bonus is paid; unreimbursed expenses due under Section 3(e) of this Agreement; and vested rights under compensation and/or benefits plans (all to the extent not theretofore paid) (collectively, the “Accrued Benefits”) and (B) two (2) times the sum of Executive’s Base Salary and target Annual Bonus, payable in equal installments over a twenty four (24)-month period in accordance with the Company’s standard payroll practices, payable as provided in Section 6(e) below. In addition, (I) any equity or equity-based awards (or portions thereof) that are granted to the Executive after the Effective Date that are subject solely to time-based vesting conditions (collectively, the “Time Awards”), to the extent then unvested, shall vest in full as of the Date of Termination and, if applicable, shall remain exercisable until the latest date on which such awards may be exercised under the applicable Equity Agreements, determined without regard to the Executive’s termination of employment, and (II) any equity or equity-based awards (or portions thereof) that are granted to the Executive after the Effective Date that are subject to performance-based vesting conditions (the “Performance Awards”), to the extent then unvested, shall be eligible to vest following the end of the applicable performance period based on actual performance. The payments and benefits provided under this Section 6(a) (other than clause

-7-
6(a)(A)), including any accelerated vesting as provided herein, are subject to and conditioned upon the (i) Executive executing a timely and valid general release and waiver (in substantially the form set forth in Exhibit A) (the “Release”), waiving all claims the Executive may have against the Company its successors, assigns, Affiliates, executives, officers and directors, (ii) the Executive delivering the executed Release to the Company within the time period specified by the Company following the Date of Termination, (iii) such Release and the waiver contained therein becoming effective in accordance with their respective terms, and (iv) the Executive’s compliance with Section 9 of this Agreement (the conditions described in (i), (ii), (iii) and (iv), the “Termination Conditions”). For the avoidance of doubt, upon a termination of the Employment Period without Cause, as a result of Good Reason, or due to an Expiration Termination, the Executive shall not be entitled to any other compensation or benefits not expressly provided for in this Section 6(a), regardless of the time that would otherwise remain in the Employment Period had the Employment Period not been so terminated. Except as provided in this Section 6(a), and except for any vested benefits under any tax qualified pension plans of the Company, any rights under the Equity Agreements, and continuation of health insurance benefits on the terms and to the extent required by Section 4980B of the Code, and Section 601 of the Employee Retirement Income Security Act of 1974, as amended (which provisions are commonly known as “COBRA”), or such other similar law or regulation as may be applicable to the Executive or the Company with respect to the Executive, the Company shall have no additional obligations under this Agreement.
(b) Change in Control. In the event the Employment Period terminates under this Agreement under circumstances described in Section 6(a) above except that such termination occurs within twenty-four (24) months following a transaction or event constituting a “change in control event” of the Company under Section 409A of the Code, the Company shall provide the Executive with all payments and benefits described in Section 6(a) above except that the amounts payable under clause (B) of the first sentence of Section 6(a) shall be payable in a lump sum following such termination at the time provided in Section 6(e) below rather than over a twenty four (24)-month period, and the Time Awards and the Performance Awards, to the extent then unvested, shall vest in full upon such termination, with the Performance Awards vesting based on a deemed achievement of target performance, and, if applicable, the Time Awards remaining exercisable until the latest date on which such awards may be exercised under the applicable Equity Agreements, determined without regard to the Executive’s termination of employment.
(c) Cause or Voluntarily Other than for Good Reason (including Retirement). If the Executive’s employment is terminated during the Employment Period by the Company for Cause or voluntarily by the Executive other than for Good Reason, the Company shall pay the Executive within thirty (30) days following the Date of Termination the Accrued Benefits. If the Executive terminates his employment due to his Retirement, subject to compliance by the Executive with the Termination Conditions and the other conditions set forth in this subsection (c) and subject to the requirements of Section 409A of the Code, the Time Awards and Performance Awards, to the extent then unvested, shall remain outstanding, with the Time Awards continuing to vest on the schedule provided in the applicable Equity Agreement as if the Executive had remained employed on each applicable vesting date and, to the extent applicable, remaining exercisable until the latest date on which such awards may be exercised under the applicable Equity Agreement, determined without regard to the Executive’s termination of

-8-
employment, and the Performance Awards shall be eligible to vest following the end of the applicable performance period based on actual performance; provided, that, without limiting the Company’s rights under Section 9 of this Agreement, if during the period of time following the Date of Termination due to his Retirement and before the next vesting dates after the Date of Termination due to his Retirement for each of the Time Awards and the Performance Awards, the Executive is appointed or accepts a position as the chief executive officer (or other position having similar duties and responsibilities) of a publicly-traded company (“Public Company CEO”), unless the Board determines to allow for continued vesting of the Time Awards and the Performance Awards, (I) the Time Awards that remain unvested at that time shall vest as to a prorated number of the shares subject to the portion of each such Time Award that would vest on the next regularly scheduled vesting date following the Date of Termination due to his Retirement, prorated to reflect the number of whole months the Executive was employed following the most recent vesting date prior to the Date of Termination (or the date of grant, if there has not been a vesting date) over the number of whole months from the most recent vesting date prior to the Date of Termination (or the date of grant, if there has not been a vesting date) until the next regularly scheduled vesting date of such Time Award and, if applicable, shall remain exercisable until the latest date on which such awards may be exercised under the applicable Equity Agreements, determined without regard to the Executive’s termination of employment, and (II) the Performance Awards, that remain unvested at that time shall be eligible to vest following the end of the applicable performance period based on actual performance, with the number of shares subject to such awards that vest based on performance pro rated to reflect the number of whole months the Executive was employed during the applicable performance period over the number of whole months in the applicable performance period. The Executive agrees to notify the Company promptly if the Executive is appointed to or accepts a position as a Public Company CEO. Except as provided in this Section 6(c), and except for any vested benefits under any tax qualified pension plans of the Company, any rights under the Equity Agreements, and continuation of health insurance benefits on the terms and to the extent required by COBRA, or such other similar law or regulation as may be applicable to the Executive or the Company with respect to the Executive, the Company shall have no additional obligations under this Agreement. For purposes of this Agreement, “Retirement” shall mean a permanent retirement from active employment with the Company (other than at a time when Cause exists) after attaining age sixty-two (62) with at least five (5) years of employment with the Company or its subsidiaries.
(d) Disability or Death. If the Executive’s employment is terminated during the Employment Period as a result of the Executive’s death or by the Company due to his Disability, the Company shall pay the Executive or the Executive’s estate, as the case may be, within thirty (30) days following the Date of Termination, the Accrued Benefits. In addition, the Time Awards and Performance Awards, to the extent then unvested, shall vest in full upon such termination, with Performance Awards vesting based on a deemed achievement of target performance, and, if applicable, the Time Awards remaining exercisable until the latest date on which such awards may be exercised under the applicable Equity Agreements, determined without regard to the Executive’s termination of employment, subject, in the case of a termination by the Company due to the Executive’s Disability, to compliance by the Executive (or his guardian or authorized representative, in the case of the Release) with the Termination Conditions. Except as provided in this Section 6(d), and except for any vested benefits under any tax qualified pension plans of the Company, any rights under the Equity Agreements, and

-9-
continuation of health insurance benefits on the terms and to the extent required by COBRA, or such other similar law or regulation as may be applicable to the Executive or the Company with respect to the Executive, the Company shall have no additional obligations under this Agreement.
(e) Release. Subject to Section 7(a) of this Agreement, any cash severance payments due under Section 6(a) or 6(b) of this Agreement will be paid or provided, or will begin to be paid or provided, on the first payroll date following the date the Release becomes irrevocable (the “Release Date”), with all payments and benefits that would have otherwise been made prior to the Release Date paid or provided on such date. In the case of any equity or equity-based award that vests (or remains eligible to vest) pursuant to Section 6(a), 6(b), 6(c) or 6(d) of this Agreement, (i) if the award requires exercise, the portion of the award that vests pursuant to such Section shall not become exercisable until the Release Date; and (ii) if the award requires the delivery of cash or shares upon vesting, such cash or shares shall be delivered as soon as administratively practicable after the Release Date, but in no event later than (x) sixty (60) days following the Termination Date for any equity or equity-based award that is a Time Award and (y) for any Performance Award, as soon as reasonably practicable following the vesting date of such Performance Award, but in no event later than the March 15th of the year following the year in which the performance period ends, as set forth in the agreement evidencing such award (or any earlier date, after vesting, as may be required to avoid characterization as non-qualified deferred compensation under Section 409A of the Code, to the extent applicable), in each case, notwithstanding any contrary provision in the equity compensation plan under which such award was granted or in the agreement evidencing such award. Notwithstanding the foregoing and subject to Section 7(a) of this Agreement, to the extent required by Section 409A of the Code, if the Executive’s (or his guardian’s or authorized representative’s) period for considering the Release spans two (2) calendar years, then any payments or benefits that are subject to such release shall in all events be made in the second calendar year.
(f) Treatment of Equity. To the extent not specifically provided for herein, the vesting and exercisability of equity and equity-based awards (if any) held by the Executive at termination, and all other terms of such equity and equity-based awards (if any), shall be governed by the Equity Agreements.
7. Timing of Payments and Section 409A.
(a) Notwithstanding anything to the contrary in this Agreement, if at the time of the Executive’s termination of employment, the Executive is a “specified employee,” as defined below, any and all amounts payable under Section 6 above on account of such separation from service that would (but for this provision) be payable within six (6) months following the date of termination, shall instead be paid on the next business day following the expiration of such six (6) month period or, if earlier, the date of the Executive’s death; except (A) to the extent of amounts that do not constitute a deferral of compensation within the meaning of Treasury regulation Section 1.409A-1(b) (including without limitation by reason of the safe harbor set forth in Section 1.409A-1(b)(9)(iii), as determined by the Company in its reasonable good faith discretion); (B) benefits which qualify as excepted welfare benefits pursuant to Treasury regulation Section 1.409A-1(a)(5); or (C) other amounts or benefits that are not subject to the requirements of Section 409A of the Code.

-10-
(b) For purposes of this Agreement, all references to “termination of employment” and correlative phrases shall be construed to require a “separation from service” (as defined in Section 1.409A-1(h) of the Treasury regulations after giving effect to the presumptions contained therein), and the term “specified employee” means an individual determined by the Company to be a specified employee under Treasury regulation Section 1.409A-1(i).
(c) Each payment made under this Agreement shall be treated as a separate payment and the right to a series of installment payments under this Agreement is to be treated as a right to a series of separate payments.
(d) Any reimbursements under this Agreement that would constitute nonqualified deferred compensation subject to Section 409A of the Code shall be subject to the following additional rules: (i) no reimbursement of any such expense shall affect the Executive’s right to reimbursement of any such expense in any other taxable year; (ii) reimbursement of the expense shall be made, if at all, promptly, but not later than the end of the calendar year following the calendar year in which the expense was incurred; and (iii) the right to reimbursement shall not be subject to liquidation or exchange for any other benefit.
8. Legal Fees; Indemnification; Officers’ Liability Insurance.
(a) In the event of any contest or dispute between the Company and the Executive with respect to this Agreement or the Executive’s employment hereunder, each of the parties shall be responsible for its respective legal fees and expenses.
(b) The Executive shall be indemnified for all acts and omissions to act to the maximum extent permitted under the Company’s charter, by-laws and under applicable law. During the Employment Period and for six (6) years thereafter, the Executive shall be entitled to the same officers’ and directors’ liability insurance coverage that the Company provides generally to its other members of the Board (and if none, then to its officers), as may be amended from time to time for such directors and officers.
9. Non-Competition and Non-Disclosure; Executive Cooperation; Non-Disparagement.
(a) Non-Competition. Without the consent in writing of the Board, the Executive will not, at any time during the Employment Period and for the two years following the Employment Period, acting alone or in conjunction with others, directly or indirectly (i) engage (either as owner, investor, partner, stockholder, employer, employee, consultant, advisor, or director) in any business in which he has been directly engaged on behalf of the Company or any Affiliate, or has supervised as an executive thereof, during the last two years prior to such termination, or which was engaged in or planned by the Company or an Affiliate at the time of such termination, in any geographic area in which such business was conducted or planned to be conducted; (ii) induce, or attempt to induce, any customers of the Company or any of its Affiliates with whom the Executive has had contacts or relationships, directly or indirectly, during and within the scope of his employment with the Company or any of its Affiliates, to curtail or cancel their business with the Company or any such Affiliate; (iii) induce, or attempt to influence, any employee of the Company or any of its Affiliates to terminate employment; or (iv)

-11-
solicit, hire or retain as an employee or independent contractor, or assist any third party in the solicitation, hire, or retention as an employee or independent contractor, any person who during the previous 12 months was an employee of the Company or any Affiliate. The provisions of subparagraphs (i), (ii), (iii), and (iv) above are separate and distinct commitments independent of each of the other subparagraphs. It is agreed that the ownership of not more than one percent (1%) of the equity securities of any company having securities listed on an exchange or regularly traded in the over-the-counter market shall not, of itself, be deemed inconsistent with clause (i) of this Section 9(a).
(b) Non-Disclosure. The Executive shall not, at any time during the Employment Period and thereafter (including following the Executive’s termination of employment for any reason), disclose, use, transfer, or sell, except in the course of employment with or other service to the Company, any proprietary information, secrets, organizational or employee information, or other confidential information belonging or relating to the Company, any of its Affiliates or customers so long as such information has not otherwise been disclosed or is not otherwise in the public domain, except as required by law or pursuant to legal process. In addition, upon termination of employment for any reason, the Executive will return to the Company or its Affiliates all documents and other media containing information belonging or relating to the Company or its Affiliates; provided, however, that the Executive may keep a copy of his contacts and/or rolodex and any compensatory or other agreements that are personal to the Executive. Notwithstanding the foregoing or anything else to the contrary, (a) nothing contained in this Agreement or any other agreement containing confidentiality provisions or other restrictive covenants in favor of the Company or any of its Affiliates shall be construed to limit, restrict or in any other way affect the Executive’s communicating with any governmental agency or entity, or communicating with any official or staff person of a governmental agency or entity, concerning matters relevant to the governmental agency or entity and (b) the Executive will not be held criminally or civilly liable under any federal or state trade secret law for disclosing a trade secret (i) in confidence to a federal, state, or local government official, either directly or indirectly, or to an attorney, solely for the purpose of reporting or investigating a suspected violation of law, or (ii) in a complaint or other document filed under seal in a lawsuit or other proceeding; provided that notwithstanding this immunity from liability, Executive may be held liable if Executive unlawfully accesses trade secrets by unauthorized means.
(c) Ownership of Work. The Executive will promptly disclose in writing to the Company all inventions, discoveries, developments, improvements and innovations (collectively referred to as “Inventions”) that the Executive has conceived or made during the Employment Period; provided, however, that in this context “Inventions” are limited to those which (i) relate in any manner to the existing or contemplated business or research activities of the Company or its Affiliates; (ii) are suggested by or result from the Executive’s work at the Company or its Affiliates (including any predecessors); or (iii) result from the use of the time, materials or facilities of the Company or its Affiliates. All Inventions will be the Company’s property rather than the Executive’s. Should the Company request it, the Executive agrees to sign any document that the Company may reasonably require to establish ownership in any Invention.
(d) Cooperation With Regard to Litigation. The Executive agrees to cooperate with the Company, during the Employment Period and thereafter (including following the Executive’s termination of employment for any reason), by making himself available to testify on behalf of

-12-
the Company or any subsidiary or Affiliate of the Company, in any action, suit, or proceeding, whether civil, criminal, administrative, or investigative, and to assist the Company, or any subsidiary or Affiliate of the Company, in any such action, suit, or proceeding, by providing information and meeting and consulting with the Board or its representatives or counsel, or representatives or counsel to the Company, or any subsidiary or Affiliate of the Company, as may be reasonably requested and after taking into account the Executive’s post-termination responsibilities and obligations. The Company agrees to reimburse the Executive, on an after-tax basis each calendar quarter, for all expenses actually incurred in connection with his provision of testimony or assistance in accordance with the provisions of Section 7(d) of this Agreement but not later than the last day of the year in which the expense was incurred.
(e) Non-Disparagement. Subject to last sentence of Section 9(b) of this Agreement, the Executive shall not, at any time during the Employment Period and thereafter, make statements or representations, or otherwise communicate, directly or indirectly, in writing, orally, or otherwise, or take any action which may, directly or indirectly, disparage or be damaging to the Company or its subsidiaries or Affiliates, officers, directors, employees, advisors, businesses or reputations, nor shall any member of the Board, any officer of the Company, or the Senior Vice President of Human Resources of the Company make any such statements or representations regarding the Executive. Notwithstanding the foregoing, nothing in this Agreement shall preclude the Executive or the Company from making truthful statements that are required by applicable law, regulation or legal process. The Company agrees that the Executive, in addition to any other remedies available to him, shall be entitled to apply for preliminary and permanent injunctive relief against any breach of the covenant contained in this subsection (e), without having to post bond.
(f) Enforcement of Covenants. The Executive acknowledges that he has carefully read and considered all the terms and conditions of this Agreement, including the restraints imposed upon him pursuant to this Section 9. The Executive agrees without reservation that each of the restraints contained herein is necessary for the reasonable and proper protection of the goodwill, confidential information and other legitimate interests of the Company and its Affiliates; that each and every one of those restraints is reasonable in respect to subject matter, length of time and geographic area; and that these restraints, individually or in the aggregate, will not prevent him from obtaining other suitable employment during the period in which the Executive is bound by these restraints. The Executive further agrees that he will never assert, or permit to be asserted on his behalf, in any forum, any position contrary to the foregoing. The Executive further acknowledges that, were he to breach any of the covenants contained in this Section 9, the damage to the Company would be irreparable. The Executive therefore agrees that the Company, in addition to any other remedies available to it, shall be entitled to apply for preliminary and permanent injunctive relief against any breach or threatened breach by the Executive of any of said covenants, without having to post bond. The parties further agree that, in the event that any provision of this Section 9 shall be determined by any court of competent jurisdiction to be unenforceable by reason of its being extended over too great a time, too large a geographic area or too great a range of activities, such provision shall be deemed to be modified to permit its enforcement to the maximum extent permitted by law. The Executive agrees that the period set forth in Section 9(a) above shall be tolled, and shall not run, during any period of time in which the Executive is in violation of the terms thereof, in order that the Company and its Affiliates shall have all of the agreed upon temporal protection recited herein. No breach of any

-13-
provision of this Agreement by the Company, or any other claimed breach of contract or violation of law, or change in the nature or scope of the Executive’s employment relationship with the Company, shall operate to extinguish the Executive’s obligation to comply with this Section 9.
10. Miscellaneous.
(a) Survival. The provisions of Section 6, Section 8(b), Section 9 and such provisions of this Section 10 as apply to give effect to such other surviving provisions shall survive the termination of the Employment Period and any termination or expiration of this Agreement.
(b) Any notice or other communication required or permitted under this Agreement shall be effective only if it is in writing and shall be deemed to be given when delivered personally or four days after it is mailed by registered or certified mail, postage prepaid, return receipt requested or one day after it is sent by a reputable overnight courier service and, in each case, addressed as follows (or if it is sent through any other method agreed upon by the parties):
If to the Company:
IQVIA Holdings Inc.83 Wooster Heights RoadDanbury, CT 06810Attn: General Counsel
with a copy (which will not constitute notice) to:
Ropes & Gray LLPPrudential Tower, 800 Boylston StreetBoston, Massachusetts 02199Attention: Renata J. Ferrari, Esq.Email: [email protected]: 617-235-7690
If to the Executive:
Ari Bousbib
At his last residence address shown on the payroll records of the Company
with a copy (which will not constitute notice) to:
Arnold & Porter601 Massachusetts Avenue, NWWashington, DC 20001Attn: Joshua F. Alloy
-14-
Email: [email protected]: 202-942-5999
or to such other address as any party hereto may designate by notice to the others.
(c) This Agreement, as herein amended and restated on February 18, 2019, shall constitute the entire agreement among the parties hereto with respect to the Executive’s employment hereunder, and supersedes and is in full substitution for any and all prior understandings or agreements with respect to the Executive’s employment (it being understood that any equity and equity-based awards shall be governed by the relevant Equity Agreements), including, without limitation, the Employment Agreement by and among IMS Health Incorporated, Healthcare Technology Holdings Inc. and the Executive dated August 16, 2010 and the Amended and Restated Employment Agreement by and among IMS Health Holdings Inc., IMS Health Incorporated and the Executive dated as of February 12, 2014.
(d) This Agreement may be amended only by an instrument in writing signed by the parties hereto, and any provision hereof may be waived only by an instrument in writing signed by the party or parties against whom or which enforcement of such waiver is sought. The failure of any party hereto at any time to require the performance by any other party hereto of any provision hereof shall in no way affect the full right to require such performance at any time thereafter, nor shall the waiver by any party hereto of a breach of any provision hereof be taken or held to be a waiver of any succeeding breach of such provision or a waiver of the provision itself or a waiver of any other provision of this Agreement.
(e) The parties hereto acknowledge and agree that each party has reviewed and negotiated the terms and provisions of this Agreement and has had the opportunity to contribute to its revision. Accordingly, the rule of construction to the effect that ambiguities are resolved against the drafting party shall not be employed in the interpretation of this Agreement. Rather, the terms of this Agreement shall be construed fairly as to both parties hereto and not in favor or against either party.
(f) The parties hereto hereby represent that they each have the authority to enter into this Agreement, and the Executive hereby represents to the Company that the execution of, and performance of duties under, this Agreement shall not constitute a breach of or otherwise violate any other agreement to which the Executive is a party. The Executive hereby further represents to the Company that he will not utilize or disclose any confidential information obtained by the Executive in connection with any former employment with respect to his duties and responsibilities hereunder.
(g) This Agreement is binding on and is for the benefit of the parties hereto and their respective successors, assigns, heirs, executors, administrators and other legal representatives. Neither this Agreement nor any right or obligation hereunder may be assigned by the Executive.
(h) The Company shall require any successor (whether direct or indirect, by purchase, merger, consolidation or otherwise) to all or substantially all of the business and/or assets of the Company to assume this Agreement in the same manner and to the same extent that the Company would have been required to perform it if no such succession had taken place. As used

-15-
in the Agreement, “the Company” shall mean both the Company as defined above and any such successor that assumes this Agreement, by operation of law or otherwise.
(i) Any provision of this Agreement (or portion thereof) which is deemed invalid, illegal or unenforceable in any jurisdiction shall, as to that jurisdiction and subject to this Section, be ineffective to the extent of such invalidity, illegality or unenforceability, without affecting in any way the remaining provisions thereof in such jurisdiction or rendering that or any other provisions of this Agreement invalid, illegal, or unenforceable in any other jurisdiction. If any covenant should be deemed invalid, illegal or unenforceable because its scope is considered excessive, such covenant shall be modified so that the scope of the covenant is reduced only to the minimum extent necessary to render the modified covenant valid, legal and enforceable.
(j) The Company may withhold from any amounts payable to the Executive hereunder all federal, state, city or other taxes that the Company may reasonably determine are required to be withheld pursuant to any applicable law or regulation, (it being understood, that the Executive shall be responsible for payment of all taxes in respect of the payments and benefits provided herein).
(k) This Agreement shall be governed by and construed in accordance with the laws of the State of New Jersey without reference to its principles of conflicts of law.
(l) This Agreement may be executed in several counterparts, each of which shall be deemed an original, but all of which shall constitute one and the same instrument. An electronic or facsimile of a signature shall be deemed to be and have the effect of an original signature.
(m) The headings in this Agreement are inserted for convenience of reference only and shall not be a part of or control or affect the meaning of any provision hereof.
[Remainder of Page Intentionally Left Blank]
* * * * *
-16-
IN WITNESS WHEREOF, the parties have executed this Agreement as of the date first written above.
ARI BOUSBIB
/s/ Ari Bousbib Name: Ari Bousbib
IQVIA HOLDINGS INC.
/s/ Eric Sherbet Name: Eric SherbetTitle: Exec. Vice President and General Counsel
[Signature Page to Ari Bousbib Employment Agreement]

EXHIBIT A
Form of Release
We advise you to consult an attorney before you sign this Release. You have until the date which is seven (7) days after the Release is signed and returned to IQVIA Holdings Inc. to change your mind and revoke your Release. Your Release shall not become effective or enforceable until after that date.
In consideration for the payments and benefits provided under Section 6 of your Amended and Restated Employment Agreement with IQVIA Holdings Inc. dated as of February 18, 2019 and effective as of July 26, 2018 (the “Agreement”), in connection with the termination of your employment (such payments and benefits collectively, the “Separation Payments”), by your signature below, you, for yourself and on behalf of your heirs, executors, agents, representatives, successors and assigns, hereby release and forever discharge IQVIA Holdings Inc. and its past and present parent corporations, subsidiaries, divisions, subdivisions, affiliates and related companies (collectively, the “Company”) and the Company’s past, present and future agents, directors, officers, employees, representatives, assigns, stockholders, attorneys, insurers, employee benefit programs (and the trustees, administrators, fiduciaries and insurers of such programs), and any other persons acting by, through, under or in concert with any of the persons or entities listed herein, and their successors (hereinafter “those associated with the Company”), with respect to any and all claims, demands, actions and liabilities, whether in law or equity, which you may have against the Company or those associated with the Company of whatever kind, including, but not limited to, those arising out of your employment with the Company or the termination of that employment, except as otherwise expressly set forth below. You agree that this Release covers, but is not limited to, claims arising under the Age Discrimination in Employment Act of 1967, 29 U.S.C. § 621 et seq., Title VII of the Civil Rights Act of 1964, 42 U.S.C. § 2000e et seq., the Americans with Disabilities Act of 1990, 42 U.S.C. § 12101 et seq., the Fair Labor Standards Act, 29 U.S.C. § 201 et seq., the Employee Retirement Income Security Act of 1974, 29 U.S.C. § 1001 et seq., the Family and Medical Leave Act of 1993 and any local, state or federal law, regulation or order providing workers’ compensation benefits, restricting an employer’s right to terminate employees or otherwise regulating employment, enforcing express or implied employment contracts or requiring an employer to deal with employees fairly or in good faith, or dealing with discrimination in employment on the basis of sex, race, color, national origin, veteran status, marital status, religion, disability, handicap, or age. You also agree that this Release includes claims based on wrongful termination of employment, breach of contract (express or implied), tort, or claims otherwise related to your employment or termination of employment with the Company and any claim for attorneys’ fees, expenses or costs of litigation. For the avoidance of doubt, as it relates to the Company’s agents, directors, officers, employees, representatives, assigns, stockholders, attorneys and insurers, this Release does not include a release of claims, demands, actions and liabilities that are not related in any way to your relationship with the Company (whether as an employee, officer or director), the termination of that relationship or your equity ownership in the Company.
This Release covers all claims based on any facts or events, whether known or unknown by you, that occurred on or before the date of this Release. You expressly waive all rights you might have under any law that is intended to protect you from waiving unknown claims and by your

-2-
signature below indicate your understanding of the significance of doing so. Examples of released claims include, but are not limited to: (a) claims that in any way relate to your employment with the Company, or the termination of that employment, such as claims for compensation, bonuses, commissions, equity awards, lost wages, or unused accrued vacation or sick pay (other than the Separation Payments); (b) claims that in any way relate to the design or administration of any employee benefit program; (c) claims that you have irrevocable or vested rights to severance or similar benefits (other than the Separation Payments) or to post-employment health or group insurance benefits; (d) any claim, such as a benefit claim, that was explicitly or implicitly denied before you signed this Release; (e) any claim you might have for extra benefits as a consequence of payments you receive because of signing this Release; or (f) any claim to attorneys’ fees or other indemnities. Except to enforce this Release, you agree that you will never commence, prosecute, or cause to be commenced or prosecuted any lawsuit or proceeding of any kind against the Company, or those associated with the Company related to the claims released in this Agreement, in any forum and agree to withdraw with prejudice all such complaints or charges, if any, that you have filed against the Company or those associated with the Company. Notwithstanding the generality of the foregoing, nothing herein is intended to or shall preclude you or anyone on your behalf from filing a complaint and/or charge with the Equal Employment Opportunity Commission or any similar state or local government agency and/or filing a related lawsuit and/or cooperating with said agency in any investigation or other proceeding. Nonetheless, you acknowledge that you shall not be entitled to receive any personal relief, recovery, or monies in connection with any such complaint, charge or related lawsuit brought against the Company or any of those associated with the Company, without regard as to who brought said complaint or charge.
Anything in this Release to the contrary notwithstanding, this Release does not include a release of: (i) any rights you may have to indemnification and recovery of officers and directors liability insurance proceeds under any agreement (including, without limitation, the Employment Agreement), law, Company organizational document or policy, or otherwise; (ii) any rights you may have to equity, compensation or benefits under the Company’s equity, compensation or benefit plans that were accrued and unpaid prior to the date hereof and payable hereafter, except as otherwise provided in your Agreement or claims specifically identified in this Release; (iii) any rights or claims under the Age Discrimination in Employment Act or any other law, in each case, that arise after you sign this Release; (iv) your right to enforce this Release or any of the foregoing items described in this paragraph; or (v) your rights and obligations as a shareholder of the Company.
By signing this Release, you further agree as follows:
i. You have read this Release carefully and fully understand its terms;
ii. You have had at least twenty-one (21) days (or at least forty-five (45) days if so indicated by the Company) to consider the terms of the Release;
iii. You have seven (7) days from the date you sign this Release to revoke it by written notification to the Company. After this seven (7)-day period, this Release is final and binding and may not be revoked;

-3-
iv. You have been advised to seek legal counsel and have had an opportunity to do so;
v. You would not otherwise be entitled to the benefits provided under your Agreement had you not agreed to execute this Release; and
vi. Your agreement to the terms set forth above is voluntary.

-4-
By my signature below I acknowledge and agree to the terms of this Release as of the date indicated below.
Ari Bousbib
____________________
Date: _______________
[Signature Page to Ari Bousbib Release Agreement]

Exhibit 10.72
Name: Eric Sherbet
∗ Date of offer: January 23, 2018
∗ Your start date: March 1, 2018
∗ Position Title / Level: EVP & General Counsel
∗ Department: US20300076 Legal
∗ Location: Parsippany, NJ
∗ Manager / Title: Ari Bousbib
∗ FT / PT Status: Full Time
∗ Base Salary: $490,000 (annualized). Pay is semi-monthly
∗ Annual Incentive Target: 75% of your base salary. Your manager will communicate performance parameters at a later date. Incentive payout is not guaranteed and is prorated based on start date and time worked. Your start date must occur on or before September 30 to be eligible to participate in an incentive plan for the year.
∗ Time off during calendar year of 2018
Vacation Days: Discretionary Time-offCompany Holidays: 10 days
∗ Relocation Allowance: You will granted a one-time relocation allowance of $25,000 to be paid in a lump sum as soon as practicable after actual start date, and in accordance with the terms below. In return for IQVIA providing you with this relocation allowance, you agree that the relocation allowance shall be in the form of an advance to you, and will constitute a debt payable to IQVIA. Twelve (12) months from the pay date of this relocation allowance, IOVIA will forgive the entire relocation amount unless you have voluntarily left the employ of IQVIA prior to the end of that twelve-month period. In the event you voluntarily leave the employment of IQVIA prior to the end of that twelve-month period, then you agree to repay to IQVIA the entire relocation allowance. Repayment of the relocation amount will be made within (10) business days from the date on which you cease to be an employee of IQVIA. You agree that IQVIA may deduct from your final paycheck any amount(s) due and owing to IQVIA for the relocation allowance.
∗ Relocation Package: Additionally, IQVIA will provide you a Relocation Package, if you relocate to the Parsippany, NJ area within 3 years of actual original start date. In return for IQVIA providing you with Relocation Package, you agree that the amounts received directly by you, or paid to others on your behalf in connection with the Relocation Package shall be in the form of an advance to you and will constitute a debt payable to IQVIA. Twelve (12) months from the final pay date of any amount under this Relocation Package, IQVIA will forgive the entire Relocation Package amount paid unless you have voluntarily left the employ of IQVIA prior to the end of that twelve-month period. In the event you voluntarily leave the employment of IQVIA prior to the end of that twelve-month period, then you agree to repay to IQVIA the entire Relocation Package amount. Repayment of the Relocation Package amount will be made within (10) business days from the date on which you cease to be an employee of IQVIA. You agree that IQVIA may deduct from your final paycheck any amount(s) due and owing to IQVIA for the Relocation Package amount.

Nothing contained in this offer letter is intended to supersede, or otherwise interfere with, policies of IQVIA in effect at the time this Agreement is signed.
∗ Long-Term Incentive: As a part of your new hire offer, you will be nominated for a long-term incentive award with a nominal value of $550,000 at a meeting of the Leadership Development and Compensation Committee (the “Committee”) of the Board of Directors of IQVIA Holdings Inc. Awards approved by the Committee will be subject to the various terms and conditions of the IQVIA Holdings Inc. 2017 Incentive and Stock Award Plan (the “Plan”) and your grant agreement, including provisions regarding vesting (based on time and Company performance), exercise and forfeiture.
The Company’s Long Term Incentive Plan provides eligible participants with the opportunity to receive equity awards consisting of a combination of Performance Shares,” which are earned based on Company performance, and “Stock Appreciation Rights” (SARs), which vest based on continued service with the Company.
Performance Shares are performance-based restricted stock units that are earned based on the Company’s financial results over a three-year period. Performance Shares are payable in IQVIA shares at the end of a three-year period, with a maximum payout of 200 percent of target. You must remain employed by the Company through the end of the performance period in order to receive payment from any earned Performance Shares.
SARs are issued with a grant price equal to the Fair Market Value, or closing price, of IQVIA stock as of the date of grant and vest one-third per annum beginning on the first anniversary of the date of grant. SARs expire ten years from grant. If you leave our employment for any reason other than death or disability you will forfeit any SARs that are unvested. You will have 90 days to exercise vested SARs.
You will be eligible to participate in future annual Long Term Incentive Plan cycles based on the Company’s discretion. All grants are subject to the discretion of the Committee and the rules of the Plan.
Your long-term incentive award is contingent upon proper execution of a Confidentiality and Restrictive Covenant Agreement (CRCA) and Work Product Assignment Agreement (WPAA) relating to the protection of IQVIA intellectual property, including confidentiality, ownership, noncompetition and non-solicitation. A copy of the CRCA and WPAA is attached for your review
This offer of employment with IQVIA™ is contingent upon (a) receipt of acceptable references and credential qualifications; (b) having no existing restrictions which would prohibit you from accepting this offer or, by working for IQVIA, would infringe the rights of others; (c) your signing and returning the attached Confidentiality & Policy Agreement as well as the Third Party Confidential Information Notice; and (d) receipt of proof of your eligibility to work in the United States as required by the Immigration Reform and Control Act of 1986. You will need to bring certain documents on your first day of employment (by law, no later than three business days from your start date). Please refer to the enclosed list of acceptable documents for Employment Eligibility Verification.
This offer letter shall not be construed as constituting a contract for employment, or otherwise set forth a length of employment. You are an employee at-will, which means that either you or IQVIA may end the employment relationship without cause or notice.
I accept the terms of this offer as stated and will start on:
/s/ Eric Sherbet March 1, 2018Sign to accept State date
Approved:
/s/ Trudy Stein
Name: Trudy Stein

Exhibit 21.1
IQVIA HOLDINGS INC.
SUBSIDIARIES OF THE REGISTRANT
SubsidiaryJurisdiction or
State of Organization159 SOLUTIONS, INC. California
159 Technology Solutions Private Ltd India
Advanced Health Media Services, Ltd. United Kingdom
AHM Global Operations Inc. The Philippines
AHM Global Services LLC New Jersey
AHM Logistics Inc. (Canada) Canada
AIECO IT Solutions India Private Ltd. India
Albatross Financial Solutions Limited United Kingdom
ALIMED Egeszsegugyi Szolgaltato Kft. Hungary
APPATURE, INC. Washington
Ardentia International Limited United Kingdom
Ascott Sales Integration Pty Ltd Australia
Asesorias IQVIA Solutions Chile Limitada Chile
Asserta Centroamerica Medicion de Mercados, S.A. Guatemala
Battaerd Mansley Pty. Ltd. Australia
Benefit Canada, Inc. Canada
Benefit Holding, Inc. North Carolina
BioFortis, Inc. Maryland
BUZZEOPDMA LLC Delaware
Cambridge Pharma Consultancy Limited United Kingdom
Cambridge Pharma Consultancy, Inc. Delaware
CDS - Center de Service SAS France
Cegedim Venezuela C.A. Venezuela
Cenduit (India) Services Private Company Limited India
Cenduit Limited Delaware
Cenduit LLC Delaware
Cenduit Mauritius Holdings Company Mauritius
Clinical Financial Services, LLC Pennsylvania
Clinical Lab Minority Shareholder Limited United Kingdom
Coordinated Management Holdings L.L.C. Delaware
COORDINATED MANAGEMENT SYSTEM, INC. Delaware
Coté Orphan Consulting UK Limited United Kingdom
Coté Orphan, LLC Maryland
CRM Health Korea Ltd. Korea
CSD Health Korea Ltd. Korea
DATA NICHE ASSOCIATES, INC. Illinois
Datadina Ecuador S.A. Ecuador
Dataline Software Limited United Kingdom

SubsidiaryJurisdiction or
State of OrganizationDatec Industria e Comercio, Distribudora Grafica e Mala Direta Ltda. Brazil
Dimensiions Healthcare LLC Abu Dhabi
Drug Dev Inc. Delaware
DrugDev Limited United Kingdom
EA Institute L.L.C. Delaware
ENTERPRISE ASSOCIATES, LLC Delaware
Epernicus, LLC Delaware
EPS Research Limited United Kingdom
EPS Software Limited United Kingdom
Forcea NV Belgium
Foresight Group International UK LTD United Kingdom
Foresight Group Japan G.K. Japan
Foresight IT Solutions Consulting India Private Limited India
Global Crown Investment Limited Hong Kong
GRACE DATA CORPORATION Nebraska
HIGHPOINT SOLUTIONS, LLC Pennsylvania
Highpoint Solutions, LLC Switzerland
Hospital Marketing Services Ltd. United Kingdom
Hotel Lot C-8B, LLC North Carolina
Iasist Holdco Limited United Kingdom
Iasist Potugal, Consultadoria na Área de Saúde, Unipessoal, Lda Portugal
Iasist SAU Agencia en Chile Chile
Iasist Sociedad Anonima Unipersonal Spain
iGuard, Inc. North Carolina
Impact RX, LLC South Africa
IMS HEALTH KOREA LTD Korea
IMS (GIBRALTAR) HOLDING LIMITED Gibraltar
IMS (UK) Pension Plan Trustee Company Limited United Kingdom
IMS AB Sweden
IMS CHINAMETRIK INC. Hong Kong
IMS Health (Australia) Partnership Australia
IMS Health Analytics Services Private Limited India
IMS Health Bangladesh Limited Bangladesh
IMS Health Bolivia S.R.L. Bolivia
IMS Health Cyprus LTD Cyprus
IMS Health de Venezuela C.A. Venezuela
IMS Health Egypt Limited Egypt
IMS HEALTH GROUP LIMITED United Kingdom
IMS Health Information Solutions Argentina S.A. Argentina
IMS Health Information Solutions Australia Pty. Ltd Australia
IMS Health Information Solutions India Private Ltd. India
IMS Health Information Solutions Japan K.K. Japan
IMS HEALTH KOREA LTD. Korea
IMS Health Lanka (Private) Limited Sri Lanka

SubsidiaryJurisdiction or
State of OrganizationIMS Health Networks Limited United Kingdom
IMS Health Pakistan (Private) Limited Pakistan
IMS Health Paraguay SRL Paraguay
IMS HEALTH PUERTO RICO INC. Puerto Rico
IMS Health Surveys Limited United Kingdom
IMS HEALTH TAIWAN LTD. Taiwan
IMS Health Technology Solutions (China) Co. Ltd. China
IMS Health Technology Solutions Australia Pty. Ltd Australia
IMS Health Technology Solutions Colombia Ltda. Colombia
IMS Health Technology Solutions Holdings AB Sweden
IMS Health Technology Solutions Hungary Ltd. Hungary
IMS Health Technology Solutions India Private Ltd. India
IMS Health Technology Solutions Japan K.K. Japan
IMS Health Technology Solutions Kazakhstan, LLC Kazakhstan
IMS Health Technology Solutions LLC Russia
IMS Health Technology Solutions Sweden AB Sweden
IMS Health Technology TUNISIA Tunisia
IMS Health Tunisia sarl Tunisia
IMS Health Uruguay S.A. Uruguay
IMS Holdings (U.K.) Limited United Kingdom
IMS Hospital Group Limited United Kingdom
IMS Information Solutions Medical Research Limited United Kingdom
IMS Information Solutions UK Ltd. United Kingdom
IMS International (Proprietary) Limited South Africa
IMS Market Research Consult (Beijing) China
IMS Meridian Limited Hong Kong
IMS Meridian Research Limited British Virgin Islands
IMS Republica Dominicana, S.A. Dominican Republic
IMS SOFTWARE SERVICES LTD. Delaware
IMS Technology Solutions UK Limited United Kingdom
Infocus Health Limited United Kingdom
Infopharm Ltd. United Kingdom
Innovex Holdings I LLC Delaware
Innovex Merger Corp. North Carolina
Innovex Saglik Hizmetleri Arastirma ve Danismanlik Ticaret Limited Sirketi Turkey
Innovex Saglik Urunleri Pazarlame ve Hizmet Danismanlik Anonim Sirketi Turkey
Institute of Medical Communications NCO Russia
INTERCONTINENTAL MEDICAL STATISTICS INTERNATIONAL, LTD. (DE) Delaware
Interstatistik AG Switzerland
IPP Informacion Promocional y Publicitaria S.A. de C.V. Mexico
IPP Technology Solutions Mexico SA de CV (FKA Cegedim Mexico SA de CV) Mexico
IQVA Romania S.R.L. Romania
IQVIA Medical Development (Dalian) Co., Ltd. China
IQVIA SOLUTIONS PHILIPPINES, INC. Philippines

SubsidiaryJurisdiction or
State of OrganizationIQVIA (Thialand) Co. Ltd. Thailand
IQVIA AB Sweden
IQVIA Adriatic d.o.o. za Konzalting Croatia
IQVIA AG Switzerland
IQVIA AG (Mexico Branch) Mexico
IQVIA AG (UK Branch) United Kingdom
IQVIA Asia Pacific Commercial Holdings LLC North Carolina
IQVIA Beteiligungs-gesellschaft mbH Germany
IQVIA BioSciences Holdings LLC Delaware
IQVIA CHINAMETRIK INC. Delaware
IQVIA Clinical AB Sweden
IQVIA Commercial Deutschland GmbH Germany
IQVIA COMMERCIAL FINANCE INC. Delaware
IQVIA Commercial GmbH & Co. OHG Germany
IQVIA Commercial I LLC Delaware
IQVIA COMMERCIAL INDIA HOLDINGS CORP. Delaware
IQVIA COMMERCIAL LICENSING ASSOCIATES LLC Delaware
IQVIA COMMERCIAL SERVICES LLC Delaware
IQVIA Commercial Software GmbH Germany
IQVIA Commercial Sp. z.o.o. Poland
IQVIA COMMERCIAL TRADING CORP. Delaware
IQVIA Commerical Consulting Sp. z.o.o. Poland
IQVIA Consulting and Information Services India Private Limited India
IQVIA Consulting Solutions bvba Belgium
IQVIA Finance Ireland Designated Activity Company Ireland
IQVIA GOVERNMENT SOLUTIONS INC. Delaware
IQVIA Healthcare QFC branch Qatar
IQVIA Hellas Technology Solutions S.A. Greece
IQVIA Holdings France SAS France
IQVIA IES (UK) Limited United Kingdom
IQVIA IES Brasil Ltda. Brazil
IQVIA IES Europe Limited United Kingdom
IQVIA IES European Holdings United Kingdom
IQVIA IES Italia S.r.l. Italy
IQVIA IES Overseas Holdings Limited United Kingdom
IQVIA IES OY Finland
IQVIA IES Portugal Unipressoal Ltda. Spain
IQVIA IES Portugal, Unipessoal Lda. Portugal
IQVIA IES Puerto Rico Inc. Puerto Rico
IQVIA II Technology Solutions Portugal, Unipessoal LDA Portugal
IQVIA INC. Delaware
IQVIA INFORMATION MEDICAL STATISTICS (ISRAEL) LTD. Israel
IQVIA Information Solutions (China) Co., Ltd. China
IQVIA Information Solutions GmbH Austria

SubsidiaryJurisdiction or
State of OrganizationIQVIA Information, S.A. Spain
IQVIA Informations Solutions France SAS France
IQVIA Istanbul Saglik Hizmetler Arastirma ve Danismanlik Limited Sirketi Turkey
IQVIA Korea Co. Ltd. Korea
IQVIA LTD United Kingdom
IQVIA Market Intelligence LLC North Carolina
IQVIA Marktforschung GmbH Austria
IQVIA Maroc SARL Morocco
IQVIA Mauritius Holdings, Inc. Mauritius
IQVIA Medical Communications & Consulting, Inc. North Carolina
IQVIA Medical Education Inc. New York
IQVIA Medical Radar AB Sweden
IQVIA Operations France SAS France
IQVIA Partners AS Denmark
IQVIA PHARMA Inc. North Carolina
IQVIA Pharma Services Corp. North Carolina
IQVIA Pharmaceutical Marketing Services Ltd. Slovenia
IQVIA Phase One Services LLC Kansas
IQVIA RDS (India) Private Limited India
IQVIA RDS (Pty.) Limited South Africa
IQVIA RDS AG Switzerland
IQVIA RDS and Integrated Services Belgium NV Belgium
IQVIA RDS Argentina S.A. Argentina
IQVIA RDS Asia Inc. North Carolina
IQVIA RDS Austria GmbH Austria
IQVIA RDS Brasil Ltda. Brazil
IQVIA RDS BT Inc. North Carolina
IQVIA RDS Bulgaria EOOD Bulgaria
IQVIA RDS Canada ULC Canada
IQVIA RDS Chile Chile
IQVIA RDS Colombia S.A.S. Colombia
IQVIA RDS Consulting Inc. North Carolina
IQVIA RDS d.o.o. Beograd Serbia
IQVIA RDS East Asia Pte. Ltd. Singapore
IQVIA RDS Eastern Holdings GmbH Austria
IQVIA RDS ESTONIA OU Estonia
IQVIA RDS Finland OY Finland
IQVIA RDS France SAS (formerly, Quintiles Benefit France SNC) France
IQVIA RDS Funding LLC North Carolina
IQVIA RDS GesmbH Austria
IQVIA RDS GesmbH Greek Branch Greece
IQVIA RDS Guatemala S.A. Guatemala
IQVIA RDS Holdings United Kingdom
IQVIA RDS Hong Kong Limited Hong Kong

SubsidiaryJurisdiction or
State of OrganizationIQVIA RDS Inc. North Carolina
IQVIA RDS Ireland (Finance) Ltd. Ireland
IQVIA RDS Ireland Ltd. Ireland
IQVIA RDS ISRAEL LTD. Israel
IQVIA RDS Italy Srl Italy
IQVIA RDS Latin America LLC North Carolina
IQVIA RDS Latvia SIA Latvia
IQVIA RDS Magyarorszag Gyogyszerfejlesztesi es Tanacsado Kft. Hungary
IQVIA RDS Malaysia Sdn. Bhd. Malaysia
IQVIA RDS Moscow Russia
IQVIA RDS Novosibirsk Russia
IQVIA RDS Panama Inc. Panama
IQVIA RDS Peru S.r.l. Peru
IQVIA RDS Philippines Inc. Philippines
IQVIA RDS Poland Sp. Zoo Poland
IQVIA RDS Pty. Limited Australia
IQVIA RDS Slovakia s.r.o. Slovakia
IQVIA RDS Spain S.L. Spain
IQVIA RDS Spain, S.L., Representacao, Permanente em Portugal Portugal
IQVIA RDS St. Petersburg Russia
IQVIA RDS Support Sarl France
IQVIA RDS Switzerland sarl Switzerland
IQVIA RDS Taiwan Ltd. Taiwan
IQVIA RDS Transfer LLC Delaware
IQVIA RDS UAB Lithuania
IQVIA RDS UK Holdings Ltd. United Kingdom
IQVIA Services Japan K.K. Japan and Delaware
IQVIA Soluçoes de Tecnologia DO Brazil Ltda. Brazil
IQVIA Solutions do Brasil Ltda. Brazil
IQVIA Solutions (NZ) Limited New Zealand
IQVIA Solutions (Pty.) Ltd. South Africa
IQVIA Solutions a.s. Czech Republic
IQVIA Solutions Argentina S.A. Argentina
IQVIA SOLUTIONS ASIA PTE. LTD. Singapore
IQVIA Solutions Australia Holdings Pty. Ltd. Australia
IQVIA Solutions Australia Pty. Ltd. Australia
IQVIA Solutions B.V. Netherlands
IQVIA Solutions Belgium S.P.R.L. Belgium
IQVIA Solutions Bulgaria EOOD Bulgaria
IQVIA SOLUTIONS CANADA INC. Canada
IQVIA Solutions Colombia S.A. Colombia
IQVIA Solutions Consulting Myanmar Company Limited Myanmar
IQVIA Solutions del Peru S.A. Peru
IQVIA Solutions Denmark AS Denmark

SubsidiaryJurisdiction or
State of OrganizationIQVIA Solutions Enterprise Management Consulting (Shanghai) Co., Ltd. China
IQVIA Solutions Finance B.V. Netherlands
IQVIA Solutions Finance UK I Ltd. United Kingdom
IQVIA Solutions Finance UK II Ltd. United Kingdom
IQVIA Solutions Finance UK III Ltd. United Kingdom
IQVIA Solutions Finance UK V Ltd. United Kingdom
IQVIA Solutions Finland OY Finland
IQVIA Solutions Global Holdings UK Ltd. United Kingdom
IQVIA Solutions GmbH Switzerland
IQVIA Solutions Holdings (Pty.) Ltd. South Africa
IQVIA Solutions Hong Kong Limited Hong Kong
IQVIA Solutions HQ Ltd. United Kingdom
IQVIA Solutions Ireland Limited Ireland
IQVIA Solutions Italy W.r.l. Italy
IQVIA SOLUTIONS JAPAN K.K. Japan and Delaware
IQVIA Solutions Kazakhstan LLC Kazakhstan
IQVIA Solutions LLC Russia
IQVIA Solutions Malaysia Sdn. Bhd. Malaysia
IQVIA Solutions Norway AS Norway
IQVIA SOLUTIONS OPERATIONS CENTER PHLIPPINES INC. Philippines
IQVIA Solutions Pharmaceutical SRL Romania
IQVIA SOLUTIONS PHILIPINES, INC. Philippines
IQVIA Solutions Portugal, Lda. Portugal
IQVIA Solutions (Pty.) Ltd. South Africa
IQVIA Solutions Regional Pte. Ltd. Singapore
IQVIA Solutions s.r.o. Slovak Republic
IQVIA Solutions Services Ltd. Hungary
IQVIA Solutions Sweden AB Sweden
IQVIA Solutions UK Investments Ltd. United Kingdom
IQVIA Solutions UK Limited United Kingdom
IQVIA Staff Services Sp.A. Italy
IQVIA Technology and Services AG Switzerland
IQVIA Technology Services Ltd. United Kingdom
IQVIA Technology Solutions Egypt LLC Egypt
IQVIA Technology Solutions Finland OY Finland
IQVIA Technology Solutions Poland SP. z.o.o. Poland
IQVIA Technology Solutions Romania Srl Romania
IQVIA Technology Solutions s.r.o. Czech Republic
IQVIA Technology Solutions s.r.o. Slovak Republic
IQVIA Technology Solutions S.R.O. Branch Bulgaria Bulgaria
IQVIA Technology Solutions Ukraine LLC Ukraine
IQVIA Tibbi Istatistik Ticaret ve Musavirlik Ltd. Sirketi Turkey
IQVIA Trading Management Inc. Delaware
IQVIA TRANSPORTATION SERVICES CORP. Delaware
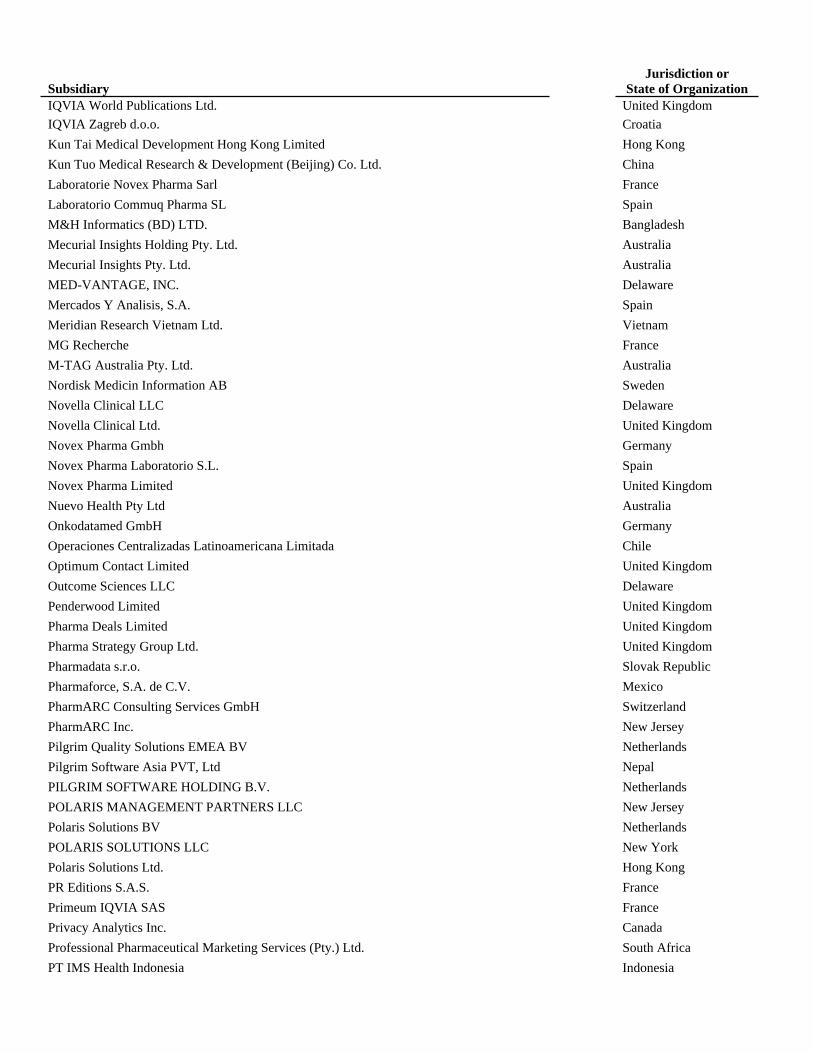
SubsidiaryJurisdiction or
State of OrganizationIQVIA World Publications Ltd. United Kingdom
IQVIA Zagreb d.o.o. Croatia
Kun Tai Medical Development Hong Kong Limited Hong Kong
Kun Tuo Medical Research & Development (Beijing) Co. Ltd. China
Laboratorie Novex Pharma Sarl France
Laboratorio Commuq Pharma SL Spain
M&H Informatics (BD) LTD. Bangladesh
Mecurial Insights Holding Pty. Ltd. Australia
Mecurial Insights Pty. Ltd. Australia
MED-VANTAGE, INC. Delaware
Mercados Y Analisis, S.A. Spain
Meridian Research Vietnam Ltd. Vietnam
MG Recherche France
M-TAG Australia Pty. Ltd. Australia
Nordisk Medicin Information AB Sweden
Novella Clinical LLC Delaware
Novella Clinical Ltd. United Kingdom
Novex Pharma Gmbh Germany
Novex Pharma Laboratorio S.L. Spain
Novex Pharma Limited United Kingdom
Nuevo Health Pty Ltd Australia
Onkodatamed GmbH Germany
Operaciones Centralizadas Latinoamericana Limitada Chile
Optimum Contact Limited United Kingdom
Outcome Sciences LLC Delaware
Penderwood Limited United Kingdom
Pharma Deals Limited United Kingdom
Pharma Strategy Group Ltd. United Kingdom
Pharmadata s.r.o. Slovak Republic
Pharmaforce, S.A. de C.V. Mexico
PharmARC Consulting Services GmbH Switzerland
PharmARC Inc. New Jersey
Pilgrim Quality Solutions EMEA BV Netherlands
Pilgrim Software Asia PVT, Ltd Nepal
PILGRIM SOFTWARE HOLDING B.V. Netherlands
POLARIS MANAGEMENT PARTNERS LLC New Jersey
Polaris Solutions BV Netherlands
POLARIS SOLUTIONS LLC New York
Polaris Solutions Ltd. Hong Kong
PR Editions S.A.S. France
Primeum IQVIA SAS France
Privacy Analytics Inc. Canada
Professional Pharmaceutical Marketing Services (Pty.) Ltd. South Africa
PT IMS Health Indonesia Indonesia

SubsidiaryJurisdiction or
State of OrganizationPT Quintiles Indonesia Indonesia
Pygargus AB Sweden
Q Squared Solutions (Beijing) Co. Ltd. China
Q Squared Solutions (India) Private Limited India
Q Squared Solutions (Quest) Limited United Kingdom
Q Squared Solutions (Quest) LLC Delaware
Q Squared Solutions (Shanghai) Co. Ltd. China
Q Squared Solutions B.V. Netherlands
Q Squared Solutions BioSciences LLC Delaware
Q Squared Solutions China (Quest) Limited United Kingdom
Q Squared Solutions China Limited United Kingdom
Q Squared Solutions Expression Analysis LLC Delaware
Q Squared Solutions Holdings B.V. Netherlands
Q Squared Solutions Holdings Limited United Kingdom
Q Squared Solutions Holdings LLC Delaware
Q Squared Solutions K.K. Japan
Q Squared Solutions Limited United Kingdom
Q Squared Solutions LLC North Carolina
Q Squared Solutions Proprietary Limited South Africa
Q Squared Solutions Pte. Ltd. Singapore
Q Squared Solutions S.A. Argentina
Q2 Metrics Canada
Qcare Site Services, Inc. North Carolina
QIMS Pharma Services SA DE CV Mexico
Quintiles B.V. Netherlands
Quintiles Benin Ltd. Benin
Quintiles Clindata (Pty.) Limited South Africa
Quintiles Clindepharm (Pty.) Limited South Africa
Quintiles Clinical and Commercial Nigeria Limited Nigeria
Quintiles Commercial ApS Denmark
Quintiles Commercial Germany GmbH Germany
Quintiles Commercial Rus LLC Russia
Quintiles Commercial South Africa (Pty) Limited South Africa
Quintiles Commercial US. Inc. Delaware
Quintiles Costa Rica S.A. Costa Rica
Quintiles Czech Republic, s.r.o. Czech Republic
Quintiles Denmark Denmark
Quintiles East Africa Limited Kenya
Quintiles Egypt LLC Egypt
Quintiles Enterprise Management (Shanghai) Co. Ltd. China
Quintiles Finance Sarl Luxembourg
Quintiles Finance Sarl - US United States
Quintiles Finance Uruguay, S.r.l. Uruguay
Quintiles GmbH Germany

SubsidiaryJurisdiction or
State of OrganizationQuintiles Holdings S.a.r.l. Luxembourg
Quintiles IMS European Holdings C.V. Netherlands
Quintiles Lanka Private Limited Sri Lanka
Quintiles Latin America Inc. Argentina
Quintiles Luxembourg European Holding S.a.r.l. - US United States
Quintiles Luxembourg European Holding, S.a.r.l. Luxembourg
Quintiles Luxembourg France Holdings SARL Luxembourg
Quintiles Medical Development (Shanghai) Co. Ltd. China
QUINTILES MEXICO, S. DE R.L. DE C.V. Mexico
Quintiles Netherlands Netherlands
Quintiles New Zealand New Zealand
Quintiles Norway Norway
Quintiles Phase One Clinical Trials India Private Limited India
Quintiles Russia LLC Russia
Quintiles S.a.r.l. Luxembourg
Quintiles S.a.r.L. - US United States
Quintiles Site Services, S.A. Costa Rica
Quintiles South Africa (PTY.) Limited South Africa
Quintiles UK (Japan Holdings) Limited United Kingdom
Quintiles Ukraine Ukraine
Quintiles Vietnam, LLC Vietnam
Quintiles West Africa Limited Ghana
QUINTILESIMS EUROPEAN HOLDINGS II C.V. Netherlands
Radar Acquisition Blocker, Inc. Delaware
Redsite Limited United Kingdom
Reportive SA France
RX India LLC Delaware
Schwarzeck Verlag GmbH Germany
Secureconsent, LLC Delaware
Shanghai IMS Market Research Co. Ltd. China
Source Informatics Limited United Kingdom
Spartan Leasing Corporation Delaware
Statfinn Oy Finland
STI Technologies Limited Canada
Strategique Sante France
Targeted Molecular Diagnostics, LLC Illinois
Tarius A/S Denmark
Temas Srl - Società Unipersonale Italy
TforG Connect BVBA Belgium
THE AMUNDSEN GROUP, INC.
UAB IQVIA CommercialVALUEMEDICS RESEARCH, LLCVCG&A Inc.VCG-Bio, Inc.
Belgium
Themis Limited Massachusetts
UAB IQVIA Commercial United Kingdom
VALUEMEDICS RESEARCH, LLC Lithuania
VCG&A Inc. Delaware

Exhibit 23.1
CONSENT OF INDEPENDENT REGISTERED PUBLIC ACCOUNTING FIRM
We hereby consent to the incorporation by reference in the Registration Statements on Form S-8 (Nos. 333-213927, 333-193212, 333-188431) and Form S-3 (No. 333-218209) of IQVIA Holdings Inc. (formerly Quintiles IMS Holdings, Inc.) of our report dated February 19, 2019 relating to the financial statements, financial statement schedules and the effectiveness of internal control over financial reporting, which appears in this Form 10-K. /s/ PricewaterhouseCoopers LLP
Raleigh, North CarolinaFebruary 19, 2019

Exhibit 31.1
CERTIFICATION OF PERIODIC REPORT UNDER SECTION 302 OF
THE SARBANES-OXLEY ACT OF 2002
I, Ari Bousbib, certify that:
1. I have reviewed this annual report on Form 10-K of IQVIA Holdings Inc. (the “registrant”);
2. Based on my knowledge, this report does not contain any untrue statement of a material fact or omit to state a material fact necessary to make the statements made, in light of the circumstances under which such statements were made, not misleading with respect to the period covered by this report;
3. Based on my knowledge, the financial statements, and other financial information included in this report, fairly present in all material respects the financial condition, results of operations and cash flows of the registrant as of, and for, the periods presented in this report;
4. The registrant’s other certifying officer and I are responsible for establishing and maintaining disclosure controls and procedures (as defined in Exchange Act Rules 13a-15(e) and 15d-15(e)) and internal control over financial reporting (as defined in Exchange Act Rules 13a-15(f) and 15d-15(f)) for the registrant and have:
(a) Designed such disclosure controls and procedures, or caused such disclosure controls and procedures to be designed under our supervision, to ensure that material information relating to the registrant, including its consolidated subsidiaries, is made known to us by others within those entities, particularly during the period in which this report is being prepared;
(b) Designed such internal control over financial reporting, or caused such internal control over financial reporting to be designed under our supervision, to provide reasonable assurance regarding the reliability of financial reporting and the preparation of financial statements for external purposes in accordance with generally accepted accounting principles;
(c) Evaluated the effectiveness of the registrant’s disclosure controls and procedures and presented in this report our conclusions about the effectiveness of the disclosure controls and procedures, as of the end of the period covered by this report based on such evaluation; and
(d) Disclosed in this report any change in the registrant’s internal control over financial reporting that occurred during the registrant’s most recent fiscal quarter (the registrant’s fourth fiscal quarter in the case of an annual report) that has materially affected, or is reasonably likely to materially affect, the registrant’s internal control over financial reporting; and
5. The registrant’s other certifying officer and I have disclosed, based on our most recent evaluation of internal control over financial reporting, to the registrant’s auditors and the audit committee of the registrant’s board of directors (or persons performing the equivalent functions):
(a) All significant deficiencies and material weaknesses in the design or operation of internal control over financial reporting which are reasonably likely to adversely affect the registrant’s ability to record, process, summarize and report financial information; and
(b) Any fraud, whether or not material, that involves management or other employees who have a significant role in the registrant’s internal control over financial reporting.
Date: February 19, 2019
/s/ Ari BousbibAri BousbibChairman, Chief Executive Officer and President(Principal Executive Officer)

Exhibit 31.2
CERTIFICATION OF PERIODIC REPORT UNDER SECTION 302 OF
THE SARBANES-OXLEY ACT OF 2002
I, Michael R. McDonnell, certify that:
1. I have reviewed this annual report on Form 10-K of IQVIA Holdings Inc. (the “registrant”);
2. Based on my knowledge, this report does not contain any untrue statement of a material fact or omit to state a material fact necessary to make the statements made, in light of the circumstances under which such statements were made, not misleading with respect to the period covered by this report;
3. Based on my knowledge, the financial statements, and other financial information included in this report, fairly present in all material respects the financial condition, results of operations and cash flows of the registrant as of, and for, the periods presented in this report;
4. The registrant’s other certifying officer and I are responsible for establishing and maintaining disclosure controls and procedures (as defined in Exchange Act Rules 13a-15(e) and 15d-15(e)) and internal control over financial reporting (as defined in Exchange Act Rules 13a-15(f) and 15d-15(f)) for the registrant and have:
(a) Designed such disclosure controls and procedures, or caused such disclosure controls and procedures to be designed under our supervision, to ensure that material information relating to the registrant, including its consolidated subsidiaries, is made known to us by others within those entities, particularly during the period in which this report is being prepared;
(b) Designed such internal control over financial reporting, or caused such internal control over financial reporting to be designed under our supervision, to provide reasonable assurance regarding the reliability of financial reporting and the preparation of financial statements for external purposes in accordance with generally accepted accounting principles;
(c) Evaluated the effectiveness of the registrant’s disclosure controls and procedures and presented in this report our conclusions about the effectiveness of the disclosure controls and procedures, as of the end of the period covered by this report based on such evaluation; and
(d) Disclosed in this report any change in the registrant’s internal control over financial reporting that occurred during the registrant’s most recent fiscal quarter (the registrant’s fourth fiscal quarter in the case of an annual report) that has materially affected, or is reasonably likely to materially affect, the registrant’s internal control over financial reporting; and
5. The registrant’s other certifying officer and I have disclosed, based on our most recent evaluation of internal control over financial reporting, to the registrant’s auditors and the audit committee of the registrant’s board of directors (or persons performing the equivalent functions):
(a) All significant deficiencies and material weaknesses in the design or operation of internal control over financial reporting which are reasonably likely to adversely affect the registrant’s ability to record, process, summarize and report financial information; and
(b) Any fraud, whether or not material, that involves management or other employees who have a significant role in the registrant’s internal control over financial reporting.
Date: February 19, 2019 /s/ Michael R. McDonnellMichael R. McDonnellExecutive Vice President and Chief Financial Officer(Principal Financial Officer)

Exhibit 32.1
CERTIFICATION PURSUANT TO 18 U.S.C. SECTION 1350
AS ADOPTED PURSUANT TO SECTION 906 OF THE SARBANES-OXLEY ACT OF 2002
I, Ari Bousbib, Chairman, Chief Executive Officer and President of IQVIA Holdings Inc. (the “Company”), do hereby certify, pursuant to 18 U.S.C. Section 1350, as adopted pursuant to Section 906 of the Sarbanes-Oxley Act of 2002, that to the best of my knowledge:
(1) the Annual Report on Form 10-K of the Company for the year ended December 31, 2018 (the “Report”) fully complies with the requirements of Section 13(a) or 15(d) of the Securities Exchange Act of 1934; and
(2) the information contained in the Report fairly presents, in all material respects, the financial condition and results of operations of the Company for the periods presented therein.
Date: February 19, 2019 /s/ Ari BousbibAri BousbibChairman, Chief Executive Officer and President(Principal Executive Officer)
This certification is being furnished solely to accompany the Report pursuant to 18 U.S.C. § 1350, as adopted pursuant to Section 906 of the Sarbanes-Oxley Act of 2002, and shall not be deemed “filed” by the Company for purposes of Section 18 of the Securities Exchange Act of 1934, as amended, and shall not be incorporated by reference into any filing of the Company under the Securities Act of 1933, as amended, or the Securities Exchange Act of 1934, as amended, whether made before or after the date of this Report, irrespective of any general incorporation language contained in such filing.
A signed original of this written statement required by Section 906 of the Sarbanes-Oxley Act of 2002 has been provided to the Company and will be retained by the Company and furnished to the Securities and Exchange Commission or its staff upon request.

Exhibit 32.2
CERTIFICATION PURSUANT TO 18 U.S.C. SECTION 1350
AS ADOPTED PURSUANT TO SECTION 906 OF THE SARBANES-OXLEY ACT OF 2002
I, Michael R. McDonnell, Executive Vice President and Chief Financial Officer of IQVIA Holdings Inc. (the “Company”), do hereby certify, pursuant to 18 U.S.C. Section 1350, as adopted pursuant to Section 906 of the Sarbanes-Oxley Act of 2002, that to the best of my knowledge:
(1) the Annual Report on Form 10-K of the Company for the year ended December 31, 2018 (the “Report”) fully complies with the requirements of Section 13(a) or 15(d) of the Securities Exchange Act of 1934; and
(2) the information contained in the Report fairly presents, in all material respects, the financial condition and results of operations of the Company for the periods presented therein.
Date: February 19, 2019 /s/ Michael R. McDonnellMichael R. McDonnellExecutive Vice President and Chief Financial Officer(Principal Financial Officer)
This certification is being furnished solely to accompany the Report pursuant to 18 U.S.C. § 1350, as adopted pursuant to Section 906 of the Sarbanes-Oxley Act of 2002, and shall not be deemed “filed” by the Company for purposes of Section 18 of the Securities Exchange Act of 1934, as amended, and shall not be incorporated by reference into any filing of the Company under the Securities Act of 1933, as amended, or the Securities Exchange Act of 1934, as amended, whether made before or after the date of this Report, irrespective of any general incorporation language contained in such filing.
A signed original of this written statement required by Section 906 of the Sarbanes-Oxley Act of 2002 has been provided to the Company and will be retained by the Company and furnished to the Securities and Exchange Commission or its staff upon request.