ireland’s doomed goal to become a world-class knowledge ... · pdf fileireland’s...
TRANSCRIPT

Finfacts.ie
1
Ireland’s doomed goal to become a world-class knowledge economy
Michael Hennigan BComm MEconSc
Finfacts.ie
Dublin Economics Workshop Annual Conference, Galway
Oct 13, 2012

Finfacts.ie
2
1. Abstract
Science spending has boosted some Irish science competence statistics but enterprise statistics suggest that the official Irish goal to become a world class knowledge economy by 2013, is a failure.
Ministers dream of creating local high-technology giants like Google or Microsoft but any spinout from university research with potential is acquired by a foreign firm and there has been no scaling up of a local high-technology or life sciences firm in the past decade. Besides, it's usually not the pioneers who triumph. There is no first mover advantage in high-technology.
It is a common misconception that high growth firms are synonymous with the high-tech sector and in Ireland since the onset of the recession in 2008, two very rare large jobs announcements this month, came from indigenous firms in traditional sectors: food and gambling. Kerry Group Plc and Paddy Power Plc have used technology developed by others to expand their businesses.
Production of Irish goods and services is dominated by foreign firms and they do not do research that merits applications for patents at both the Irish Patents Office and the European Patents Office.
Data shows that business spending on R&D (research and development) has risen coincident with the introduction of an R&D spending tax credit of 25%. It's a reasonable assumption that not all the spending is strictly R&D. Tax strategies for example have a huge impact on headline export data. The R&D tax credit is claimed via self-assessment on corporation tax returns.
Placing university research at the centre of enterprise policy has been naive as there is limited international evidence of commercialisation success. How can thousands of high-tech startups be nurtured when there is effectively no local market and the likelihood that public procurement will be constrained for years?
While there are spillover impacts from research, technology licensing income as a ratio of university research spending, is insignificant.
Despite over a half-century of state cash supports to business, Ireland along with Luxembourg, Malta and Cyprus, still does not publish credible survival/mortality statistics on firms. Neither are longitudinal studies done to track Irish success and failure over time.
The Department of Jobs, Enterprise and Innovation told us that 80% of startups established under the Technology Transfer Strengthening Initiative, which was launched in early 2007, are still running while about 30 spinout companies from research are established annually with early stage employment of 3-4 people on average.
A high survival rate suggests a failure to grow and likely sheltered existence.
US Bureau of Labor Statistics (BLS) data suggests that 31% of a sample of firms in sectors across the economy, survived 7 years while the rate for the 'Information' sector was 31% in Year 5 of life and 25% at Year 7. A BLS study shows that of 2,600 high-tech firms that were founded in Silicon Valley in 2000, fewer than 1 in 5 were still in business in 2009.
In 2010 an official group known as the 'Innovation Taskforce' sketched a scenario where Ireland could add up to 215,000 net high-tech jobs in a decade and vault over Silicon Valley in North California, to become the world's premier location for 'knowledge' jobs. Months later, as an embattled government struggled to save the economy from collapse, faith

Finfacts.ie
3
gave way to cold reality and another taskforce was established to propose research priorities that could increase the likelihood of job creation.
This rescue group proposed 14 priority areas.
I have in the past pointed to the potential in food and Nestlé, the Swiss food giant, has over 5,000 working in R&D. On drink, who would have thought that Irish farmers would supply milk as an input to a gin and liqueur maker?
The October 2012 announcement by Kerry Group, the Irish food multinational, of plans to build a technology and innovation centre in Ireland, highlights the potential of focusing on a sector where Ireland has strengths.
At a global level, the two most successful high-technology clusters in the past sixty years, Silicon Valley in North California and Israel, have some key unique features.
A September 2012 report by the Kauffman Foundation, a US entrepreneurship think-tank, revealed that an analysis of the Inc. 500 rankings published by Inc. magazine showed that high numbers of fast-growing US firms are concentrated in unexpected regions and industrial sectors.
"Our analysis of these fast-growing firms shows us that high-growth company founders can come from anywhere," said Dane Stangler, director of Research and Policy at the Kauffman Foundation. "Their firms can be found throughout the country and, rather than following the conventional expectation that high-growth companies are grouped into a narrow technology category, they represent exceptionally diverse industry segments. These findings offer important lessons for economic development leaders, such as to target firms that are high-growth rather than high-tech."
McKinsey Global Institute said in a 2010 report: "While many policy makers see innovative technologies as the answer to the challenge of job creation, our analysis indicates that governments are likely to be disappointed in such hopes.”
The model of globalisation where there would be knowledge economies in the West while low-wage manufacturing would dominate in regions such as Asia, is already out of date.
2. Introduction
Scientific discovery and the exponential improvement of products, processes and services to meet human needs have dramatically impacted the quality of life for a significant number of humankind compared with what Thomas Hobbes (1588-1679) wrote in 1651 of "the life of man, solitary, poor, nasty, brutish, and short."
Innovation is not just about discoveries in public or commercial laboratories. It is also about how technology is utilised and is relevant for both mature and modern business sectors. For example, Achille Gaggia launched the espresso coffee machine in Italy in 1948. However, it was a native of Brooklyn who sought to replicate the atmosphere in Italian espresso bars and today Starbucks is a global brand. Ryanair became one of Europe's biggest airlines without having to pay a royalty to anyone.
The focus in Ireland on foreign direct investment (FDI) since the late 1950s transformed Ireland from an agricultural economy and transferred both technology and modern management methods to the economy.
In the 1990s, there were high hopes for the emergence of a significant indigenous high-technology sector; however the main firms struggled in the aftermath of the dot-com bust.

Finfacts.ie
4
In 2004, the Enterprise Strategy Group in a report, 'Ahead of the Curve - Ireland's Place in the Global Economy,' said Ireland lacked capability in two essential areas: international sales and marketing and the application of technology to develop high value products and services.
It said: "We need to ensure that research in Ireland is led and informed by market needs (demand-driven), so that we obtain economic value from the research investment."
In 2006, the peak year of the property bubble, policy makers switched focus from a reliance on supporting individual firms to seeking to move up the so-called 'value chain' by becoming a knowledge economy like countries such as Israel, Sweden, Denmark and Finland where local firms would grow, aided by the expansion of university research and the increasing output of science and technology graduates.
Israel had not become a master of innovation by choice.
It developed in a semi-arid region, surrounded by enemies and when the Soviet Union collapsed, the country became the beneficiary of possibly the largest movement in intellectual capital in a short time period, in history.
In November 2006, Micheál Martin, minister for enterprise, trade and employment, said that a new strategy on science and technology would "see Ireland secure its position as one of the most advanced knowledge economies in the world and become renowned for the excellence of its research."
The target date was 2013.
In September 2012, a ministerial successor of Martin, Richard Bruton, minister for jobs, enterprise and innovation said: "As I have said before, our industrial policy must not just be aimed at attracting the next Google or Microsoft to Ireland - - we must strive to create the next Google or Microsoft here in Ireland."
In September 2009, Brian Cowen, taoiseach (Irish prime minister), in a speech at the inaugural meeting of the Global Economic Forum, an Irish diaspora group, asked for help to create a ‘European Silicon Valley’ in Ireland.
It was a brave or delusional aspiration. However, in March 2010, an official 28-strong group of mainly policy insiders, university presidents and managers of multinational operations in Ireland, endorsed the goal.
The Innovation Taskforce reported in March 2010 and said there was potential for "net job creation in high-tech firms of the order of between 117,000 and 215,000 between now and 2020."
"More realistically, Ireland might aspire to be a leader in Europe and aim to have 15% of employment concentrated in high-tech firms. This would result in almost 346,000 people being employed in high-tech firms by 2020 - - a net increase of 215,000 jobs over the period."
The report said in respect of Silicon Valley: "It is estimated that 320,000 people are employed in 5,500 high-technology firms."
The analysis was seriously in need of a reality check.
One inconvenient truth was that the oldest technology cluster in Europe had managed to grow to only 48,000 jobs after 50 years and 40% of firms employed just up to 5 people.

Finfacts.ie
5
According to Eurostat, there were 57,000 employed in Irish high-tech manufacturing in 2010 and 72,000 in high-tech knowledge intensive services - - a total of 7% of employment.
Irish jobs at foreign multinationals in 2010 were back to the 1998 level while employment in the Irish-owned tradeable goods and services sectors (items and services that have potential to be exported) was also back to 1998. The total full-time employment in foreign-owned and indigenous firms was 275,693.
In November 2010, the Irish Government established a new taskforce under the chairmanship of Jim O'Hara, a former general manager of Intel Ireland, a unit of the US computer chip giant.
The group was asked to identify areas of research that would yield the best return for taxpayers’ investment in research and, ultimately, to create high-quality jobs. Fourteen specific areas of "greatest opportunity" were proposed.
O'Hara said: “The 14 areas we recommend stand up well in terms of the potential for economic impact including jobs. However, it is as much about how money gets spent in this area. We recommend a stage-gate process that will require researchers to demonstrate the economic relevance of their work as well as its scientific excellence if they are to get funding under the priority areas. Our other recommendations will also help to move to a more needs-driven approach.” Report
So after 6 years, a policy was to be tweaked.
Danny McCoy, director general of IBEC, the business lobby group, and a former economist at a public institute, had said after the publication of the Innovation Taskforce report: “The current economic downturn has reinforced the need to foster an economy built on innovation. This is where much of our economic success has come from in the past, and it is key to future growth. "Public investment in research and innovation can generate real economic growth. The recommendation to maintain such expenditure is particularly welcome as it will position the country to take full advantage of the global economic recovery. Such a policy was successfully pursued by Finland in the early 1990s."
Noble sentiments but the following are realities:
a) Foreign-owned firms, mainly American, were responsible for about 90% of Irish tradeable goods and services exports in 2010, unchanged since 2001.
These firms have no significant research and development centres in Ireland and there is no evidence that a material amount of high level research is done in Ireland.
In a Central Bank of Ireland paper, 'SMEs in Ireland: Stylised facts from the real economy and credit market' (2012), SMEs are shown to account for 26% of a sample of €110bn of exports in 2008, with indigenous firms accounting for just 14% and Irish-owned SMEs accounting for just 7%
The economists commented: "Of note is the fact that, despite Ireland’s reputation as one of the world’s most globalised economies, fully 64% of private sector workers are employed by indigenous non-exporting firms, with 56% working for indigenous, non-exporting SMEs. These statistics highlight the importance of domestic demand for employment generation, and suggest that an export-led recovery may not be a panacea for the Irish unemployment crisis."
b) For new Irish indigenous firms, the absence of a record of developing sales in the small domestic market compounded by subdued public procurement for years ahead, is a serious challenge for developing exports.

Finfacts.ie
6
Viktor Slavtchev and Simon Wiederhold say in a paper, 'Technological Intensity of Government Demand and Innovation' (2012), published by the Ifo institute, Munich, that: "The main result of the model is that an increase in the share of government purchases in high-tech industries stimulates corporate R&D activities in the economy. This is because a shift in government procurement toward high-tech industries translates into larger expected profits for successful innovators and higher incentives for firms to invest in R&D."
A Google or Microsoft could never develop in Ireland because of the small market. A startup with potential would be snapped up by an outside firm.
Even when a traditional firm internationalises such as CRH, the global building materials group, which was formed through a merger in 1970 of two leading Irish public companies, Cement Limited (established in 1936) and Roadstone Limited (1949), it may effectively cease being an Irish firm over time.
Overseas residents hold about 90% of CRH's shares and 1% of its 75,000 payroll is located in Ireland.
In contrast, food companies such as the Kerry Group, continue to have deep local roots.
With the exception of SAP, the German software firm, Nokia, the mobile phone firm, and Skype, the Internet phone service, Europe's big firms tend to be both old and in mature industries.
In the United States, Yollies (young leading innovators formed after 1975) account for 35% of total R&D of leading innovators; in Europe, a mere 7%! Notably, Japan has almost no young firms among its leading innovators.
World Bank: Golden Growth -- Europe and Central Asia (Chapter 5)
Deutsche Bank Research said in a 2011 study that "companies in the US are distinguished by a strong startup culture. Over 50% of all US firms in the current (2009) Top 1,000 (global companies ranked by R&D spending) were founded after 1975, in Europe the figure is just 18% and in Japan a mere 2%. US firms thus invest more in R&D than their competitors in Europe and Japan also on account of their youth and their smaller size. The startup culture also explains why US firms call the shots in advanced technology sectors. Biotechnology, software and IT are business areas that did not even exist until very recently. Long-standing companies find it difficult, however, to tap into these new business areas."
c) There is limited evidence of success in commercialisation of university research.
The OECD (Organisation for Economic Cooperation and Development) says there is "little evidence of success" in the commercialisation of university research and licensing fee income for universities is insignificant as a ratio of research spending in both the US (3.4%) and the UK (1.1%).
Commercialisation is incidental to university research and spinouts rarely have significant success.
Technology licensing income is generally at low single digits as a percentage of research spending even for the world’s top universities.
For example, in 2007, Stanford University was ranked 10th among US universities in licensing income, at $50m from 986 active licenses. Stanford’s research expenditures in 2007 were $700m and its total budget for 2007-2008 was $3.8bn, excluding the capital budget and the budget for hospital and clinical services. Thus, in 2007, licensing income was 1.3% of the

Finfacts.ie
7
budget. Similarly, MIT’s licensing income was 2.8% of its budget and the University of Washington’s licensing income was 2.3% of its budget.
'Managing University Intellectual Property in the Public Interest,' (National Academies Press, 2010).
Public-sector research is considerably smaller than business R&D in the majority of OECD countries: government intramural expenditure on R&D was on average 0.29% of gross domestic product (GDP) for the OECD area in 2009, and higher education expenditure on R&D was 0.44% (including a small percentage funded by business), while business expenditure on R&D stood at 1.69%. A recent OECD study of public research ‘Public Research Institutions: Mapping sector trends’ ( 2011) found that university research has now taken the place of PRIs (public research institutes) as the main performer of public research in many OECD countries.
“Today increasingly sophisticated public demand and new challenges due to fiscal pressures require innovative public sector approaches. However, knowledge about public sector innovation, and its results, costs and enabling environment, is fragmented. Public sector innovation is rarely institutionalised in government budgets, roles and processes, and there is limited knowledge and awareness of the full range of tools available to policy makers for accelerating innovation.
The OECD says it is currently working on developing analytical and measurement frameworks to understand and foster public-sector innovation. This includes developing an Observatory of Public Sector Innovation that will build a classification of the components of the innovation process with a view to understanding the factors that support the development of innovations, and their results, in order to map existing innovation approaches and policies.”
The OECD says that following the passage of the Bayh-Dole legislation in the United States in 1980 - - which gave public research institutions incentives to patent and license academic inventions - - many countries have developed technology transfer and licensing offices (TTOs/TLOs) at universities and PRIs. However, only a few countries and a few institutions have achieved a track record in commercialising the results of public research through TTOs/TLOs. Moreover, many countries, universities and PRIs continue to base the productivity of TTOs on traditional measures of technology transfer such as patents and licenses. Even if these have been increasing in OECD countries, they represent a very small share of the knowledge that is transferred from universities and PRIs.
The think-tank said that the UK government is establishing the National Intellectual Property Management Office to support capacity building in technology transfer and commercialisation of IP, including via partnerships with UK technology transfer offices and staff secondments. Australia’s Commercialisation Australia programme provides a range of commercialisation support services of the order of US$180m (A$278m) to 2014. Korea has announced an IP fund of $60m (KRW 50bn) for technology transfer and commercialisation by PRIs. OECD, Science, Technology and Industry Outlook 2012, OECD, Paris,
d) The likelihood is that any spinout from university research with potential would be sold to a bigger overseas firm before it scales up and the Irish taxpayer sees any payback.
BiancaMed Limited was founded in 2003 as a spinoff from research undertaken in UCD School of Electrical, Electronic & Mechanical Engineering in Dublin, Ireland. Its focus is on solutions for sleep disorders.
BiancaMed, with a staff of 29, was acquired by ResMed, a US firm, in July 2011. It had raised €11m in venture funding in the period 2003-2011.

Finfacts.ie
8
The sale price was not disclosed but Seventure, the French venture capital company, which led a €6m Series B round in June 2009, said it would make an IRR (internal rate of return) of approximately 50% on completion of the deal.
In April 2012, IDA Ireland, the inward investment promotion agency, announced that it would financially support the addition of 50 new jobs at ResMed over the succeeding 3 years.
e) The Irish government has sought to attract US venture capital companies to Ireland and it has invested directly in US VC funds, via the National Pensions Reserve Fund.
The '2012 NVCA Yearbook,' which is produced by Thomson Reuters and focuses on the US market, says that for every 100 business plans that come to a venture capital firm for funding, usually only 10 or so get a serious look, and only one ends up being funded. A concept that promises a 10 or 20% improvement on something that already exists is not likely to get a close look. The activity level of the US venture capital industry is around half what it was at the 2000-era peak. For example, in 2000 more than 1,000 firms invested $5m or more during the year. In 2011, the amount was roughly half that.
In the US in 2011, there were a total of 529 deals in non-high-tech sectors, from a total of 3,722 deals. In the period 2000-2011, 52% of US firms that held an initial public offering (IPO) were prior recipients of VC investment.
About three-quarters of venture-backed firms in the US don't return investors' capital, according to recent research by Shikhar Ghosh, a senior lecturer at Harvard Business School. Wall Street Journal
Josh Lerner, professor of investment banking at Harvard Business School and the author of 'The Architecture of Innovation' (Harvard Business Review Press, 2012), argues that "the venture capital model is no panacea for innovation. The boom-and-bust cycle, the mercurial effects of public markets, and the narrowing of its objectives have made it something far less substantial."
He says: "Investor Peter Thiel (a co-founder of PayPal and an early backer of Facebook) has aptly expressed the core anxiety: 'We wanted flying cars. Instead, we got 140 characters,'" - - a reference to Twitter.
A report by the Kauffman Foundation, the entrepreneurship think-tank, in 2009 said that while the venture industry is known for backing icons such as Google, Genentech, Home Depot, Microsoft and Starbucks, less than one-in-five of the fastest-growing and most successful companies in the United States had venture investors.
The industry has a 2-and-20 compensation structure (a management fee of 2% of the assets under management, and 20% of investing gains) for venture capital funds but the performance of funds is poor.
A 2012 Kauffman report says that over the past decade, public stock markets have outperformed the average venture capital fund and for 15 years, VC funds have failed to return to investors the significant amounts of cash invested, despite high-profile successes, including Google, Groupon and LinkedIn.
f) The model of globalisation where there would be knowledge economies in the West while low-wage manufacturing would dominate in regions such as Asia, is already out of date.
g) The big successful companies employ a fraction of their counterparts in the past. General Motors had over 618,000 employed in the US in 1979 - - in well-paid jobs; today, General Electric employs 133,000 and Apple 47,000.

Finfacts.ie
9
Only some workers in the West can aspire to reasonable pay while in a global market, there are no easy pickings for small economies.
h) There has been no serious accountability in respect of Irish public spending in the science area.
2. Innovation
Innovation has been crucial for human development and in recent times it has become a buzz word for politicians and business people.
In 2005, Alan Greenspan, then Federal Reserve chairman, said at the Adam Smith Memorial Lecture, in Kirkcaldy, Scotland, in honour of the author of 'The Wealth of Nations' that had been published in 1776:
"For most of recorded history, people appear to have acquiesced in, and in some ways embraced, a society that was static and predictable. A young twelfth-century vassal could look forward to tilling the same plot of his landlord's soil until disease, famine, natural disaster, or violence ended his life. And that end often came quickly. Life expectancy at birth was, on average, twenty-five years, the same as it had been for the previous thousand years. Moreover, the vassal could fully expect that his children and doubtless their children, in turn, would till the same plot...To be sure, improved agricultural techniques and the expansion of trade beyond the largely self-sufficient feudal manor increased the division of labour and raised living standards and populations, but growth in both was glacial. In the fifteenth century, the great mass of people were engaged in the same productive practices as those of their forebears many generations earlier."
Ralf R. Meisenzahl and Joel Mokyr, US economists, in a paper, 'The Rate and Direction of Invention in the British Industrial Revolution: Incentives and Institutions' (2010) stress the importance of human capital, in particular the role of the 'tweakers' and 'implementers' in the innovation process.
In 1779, Samuel Crompton invented the spinning mule, which introduced mechanisation to cotton manufacture. However, as with other inventions of that period, the authors say that a few thousand individuals may have played a crucial role in the technological transformation of the British economy and carried the Industrial Revolution. The average level of human capital in Britain, as measured by mean literacy rates, school attendance, and even the number of people attending institutes of higher education are often regarded as surprisingly low for an industrial leader. But the useful knowledge that may have mattered was obviously transmitted primarily through apprentice-master relations, and among those, what counted most were the characteristics of the top few% of highly skilled and dexterous mechanics and instrument makers, mill-wrights, hardware makers, and similar artisans."
The US high-tech sector accounts for 9.2m jobs and approximately 5.6% of US jobs. However, in 2011, 84% of venture capital investment of $28.8bn went to the high-tech sector.
McKinsey Global Institute said in a 2010 report that in the US, the semiconductor sector accounted for 0.3% of total nonfarm employment. That compares to 11.3% for retail trade. India’s software industry accounts for only 0.1% of that country’s employment.
Research from the United States shows that startups (up to a year old) and young firms (up to five years old) across the economy, have a crucial role in job creation.
From March 2009 to March 2010, US private-sector firms created a net -1.8m jobs. The 394,000 companies that began operations in 2010, however, created +2.3m jobs, in spite of the poor economy.

Finfacts.ie
10
However, overall the declining job creation from business startups reflects a falling firm startup rate, which fell from 12 to 13% (as a percentage of all firms) in the 1980s to 7 or 8% in recent years. Data analysed by the Kauffman Foundation shows that from the early 1980s, the share of young firms has declined from close to 50% to less than 35% in 2010.
The survival rate for young businesses is about 50% in five years but the survivors have high average growth rates. In addition, the evidence shows that the high-growth surviving young firms have contributed substantially to productivity growth.
Bart Clarysse, professor of Entrepreneurship, at Imperial College London used his inaugural lecture in 2009 to explode the myths surrounding the economic importance of high-tech startups to the Europe. His is co-author of 'The Smart Entrepreneur,' which was published in 2011.
Prof Clarysse said companies, which attempt to commercialise their own ideas are seen by policy makers and technology transfer offices as being vital to the economy.
"People think of the big names like Microsoft, Apple, HP, Intel and Xerox as once being new tech-startups," he said at the lecture. "Yet most of these highly successful companies did not develop their own ideas. Typically they took existing technologies, developed by pioneering - - and sometimes financially unviable - - companies. They bought other businesses to help them succeed and appear credible."
Real technology startups tend to grow slowly, have a poor survival rate and contribute little to the wider economy in economic terms. Compared to the US, European startup performance is poor. In Europe, after seven operational years these new firms comprise, on average, 18.5 employees with revenues of £250,000 and a mere 36% likelihood of surviving beyond 10 years.
Prof Clarysse said that in the UK there were over 2,900 of these companies that had been in business since 1991. Despite spending over £2.5bn, they are responsible for only 40,000 jobs. "They don't become the new Microsoft," he said. "They just stay micro."
He said that policy efforts should not be solely aimed at encouraging startups and nurturing technology transfer from universities. Ideally, concentrated funds between £2 - 4m would be made available for companies that are potential purchase targets, usually by a large customer via a trade sale. These trade sales can realise high values, even when a startup has little or no revenue. Big sale prices are achieved when the new firm's business model is set up for sale from the beginning, which is contrary to conventional business thinking and methods.
Prof Clarysse said science policy should support the development of large companies in the UK that are able to acquire smaller firms and then be sold on to an overseas interest. This would generate the most significant benefit and cash flow into a national economy. It is quite different to the current volume approach of raising numerous companies, many of which will never have a significant economic impact.
He suggested that many startups fail because they reach the market too soon. "There are no first mover advantages in high-tech," he said. "In fact it's a disadvantage as single firms cannot reduce the time required to move from product launch to a take off in sales, some 14.2 years on average. So it's better to join a market late."
High growth firms have received a large amount of interest in recent years because a small number of them in an economy are responsible for a significant amount of job creation.
Eurostat, the European Union's statistics office and the Organisation for Economic Co-operation and Development (OECD) has recommended that high-growth firms should be defined as: “All enterprises with average annualised growth greater than 20% per annum,

Finfacts.ie
11
over a three year period, and with ten or more employees at the beginning of the observation period. Growth is thus measured by the number of employees and by turnover.”
The recommended definition of “gazelles” is: “All enterprises up to five years old with average annualised growth greater than 20% per annum over a three-year period, and with ten or more employees at the beginning of the observation period”.
While there is a common misconception that high growth firms would tend to be in high-tech, crucially, the evidence from several countries shows that high growth firms are found in a wide range of sectors and across all regions.
The OECD says that in any country, high-growth firms represent a small percentage of the overall number of firms. According to the data collected by the OECD-Eurostat Entrepreneurship Indicators Programme following the OECD definitions, these firms represent on average around 3-6% and 8-12% of the total business population respectively when growth is measured by employment and by turnover.
The gazelles represent on average less than 1% (by employment) or 2% (by turnover) of the total population, and less than one-fifth of high-growth enterprises. 'High-Growth Enterprises: What Governments Can Do to Make a Difference' (2010).
The UK National Endowment for Science, Technology and the Arts (NESTA) said in a report, 'The Vital 6 per cent,' in 2009 that 6% of all UK firms employing more than 10 people, generated half of the new jobs created by existing businesses between 2002 and 2008.
Neither are high-growth firms exclusive to so-called ‘high-tech’ or ‘growth sectors’. High-growth firms are almost equally present in the ‘high-tech’ and ‘low-tech’ sectors. And all major UK sectors contained between 4 and 10% of high-growth firms. However, the balance between different sectors does appear to reflect trends in the economy in the period: the sectors with the highest proportion of high-growth firms were financial services (over 9%) and real estate and business services (around 8%), while the lowest share was found in manufacturing (3 to 4%).
In the US, research has found that in any given year, the top-performing 1% of firms generate roughly 40% of all new jobs. 'High-Growth Firms and the Future of the American Economy (2010)
A report series released in September 2012 by the Kauffman Foundation revealed that an analysis of the Inc. 500 rankings by Inc. magazine showed that high numbers of fast-growing US firms are concentrated in unexpected regions and industrial sectors.
"Our analysis of these fast-growing firms shows us that high-growth company founders can come from anywhere," said Dane Stangler, director of Research and Policy at the Kauffman Foundation. "Their firms can be found throughout the country and, rather than following the conventional expectation that high-growth companies are grouped into a narrow technology category, they represent exceptionally diverse industry segments. These findings offer important lessons for economic development leaders, such as to target firms that are high-growth rather than high-tech."
The report said that so-called high-tech sectors constitute only about a quarter of fast-growing Inc. firms: IT (19.4%) and Health and Drugs (6.5%). Other major sectors include Business Services (10.2%), Advertising and Marketing (8.5%), and Government Services (7.3%). Thus, innovations and growth of firms come from a wide range of industries.
As for R&D spending, Booz & Co., the US consultancy which produces an annual survey of the global top 1,000 business research and development spenders, says there is no statistically significant relationship between financial performance and innovation spending, in terms of either total R&D dollars or R&D as a percentage of revenues.

Finfacts.ie
12
Many companies - - notably, Apple - - consistently underspend their peers on R&D investments while outperforming them on a broad range of measures of corporate success, such as revenue growth, profit growth, margins, and total shareholder return. Meanwhile, entire industries, such as pharmaceuticals, continue to devote relatively large shares of their resources to innovation, yet end up with much less to show for it than they - - and their shareholders - - might hope for.
The Wall Street Journal reports that between 2004 and 2007 - - the years leading to Apple’s first iPhone launch - - Nokia, the Finnish mobile phone firm’s total research and development spend was €17.1bn ($22.2bn at today’s exchange rate), against Apple’s $2.5bn in the same period.
So Nokia spent nine times more than Apple on R&D during those years. Apple, by mid-2007, had only just started shipping its first iPhones and was still generating most of its revenue from its range of Mac computers and iPods.
Between 2004 and 2011, Apple’s revenues increased roughly 1,200% while its net profit surged by 9,600%. Meanwhile, Nokia has turned into a loss-making device maker, with last year’s revenue just 31% higher since 2004.
To this day Nokia continues to outspend Apple in R&D, spending $7.3bn last year against Apple’s $2.4bn.
Global R&D spending surged from US$1.25tn in 2010 to $1.33bn in 2011, and is expected to reach $1.40tn in 2012, with continued strong growth in emerging economies and stable growth in established economies. Global business R&D increased by 4% in 2010, compared with a 1.9% drop in 2009 in the wake of the financial crisis.
Science, Technology and Industry Outlook 2012, OECD, Paris.
Foreign-born scientists and engineers, whether educated in the United States or abroad, are a critical part of the US Science & Engineering (S&E) workforce: about one in four S&E master's degree holders and one in three S&E doctorate holders are foreign born. This reliance is greatest on those with engineering and math/computer science degrees. Among them, about 40% of master's degree holders and 50% of doctorate holders are foreign born.
In Silicon Valley in the period 2006-2011, immigrants were among the founders or sole founders of 43.9% of startups.
3. Science & Technology Indicators

Finfacts.ie
13
GERD: Gross Expenditure R&D 2004 2010
Ireland as ratio GNP* 1.46% 2.15%
EU27 GDP (EU25 in 2004) 2.86% 2.00%
US GDP 2.66% 2.79%
Finland GDP 3.51% 3.87%
Sweden GDP 3.70% 3.42%
Germany GDP 2.49% 2.82%
UK GDP 1.79% 1.77%
BERD: Business Enterprise Expenditure R&D 2004 2010
Ireland GNP 0.96% 1.47%
EU27 (EU 25 in 2004) 1.20% 1.23%
Value (data for 2003) €1.10bn €1.90bn
Foreign-owned firms €775m €1.32bn
Irish-owned firms €330m €583m
GBAORD: Government Sector Expenditure R&D 2004 2010
Ireland GNP 0.50% 0.68%
EU27 (EU 25 in 2004) 0.65% 0.77%
Value €635m €890m
Irish Science Budget €23.7bn in constant prices 2002/11 €2.03bn €2.34bn
High-tech/Life Sciences Jobs 2002 2011
Foreign-owned firms 104,500 101,800
Irish-owned firms 29,200 29,100
Patents 2007 2011
Patent applications at Irish Patent Office 925 490
PCT applications at European Patent Office 422 421
*Irish GNP (gross national product) is used rather than GDP which is about 22% bigger. GNP excludes the profits of foreign multinationals operating in Ireland
Sources:
Irish Science Budget 2011
Annual Employment Survey 2011
Strategy for Science, Technology and Innovation Indicators 2011
Statistics at a glance 2011
Science, technology and innovation in Europe 2012 edition

Finfacts.ie
14
Science, technology and innovation in Europe 2007 edition
Research & Development Performance in the Business Sector Ireland 2005/6
Department of Jobs, Enterprise and Innovation information provided to Finfacts:
a) Irish Universities and Institutes of Technology receive very modest income from licence fees (less than €1m a year).
"It is worth noting that the Irish Technology Transfer system is predicated on its capability to deliver wider socio-economic gains through the efficient and effective transfer of IP to enterprises which have a propensity to grow and create employment through the successful utilisation of the Intellectual Property. The main focus is not on generating revenue from direct sale of licences."
“A key part of the Government's plan to create the employment..we need to ensure that the Government's core €500m research budget is focused on turning good ideas into good jobs. Today we are outlining a series of steps we are taking in order to ensure that this happens. Firstly, we have identified 14 specific areas where we believe our research can be best targeted in order to achieve commercial outcomes." Minister Richard Bruton, March 01, 2012 on the Research Prioritisation Plan.
Recommended Priority Areas of Focus Future Networks & Communications Food for Health Data Analytics Management, Security & Privacy Sustainable Food Production and Processing Digital Platforms, Content & Applications Marine Renewable Energy Connected Health & Independent Living Smart Grids & Smart Cities Medical Devices Manufacturing Competitiveness Diagnostics Processing Technologies and Novel Materials Therapeutics - synthesis formulation, processing and drug delivery
Innovation in Services and Business Processes
b) Patent applications from Irish residents (including foreign companies and also inventions that were not made in Ireland) in 2011 were at the lowest since 1982.
"The Patents Office does not require applicants to state whether they are foreign owned or indigenous. All we ask for is the applicants name and address.
The Patents Office do not (sic) capture indicators of whether the patent applicant is a public body or not."
Patent applications per million filed with the European Patent Office (EPO) were at 115 in 2010 compared with 855 for Switzerland; 380 for Sweden; 332 for Denmark and 306 for Finland. Triadic patents filed at the EPO and Japan's Patent Office and granted at the US Patent Office were at 17 per million population in 2010 compared Sweden's 96.8; Germany's 70.4; Finland's 62.9 and Denmark's 50.5.
c) "There have been approximately 30 spinout companies established in each of the last few years, largely as a result of the maturing technology transfer system, which has been supported under the Enterprise Ireland Technology Transfer (TT) Strengthening Initiative. Initially these companies have modest employment of around 3-4 people on average, while they are in their pre-commercial stage after establishment."
"A benchmarking exercise carried out in 2011 also demonstrated that the outputs from the Irish TT system are generally above the US and European averages for spin outs and licences (as much a 4 times the US average for Spinouts and 20% more technologies licensed to companies for the amount of expenditure on research)."

Finfacts.ie
15
"Eighty per cent of startups established under the Technology Transfer Strengthening Initiative are still running."
d) The Department's 'Strategy for Science, Technology and Innovation Indicators - December 2011' report stated that the number of firms applying for R&D tax credits had "increased dramatically" from under 200 in 2004, to 600 in 2008 and around 1,000 in 2009. The total value of credits claimed in 2009 was estimated at €385m "leveraging up to four-times that in additional spend."
The Department provided the following information in October 2012:
Research & Development Tax Credit
2010 Estimated cost €223.7m
Number of claims 1,172
2009 Estimated cost €216.1m
Number of claims 900
2008 Estimated cost €146m
Number of claims 582
"The R&D tax credit is claimed by companies on a self-assessment basis and the Revenue Commissioners has the right to audit the claim under the legislation however the rate of rejection resulting from audits is not available."
"In Finance (no. 2) Act 2008, there was a legislative change which had a significant impact on the 2009 figures. Up until that time, the R&D tax credit could be claimed within 4 years of the end of the accounting period in which the R&D expenditure took place. But in Finance (no. 2) Act 2008, the R&D tax credit claim was excluded from this general rule and the claim had to be made within 12 months of the accounting year end in which the expenditure was incurred."
A 20% tax credit in respect of research and development expenditure was introduced in 1997 and revamped in 2004 with the rate raised to 25%. Deloitte, the Big 4 accounting firm, says R&D credits can now be surrendered to key R&D employees which they can use against their personal income tax liability, reducing the effective income tax rate to a minimum of 23%.
Deloitte also says that R&D for the purposes of the relief includes basic research, applied research or experimental development. These activities must seek to achieve scientific or technological advancement and involve the resolution of scientific or technological uncertainty. A project does not have to be successful to qualify. Mathematical modelling for the development of new financial products, financial engineering, spread betting or life industry products are covered.
Extending an existing application to mobile networks is also covered.
Grant Thornton, a firm of accountants, reported in June 2012 that only a minority of Irish food and drink companies are utilising the research and development tax credits available to them.
e) IDA Ireland, the inward investment agency, has no minimum level for the R&D 'component' of new projects.
Finfacts.ie
16
Other indicators
f) In September 2012, the European Research Council (ERC) selected 536 early-career top researchers across Europe in the latest 'Starting Grant' competition, with a budget of almost €800m. Only 4 Irish researchers made the grade.
g) Eurostat, the EU statistics office says that in 2010, the EU27 counted 2.5m people in full-time equivalents (FTE) working in R&D. In the EU as a whole, the business enterprise sector was the largest sector, employing more than half of R&D personnel (1.3m FTE).
In 2010, 20,483 FTE (full-time equivalent) researchers and support staff were employed in Ireland: 12,104 in the business enterprise sector and 8,289 in Irish higher education and public bodies (987).
R&D personnel as a percentage of persons employed in the business enterprise sector in 2009 was at 0.53% in the EU27; 0.57% in Ireland; 0.82% in Germany; Denmark 1.16%; Finland 1.14% and Sweden 1.10%.
R&D staff in Ireland in 2005 was at 16,681.
The number of support staff and technicians totalled 12,328 in 2009 while the total number of full-time equivalent researchers in 2009 was 14,681. The number of full-time equivalent (FTE) researchers employed per thousand population in Ireland in 2009 was 7.6 compared with 6.2 in 2005 and a EU27 average of 6.8.
PhDs in business grew from 830 in 2005 to 1,639 in 2009.
Strategy for Science, Technology and Innovation Indicators 2011
Irish PhD graduates increased from 774 in 2005 to 1,153 in 2010 from the university sector (+48%). Science and technology PhDs graduates increased by 34% over the period.
According to Eurostat, in 2010, 495,000 workers in Ireland were classified as working in a 'science and technology' occupation, at 27% of total employment -- compared with 37.2% in Germany; 40.9% in Denmark; 35.2% in Finland; 541.4% in Sweden and 27.4% in the UK. The EU27 average was 31%.
h) The Organisation for Economic Cooperation and Development (OECD) says in its Science, Technology and Industry Outlook 2012: "Investment in innovation is likely to remain under pressure in the years ahead. BERD (Business Enterprise Research and Development) represents 1.18% of GDP, roughly at the OECD median in 2010. Most BERD (70%) is carried out by foreign affiliates. Ireland has a relatively large number of top R&D investors, and is at the top of the mid-range of OECD countries in terms of the relative number of young innovative companies. Venture capital is well developed and the ease of entrepreneurship index is well above the OECD median. With 34% of PCT patent applications produced with international collaboration, Ireland stands well above the OECD median. In terms of industry financing of public R&D, it performs relatively poorly as compared to the OECD average. Graduates in science and engineering and the quality of education in sciences lie in the midrange of OECD countries. ICT infrastructures also correspond to the OECD median."
i) Data from Ireland's Central Statistics Office (CSO) and Forfás, the policy advisory board, show that there were almost 1,300 enterprises engaged in research and development activities in Ireland in 2009. More than two thirds of all enterprises spent less than €500,000 on research and development activities, over one fifth spent more than €500,000 and less than €2m while over 10% spent €2m or more.
Finfacts.ie
17
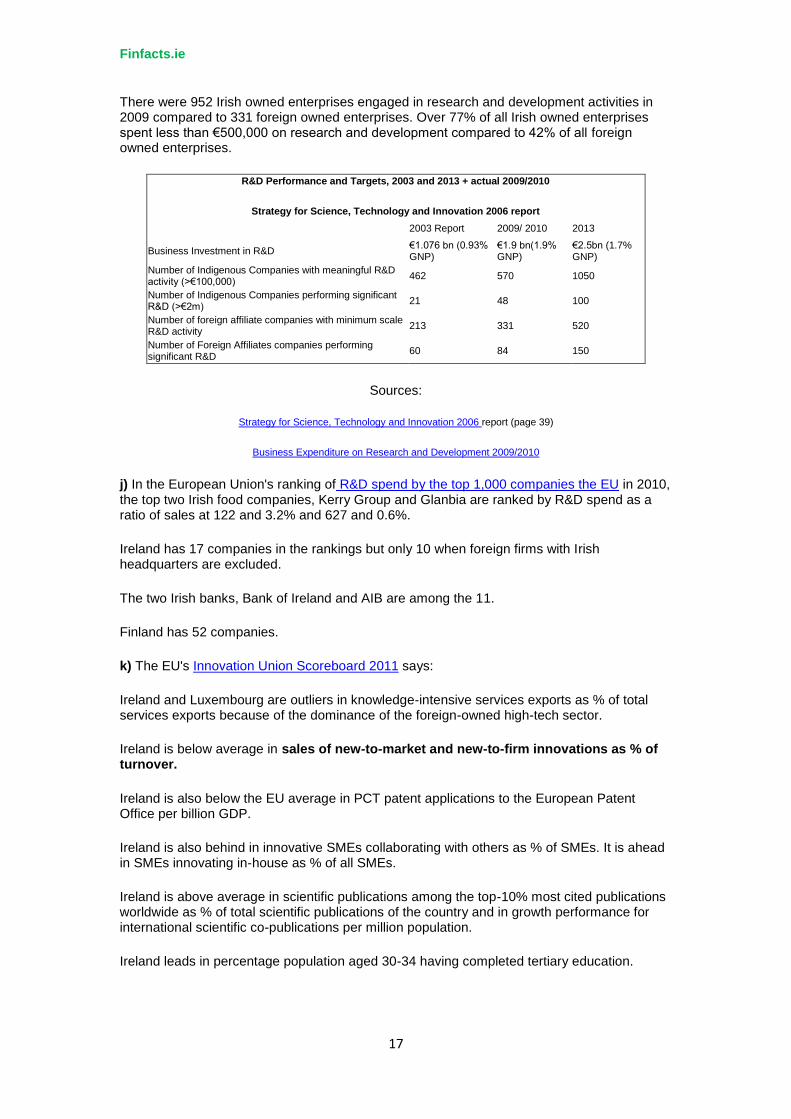
There were 952 Irish owned enterprises engaged in research and development activities in 2009 compared to 331 foreign owned enterprises. Over 77% of all Irish owned enterprises spent less than €500,000 on research and development compared to 42% of all foreign owned enterprises.
R&D Performance and Targets, 2003 and 2013 + actual 2009/2010
Strategy for Science, Technology and Innovation 2006 report
2003 Report 2009/ 2010 2013
Business Investment in R&D €1.076 bn (0.93% GNP)
€1.9 bn(1.9% GNP)
€2.5bn (1.7% GNP)
Number of Indigenous Companies with meaningful R&D activity (>€100,000) 462 570 1050
Number of Indigenous Companies performing significant R&D (>€2m) 21 48 100
Number of foreign affiliate companies with minimum scale R&D activity 213 331 520
Number of Foreign Affiliates companies performing significant R&D 60 84 150
Sources:
Strategy for Science, Technology and Innovation 2006 report (page 39)
Business Expenditure on Research and Development 2009/2010
j) In the European Union's ranking of R&D spend by the top 1,000 companies the EU in 2010, the top two Irish food companies, Kerry Group and Glanbia are ranked by R&D spend as a ratio of sales at 122 and 3.2% and 627 and 0.6%.
Ireland has 17 companies in the rankings but only 10 when foreign firms with Irish headquarters are excluded.
The two Irish banks, Bank of Ireland and AIB are among the 11.
Finland has 52 companies.
k) The EU's Innovation Union Scoreboard 2011 says:
Ireland and Luxembourg are outliers in knowledge-intensive services exports as % of total services exports because of the dominance of the foreign-owned high-tech sector.
Ireland is below average in sales of new-to-market and new-to-firm innovations as % of turnover.
Ireland is also below the EU average in PCT patent applications to the European Patent Office per billion GDP.
Ireland is also behind in innovative SMEs collaborating with others as % of SMEs. It is ahead in SMEs innovating in-house as % of all SMEs.
Ireland is above average in scientific publications among the top-10% most cited publications worldwide as % of total scientific publications of the country and in growth performance for international scientific co-publications per million population.
Ireland leads in percentage population aged 30-34 having completed tertiary education.

Finfacts.ie
18
l) Eurostat says that at an EU level in 2009, about one quarter of tertiary-education students chose science and engineering (S&E) as their main field of study, representing 7.2 % of the population aged 20–29 years.
Ireland's rate was 3.3% for 'Science, mathematics and computing' and 3.2% for 'Engineering, manufacturing and construction.'
Finland was at 4.8% and 11.7%; Sweden was at 3.2% and 5.9%; Denmark was at 3.2% and 3.6% and Germany was at 3.2% and 3.9%.
The EU27 average was 3.0% and 4.2%.
4. Patents
"When in 2004 my University of Manchester colleagues and I discovered graphene, a material one carbon atom thick with extraordinary industrial potential, I set about trying to patent it. When I approached a representative of a multinational electronics company, I received a put-down that I recall whenever I am asked about patents. 'If after 10 years we find graphene is really as good as it promises, we will put a hundred patent lawyers on it to write a hundred patents a day, and you will spend the rest of your life, and the gross domestic product of your little island, suing us.'”
- - Prof Andre Geim, 2010 Nobel Prize in Physics, 'Patents merely satisfy a professor’s pride,' Financial Times, July 2, 2012.
Patent filings have jumped worldwide, rising from 997,000 applications filed in 1990 to 1,980,000 in 2010, according to the World Intellectual Property Organization (WIPO).
The annual report of the Irish Patents Office for 2011 says that applications for national patents continued to decline sharply in the year. National long term (20 years) patent filings received during 2011 were down 34% on 2010 (from 350 to 230) while the number of short term patent applications (10 years) filed, was down 25% on 2010 (from 442 to 331). The number of patents granted was 250.
Patent applications from Irish residents (including foreign-owned companies operating in Ireland. However, a filing may not have an Irish resident inventor) in 2011 amounted to 494, down from 733 in 2010, as shown in the table below. This is a plunge of 33% and is the lowest since 1982, according to World Intellectual Property Organisation (WIPO) statistics.
Patent grants to Irish residents totalled 195 in 2011, 211 and 286 in 2010 and 2006 respectively.
A survey of cloud computing patent activity by New Morning IP, a Dublin-based intellectual property consultants, published in July 2012, found that filing of cloud computing patent families by Irish resident applicants is dominated by three global companies; Accenture and Skype (acquired by Microsoft in 2011), and Business Objects Software (acquired by SAP AG in 2007). They collectively account for almost half of the total. Many of these publications lack Irish resident inventors indicating that the Irish company is acting as a holding company for all or a portion of the wider group’s patents.
Not one of the 20 inventions recorded by Accenture Global Services Ltd names an Irish inventor.
New Morning IP says that firms including IBM, HP, Ericsson, Amazon and Nortel Networks have all filed patent applications which have included at least one Irish resident inventor.

Finfacts.ie
19
The survey report says that overall, the data shows that the increase in Irish patent publications is almost entirely due to three FDI applicants: Accenture, Skype and Business Objects Software. After filtering out those records, the number of publications by indigenous Irish applicants is not growing in line with global growth, indicating that the indigenous Irish cloud sector is falling behind in terms of patenting activity. 'Cloud Computing - - The Irish Perspective'
Tony Owens, a director of Irish-based Shibumi Consulting, and formerly of New Morning IP, says: "The statistics on the Irish patent office in my view are very positive and suggest reducing levels of naïve and/or damaging patenting. Irish patents are not comparable with those granted by the main patenting authorities; the UK, DE, EPO, US, JP, KR and others. Applications to the Irish PO are generally granted without examination (they are not resourced to offer examination or search). The only evidence of novelty required is either a UKPO search or prior examination and publication of the invention by a full-service patent authority.
A possible reason why there are few and declining Irish applications is because they disclose an invention without offering either robust examination or meaningful protection, in a globalised world within which Ireland is a tiny market. If the true value proposition of the Irish PO is becoming better understood by Irish inventors and they are advised (by Irish patent attorneys) instead to go for a UK, an EP or WO application, I think that is great." www.shibumi-consulting.net
Tony Owens adds: "One is struck by the lack of international academic co-assignees; the low level of industrial co-assignees; the extent of the focus on bioscience (biomedicine/immunology/biofoods/microbiology) and the low levels of patenting in applied technology (i.e. commercially focused solutions to market-relevant problems)."
International patent filings under the WIPO-administered Patent Cooperation Treaty (PCT) set a new record in 2011 with 181,900 applications - - a growth of 10.7% on 2010 and the fastest growth since 2005. China, Japan and the United States of America (US) accounted for 82% of the total growth (Annex 1). Chinese telecommunications company ZTE Corporation was the biggest filer of PCT applications in 2011.
The WIPO says that the PCT system facilitates the process of seeking patent protection in multiple countries. It simplifies this process by postponing the requirement to file a separate application in each jurisdiction until after a centralized processing and initial patentability evaluation have taken place. Examination of the patentability of the invention in national offices and the related expenses are postponed, in the majority of cases, by up to 18 months – or even longer in some offices – as compared to direct patent filings. The PCT system now has 144 member states. Annex 5 presents total PCT filings from all member states from 2007 to 2011.
There were 422 Irish PCT applications in 2007 and 421 in 2011.
PCT Top Irish Applicants (Publication Year = 2011) Applicant Publication Rank Skype Limited 41 434 Tibotec Pharmaceuticals Ltd. 12 1419 Accenture Global Services Ltd. 11 1548 College of the Holy and Undivided Trinity of Queen Elizabeth near Dublin (Trinity College) 11 1548 University College Cork 11 1548 Depuy (Ireland) Limited 9 1843 Nellcor Puritan Bennett Ireland 8 2028 Dublin City University 7 2287 Revolt Technology Ltd. 7 2287 Scientific Games Holdings Ltd. 7 2287
Source: World Intellectual Property Organisation

Finfacts.ie
20
The number of ICT (Information and Communication Technologies) related Irish PCT applications in 1999 was 83, 146 in 2006 and 135 in 2009. The corresponding levels in biotechnology were: 21, 22, and 30.
Among the top filing countries, PCT applications from China (+33.4%), Japan (+21%), Canada (+8.3%), South Korea (+8%) and the US (+8%) saw the fastest growth in 2011. European countries witnessed a mixed performance, with Switzerland (+7.3%), France (+5.8%), Germany (+5.7%) and Sweden (+4.6%) experiencing growth, and the Netherlands (-14%), Finland (-2.7%), Spain (-2.7%) and the United Kingdom (-1%) seeing declines. The large middle-income economies of the Russian Federation (+20.8%), Brazil (+17.2%) and India (+11.2%) recorded double-digit filing growth.
The OECD defines patent families as “the set of patents (or applications) filed in several countries which are related to each other by one or several common priority filings.”
Extending patent protection outside the parent country, usually signalls a commercialisation commitment by the owner.
Ireland's research output, measured by number of patent families per thousand capita population, is low by international standards and below both the EU27 average and the average of the OECD's 34 mainly developed country membership. http://www.oecd.org/sti/scienceandtechnologypolicy/keyFigures_20112_1_EN.pdf - - Page 15
The OECD says that triadic patent families are a set of patents filed at three major patent offices: the European Patent Office (EPO), the Japan Patent Office (JPO) and the United States Patent and Trademark Office (USPTO).
The think tank says the concept of triadic patent families has been developed in order to improve the international comparability and quality of patent-based indicators. Only patents registered in the same set of countries are included in the family: home advantage and influence of geographical location are therefore eliminated. Furthermore, patents included in the triadic family are typically of higher economic value: patentees only take on the additional costs and delays of extending the protection of their invention to other countries if they deem it worthwhile.
The number of Irish triadic patents issued in 1999, 2006 and 2009 was 74, 74 and 76.
The number per million inhabitants in 2009, was 17 in Ireland, with Switzerland in the lead at 113.5, followed by Japan at 104.48, Sweden at 96.79 and Germany at 70.37.
The OECD says that matching patent and enterprise data show that firms in high- and medium-high-technology manufacturing sectors perform on average 56% of all patenting. Exceptions are Ireland, Poland and the United Kingdom, where more than 50% of patents come from firms in the business services sector. Medium-low-technology manufacturing firms seldom contribute more than 10% of patent filings.
The presence of young firms among patent applicants underlines the inventive dynamics of firms early in their development and their desire to develop new activities and products; this may affect their survival and growth. During 2007-09 firms less than five years old filing at least one patent application represented on average 25% of all patenting firms, and generated 10% of patent applications. The share of young patenting firms varies considerably across countries, led by Ireland (42%) and followed by the Nordic economies. See 'Patenting firms' in 'OECD Science, Technology and Industry Scoreboard 2011':
Forfás, the Irish government's policy advisory agency, said in a report in 2004 that analysis of the profile of Irish-based companies engaged in patenting showed that none of the top 50 exporters were among the top ten foreign-owned patenting

Finfacts.ie
21
companies, and leading computer manufacturers were entirely absent. Only one of the top 15 pharmaceutical exporters (Abbot) appeared on the list. Analysis of top indigenous patentees showed that they were mainly SMEs operating in traditional sectors. "However, the omissions tell us more about the state of indigenous industry than those that are included. The Irish food sector contributes two-thirds of all indigenous industry exports but no major food company or co-operative appears on the list (Table 6)."
The number of patent applications from public (government) research bodies in Ireland was very small - - as few as 2-3 per year.
Patent quality and commercialisation are issues which have received a lot of attention in recent years.
The OECD's 'Science, Technology and Industry Scoreboard 2011' reported that patent quality has declined by an average of around 20% between the 1990s and 2000s, a pattern seen in nearly all countries studied.
The OECD developed a composite indicator based on six dimensions of patents' underlying quality: forward citations (number of citations a -patent receives); backward citations (number of -patents and scientific papers a patent cites); patent family size, i.e. the number of countries in which the patent is taken; number of claims; generality index, measuring the dispersion of citing patents over technology classes; and grant lag. The index does not use weights.
The report said that studying patent quality in different sectors has also allowed the OECD to assess which countries are doing best in the area of research and development and innovation. The UK, for example, produces semiconductor and environmental technology patents that are above average in quality. Korea has a competitive advantage in ICT-related innovations and Germany is strong at innovating in solar energy.
Patents from inventors in the United States, Germany and Japan are the most highly cited, which suggests that true innovations are being used by many firms in their products to generate further innovations, according to the report. However, while these countries produced about 70% of the top 1% of highly-cited patents between 1996 and 2000, their share fell 60% five years later.
In recent years, the Nordic countries, China, India and Korea have seen their share increase of highly-cited patents. The European Union is leading in clean energy technologies, representing nearly 40% of all filings by the late 2000s, followed by the US and Japan. In this area, China now ranks 8th worldwide.
The OECD report also ranks research by universities worldwide. Overall, 40 of the top 50 research institutions are located in the United States, with the rest in Europe. But a more diverse picture emerges when looking at subject areas, according to the report.
Denmark for example has the highest quality patents in 'Wind energy,' 'Organic Chemistry,' 'Pharmaceuticals' and 'Biotechnology' while Finland leads in 'Polymers.'
Ireland does not head any category.
Prof Andre Geim, cited above, said in the FT: "Patenting is a multibillion dollar global trade. In the UK alone, there are about 425,000 patents in force and 50,000 new applications are filed every year. The cost per application can range from £5,000 to more than £50,000 if the patent is to be supported worldwide. Even large companies complain of the staggering costs, but for startups and lone inventors, a single application is a huge financial burden. Unfortunately, in their desire to protect cherished ideas, non-professional inventors are usually guided by myths about patents.

Finfacts.ie
22
Small companies and individual inventors usually have little experience in patenting. Most are unaware that more than 90% of patents bring no return. This means that every year thousands of UK inventors spend thousands each to buy a piece of paper that is unlikely to serve any useful purpose."
Prof Ted Sichelman of the University of San Diego School of Law (Sichelman, Ted M., Commercializing Patents. Stanford Law Review, Vol. 62, No. 2, pp. 341-413, 2010. Via http://ssrn.com/abstract=1395558 ) says: "About half, probably more, of all patented inventions in the United States are never commercially exploited. Even many of the most commercially significant inventions take decades to come to market...In addition to several surveys reporting roughly 50% commercialization rates, patentees fail to pay maintenance fees on more than 60% of patents within twelve years after issuance."
Nagaoka Sadao of Japan's RIETI ( Research Institute of Economy, Trade and Industry) and John P. Walsh of the Georgia Institute of Technology say in a paper in respect of Japan and the US: "Although the two countries have a similar overall level of commercialization (60% of the triadic patents), the structure is different: in Japan, we see a higher incidence of in-house use relative to the overall level of commercialization, more inventions being licensed and less used for startups."
An expert group reported to the European Commission this year that "about 17% of European patents are 'sleeping patents' that are neither licensed, nor used internally, nor held for purely defensive purpose."
Available indicators suggest that "there is a pool of 8% to 24% of European patents that could potentially benefit from enhanced valorisation. Since the value of patents is typically skewed, a small share of these patents probably concentrates a large share of the potential gains from commercialisation. This minority of patents with a high commercial potential are the most likely to effectively benefit from enhanced patent valorisation."
Dr. Meir Perez Pugatch, University of Haifa, says that "a more structural and statistical observation suggest that only a fraction of patented technologies are commercialized or utilized. It is estimated that less than 80% of patents worldwide are utilized (Pugatch, 2004: 59). Even worse, it would seem that most of the patented technologies are worth less than their registration and maintenance fee. For example, Schankerman (1998:94), analyzing the value of patents in France between 1969 and 1982, found that the median value of patents in different technology fields is surprisingly low: $US 1,631 in pharmaceuticals, $US 1,594 in chemicals, $US 2,930 in mechanical and $7,933 in electronic patents. Schankerman also reports that only one% of pharmaceutical patents exceed a value of $US 50,000."
Martina Pasquini, Myriam Mariani and Giovanni Valentini of Bocconi University say in a paper that: "Though commercialization can represent a desirable outcome for a patent, a high rate of patents is not brought to the market and rests sleeping or unutilized. In the past, it has been calculated that multinational firms like Procter & Gamble and Dow Chemical have commercialized only 10% and 19% of their patents, respectively (Chesbrough, 2006). Similarly, Palomeras (2003) reports evidence indicating that Siemens, IBM, and Philips use less than half of their intellectual property portfolios. More broadly, Giuri et al. (2007), using data from a survey on 9,017 European patents, show that 36% of these patents are not used; about half of them are blocking patents, and the other half sleeping patents."
They conclude: "In this work, we showed that knowledge sources exploited by inventors during the patenting process might influence the nature of inventions and the probability that patents are commercially exploited. In particular, we showed that the likelihood of patent commercialization is associated to the joint use of market and scientific knowledge, which allows coupling market needs with scientific advancements. In line with these findings, we also show that two inventor types, professional and non-professional, characterized respectively by scientific and market knowledge background, should rely upon the knowledge type they do not embody to be able to develop inventions more likely marketable."

Finfacts.ie
23
Patent applications, residents Scientific and technical journal articles
1999 2010 1999 2009 Austria 2,028 2,424 4,158 4,832 China 15,626 293,066 15,715 74,019 Denmark 1,656 1,626 4,783 5,306 Finland 2,511 1,731 4,930 4,949 Germany 50,029 47,049 42,963 45,003 Greece 290 728 2,626 4,881 Ireland 966 733 1,459 2,799 Israel 2,053 1,450 5,829 6,304 Japan 357,531 290,081 55,274 49,627 South Korea 55,970 131,805 8,478 22,271 Netherlands 2,545 2,575* 12,168 14,866 Singapore 374 895 1,897 4,187 Sweden 4,142 2,196 9,890 9,478 Switzerland 1,916 1,622 8,195 9,469 USA 149,251 241,977 188,004 208,601
Source: World Bank: Science & Technology data
5. Journal citations
Thomson Reuters says in its 'Global Research Report - US' that three decades ago, US scientists fielded nearly 40% of the papers in the journals indexed by the company in the 'Web of Science.' That dataset represents a cross-section of the leading international research literature. In the recent times, that the share of the world literature which carries a US author or co-author address is down to some 29%. During the same period, the European Union nations (the EU27, following the accession of countries in the former Eastern bloc) increased their share of research papers moderately, from 33% to 36%, surpassing the US in the mid 1990s.
Thomson Reuters say the biggest change has been the steady and accelerating rise in research contributed by nations in the Asia-Pacific region - - from about 13% in 1981 to 31% in 2009. The year 2008 witnessed Asian nations matching the output of the US, and now they have exceeded the US output. It says it should also be noted that Asian nations as a group surpassed the US in R&D investments in 2008. That year, Asia’s investment was US$387bn, that of the US was $384bn, and the comparable figure for the EU27 was $280bn.
The Batelle/R&D Magazine's 2012 forecast for R&D in purchasing power parity (PPP) terms has Asia at $514.4bn and 1.9% of GDP (gross domestic product); US at $436bn and 2.8% of GDP and Europe at $338.1bn and at 2% of GDP. Ireland's country rank for 2012 is 34 and R&D spending is at $3.2bn, at a ratio of GDP is at 1.75%.
The 10th annual 'Top 20' listings of countries in an 2011 update of 'Essential Science Indicators,' showed that in citations per article rankings based on papers published in Thomson Reuters-indexed journals from January 2001 through August 31, 2011, Ireland had moved up to a 20th ranking compared with a rank of 36th in 2003.
A report by a unit of Thomson Reuters, that was commissioned by Forfás, an Irish State policy advisory agency and the Higher Education Authority (HEA), showed that in the period 1998-2007, Ireland showed "an impressive increase (33%) in terms of research output, measured as the number of publications indexed by Thomson Reuters across all disciplines. This rate of increase far exceeds the average for the comparator group, and is second only in growth to China (59%)."
Over the five years to 2007, in terms of the volume of health and medically-related publications, Ireland had moved one place up the rankings within the group (from 18th to 17th position) by overtaking Singapore.

Finfacts.ie
24
Over the 10-year period, the percentage of output (34,648 articles and reviews in all research fields) which is highly-cited (cited at least four times world average, RBI ((global average adjusted for year and field) ≥ 4 was 6.2%. This compared with the US at 6.8% and ahead of the UK at 6.07%. Output uncited was at 28.5%.
The report said that the proportion of uncited papers in economic and business is relatively high (40.8% cf 28.5% average for Ireland), the percentage above world average is markedly lower than elsewhere and the percentage that is relatively highly cited is not much more than half the Ireland average (3.6% cf 6.2%). 'Research strengths in Ireland: a bibliometric study of the public research base,' (2009).
Listed by citations per paper
Rank Country Papers Citations Cites per paper 1 SWITZERLAND 181,636 3,070,458 16.90 2 DENMARK 98,083 1,574,167 16.05 3 USA 3,049,662 48,862,100 16.02 4 NETHERLANDS 252,242 3,974,719 15.76 5 SCOTLAND 109,135 1,709,814 15.67 6 ENGLAND 697,763 10,508,202 15.06 7 SWEDEN 179,126 2,686,304 15.00 8 BELGIUM 137,878 1,918,993 13.92 9 FINLAND 88,874 1,224,037 13.77 10 GERMANY 784,316 10,518,133 13.41 11 CANADA 451,588 6,019,195 13.33 12 AUSTRIA 95,690 1,253,930 13.10 13 ISRAEL 110,558 1,426,421 12.90 14 NORWAY 72,277 922,183 12.76 15 WALES 36,949 465,429 12.60 16 FRANCE 557,322 7,007,693 12.57 17 AUSTRALIA 304,160 3,681,695 12.10 18 ITALY 429,301 5,151,675 12.00 19 NORTHERN IRELAND 18,025 212,810 11.81 20 IRELAND 45,774 534,270 11.67
Source: Essential Science Indicators from Thomson Reuters, time period: 2001-August 31, 2011 (fourth bimonthly period of 2011).
It's said that a common criticism of global rankings is that they favour universities which publish in the English language, because most journals counted by bibliometric databases (counts of papers and citations per university) are in English. In addition, Anglo-Saxon academics have a greater culture of citing each other’s work than academics in other countries.
It is claimed that the QS Peer Review for the QS university rankings, "is independent of any such language bias, and QS has gone to great lengths to produce our surveys in a range of languages, so as not to disadvantage non-native English speaking academics. We accept that some bias remains in the citation per faculty count, but we are encouraging the inclusion of as many foreign journals as possible. Our current supplier of citations data, Scopus, has a database which is generally regarded as being less prone to language bias than its main rival, Thomson Reuters."
Scopus is the largest abstract and citation database of peer-reviewed research literature. It tracks over 19,000 titles from more than 5,000 international publishers and it is owned by Elsevier of the Netherlands, one of the world’s leading provider of science and health information.
The SCImago Journal & Country Rank is a portal that includes the journals and country scientific indicators developed from the information contained in the Scopus database.

Finfacts.ie
25
For the period 1996-2010, with 10,000 chosen as the minimum number for a country's documents, Switzerland leads with 21.77 citations per document and 292,254 citable documents. Ireland has a 15th rank after Germany at 15.56 citations per document and 74,033 citable documents.
Kenya is at 19th rank, is ahead of Spain with 13.76 citations per document for 12,350. Spain has 13.12 for 547,858 documents.
SCImago. (2007). SJR — SCImago Journal & Country Rank. Retrieved September, 2012, from http://www.scimagojr.com
In Economics, Econometrics and Finance, for 1,007 citable documents, the citation per document rate was 6.27 compared with 12.87 in Agricultural and Biological Sciences.
SIR (Scimago Institutions Rankings) World Report 2012 says it aims at becoming an evaluation framework of research performance to Worldwide Research Organizations.
The report shows six indicators that help users evaluate the scientific impact, thematic specialisation, output size and international collaboration networks of the institutions.
The period analysed in the current edition covers 2006-2010. The tables include institutions having published at least 100 scientific documents of any type, that is, articles, reviews, short reviews, letters, conference papers, etc., during the year 2010 as collected by worldwide leader scientific database Scopus by Elsevier. The report encompasses Higher Education Institutions (HEIs) as well as other research-focused organizations from different sizes, with different missions and from countries in the five continents. Institutions are grouped into five Institutional Sectors: Higher Education, Health System, Government Agencies, Corporations and Others.
The indicators used are:
Output, measured as the number of scientific papers according to Scopus. International Collaboration, measured as the ratio of scientific documents an
institution publishes in collaboration with foreign institutions. Normalized Impact, as the citation rate an institution receives compared to the World
Average (according to the normalized citation indicator developed at Karolinska Instituet in Sweden)
Publication Rate into the 25% of "Best Journals" according to SJR indicator developed by SCImago Research Group.
Specialization Index, value indicating the thematic concentration (close to 1)/dispersion (close to 0) of an institution's scientific output.
Excellence Rate, proportion of an institution's scientific output found in the set formed by the 10% of the highly cited papers in their respective fields.
It is stated that SIR World Report 2012 is not a league table. "The ranking parameter - - the scientific output of institutions -- should be understood as a default rank, not our ranking proposal. The only goal of this report is to characterize research outcomes of organizations so as to provide useful scientometric information to institutions, policymakers and research managers so they are able to analyse, evaluate and improve their research results."
The report tracks 3,290 institutions that together are responsible for more than 80% of worldwide scientific output.
In respect of Irish research institutions, UCD (University College Dublin) gets a world rank (WR) of 356; Trinity College, Dublin, 428; UCC (University College Cork) 571; NUI Galway 797; DCC (Dublin City University ) 1039; University of Limerick 1122; NUI Maynooth 1663; RCSI (Royal College of Surgeons, Dublin) 1785; Teagasc, the Irish Agricultural Institute, 2047.

Finfacts.ie
26
Heading the table are 1) Centre National de la Recherche Scientifique (France) 2) Chinese Academy of Sciences 3) Russian Academy of Sciences 4) Harvard University and 5) Max Planck Gesellschaft (Germany).
Research journals are big business and the number of published articles grew from 1.09m in 2002 to 1.94m in 2010 according to data from Elsevier and the UK Department of Business, Innovation and Skills, cited by The Wall Street Journal. The number of journals published worldwide has risen from 8,086 in 1970 to 31,758 in 2011.
The Journal reported in August 2012 that "growing pressure on scientific journals to increase their influence in the research world is pushing them to ever further lengths to play the system that ranks scholarly publications. In July, a publication called Scientific World Journal retracted two papers about regenerative medicine, saying they had excessively cited another journal, Cell Transplantation."
At issue was the 'impact-factor ranking,' one of the most influential numbers in scholarship. The newspaper said that the impact factor (IF) was invented more than 50 years ago as a simple way to grade journals, on the basis of how frequently their articles got cited in the literature. But concerns have arisen that some journals' impact factor is artificially inflated by excessive citations - - which appears to be why the editors of The Scientific World Journal retracted previously published work.
The IF, is reported to be used by researchers in deciding where to publish and what to read. It guides promotions, tenure decisions and funding committees around the world, who assume someone publishing in a high-impact journal must be doing superior work.
Thomson Reuters calculates the IF by dividing the number of citations of research papers in a journal in one year by the total number of papers published in the same journal in the two previous years. The IF reflects the citation rate of a journal as a whole; it is not a measure of the quality or veracity of any individual paper.
In February 2012, Science, the US magazine, reported on a study, 'Coercive Citation in Academic Publishing,' by researchers at the College of Business Administration, University of Alabama, Huntsville, which found that one in five academics in economics, sociology, psychology and business fields had been asked to pad their papers with superfluous references in order to get published.
Allen W. Wilhite and Eric A. Fong "analyzed 6672 responses from a survey sent to researchers in economics, sociology, psychology and multiple business disciplines (marketing, management, finance, information systems, accounting) as well as data from 832 journals in those same disciplines. We find that coercion is uncomfortably common, and appears to be practiced opportunistically. As editors game the system and authors acquiesce, the integrity of academic publications suffers."
"While 86% of our respondents view coercion as inappropriate and 81% agree that coercion reduces a journal’s prestige, and 64% even say they are less likely to submit to a coercive journal, the majority (57%) still say they would add superfluous citations before submitting to a journal known to coerce...Authors in most of the business disciplines appear more likely to continue submitting to coercive journals than those in economics and sociology."
The authors said that Thomson Reuters should remove journal self-citations from its impact-factor calculation altogether, to remove any incentive for editors to accrue them.
In September 2011, Bayer, the German pharmaceutical firm, published a study showing that it had halted almost two-thirds of its early drug target projects because in-house experiments failed to match claims made in medical journals.

Finfacts.ie
27
The researchers said: "We received input from 23 scientists (heads of laboratories) and collected data from 67 projects, most of them (47) from the field of oncology. This analysis revealed that only in ~20–25% of the projects were the relevant published data completely in line with our in-house findings. In almost two-thirds of the projects, there were inconsistencies between published data and in-house data that either considerably prolonged the duration of the target validation process or, in most cases, resulted in termination of the projects because the evidence that was generated for the therapeutic hypothesis was insufficient to justify further investments into these projects."
In December 2001, Gautam Naik of The Wall Street Journal in a report 'Scientists' Elusive Goal: Reproducing Study Results' said: "Reproducibility is the foundation of all modern research, the standard by which scientific claims are evaluated. In the US alone, biomedical research is a $100bn year enterprise. So when published medical findings can't be validated by others, there are major consequences.
Drug manufacturers rely heavily on early-stage academic research and can waste millions of dollars on products if the original results are later shown to be unreliable. Patients may enroll in clinical trials based on conflicting data, and sometimes see no benefits or suffer harmful side effects.
There is also a more insidious and pervasive problem: a preference for positive results."
6. International rankings
Ireland has not secured “its position as one of the most advanced knowledge economies in the world and become renowned for the excellence of its research.”
1) The Programme for International Student Assessment (PISA) is an international assessment of the skills and knowledge of 15-year-olds. PISA is a project of the Organisation for Economic Co-operation and Development (OECD) and subject areas or ‘domains’ assessed are reading, mathematics and science. The PISA tests are done on a triennial basis.
In 2009, Korea and Finland were the highest performing OECD countries in reading literacy, with mean scores of 539 and 536 points, respectively. However, the partner economy Shanghai-China outperformed them by a significant margin, with a mean score of 556.
Korea, with a country mean of 546 scores points, performed highest among OECD countries in the PISA 2009 mathematics assessment. OECD countries Finland, Switzerland, Japan, Canada, the Netherlands, New Zealand, Belgium, Australia, Germany, Estonia, Iceland, Denmark, and Slovenia were above the OECD average in mathematics.
Shanghai-China, Finland, Hong Kong-China and Singapore were the four highest performers in the PISA 2009 science assessment. In science, New Zealand, Canada, Estonia, Australia, the Netherlands, Germany, Switzerland, the United Kingdom, Slovenia, Poland, Ireland and Belgium as well as the partner country and economies Taiwan, Liechtenstein and Macao-China also performed above the OECD average.
Finland had an overall result for reading, mathematics, and science of 536, 541 and 554. Ireland's points were 496, 487 and 508.
The OECD average was 493, 496 and 501.
The Irish scores showed that between 2006 and 2009 Ireland dropped from 5th to 17th place for reading literacy, from 16th to 25th place for mathematical literacy, while results in scientific literacy remained more stable.

Finfacts.ie
28
http://www.oecd.org/pisa/46643496.pdf
2) The European Union's annual Research and Innovation Scoreboard 2011
The EU's 'Innovation leaders' are Sweden, Denmark, Germany and Finland. The 4 countries tend to have:
above-average R&D expenditure, especially in the business sector; higher investment in skills and finance; strong national research and innovation systems with a key role for partnerships
between public and private sectors; better results in turning technological knowledge into products and services.
Austria, Belgium, Cyprus, Estonia, France, Ireland, Luxembourg, Netherlands, Slovenia and the UK are ‘Innovation followers.’
The performance of Czech Republic, Greece, Hungary, Italy, Malta, Poland, Portugal, Slovakia and Spain is below that of the EU27 average. These countries are ‘Moderate innovators.’
The performance of Bulgaria, Latvia, Lithuania and Romania is well below that of the EU27 average. These countries are ‘Modest innovators.’
http://ec.europa.eu/enterprise/policies/innovation/files/ius-2011_en.pdf
3) World Economic Forum: The Global Technology Report 2011/2012 produced in association with INSEAD, the French business school, aims at identifying, measuring, and benchmarking the drivers of national capacity to leverage ICT to boost competitiveness and well-being and their impacts.
Ireland has a 25th ranking. It had a ranking of 19 in 2001/2002.
http://www3.weforum.org/docs/Global_IT_Report_2012.pdf
http://www.nectec.or.th/pld/indicators/documents/WEF-%20Global%20Competitiveness%20Report%202001.pdf (2001)
4) The Economist Intelligence Unit: Digital Economy Rankings 2010 report (published in October 2011) assesses the quality of a country’s ICT infrastructure and the ability of its consumers, businesses and governments to use ICT to their benefit. When a country uses ICT to conduct more of its activities, the economy can become more transparent and efficient. "Our ranking allows governments to gauge the success of their technology initiatives against those of other countries. It also provides companies that wish to invest or trade internationally with an overview of the world’s most promising business locations from an ICT perspective.
Ireland had a 17th ranking in 2010. In 2004, Ireland's e-readiness rank was 15.
http://www-935.ibm.com/services/us/gbs/bus/pdf/eiu_digital-economy-rankings-2010_final_web.pdf
5) The World Bank’s Knowledge Assessment Methodology (KAM: www.worldbank.org/kam) is an online interactive tool that produces the Knowledge Economy Index (KEI)–an aggregate index representing a country’s or region’s overall preparedness to compete in the Knowledge Economy (KE).
World Bank Knowledge Economy Index -- Ireland had a No. 11 rank in both 2000 and 2012.

Finfacts.ie
29
http://siteresources.worldbank.org/INTUNIKAM/Resources/2012.pdf
6) IMD's annual World Competitiveness Yearbook 2012 says its criteria can be hard data, which analyse competitiveness as it can be measured (e.g. GDP) or soft data, which analyse competitiveness as it can be perceived (e.g. Availability of competent managers). Hard criteria represent a weight of 2/3 in the overall ranking whereas the survey data represent a weight of 1/3.
Ireland has a 20th ranking. It had a ranking of 7 in 2001.
http://www.imd.org/news/IMD-announces-its-2012-World-Competitiveness-Rankings.cfm
http://www.forfas.ie/media/ncc071220_international_competitiveness_review1.pdf (2001)
7) World Economic Forum's annual Global Competitiveness Report 2012/2013 uses 12 indicator categories, including innovation.
Ireland has a 27th ranking. It had a ranking of 11 in 2001.
http://reports.weforum.org/global-competitiveness-report-2012-2013/
http://www.forfas.ie/media/ncc071220_international_competitiveness_review1.pdf (2001)
8) In December 2011, the OECD reported that Switzerland topped for the first time the OECD fixed broadband ranking, with 39.9 subscribers per 100 inhabitants, followed closely by the Netherlands (39.1) and Denmark (37.9). The OECD average was 25.6. Ireland was at 22.2.
http://www.oecd.org/internet/broadbandandtelecom/broadbandportal-pressrelease-dec2011.htm
In 2011, the Economist Intelligence Unit (EIU) launched its gBBI (government broadband index) to assess countries on the basis of government planning, as opposed to current broadband capability.
The EIU said that overall, the developed South-east Asian countries (Japan, South Korea and Singapore) are at the forefront of the move towards near-ubiquitous high-speed broadband. All three countries have official targets of providing 1Gbps services to more than 90% of households within two to five years.
The EIU produces a subscription report. In a summary table here of the top 14 countries for high speed access, South Korea, Japan, Singapore, Sweden and Finland head the rankings and Greece is in 14th place.
http://www.eiu.com/Handlers/WhitepaperHandler.ashx?fi=Broadband_executive_summary.pdf&mode=wp&campaignid=broadband2011
9) The Global Innovation Index (GII) 2012 produced by INSEAD and the World Intellectual Property Organisation (WIPO), ranks 141 countries across more than 80 metrics.
Switzerland is in the lead and Ireland has a 9th rank, ahead of the United States!
Ireland's technology intensive exports from the foreign-owned sector are not indicative in itself of an innovation culture.
The Economist says the "problem is that the model has so many inputs that the weak signals interfere with the stronger ones. Why should 'government's online service' or 'applied tariff

Finfacts.ie
30
rate' or 'paid-for' newspaper daily circulation correlate with innovative ideas? Wouldn't this data dilute things like 'royalty/license fee receipts' or published scientific articles, which are probably robust measures?"
The top five countries are Switzerland, Sweden, Singapore, Finland and the UK.These countries just don't correspond well with people's daily experience of technology.
The magazine says: "Close your eyes, dear reader, and empty your mind. Now open your eyes and look around at all the innovative things that surround you: computers, televisions, smart phones, hybrid cars, planes, medical equipment, new drugs, Facebook and Twitter, clean water in Africa, 3D printing, car-sharing, self-driving cars, e-books. The list goes on and on. Now think of where they came from - - and where you'd like to set up a startup if you had the world's next killer idea.
America, the epicenter of many of the newest things, comes tenth in the ranking. Japan (which pioneered solar panels, hybrid cars and extraordinary new ceramic materials for planes) doesn't make the top ten. Nor does South Korea, whose celebrated Samsung is the world's top maker of mobile phones, flat-panel televisions and flash memory chips, among other things. Instead, Hong Kong with a population of 7m (compared with America's 300m, Japan's 127m and South Korea's 48m) comes out ahead, at number eight. But what innovation has come out of Central or Happy Valley other than new methods to finance Chinese corporations or new ways to lose one's wealth at the Jockey Club?"
"...the index is misnamed. It is meant to measure the 'enabling environment' for innovation, rather than the product itself. To do this, the indicators are adjusted for population or GDP."
http://www.economist.com/blogs/graphicdetail/2012/07/charting-innovation
http://www.globalinnovationindex.org/gii/main/fullreport/index.html
10) Doing Business 2012, the World Bank index on ease of doing business in 183 countries is a useful measure of the "enabling environment" for innovation.
In Italy for example, Mario Monti, the prime minister, has targeted the obstacles that have been faced by entrepreneurs starting a business in his country.
Ireland has a 16th ranking (the original rank was 10
th and it was revised up in ‘Doing Business
2013'.)
Greece is at 100 with Yemen at 99 and Papua New Guinea at 101.
Italy is at 87 with Mongolia, a communist ruled country until 1990, at 86 and Jamaica at 88.
‘Doing Business 2013,’ published in late October 2013, gives Ireland a 15th rank.
http://www.doingbusiness.org/
11) University rankings 2012 Ireland has no university among the top 100 universities in the 2012 Times Higher Education Rankings. In 2012, University College Dublin (UCD) has dropped from 159 to 187 and Trinity College Dublin (TCD) rises from 117 to 110. TCD has a 38th ranking in Europe, which it shares with the University of Sheffield and the University of Sussex, compared with ETH Zürich – Swiss Federal Institute of Technology

Finfacts.ie
31
Zürich, Continental Europe's top university, in 4th position. The Times Higher Education World University Rankings of 400 institutions uses 13 separate performance indicators to examine a university’s strengths against all of its core missions -- teaching, research, knowledge transfer and international outlook. http://www.timeshighereducation.co.uk/world-university-rankings/2012-13/world-ranking The QS World University Rankings is an annual league table of the world’s top 700 universities. The rankings are based on four key pillars -- research, teaching, employability and internationalisation. TCD is the only Irish university to be ranked in the top 100 at 67. UCD is at 131. TCD compares with ETH Zürich – Swiss Federal Institute of Technology Zürich, which has a world ranking of 13. TCD had a ranking of 49 in 2008. UCD was at 108. http://www.topuniversities.com/university-rankings/world-university-rankings/2012
7. Clusters and venture capital
Michael Porter, the Harvard Business School academic and author of the 1990 book, 'The Competitive Advantage of Nations,' has defined a cluster as, "A geographically proximate group of interconnected companies and associated institutions in a particular field, linked by commonalities and complementarities (external economies)." The themes of the book are described in a Harvard Business School article.
http://www.isc.hbs.edu/pdf/20080122_EuropeanClusterPolicy.pdf
Prof Porter told BusinessWeek that "the more there are no barriers, the more things are mobile, the more decisive location becomes. ..Now that globalisation continues to power forward, what has happened is that clusters must become more specialised in individual locations. The global economy is speeding up the process by which clusters get more focused. There is a footwear cluster in Italy, for example, where they still produce very advanced products. The design, marketing, and technology still are in Italy. But much of the production has shifted to Romania, where the Italians have developed another cluster. All of the production companies actually are Italian-owned. Taiwan has done the same by shifting production to China. The innovation is in Taiwan, but its companies are moving aspects of their cluster that don't need to be in Taiwan."
"I think the US is facing some very serious challenges. But the most important drivers of competitiveness are not national. They are regional and local. National policies and circumstances explain about 20% to 25% of why a regional economy is doing well. What really matters is where the skills and highly competitive institutions are based. Some of these assets take a very long time to build. But competitiveness essentially is in the hands of regions."
Recent research on Danish entrepreneurs by Olav Sorenson of the Yale School of Management and Michael Dahl of Aalborg University, Denmark, showed that location preference helps venture performance through entrepreneurs' ability to exploit their understanding of their home regions and their social connections within them, or hurts performance due to remaining close to family and friends when more favourable economic conditions exist elsewhere.
"Ventures perform better - - survive longer, generate greater annual profits and cash flows - - when their founders locate them in their home regions where they have deep roots of family

Finfacts.ie
32
and friends," said Sorenson. "The effect we found is substantial. It's similar in size to the value of having prior industry experience."
Michael Porter argues that it is not what a country or region produces, but how productively that leads to growth and competitiveness.
Douglas Woodward in his paper, 'Porter’s Cluster Strategy Versus Industrial Targeting' (2005), said that to analysts and observers of regional innovation networks, the cluster case that most commonly comes to mind is California’s high-technology Silicon Valley but "surprisingly, Porter’s lectures and writings point to California’s wine-producing Napa Valley as a primary example of an innovating cluster."
Woodward says: "The central Porter hypothesis is that competitive, productive firms require a set of supportive microeconomic conditions to thrive, regardless of natural endowments.
Porter’s emphasis on the importance of raising regional productivity (making regional products and services better, not just cheaper) is readily accepted by policy makers. He maintains that the best way to raise firm competitiveness is through encouraging collaborative, localised clusters of firms, with private-sector councils of competitiveness taking the lead from government. Clusters are geographic concentrations of interconnected companies in related industries, but also encompass specialised suppliers, financial institutions, universities, and trade associations. Porter takes spatial clustering, no doubt descriptive of successful regional development, and makes it the prescriptive policy for revamping regional development."
Many OECD countries and regions are combining clusters policies and specialisation strategies. For example, the states of Berlin and Brandenburg (innoBB) have developed a joint innovation strategy to focus public support on five clusters: health care; energy technology; transport, mobility and logistics; optics; and ICT (information and communication technology)/media/creative industry.
This inter-regional strategy focuses on “entrepreneurial discovery”, on market opportunities through intra-cluster co-operation and on the development of innovative technologies. It has developed an inter-regional structure for venture capital, the Business Angels Club Berlin-Brandenburg e.V. to support entrepreneurs and strengthen innovative enterprises.
OECD, Science, Technology and Industry Outlook 2012, OECD, Paris.
An OECD working paper, Temouri, Y. (2012), 'The Cluster Scoreboard: Measuring the Performance of Local Business Clusters in the Knowledge Economy,' OECD Local Economic and Employment Development (LEED) Working Papers, presents results on the entrepreneurship performance of 80 selected local enterprise clusters in two key innovative sectors with important roles in local economic growth; high-technology manufacturing (HTM) and knowledge-intensive service activities (KISA).
Cluster performance is estimated through six indicators and a composite index that crystallises different information in one single ranking. The six indicators measure: i) entrepreneurialism (share of young firms out of the total); ii) employment growth; iii) turnover growth; iv) profitability; v) liquidity ratio; vi) solvency ratio.
The paper says that the top performing clusters in the pre-recession period were the Madison research district and Silicon Valley in the United States, while during the recession the two leading clusters in HTM and KISA were the Coimbra biotech cluster in Portugal and Daedoek science town in Korea.
The author says that in the pre-recession period leading clusters were found in traditional advanced economies such as the United States, Germany and Sweden, while during the

Finfacts.ie
33
recession well-performing clusters came from a more mixed background that includes countries severely struck by the crisis such as Portugal and Ireland.
Comparing Silicon Valley with a small cluster in Portugal has its limitations while a young firm in an Irish cluster may well be a unit of a well established US firm.
Some 3,118 US companies received total venture capital investment of $28.8bn in 2011. After years of taking on 1,000 or more new companies each year, the industry had dipped to a post-bubble low in 2009, when it funded 797 first time companies. That count increased in 2011 to 1,173 according to the 2012 NVCA Yearbook 2012 produced by Thompson Reuters.
Venture capitalists in Europe put €4.4bn (US$5.9bn) into 1,012 deals for European companies in 2011, a 14% decline in investment and 19% fall in deal flow from 2010, according to Dow Jones VentureSource. This marks the lowest annual deal count for Europe since VentureSource began tracking the region in 2000.
The UK remained the favourite destination for venture capital investment in Europe in 2011. Companies in the U.K. raised €1.2bn for 274 deals, a 36% decline in investment and 17% decline in deals.
France came in second place as companies raised €728m for 217 deals, a 15% decline in investment and 18% decline in deals.
Germany came in third as companies raised €475m for 120 deals, a 23% decline in investment and 26% decline in deals.
The US still maintains an approximately 70% share of the global VC market, followed by the UK, Beijing and Shanghai, based on Dow Jones VentureSource data in 2012 reported by Ernst & Young. However, a later survey in Israel (see below) shows that the country was ahead of the UK in 2011.
Ernst & Young said that median pre-money valuation (a term used in private equity or venture capital that refers to the valuation of a company or asset prior to an investment or financing) was $21m in the US in 2011 and $6.0m in Europe.
The median round size in Europe in 2011 was US$2.7m (up from US$2.6m in 2010). In the US it was $5m up from $4.3m in 2010.
In 2011, China saw 382 new VC funds raise a record $28.2bn for investments into Chinese VC-backed companies.
In the US, Europe and Israel, the main exit route for VC-backed companies is acquisitions (M&A), representing more than 90% of all exits. Furthermore, VC firms are also selling companies to private equity firms as a third path to liquidity.
Israel attracts far more venture capital per person than any other country - - $170 in 2010 to America's $75 (see chart 1 in article). http://www.economist.com/node/21543152
According to an IVC-KPMG survey, in 2011 Israeli companies raised $2.14bn - - 25% came from Israeli venture capital funds. The remainder came from other Israeli and foreign investors.
Some 159 Irish technology companies raised €274m from investors in 2011.
This compares with funds raise of €310.2m that were raised in the same period of 2010.
“The Irish venture capital community continues to be the main source of funding for Irish high-tech SMEs,” commented Regina Breheny, director general, IVCA (Irish Venture Capital Association). She said that since the onset of the credit crunch in 2008, 547 Irish SMEs raised

Finfacts.ie
34
venture capital of €1.1bn. “These funds were raised almost exclusively by Irish VCs who during this period supported the creation of up to 20,000 jobs.
However, research published by University College Dublin in 2011, showed that in 2009 total direct employment by indigenous companies backed by venture capital was 9,733, an increase of 36% on the levels employed in 2007.
Irish venture capital funds supported by Enterprise Ireland, a state agency, invested a total of €60m last year.
1) Silicon Valley
Stanford University classmates Bill Hewlett and Dave Packard founded Hewlett-Packard (HP) in 1939. The company's first product, built in a garage, part of Packard's rented house on 367 Addison Avenue in Palo Alto, California, was an audio oscillator - - an electronic test instrument used by sound engineers. One of HP's first customers was Walt Disney Studios, which purchased eight oscillators to develop and test an innovative sound system for the movie 'Fantasia.'
The simple one car garage became the HP workshop and a little shack out back became Bill Hewlett's home. In 1989, California named the garage "the birthplace of Silicon Valley" and made it a California Historical Landmark.
In 1976, Steve Jobs and Steve Wozniak co-founded Apple in Jobs' family garage in Los Altos, California.
However, the myth of the startup in a garage is not the full story about Silicon Valley, the region south and southeast of San Francisco Bay in Northern California. The Silicon Valley Index says the geographical boundaries of Silicon Valley vary. Earlier, the region’s core was identified as Santa Clara County plus adjacent parts of San Mateo, Alameda and Santa Cruz counties. However, since 2009, the Silicon Valley Index has included all of San Mateo County in order to reflect the geographic expansion of the region’s driving industries and employment.
Don Hoefler, an electronics journalist is credited with coining the name 'Silicon Valley' in 1971. He had begun his career in electronics journalism as a publicist for Fairchild Semiconductor, which had pioneered the development of the silicon microchip.
With a population of 3m and 37% foreign-born, Vivek Wadhwa of Duke University and a team of researchers in a study of US engineering and technology startups in the period 1995-2005, found that there was at least one immigrant key founder in 25.3% of all engineering and technology companies established in the US between 1995 and 2005 inclusive. "We estimate that together, this pool of immigrant-founded companies was responsible for generating more than $52bn in 2005 sales and creating just under 450,000 jobs as of 2005." Over half (52.4%) of Silicon Valley startups had one or more immigrants as a key founder, compared with the California average of 38.8%. In Silicon Valley, Indian immigrants founded 26% of these startups - - more than the next four groups from Britain, China, Taiwan, and Japan combined.
http://papers.ssrn.com/sol3/papers.cfm?abstract_id=990152,
http://www.kauffman.org/entrepreneurship/foreign-born-entrepreneurs.aspx
New research published in October 2012, showed that that the proportion of immigrant-founded companies nationwide has slipped from 25.3% to 24.3% since 2005. The drop is even more pronounced in Silicon Valley, where the percentage of immigrant-founded startups declined from 52.4% to 43.9%.

Finfacts.ie
35
From the 107,819 engineering and technology companies founded in the last six years, the study examined a random sample of 1,882 companies in a nationwide survey. Of those companies, 458 had at least one foreign-born founder.
The exceptions to this downward trend were immigrants from India. Although founders in the study hailed from more than 60 countries, 33.2% of them were Indian, an increase of 7% in 2005. Indians, in fact, founded more of the engineering and technology firms than immigrants born in the next nine immigrant-founder countries combined.
After India, immigrant founders represented China (8.1%), the United Kingdom (6.3%), Canada (4.2%), Germany (3.9%), Israel (3.5%), Russia (2.4%), Korea (2.2%), Australia (2.0%) and the Netherlands (2.0%).
Silicon Valley has a workforce of about 1.3m and it added 42,000 jobs in 2011 but incomes outside high-tech fell while public services deteriorated due to California's dysfunctional governance system that makes it easy to spend but hard to tax. San Jose, a city of almost a million people has shed a fifth of its workforce in 4 years.
The number of businesses leaving Silicon Valley exceeded the number moving to the region every year from 1995 to 2010, with a majority of the movement staying within the state. The share of businesses moving out of Silicon Valley but remaining in California increased from 54% in 2009 to 77% in 2010. Silicon Valley Index 2012
A 2011 survey reported that there were 7,460 ICT (information and communication technology) establishments in the cluster employing 215,609 workers, with an average wage of over $182,000. The average employment is 29.
The Silicon Valley Index 2012 puts high-tech employment including life sciences at about 360,000.
Public procurement is important in the early years of a cluster's development and Silicon Valley was no exception.
The key developments in the 1950s were when William Shockley, co-inventor of the transistor seven years earlier, founded Shockley Semiconductor Laboratories in Santa Clara Valley in 1955. He recruited 12 young scientists dedicated to the use of germanium and silicon for transistors -- his "PhD production line." Shockley won the Nobel Prize¨ for Physics in 1956. However, his management style prompted 8 young scientists to leave company and establish Fairchild Semiconductor in 1957.
The so-called "Traitorous Eight" developed a method of mass producing silicon transistors. The group included Gordon Moore and Robert Noyce who were later the co-founders of Intel, in 1968.
The new company was profitable in six months with the help of its first sale: an order from IBM for 100 transistors at $150 apiece. The order was shipped in a Brillo scouring pad carton, picked up at a local supermarket.
In 1958, Robert Noyce developed the monolithic integrated circuit...a miniaturized electrical circuit on a fingernail-size wafer of silicon. It was the birth of the microchip.
Business from the Pentagon for weaponry and from NASA for the space program, helped to make the price of microchips commercially viable.
John Harpur, author of the book, 'Innovation, Profit and the Common Good in Higher Education - - The New Alchemy,' Palgrave Macmillan (2010), writes that Gordon Moore did not hold Stanford University to have been essential to the formation of Silicon Valley.

Finfacts.ie
36
Harpur says Moore emphasises "the relative uniqueness of their technology and 'the profound technological opportunity' that was there for exploitation. With respect to duplicating success, Moore argues that clusters of small startups as envisioned in many technology parks will miss a key feature of Silicon Valley dynamics, viz the presence of a mix of large and small firms. The capacity of a large firm in a new technology to generate more ideas and technology opportunities than it can exploit puts small startups in a highly favourable position."
Silicon Valley now has several competitors across the US.
2) Israel: There have been many attempts to clone Silicon Valley but the results have not been impressive.
Israel is the exception and like the original, it's not easy to replicate its success.
With a population that has grown to almost 8m, developing a country in a semi-arid region while in a constant state of war, has promoted innovation.
Compulsory military service for both young men and women coupled with work in the development of military technology gave the country a strong research base.
So when the Soviet Union collapsed in 1991, and Israel became the home for 1m new migrants, including the greatest short-term movement of intellectual capital in history, the country took advantage of a significant opportunity. Israel's overall population increased by 20%. Nearly 40% of the immigrants held academic degrees, many of whom were scientists, engineers and specialised technicians.
Dan Shechtman of the Technion Institute of Technology won the Nobel Prize in Chemistry in 2011 and he was the fourth Israeli science laureate in the past decade.
The government established the Yozma (Initiative in Hebrew), a state fund of funds to promote venture capital funding with investments from US firms.
A thriving independent local VC industry began as growth of the US high-tech sector was accelerating.
The OECD's 'Science, Technology and Industry Outlook 2012' says Israel is a small economy with world leadership in dynamic high-technology sectors such as software. The global financial crisis only briefly slowed its growth. With BERD (business enterprises expenditure on R&D) of 3.51% of GDP in 2010 Israel led OECD countries. GERD (gross domestic expenditure on R&D) excluding defence, was 4.25% in 2010 -- also the highest of the 34 mainly developed countries in the OECD, which had an average of 1.98%. Israel's share in triadic patents per GDP is at the upper middle level and trademark registrations are above the OECD median. Its share of top R&D investors corresponds to the OECD’s median. For entrepreneurship Israel leads the OECD in venture capital). The national ICT infrastructure is in the medium range. With 45% of the adult population with tertiary education, Israel stands among leading OECD countries.
Israel has a strong science base and its share in the top 500 universities is among the OECD leaders.
High-tech exports from Israel are valued at about $18.4bn a year, making up more than 45% of Israel’s exports, according to the Central Bureau of Statistics.
Eighty-five Israeli companies were acquired or merged in 2011, 27% more than the 67 companies that were acquired or merged in 2010, and four% more than the previous five-year average of 81. The average deal size increased nearly 85% to $60m from $32.5m in 2010. This increase in deal size reflects a relatively high number of deals above $100m, with 18% of

Finfacts.ie
37
the number of deals accounting for 75% of total M&A deal proceeds. Five M&A deals exceeded $300m and one deal – the acquisition of online advertising company MediaMind by DG – surpassed the $500m mark.
Israel's ministry of finance said in 2011 (PowerPoint) that at 280,000, the high-tech sector accounted for 14% of total employees in the business sector.
Microsoft’s R&D Center houses 550 engineers and while there are now 45 R&D centres globally, only three are considered “strategic” ones outside the US. China and India host the other ones.
Besides Microsoft, up to 220 R&D centres of multinational corporations employing over 50,000 Israelis, include Alcatel, Deutsche Telecom, Cisco, Google, HP, Merck, IBM, and Intel.
In the second quarter of 2012, there were 199 new high-tech startups, according to a report by the Israel Advanced Technology Industries association compared with 114 startups that were founded in each of the preceding two quarters.
In the book 'Startup Nation' (2009), authors Dan Senor and Saul Singer wrote that each year as Europe created 700 to 800 high-tech startups, Israel added 500. After the United States, Israel is by far the second largest generator of startups.
3) Cambridgeshire, Oxfordshire and Silicon Roundabout
The area around Cambridge University in the UK, known as Silicon Fen is Europe's oldest high-tech cluster.
The Financial Times said in 2006 that a comparison between Cambridgeshire and Santa Clara County in California showed that, for the same geographic size, economic output in Silicon Fen was six times smaller and average earnings less than a third of Silicon Valley.
David Marlow, chief executive of the East of England Development Agency, said in the FT: “The east of England is the UK’s ideas region. We have world-leading research facilities and 23% of all UK research and development spend is here. But we cannot be content just to generate ideas . . . while Cambridge has rightly gained international acclaim for cutting-edge research and scientific innovation, its high-tech firms remain predominantly small."
There are about 48,000 high-tech jobs in 1,400 firms in the cluster:
40% of firms are micro and employ 1-5 people; 20% of firms are micro and employ 6-10 people; Only about 2.5% of firms employ more than 200 people.
http://cambridgearea.files.wordpress.com/2011/07/cambridge-cluster-mannheim-web-jul20111.pdf
ARM plc is the most successful company to develop in the cluster.
In 1990, Advanced RISC Machines (ARM) spun out of Acorn and Apple's collaboration efforts with a charter to create a new microprocessor standard.
ARM has only 2,000 staff as it licenses its technology to overseas producers that make chips that are used in devices such as mobile phones.
Its value in September 2012 was £8bn ($13bn).

Finfacts.ie
38
Revenues were £492m in 2011 and profit before tax was £157m.
Warren East, ARM CEO, told the BBC that the UK needs to create a better environment in which technology companies can flourish. ARM works with over 1,000 companies around the world - - but very few are based in the UK.
He said he gets frustrated by what he sees as an anti-technology and anti-business culture in the UK - - and this needs to change, starting with the way science and technology is taught in schools. http://www.bbc.co.uk/news/business-18285673
Autonomy, the business software company, that was hastily acquired by HP for $10.3bn (£6.6bn) in 2011, was founded by Irish-born Mike Lynch in 1996.
Lynch had completed his Cambridge University doctoral thesis on the work of Thomas Bayes, the 18th century English mathematician. Over two decades his company grew to be the UK’s most valuable listed software business.
However, it also had only 2,000 staff when it was acquired.
The FT reported that a former Autonomy employee said that following the HP takeover, the culture of endless conference calls and form-filling was “like being water-boarded.”
Mike Lynch was ousted in March 2012 and the FT said HP had maintained that the problem was not its corporate systems, but Autonomy’s poor management. It was simply a case of Autonomy not making enough sales, they said.
“You cannot miss your numbers by a wide margin at HP and stay here,” one person in the company said. People close to the company indicated that Autonomy fell around 30% short of its sales targets in the quarter ended April.
Oxford University says that while accurate figures for hi-tech companies are hard to come by, Oxfordshire is estimated to be home to 3,500 hi-tech companies employing 45,000 people.
The area around the Old Street roundabout in Shoreditch, East London, known as Tech City or Silicon Roundabout, is estimated to have 3,200 firms and over 48,000 jobs, according to a report published in June 2012.
The report says: "Our interviewees were overwhelmingly male, white, British and highly educated. Most were in their thirties. The firms that they own and run were typically micro businesses (under 10 staff) and most were less than five years old. Over a third of all firms had an international structure of some kind. This is what they told us."
David Cameron, British prime minister, said in November 2010: "Our ambition is to bring together the creativity and energy of Shoreditch and the incredible possibilities of the Olympic Park to help make East London one of the world’s great technology centres."
Bloomberg reports that according to data from Thomson Reuters, 103 Internet startups received global venture capital funding in Germany in 2011, more than in any country except China and the US.
The Berlin Chamber of Commerce reports that 1,300 Internet startups have been founded in the city since 2008, 500 of them last year.
The Economist said that "even in Israel turning tech startups into big companies is difficult. For all the comparisons with Silicon Valley, Israel has not begotten a Hewlett-Packard, an Intel or a Google. Its best companies are often bought by American giants while still in their infancy. The biggest home-grown technology company is Teva, a drugmaker which is listed

Finfacts.ie
39
on NASDAQ, an American tech-oriented stockmarket, with a market capitalisation of $35bn (in September 2012). In information technology the biggest is Check Point, a security specialist founded by veterans of Unit 8200, an elite army-intelligence group. Also on the NASDAQ stock exchange, on which Israel has more companies than any foreign country bar China, it is valued at $11bn -- no minnow, but no whale.
Very young firms have a good deal of support, which is getting stronger. Accelerators, in which entrepreneurs can shape their ideas and meet advisers and investors, are springing up: this week, for example, UpWest Labs, which intends to bring five to ten Israeli startups to Silicon Valley for ten-week stints, began its first programme. As well as meeting helpful people, the hopeful entrepreneurs receive $20,000 in seed money."
In common with other clusters, lack of early-stage venture capital: sums of $1m-2m or so -- is a problem.
Only 29% of venture capital investments in Israel during the first half of 2012 involved early-stage startups, researchers have found. While the percentage of transactions involving younger companies has grown compared to the three previous years, it is still down from 2008, before the global crisis hit, according to research conducted by attorneys Lior Aviram and Limor Peled from the firm Shibolet & Co.
When the industry is stable, first-round investments should exceed subsequent funding rounds, argues Aviram. "But subsequent investment should only go to the best companies," he said. "Since the second half of 2008, the first round of investment hasn't been the largest - or in other words, the industry is shrinking and that is a serious problem."
8. Spinouts
In recent decades, IONA Technologies which was founded in 1991 by three staff members of Trinity College, has been a rare successful university Irish spinout.
In 1995 the company reported revenue of $8.6m and net income of $2.2m and in the same year it signed a $750,000 contract with Boeing's Commercial Airplane Group to supply it with its so-called middleware software. By 2001, IONA had 650 employees and following a loss in 2007, Progress Software of Massachusetts acquired the firm for $162m in 2008. Approximately 90 former IONA employees who joined Progress as part of the acquisition were issued with share options.
In the United States it has been claimed that the "Bayh-Dole Act of 1980 is arguably one of the most influential pieces of legislation to impact the field of intellectual property law in the twentieth century." It "permits a university, small business, or non-profit institution using federal funds for research to produce an invention to retain the title on any patent issued for such inventions." 'Consequences of the Bayh-Dole Act,' David Levenson, Massachusetts Institute of Technology
The Act spurred the promotion of commercialisation of university research in particular.
There were 671 spinout companies from university research created in the US in 2011; 268 in the UK and in 2010, 579 were created in Europe, according to ProTon, a pan-European Association of Knowledge Transfer Offices at third level institutions.
In University College Dublin (UCD) 5 new spinout companies were established in 2011 to commercialise the output of UCD research programmes. This brings to 19 the total number of UCD spin-outs incorporated in the last 5-years.

Finfacts.ie
40
The Swiss Federal Institute of Technology Zurich (ETH Zurich) produced 22 spin-offs in 2011 and a record 110 over the past five years. ETH Zurich has a 13th ranking in the QS World University Rankings 2012 and is the top university in Continental Europe. ETH has a 12th world ranking in the Times Higher Education World University Rankings 2012-2013.
For an MSc in Finance thesis at the London Business School, Alexander Schläpfer and Ingvi Oskarsson produced a study of 130 spinouts, concentrating on the economic impact and success of those created by ETH Zurich. The study’s results revealed that ETH Zurich spin-offs are more successful than other startups in Switzerland and highly beneficial to the local economy.
More than seven new jobs were created by every ETH Zurich spin-off, resulting in a total of 918 positions - - nearly twice what the average Swiss startup creates. Altogether, ETH Zurich spin-offs created approximately 1,500 direct and indirect jobs between 1998 to 2007.
The aggregate survival rate for ETH Zurich 1998-2007 spinouts was 88.5% (115 out of 130). "Among the total population of 130 ETH Zurich spin-offs, we have found evidence of Venture Capitalist or Business Angel backing in 34 companies (26.1%) with a total of 80 investment rounds."
“More and more spin-off companies are being generated by academia and other research institutes all over Europe. They are learning the game -- and not only in the most advanced European countries,” said ProTon board member Andrea Piccaluga, a professor of innovation management at the Scuola Superiore Sant’Anna in Pisa, Italy.
The real test, of course, is how many of Europe’s promising tech spin-offs will grow into globally competitive companies. The overall survival trend in Europe is too recent to judge, said ProTon’s Piccaluga. He figures that for every 100 spin-offs, there will be only ten success stories. “That is not a failure,” he says. “That is the price we have to pay to produce ten stars.”
The Department of Business, Innovation and Skills said that UK universities formed one new company per £24m of research funding during 2010-11. This far exceeds the record of US universities (one new company per £56m). Enterprise Ireland, an Irish public agency, claims that: "Although the Technology Transfer System in Ireland is relatively young, it produces results which compare favourably with international data."
However, these British and Irish claims imply that the outcomes are comparable.
The Massachusetts Institute of Technology (MIT) helped to spin-off 26 startups in 2011. However, the number of companies started venture capitalised and/or with minimum of $500K of other funding was 16.
http://web.mit.edu/tlo/www/about/office_statistics.html
http://web.mit.edu/tlo/www/iapevents/startup.html
Declan Curran, Chris van Egeraat, and Colm O’Gorman in an Irish paper, 'New Entrants and Inherited Competence: The Evolution of the Irish Biotech Sector' (2011), say that while the Irish biotech industry comprises a similar number of university and private sector spin-offs, and these two cohorts have both generated increasing quantities of patentable research in recent years, "we show that in one key respect - - the attraction of investment funding - spin-offs from Ireland’s most successful indigenous biotech firm, Elan, have enjoyed a superior performance relative to the spin-offs that emerged from Irish universities. For example, for the period 2000-2010 five Elan spin-offs attracted twice as much venture capital funding than the twenty-one university spin-offs in receipt of venture capital over this same period. We argue that innovation competence may be at least as important as technical R&D competence for spin-off success, and that the spin-off firms from Elan have inherited substantial business/industry knowledge and high innovation competence from a highly competent

Finfacts.ie
41
parent. We also find that private sector startups which were not spin-offs fared very poorly in terms of attracting venture capital."
Tim Minshall and Bill Wicksteed in a UK paper, 'University spin-out companies: Starting to fill the evidence gap' (2005), say that: "It is arguable that, in the recent past, university spin-outs have been given too high a profile in policy pronouncements. Because they have been ‘in fashion’ spin outs have been seen, sometimes uncritically, as a ‘good thing’. Whilst there is a strong case for moving towards a more cautious appreciation of their contribution, it would be unfortunate if the fashion pendulum were to swing back too far the other way. Direct financial benefits to universities may well only accrue in the long term and the distribution of financial benefits may well be heavily skewed towards a few spin outs. There are, however, as this report has instanced, a number of valuable positive spillovers to both regional and national economies that are likely to be felt more immediately."
Einar Rasmussen, Oxana Bulanova, Are Jensen and Tommy Clausen, in a Norwegian paper, 'The Impact of Science-Based Entrepreneurial Firms -a Literature Review and Policy Synthesis' (2012) say that a "2009 evaluation of the FORNY-programme (which focuses on the commercialisation of research) included an analysis of Norwegian SBEFs (science-based entrepreneurial firms) based on a survey and secondary data (Borlaug et al., 2009a). These analyses show that the FORNY grant-supported project portfolio from 1996-2007 counts 295 new companies started on the basis of technology that had been developed in Norwegian research institutions. In 2008, about 200 of these firms still existed with a total turnover of about NOK 900m (€120m) and 700 employees. Most of these firms are small, and only about 5% display patterns that make them likely to become high-growth firms (Borlaug et al., 2009a)."
The authors add: "Although many studies asserts that SBEFs play an important role for technology transfer or regional development, very few studies provide insights about what leads to successful outcomes on these dimensions. There are no large sample studies that have studied the links between startup conditions and the societal impact of SBEFs...It seems fair to say, however, that most studies rely on rather simple measures, often selected on the basis of data availability. SBEFs have long development paths and successful firms typically remain small for a rather long time period before they start to grow. To be able to capture this development the preferred option is to measure the impact over a long period of time, but such data are not readily available."
9. Discussion
“Ireland by 2013 will be internationally renowned for the excellence of its research, and will be to the forefront in generating and using new knowledge for economic and social progress, within an innovation driven culture.”
Almost a decade ago, the Enterprise Strategy Group, headed by industrialist Eoin O'Driscoll, said in the report, 'Ahead of the Curve - Ireland's Place in the Global Economy': “Until now, Ireland’s principal enterprise strengths have been in the operational aspects of manufacturing and services, rather than in markets and product development. This is particularly true of the foreign-owned sector, which accounts for most of our exports and which, for the most part, produces goods that were designed elsewhere, to satisfy market requirements that were specified elsewhere, and sold by other people to customers with whom the Irish operation has little contact and over whom it has little influence."
It was unusual for an Irish official report to present the facts absent the spin that pervades enterprise policy.
The group wished to have a focus on a) developing expertise in international markets, to promote sales growth b) building technological and applied research and development (R&D) capability, to support the development of high-value products and services.

Finfacts.ie
42
The report said: "Despite many excellent individual company performances, few of our indigenous industry sectors have achieved strong growth in exports over the past 10 years."
Eight years later, the same point could be made.
Foreign firms are still responsible for about 90% of tradeable exports. Indigenous tradeable exports amounted to €15.2bn in 2011, according to Enterprise Ireland. Total exports were valued at €164.3bn (Page 4). This total is exaggerated by profitshifting and booking of foreign end user services revenues as Irish exports.
Almost two-thirds of Irish indigenous exports are to English speaking countries, led by the UK.
Both Ireland's enterprise and exports' strategy are all over the map, akin to a company with too many products and markets with no profit data to guide focus.
Policymakers often deliberately conflate foreign-owned and indigenous exports when for example discussing export potential to BRIC countries.
In June 2006, the Irish government launched the 'Strategy for Science Technology and Innovation 2006-2013' report where targets were set for university scientific research and increased R&D spending by both foreign-owned and indigenous firms.
A decade before, there were high hopes that a significant indigenous high-tech sector could be developed. Software, e-learning and payment processing companies were established to meet perceived market demands. By 2006, the survivors of the dot.com bust of 2000/2001 were struggling and the government was persuaded that coupled with collaboration with the enterprise sectors, basic research in areas such as microbiology, nanotechnology and neuroscience, could produce 'world-class' companies that would pick up the slack from the hoped-for soft-landing of the then out-of-control property bubble.
In 2006, the US publicly traded biotech industry had in aggregate never reported a profit in 40 years. In 2008, it reported a profit, mainly because of the performance of a small number of industry giants.
Today, the Irish internationally trading economy remains essentially an entrepôt one, that continues to be dependent on foreign firms, mainly American. The favourable tax regime, the existing positive experience of using Ireland as the main European base for servicing the region's markets, appears to be more important than doing R&D in Ireland.
For big companies such as Google and Microsoft, the facility of using Ireland with its benign Revenue authorities, as part of an international tax evasion/avoidance strategy, is also more valuable than issues such as R&D.
The term 'evasion' is used as posting multi-billion dollar or euro charges in annual accounts to offset revenues that have arisen elsewhere, would not be expected to be approved in respect of a domestic company, without some serious probing.
The concept of a 'knowledge economy' for Irish policymakers was one where 'high quality' jobs for third-level graduates would become significant in the economy.
However, the model of globalisation where there would be knowledge economies in the West while low-wage manufacturing would dominate in regions such as Asia, is already out of date.
For example, the boom and bust for American, Chinese and German firms in the emerging solar industry, shows that there are no easy pickings in green energy for even knowledge economies. For example, Denmark’s wind energy sector is also struggling.

Finfacts.ie
43
The Economist Intelligence Unit says that research from Zinnov, an India-based consulting firm, shows that the number of MNC (multinational companies) R&D centres in China and India grew almost fourfold between 2001 and 2010, from 557 to 2,009.
Coming of age: Asia's evolving R&D landscape (2012)
In 2010, the total number of Chinese students and scholars attending foreign universities or research institutes rose to 284,700, thirteen times more than in 1999. Chinese students comprise the highest share of foreign students in the US, the European Union and Japan.
The World upside down, China’s R&D and innovation strategy (2012).
The data presented above shows that there is no evidence of a significant rise in innovation activity by indigenous firms reflected in enterprise statistics, while jobs in both the foreign-owned and indigenous high-tech and life sciences sectors have been static in the past decade; patent activity by both foreign-owned and indigenous firms has been low over the past decade.
There is also an inconvenient truth that the Irish are conservative and have been slow to embrace the web.
In 2007, household broadband Internet access in Israel was at 76% and 67% in Denmark. It was 30% in Ireland. The comparable figures for 2011 were 93, 84 and 65%.
As recently as May 2011, Taoiseach Enda Kenny (prime minister) said that 40% of Irish SMEs didn't have a website.
In 2007, Danny Breznitz, a professor at the Georgia Institute of Technology (the Georgia Tech) said on a visit to Ireland to provide advice to Enterprise Ireland, the State's enterprise agency for indigenous firms in the internationally traded sectors, that Ireland's research infrastructure was too narrow in its focus and may not be sustainable. He said Ireland was not creating enough new businesses, and when new businesses are set up, the financial supports were not there to keep them innovating - - this was before the economic crash!
Breznitz feared that Irish research was too narrowly focussed on biotech and the ICT (information, communications and technology industries).
Prof Breznitz said that if a country wants sustained economic growth it has to focus on innovation, not only on the research side but on the commercialisation and the growth of productivity.
In 2006, venture capital investments in Irish business amounted to €192m while investment in domestic and overseas commercial property was valued at €11bn.
In the period 2002-2011, the State's Science Budget has amounted to €23.7bn in constant price terms. The total S&T (science and technology) spending is estimated to have been €2.37bn in 2011. Education and Training was at €1.03bn. The next largest category was Research and Development (€912m), followed by Technical Services (€236m), Other S&T activities (€116m) and finally Technology Transfer (€79m).
The Science Budget amounted to €1.2bn in 1999.
In recent years in a clear admission of the failure of the science policy to have an impact on job creation, four official taskforces have been tasked with finding a winning formula.
Amar Bhidé, argued in 'The Venturesome Economy,' which was published in 2008, that while innovation typically comes from scientists and engineers, the obsession with the number of

Finfacts.ie
44
US doctorates and technical graduates compared with the rising numbers in China and India, is misplaced because the “high-level” inventions and ideas cannot be easily contained within national borders and Asia cannot prevent America from capitalising on their inventions with better business models.
He said many players - - entrepreneurs, managers, financiers, salesmen, consumers, and not just a few brilliant scientists and engineers - - have kept the US at the forefront of the innovation game. As long as their venturesome spirit remains alive and well, America need not fear advances abroad. 'The Venturesome Economy' explains why - - and how it can keep it that way.
Bhidé said that his study shows how mid-level players combine and extend higher-level innovations. The VC-backed businesses use different people and procedures than the typical lab doing high-level research: They employ a much smaller proportion of PhDs in their technical staff, and their overall workforces contain a larger proportion of managers and sales and marketing staff. In contrast to the physicists who developed the modern transistor inside the precincts of Bell Labs, the development teams of many of the VC-backed businesses he studied had a close, ongoing relationship with users. Communication and persuasion were as crucial as technical virtuosity, and the technical tasks themselves involved more ad hoc improvisation than classical scientific experimentation.
According to Declan Jordan, an economics lecturer at University College Cork: “A census of post-doctoral researchers that left Science Foundation Ireland-funded projects in 2007 found that 9% went to work in science and engineering businesses. A further 10% went to work in industry in other sectors. The most common destination, at 38%, for these post-doctoral researchers was another post-doctoral position on a different research project.
That so few of these researchers made the switch to related industry may be a symptom of a large cohort of doctoral or post-doctoral researchers pursuing research in areas of basic science that have no obvious interest to industry in the short-term.”
Seán Baker, the chairman of the Irish Software Association, in 2009 told a Dublin meeting of researchers and software executives that research needs to involve commercial input from a much earlier point in the process. He also warned academic researchers that overvaluing intellectual property inhibited commercialisation.
Dr Baker, a co-founder of Iona Technologies, called for closer collaboration between universities and industry, stressing the need to focus on commercially viable projects rather than “curiosity-based” research. There was a need to show a tangible return on funds invested by the government in R&D to avoid a “knee-jerk reaction in today’s economic climate” that might threaten future funding.
He criticised the State’s approach to driving innovation. “We don’t have a good handle on a strategy for R&D. You can’t point to one place and find someone who owns the strategy.”
The strategy is confusing because it covers both the foreign-owned sector, dominated by US multinational giants and the indigenous sector.
Another inconvenient truth reported above is that the Irish have not been very successful at exporting. Coupled with the fact that high-growth firms are not typically in the high-tech sector, why is this sector at the heart of Irish enterprise policy?
While innovation in a broad sense is important, Irish ministers have foolishly become victims of the hype about high-tech.
We have global recognition of Irish drink brands while our reputation in food is recognised in some parts of Europe.

Finfacts.ie
45
As cited above, Michael Porter of Harvard points to successful clusters outside high-tech such as in the wine-growing region of Napa Valley, California and the fashion industry in Italy.
Investing more money in research is not going to change the dynamic. The challenge of creating up to 200,000 net jobs in coming years will not be met by focussing on universities moving up the international ranking tables.
We don't have to produce PhDs in a wide spectrum of disciplines to meet enterprise demand. There is after all an international market that could be tapped.
Science shouldn't take the lion's share of State's enterprise budget. The obsession with high-tech should end.
Europe should be the focus of SMEs.
Enterprise Ireland, the State agency, said in 2009: "The countries Germany, France, Benelux, Italy and Spain collectively represent a GDP (gross domestic product) 3.9 times the size of the UK, yet the non-food exports by clients companies of Enterprise Ireland, for these countries is 40% of that of the UK."
According to Eurostat, only 4% of Irish primary level students learn a foreign language.
In November 2009, Irish companies were warned by several senior executives who run some of the country’s most successful indigenous companies, to be cautious about expanding into emerging markets and focus instead on developed markets. “More fortunes have been lost than made by getting in too early,” Liam O’Mahony, former CRH CEO, told a conference on making businesses international at UCD’s Michael Smurfit Business School. O’Mahony, who ran the world’s second biggest building materials company from 2000 to 2008 and now chairs IDA Ireland, the inward investment promotion agency, said Irish companies should consider expanding into the US, UK and other mature markets before looking at countries such as China. “Some of these markets are very large and there is still scope to grow as long as you have value propositions,” he said. O'Mahony’s advice was repeated by John Moloney, Glanbia chief executive, and Seán O’Driscoll, Glen Dimplex chief executive. “China is a long-haul, a slow-burn,” O’Driscoll said.
A new enterprise policy is needed but coupled with institutional and governance reforms of failed systems.
Change comes at glacial speed in Ireland and in the grim 1950s, T.K. Whitaker, the head of the Irish civil service, in 1957, in a memorandum to the minister for finance on the failure of economic policy and the general sense of hopelessness in the country, warned that "without a sound and progressive economy, political independence would be a crumbling facade."
Radical proposals for economic change were put forward in November 1958 in a report, 'Economic Development,' and a new economic policy was put in place.
Eoin O'Driscoll, the former chairman of the Enterprise Strategy Group quoted Charles Darwin in 2007: “It is not the strongest of the species that survives nor the most intelligent but the one most responsive to change.”
The bailout troika -- the European Commission, the European Central Bank and the International Monetary Fund - - has put pressure on the Irish government to introduce reform but there is no appetite domestically to challenge powerful vested interests.
There is no fear that the changes, which were put in place in Sweden and Finland in response to economic crises in the early 1990s, will be emulated in Ireland.

Finfacts.ie
46
Meanwhile, policy makers are deluded by data impacted by distortions caused by the crucial foreign multinational sector.
The Central Bank said in its Quarterly Bulletin in October 2012:
"While Ireland has regained some of the competitiveness lost during the boom, the standard international measures of competitiveness and productivity growth overstate the degree of improvement which has occurred. As pointed out previously, the sectoral shift away from low productivity sectors in recent years has led to an overstatement of the recorded improvement. Reflecting this, the gains in competitiveness which have occurred need to be further reinforced. One important way to do this would be to press ahead with public sector reforms to deliver the maximum possible level of public services from the reduced resources available for expenditure. More generally, pay remains high in both the public and private sectors, adding to costs and prices in the economy, and no doubt discouraging expansion and investment projects by exporting firms. While the difficulties of addressing some of these issues are acknowledged, a lowering of the cost base, both public and private, would make a significant contribution to improving competitiveness and productivity in a fundamental way. This would make clear that the economy is capable of adapting to changed circumstances and would be very beneficial to the recovery process.”
While fighting the current crisis, policy makers are silent about preparing for challenges that
will emerge in the medium and long-term. It's as if the attitude is to let sleeping dogs lie.
The facts on enterprise policy already show that relying on faith rather than evidence can be a
dangerous thing!
Michael Hennigan, a graduate of University College Cork, founded the Irish financial website, Finfacts, in
1997.