irene-viz: visualizing energy consumption of transformer
TRANSCRIPT

Proceedings of the 2021 Conference on Empirical Methods in Natural Language Processing: System Demonstrations, pages 251–258November 7–11, 2021. ©2021 Association for Computational Linguistics
251
IrEne-viz: Visualizing Energy Consumption of Transformer Models
Yash Kumar Lal, Qingqing Cao, Harsh Trivedi, Reetu Singh,Aruna Balasubramanian, Niranjan Balasubramanian
Department of Computer ScienceStony Brook University
Stony Brook, NY 11794, USA{ylal,qicao,hjtrivedi,reesingh,arunab,niranjan}@cs.stonybrook.edu
Abstract
IrEne (Cao et al., 2021) is an energyprediction system that accurately predictsthe interpretable inference energy consump-tion of a wide range of Transformer-basedNLP models. We present the IrEne-viztool, an online platform for visualizing andexploring energy consumption of variousTransformer-based models easily. Addition-ally, we release a public API that can beused to access granular information aboutenergy consumption of transformer modelsand their components. The live demois available at http://stonybrooknlp.github.io/irene/demo/.
1 Introduction
Pretrained transformers have shown strong resultson downstream NLP tasks, resulting in wide-spreadadoption. With their deployment in large-scalepublic-facing systems serving hundreds of millionsof requests per day, it has become important tostudy their energy footprint at inference time. Infer-ence energy can incur substantial costs especiallyfor models that are critical for high-volume webservices.
Designing energy efficient and cost-effectivemodels requires both accurate and interpretableenergy modeling. Current approaches to energymodeling treat the model as a monolithic entity.In our previous work (Cao et al., 2021), we intro-duced a tree-like abstraction to decompose a modelinto its components. We designed a multi-levelprediction method that predicts energy in all thecomponents of the abstraction tree in a bottom-upfashion using resource utilization and model de-scription features. This system called IrEne is usedas the base of this work. IrEne provides more ac-curate energy prediction than other methods andis designed to be interpretable. However, it is non-trivial to retrieve data from that system, making it
difficult to perform analysis or visualization for thesame.
In this work, we present IrEne-viz, a user-friendly dashboard that allows visualization of in-ference energy consumption of a transformer-basedmodel and its various components. Users will beable to interact with the different operations presentin a model. Our interface allows people to easilyunderstand the energy bottlenecks during inference.Additionally, we make our pipeline public by ex-posing it as an API endpoint. Having such datareadily available will further research in the areaand allow the community to use it for their ownpurposes, such as analyzing accuracy or latencytrade-offs against energy. For instance, Cao et al.(2021) compared accuracy of BERT on a specifictask while varying the number of layers and madeobservations about the energy-accuracy tradeoff.We design IrEne-viz to be:
• Easy to use - Our browser interface is intu-itive and allows for thorough exploration of amodel, its operations, and their energy usage.
• Easy to access - The model tree and its fea-tures are readily available through a publicAPI in an easy-to-use JSON format.
• Easy to extend - New models to be trackedcan be included easily.
2 Related Work
There has been increased interest in the energy con-sumption of NLP models in recent years. Despitesome progress in modeling, there is a lack of visu-alisation and analysis tools for the same.
2.1 Energy Estimation
Schwartz et al. (2019) suggest using metrics likefloating point operations (FPO) to measure energyefficiency. However, Henderson (2020) argues such

252
Module Level
ML Level
BertModel
BertEmbeddings BertEncoder BertPooler
Embedding:word LayerNorm BertLayer:0
BertAttention BertIntermediate BertOutput
BertSelfAttention BertSelfOutput
Linear:query matmul softmax Linear:dense LayerNorm
Linear:dense Linear:dense LayerNorm
Linear:dense Tanh
Figure 1: A tree view of a 1-layer BERT model. The yellow rectangle nodes stand for basic machine learning (ML)level operations. The brown rectangle nodes are also ML level which are non-parametric (i.e., has no trainableparameters). The ML level operations are model-agnostic and provided by machine learning software framework.The light blue oval nodes denote model-specific operations that reflect the architectural semantics given by themodel developer .
metrics alone cannot accurately reflect energy con-sumption. Energy prediction of applications onmobile devices is a well-studied topic in the sys-tems community (Pathak et al., 2011, 2012; Yoonet al., 2012; Cao et al., 2017) but they require fine-grained understanding of the application. None ofthese systems predict energy for NLP models.
Henderson (2020) use the experiment-impact-tracker software framework to report the aggre-gated energy of benchmark programs, built onStrubell et al. (2019). However, Cao et al. (2020)show that this type of resource utilization only mod-eling can be highly inaccurate. Zhou et al. (2020)presents an energy efficient benchmark for NLPmodels. However, they only report the time (hours)and cost (dollars) for training and testing NLP mod-els, the actual energy numbers remain unknown.
2.2 Transformer Model Visualization
For NLP, a number of tools exist for investigat-ing specific model classes, such as RNNs (Strobeltet al., 2018), Transformers (Hoover et al., 2020; Vigand Belinkov, 2019), or text generation (Strobeltet al., 2018). More generally, AllenNLP Interpret(Wallace et al., 2019) introduces a modular frame-work for interpretability components, focused onsingle-datapoint explanations and integrated tightlywith the AllenNLP (Gardner et al., 2017) frame-work. Lal et al. (2021) present a tool to visualizetoken embeddings through each layer of a Trans-former and highlight distances between certain to-ken embeddings. No such visualization work existsfor energy consumption of NLP models.
3 IrEne - Prediction Engine
We briefly review the IrEne system which we useas the energy prediction engine. Please refer to(Cao et al., 2021) for more details. IrEne is an in-terpretable energy prediction system. It representstransformer models in a tree-based abstraction, andgenerates energy prediction for each node of thetree, thus directly supporting interpretability. IrEnealso comes with data it was trained on – for eachtree node, it has associated resource utilization andmodel-related features, and ground-truth energymeasured with a hardware power monitor.
Tree Abstraction
IrEne uses a model tree abstraction that representsthe model nodes in three-levels: math level, ma-chine learning (ML) level and module level. Mathlevel nodes are a finite set of mathematical oper-ations (like addition, subtraction, matrix multipli-cation etc); they form model-agnostic ML levelnodes (such as Linear, LayerNorm etc.), which fur-ther can be used to construct complex module levelnodes. Module level nodes are groups of lower MLlevel node operations that reflect the logic units ofthe NLP algorithms defined by model authors. Themodel tree abstraction is such that each parent nodecaptures computation of all of its children nodes.Figure 1 shows an example tree representation for a1-layer BERT transformer. This abstraction makesenergy calibration more interpretable by allowingus to understand and analyze how the componentsof a model contribute to its energy usage.
253
Resource features
Model features
Model specs
BertModel
BertEmbeddings BertEncoder BertPooler
Embedding:word LayerNorm BertLayer:0
BertAttention BertIntermediate BertOutput
BertSelfAttention BertSelfOutput
Linear:query matmul softmax Linear:dense LayerNorm
Linear:dense Linear:dense LayerNorm
Linear:dense Tanh
JIT tracing
Profile Estimation model
Predicted energy for each nodeIrEne Energy Estimation
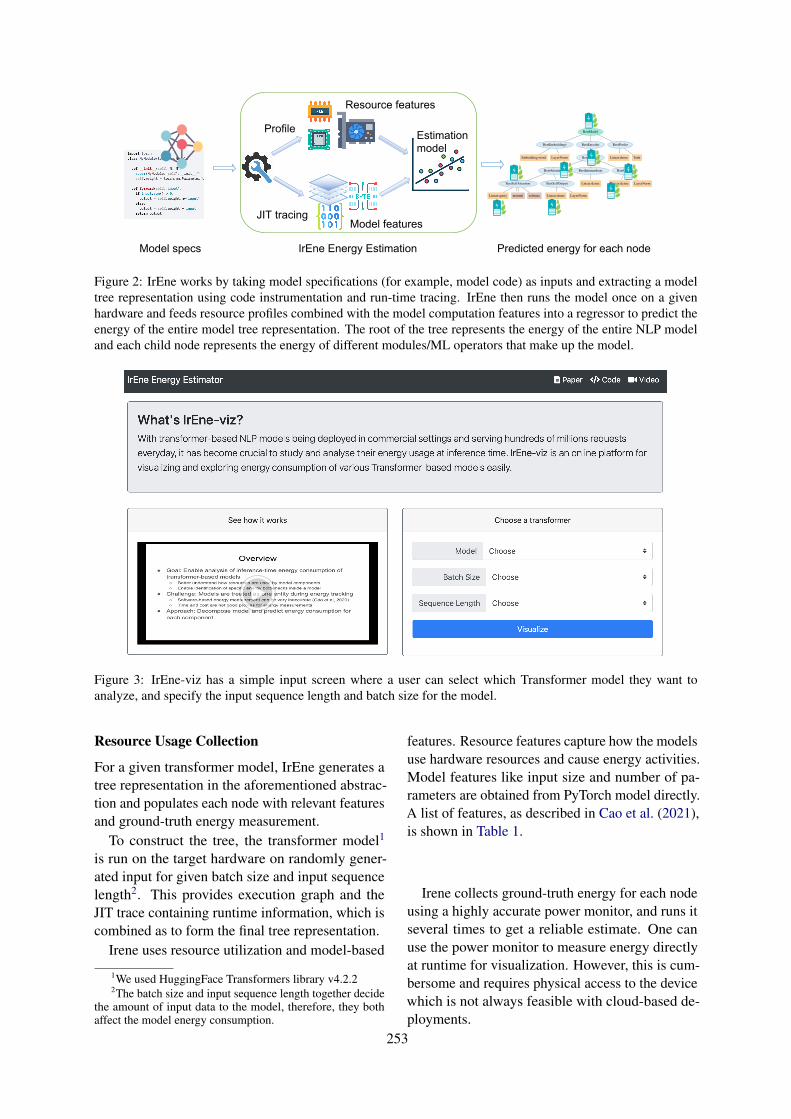
Figure 2: IrEne works by taking model specifications (for example, model code) as inputs and extracting a modeltree representation using code instrumentation and run-time tracing. IrEne then runs the model once on a givenhardware and feeds resource profiles combined with the model computation features into a regressor to predict theenergy of the entire model tree representation. The root of the tree represents the energy of the entire NLP modeland each child node represents the energy of different modules/ML operators that make up the model.
Figure 3: IrEne-viz has a simple input screen where a user can select which Transformer model they want toanalyze, and specify the input sequence length and batch size for the model.
Resource Usage Collection
For a given transformer model, IrEne generates atree representation in the aforementioned abstrac-tion and populates each node with relevant featuresand ground-truth energy measurement.
To construct the tree, the transformer model1
is run on the target hardware on randomly gener-ated input for given batch size and input sequencelength2. This provides execution graph and theJIT trace containing runtime information, which iscombined as to form the final tree representation.
Irene uses resource utilization and model-based
1We used HuggingFace Transformers library v4.2.22The batch size and input sequence length together decide
the amount of input data to the model, therefore, they bothaffect the model energy consumption.
features. Resource features capture how the modelsuse hardware resources and cause energy activities.Model features like input size and number of pa-rameters are obtained from PyTorch model directly.A list of features, as described in Cao et al. (2021),is shown in Table 1.
Irene collects ground-truth energy for each nodeusing a highly accurate power monitor, and runs itseveral times to get a reliable estimate. One canuse the power monitor to measure energy directlyat runtime for visualization. However, this is cum-bersome and requires physical access to the devicewhich is not always feasible with cloud-based de-ployments.

254
Figure 4: The user will be able to see an interactive visualization of the model components in a tree format. Theywill be able to expand and collapse it as per their need for granularity in energy analysis. Additionally, to the right,a list of model operations, in order of energy consumption, is provided for easy browsing.
Training and Prediction
IrEne predicts the energy for every node in themodel tree in a bottom-up fashion. At the leaves,where the nodes correspond to the ML primitives,IrEne uses separate regression models for each typeof ML primitive (e.g., one regressor for LinearLayer, another for LayerNorm etc.). For the inter-mediate nodes, their energy is predicted recursivelyusing a single regressor that makes a weighted com-bination of the predicted energy values from itschildren, and mean squared loss between predictedand ground-truth energy for all tree nodes is jointlyminimized. For both types of regressors, IrEne usesfeatures that are derived from resource utilization(e.g. cpu utilization) and generalized node features(e.g. size of inputs) enabling accurate multi-levelenergy prediction. Using the model tree abstrac-tion and multi-level prediction model makes IrEnegeneralizable, in the sense that once trained, it canwork on unseen NLP models with similar compo-nents.
4 User Interface and Functionality
The goal of IrEne-viz is to provide an easy wayfor users to analyze the energy of a given Trans-former model (for a specified input size). To doso, we design a browser-based user interface (UI)
batch_size : batch sizeseq_len : # of input tokensflops : floating point operations (unit: million)mem_bytes : memory read and write (unit: MiB)
cpu_util : CPU utilization (unit: %)mem_usg : memory usage (unit: %)gpu_util : GPU processor utilization (unit: %)gm_usg : GPU memory usage (unit: %)g_clk : GPU processor clock speed (unit: MHz)gm_clk : GPU memory clock speed (unit: MHz)latency : inference latency (unit: s)gpu_energy : GPU driver energy (unit: joule)
Table 1: Features used for energy estimation in IrEne.
in IrEne-viz that controls the input size and selectsthe model, as shown in Figure 3. We then estimatethe energy consumption of the model and visual-ize the energy for each part in the Transformermodel. Specifically, an user selects a predefinedTransformer model3 via the dropdown menu andenters the batch size and input sequence length. Af-ter pressing the visualize button, IrEne-viz backendserver will run the energy estimation and send theenergy result back to the browser for visualization.
3We are adding functionality to support customized models
255
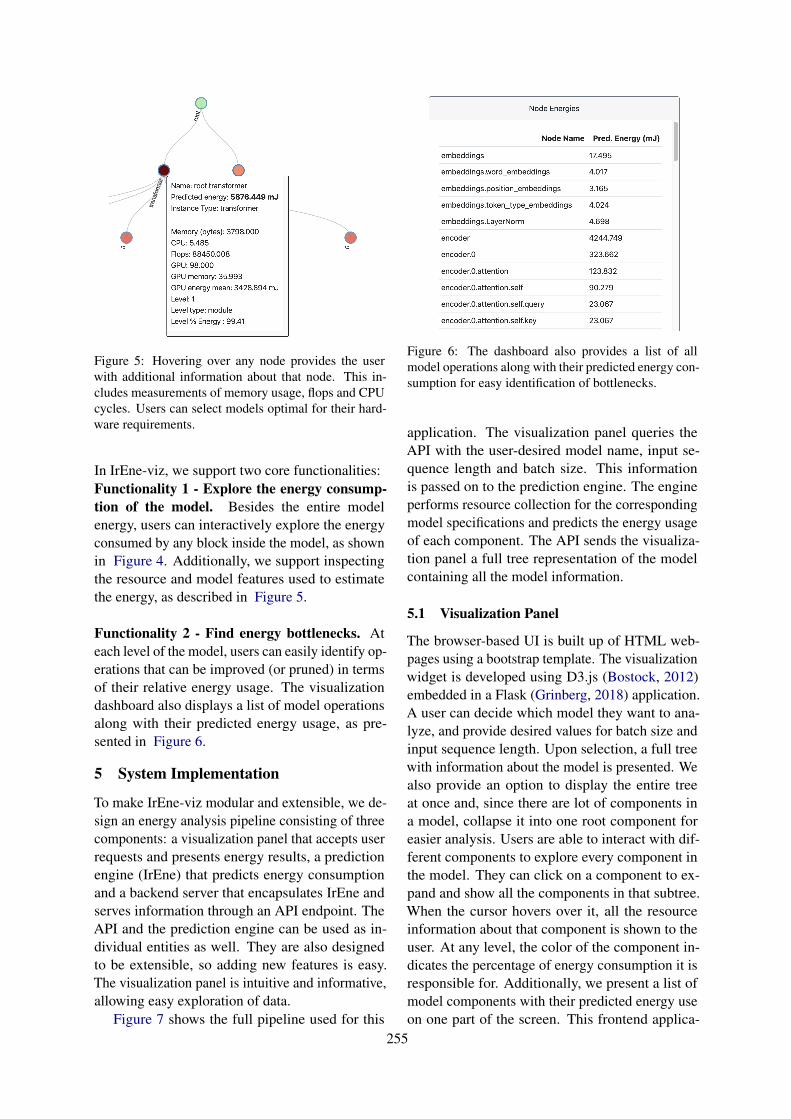
Figure 5: Hovering over any node provides the userwith additional information about that node. This in-cludes measurements of memory usage, flops and CPUcycles. Users can select models optimal for their hard-ware requirements.
In IrEne-viz, we support two core functionalities:Functionality 1 - Explore the energy consump-tion of the model. Besides the entire modelenergy, users can interactively explore the energyconsumed by any block inside the model, as shownin Figure 4. Additionally, we support inspectingthe resource and model features used to estimatethe energy, as described in Figure 5.
Functionality 2 - Find energy bottlenecks. Ateach level of the model, users can easily identify op-erations that can be improved (or pruned) in termsof their relative energy usage. The visualizationdashboard also displays a list of model operationsalong with their predicted energy usage, as pre-sented in Figure 6.
5 System Implementation
To make IrEne-viz modular and extensible, we de-sign an energy analysis pipeline consisting of threecomponents: a visualization panel that accepts userrequests and presents energy results, a predictionengine (IrEne) that predicts energy consumptionand a backend server that encapsulates IrEne andserves information through an API endpoint. TheAPI and the prediction engine can be used as in-dividual entities as well. They are also designedto be extensible, so adding new features is easy.The visualization panel is intuitive and informative,allowing easy exploration of data.
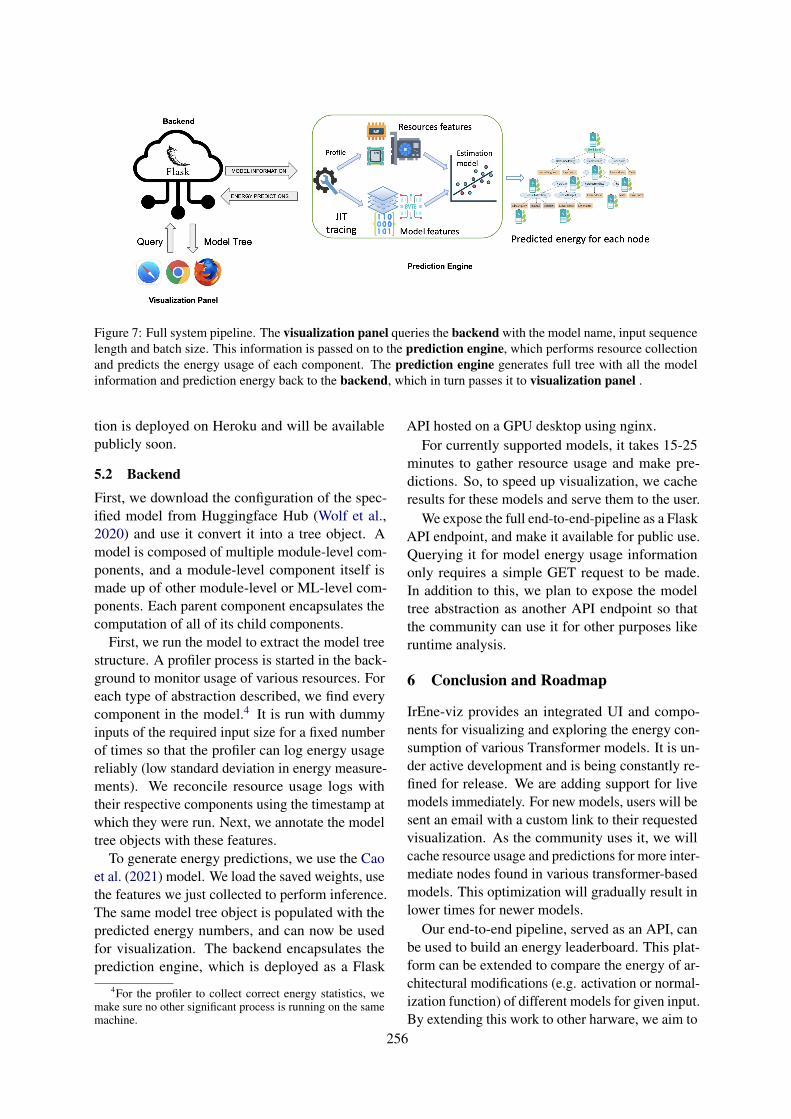
Figure 7 shows the full pipeline used for this
Figure 6: The dashboard also provides a list of allmodel operations along with their predicted energy con-sumption for easy identification of bottlenecks.
application. The visualization panel queries theAPI with the user-desired model name, input se-quence length and batch size. This informationis passed on to the prediction engine. The engineperforms resource collection for the correspondingmodel specifications and predicts the energy usageof each component. The API sends the visualiza-tion panel a full tree representation of the modelcontaining all the model information.
5.1 Visualization Panel
The browser-based UI is built up of HTML web-pages using a bootstrap template. The visualizationwidget is developed using D3.js (Bostock, 2012)embedded in a Flask (Grinberg, 2018) application.A user can decide which model they want to ana-lyze, and provide desired values for batch size andinput sequence length. Upon selection, a full treewith information about the model is presented. Wealso provide an option to display the entire treeat once and, since there are lot of components ina model, collapse it into one root component foreasier analysis. Users are able to interact with dif-ferent components to explore every component inthe model. They can click on a component to ex-pand and show all the components in that subtree.When the cursor hovers over it, all the resourceinformation about that component is shown to theuser. At any level, the color of the component in-dicates the percentage of energy consumption it isresponsible for. Additionally, we present a list ofmodel components with their predicted energy useon one part of the screen. This frontend applica-
256
Figure 7: Full system pipeline. The visualization panel queries the backend with the model name, input sequencelength and batch size. This information is passed on to the prediction engine, which performs resource collectionand predicts the energy usage of each component. The prediction engine generates full tree with all the modelinformation and prediction energy back to the backend, which in turn passes it to visualization panel .
tion is deployed on Heroku and will be availablepublicly soon.
5.2 BackendFirst, we download the configuration of the spec-ified model from Huggingface Hub (Wolf et al.,2020) and use it convert it into a tree object. Amodel is composed of multiple module-level com-ponents, and a module-level component itself ismade up of other module-level or ML-level com-ponents. Each parent component encapsulates thecomputation of all of its child components.
First, we run the model to extract the model treestructure. A profiler process is started in the back-ground to monitor usage of various resources. Foreach type of abstraction described, we find everycomponent in the model.4 It is run with dummyinputs of the required input size for a fixed numberof times so that the profiler can log energy usagereliably (low standard deviation in energy measure-ments). We reconcile resource usage logs withtheir respective components using the timestamp atwhich they were run. Next, we annotate the modeltree objects with these features.
To generate energy predictions, we use the Caoet al. (2021) model. We load the saved weights, usethe features we just collected to perform inference.The same model tree object is populated with thepredicted energy numbers, and can now be usedfor visualization. The backend encapsulates theprediction engine, which is deployed as a Flask
4For the profiler to collect correct energy statistics, wemake sure no other significant process is running on the samemachine.
API hosted on a GPU desktop using nginx.For currently supported models, it takes 15-25
minutes to gather resource usage and make pre-dictions. So, to speed up visualization, we cacheresults for these models and serve them to the user.
We expose the full end-to-end-pipeline as a FlaskAPI endpoint, and make it available for public use.Querying it for model energy usage informationonly requires a simple GET request to be made.In addition to this, we plan to expose the modeltree abstraction as another API endpoint so thatthe community can use it for other purposes likeruntime analysis.
6 Conclusion and Roadmap
IrEne-viz provides an integrated UI and compo-nents for visualizing and exploring the energy con-sumption of various Transformer models. It is un-der active development and is being constantly re-fined for release. We are adding support for livemodels immediately. For new models, users will besent an email with a custom link to their requestedvisualization. As the community uses it, we willcache resource usage and predictions for more inter-mediate nodes found in various transformer-basedmodels. This optimization will gradually result inlower times for newer models.
Our end-to-end pipeline, served as an API, canbe used to build an energy leaderboard. This plat-form can be extended to compare the energy of ar-chitectural modifications (e.g. activation or normal-ization function) of different models for given input.By extending this work to other harware, we aim to
257
provide energy optimization suggestions based onenergy profiles of a model on the given hardware.In our previous work, (Cao et al., 2021) we alsostudied accuracy vs energy trade-offs, which willbe integrated into the dashboard.
7 Acknowledgements
This work was supported in part by the NationalScience Foundation under grants IIS-1815358.
ReferencesMike Bostock. 2012. D3.js - data-driven documents.
Qingqing Cao, Aruna Balasubramanian, and NiranjanBalasubramanian. 2020. Towards accurate and reli-able energy measurement of NLP models. In Pro-ceedings of SustaiNLP: Workshop on Simple andEfficient Natural Language Processing, pages 141–148, Online. Association for Computational Linguis-tics.
Qingqing Cao, Yash Kumar Lal, Harsh Trivedi, ArunaBalasubramanian, and Niranjan Balasubramanian.2021. IrEne: Interpretable energy prediction fortransformers. In Association for Computational Lin-guistics: ACL 2021, Online. Association for Compu-tational Linguistics.
Yi Cao, Javad Nejati, Muhammad Wajahat, Aruna Bal-asubramanian, and Anshul Gandhi. 2017. Decon-structing the Energy Consumption of the MobilePage Load. Proceedings of the ACM on Measure-ment and Analysis of Computing Systems, 1(1):6:1–6:25.
Matt Gardner, Joel Grus, Mark Neumann, OyvindTafjord, Pradeep Dasigi, Nelson F. Liu, MatthewPeters, Michael Schmitz, and Luke S. Zettlemoyer.2017. Allennlp: A deep semantic natural languageprocessing platform.
Miguel Grinberg. 2018. Flask web development: de-veloping web applications with python. " O’ReillyMedia, Inc.".
James Henderson. 2020. The unstoppable rise of com-putational linguistics in deep learning. In Proceed-ings of the 58th Annual Meeting of the Associationfor Computational Linguistics, pages 6294–6306,Online. Association for Computational Linguistics.
Benjamin Hoover, Hendrik Strobelt, and SebastianGehrmann. 2020. exBERT: A Visual Analysis Toolto Explore Learned Representations in TransformerModels. In Proceedings of the 58th Annual Meet-ing of the Association for Computational Linguistics:System Demonstrations, pages 187–196, Online. As-sociation for Computational Linguistics.
Vasudev Lal, Arden Ma, Estelle Aflalo, Phillip Howard,Ana Simoes, Daniel Korat, Oren Pereg, Gadi Singer,
and Moshe Wasserblat. 2021. InterpreT: An interac-tive visualization tool for interpreting transformers.In Proceedings of the 16th Conference of the Euro-pean Chapter of the Association for ComputationalLinguistics: System Demonstrations, pages 135–142, Online. Association for Computational Linguis-tics.
Abhinav Pathak, Y. Charlie Hu, and Ming Zhang.2012. Where is the energy spent inside my app?fine grained energy accounting on smartphones withEprof. In Proceedings of the 7th ACM european con-ference on Computer Systems, EuroSys ’12, pages29–42, New York, NY, USA. Association for Com-puting Machinery.
Abhinav Pathak, Y. Charlie Hu, Ming Zhang, ParamvirBahl, and Yi-Min Wang. 2011. Fine-grained powermodeling for smartphones using system call tracing.In Proceedings of the sixth conference on Computersystems, EuroSys ’11, pages 153–168, New York,NY, USA. Association for Computing Machinery.
Roy Schwartz, Jesse Dodge, Noah A. Smith, and OrenEtzioni. 2019. Green AI. CoRR, abs/1907.10597.
H. Strobelt, S. Gehrmann, M. Behrisch, A. Perer,H. Pfister, and A. M. Rush. 2018. Seq2Seq-Vis:A Visual Debugging Tool for Sequence-to-SequenceModels. ArXiv e-prints.
Hendrik Strobelt, Sebastian Gehrmann, Hanspeter Pfis-ter, and Alexander M. Rush. 2018. Lstmvis: A toolfor visual analysis of hidden state dynamics in recur-rent neural networks. IEEE Transactions on Visual-ization and Computer Graphics, 24(1):667–676.
Emma Strubell, Ananya Ganesh, and Andrew McCal-lum. 2019. Energy and policy considerations fordeep learning in NLP. In Proceedings of the 57thAnnual Meeting of the Association for Computa-tional Linguistics, pages 3645–3650, Florence, Italy.Association for Computational Linguistics.
Jesse Vig and Yonatan Belinkov. 2019. Analyzingthe structure of attention in a transformer languagemodel. In Proceedings of the 2019 ACL WorkshopBlackboxNLP: Analyzing and Interpreting NeuralNetworks for NLP, pages 63–76, Florence, Italy. As-sociation for Computational Linguistics.
Eric Wallace, Jens Tuyls, Junlin Wang, Sanjay Subra-manian, Matt Gardner, and Sameer Singh. 2019. Al-lenNLP Interpret: A framework for explaining pre-dictions of NLP models. In Empirical Methods inNatural Language Processing.
Thomas Wolf, Lysandre Debut, Victor Sanh, JulienChaumond, Clement Delangue, Anthony Moi, Pier-ric Cistac, Tim Rault, Remi Louf, Morgan Funtow-icz, Joe Davison, Sam Shleifer, Patrick von Platen,Clara Ma, Yacine Jernite, Julien Plu, Canwen Xu,Teven Le Scao, Sylvain Gugger, Mariama Drame,
258
Quentin Lhoest, and Alexander Rush. 2020. Trans-formers: State-of-the-art natural language process-ing. In Proceedings of the 2020 Conference on Em-pirical Methods in Natural Language Processing:System Demonstrations, pages 38–45, Online. Asso-ciation for Computational Linguistics.
Chanmin Yoon, Dongwon Kim, Wonwoo Jung,Chulkoo Kang, and Hojung Cha. 2012. AppScope:application energy metering framework for androidsmartphones using kernel activity monitoring. InProceedings of the 2012 USENIX conference onAnnual Technical Conference, USENIX ATC’12,page 36, USA. USENIX Association.
Xiyou Zhou, Zhiyu Chen, Xiaoyong Jin, andWilliam Yang Wang. 2020. HULK: an energy effi-ciency benchmark platform for responsible naturallanguage processing. CoRR, abs/2002.05829.