irish distillers ltd. midleton distilleries
TRANSCRIPT

Irish Distillers Ltd.
Midleton Distilleries
Midleton
Co. Cork
Reg.No. P0442-01
Annual Environmental Report
Date of Issue: March 2009

1.0 Introduction
Licence Register Number
Name and Location of Site
Brief Description of Activities at the Site
Company Environmental Policy
Company Organisation Chart for Environmental Management
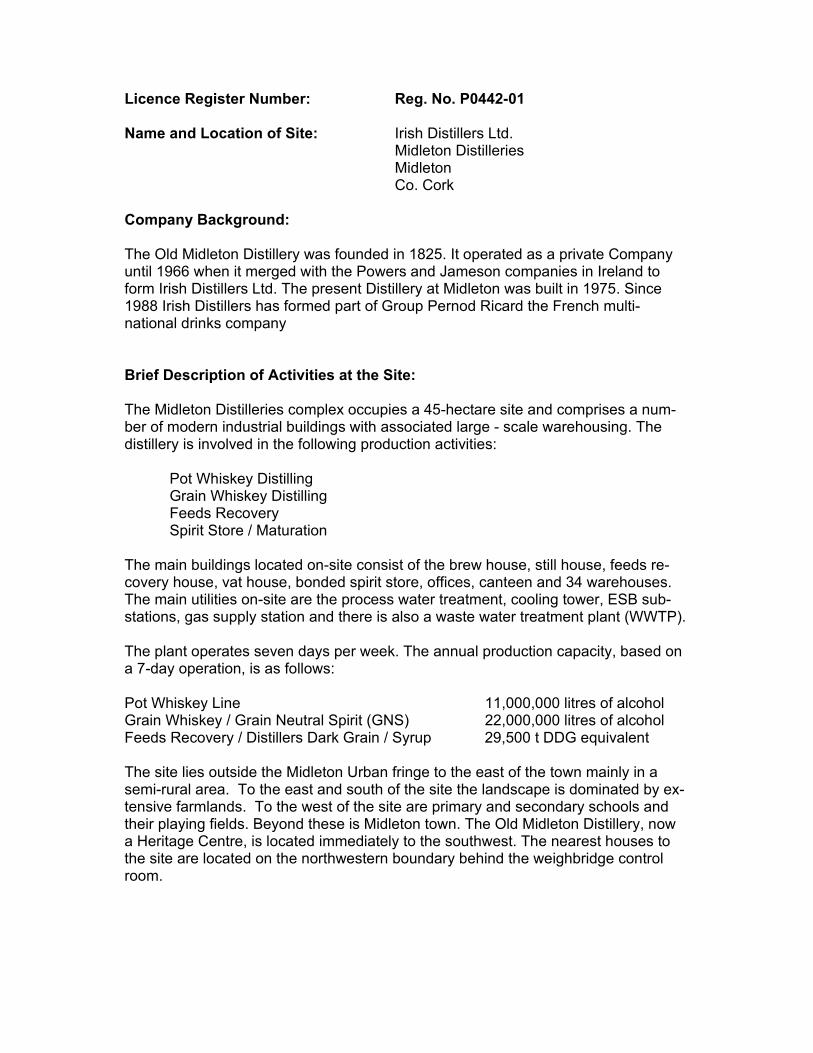
Licence Register Number: Reg. No. P0442-01 Name and Location of Site: Irish Distillers Ltd. Midleton Distilleries Midleton Co. Cork Company Background:
The Old Midleton Distillery was founded in 1825. It operated as a private Company until 1966 when it merged with the Powers and Jameson companies in Ireland to form Irish Distillers Ltd. The present Distillery at Midleton was built in 1975. Since 1988 Irish Distillers has formed part of Group Pernod Ricard the French multi-national drinks company Brief Description of Activities at the Site: The Midleton Distilleries complex occupies a 45-hectare site and comprises a num-ber of modern industrial buildings with associated large - scale warehousing. The distillery is involved in the following production activities:
Pot Whiskey Distilling Grain Whiskey Distilling Feeds Recovery Spirit Store / Maturation
The main buildings located on-site consist of the brew house, still house, feeds re-covery house, vat house, bonded spirit store, offices, canteen and 34 warehouses. The main utilities on-site are the process water treatment, cooling tower, ESB sub-stations, gas supply station and there is also a waste water treatment plant (WWTP). The plant operates seven days per week. The annual production capacity, based on a 7-day operation, is as follows: Pot Whiskey Line 11,000,000 litres of alcohol Grain Whiskey / Grain Neutral Spirit (GNS) 22,000,000 litres of alcohol Feeds Recovery / Distillers Dark Grain / Syrup 29,500 t DDG equivalent The site lies outside the Midleton Urban fringe to the east of the town mainly in a semi-rural area. To the east and south of the site the landscape is dominated by ex-tensive farmlands. To the west of the site are primary and secondary schools and their playing fields. Beyond these is Midleton town. The Old Midleton Distillery, now a Heritage Centre, is located immediately to the southwest. The nearest houses to the site are located on the northwestern boundary behind the weighbridge control room.

MIDLETON DISTILLERIES QSE POLICY
The Board of Directors of Irish Distillers Limited regards the promotion of health and safety, food safety, quality and the environment (QSE) as a priority at all levels within the organisation, and under-takes to produce distilled spirits and associated by-products of the highest quality in a safe manner which protects the environment. Midleton Distilleries is therefore committed to: - complying with all applicable regulatory, legislative and corporate requirements and relevant
standards (ISO9001, ISO14001, OHSAS18001, ISO22000 and FEMAS); - identifying hazards and evaluating risks associated with the distilleries’ activities on a regular
basis, and documenting a programme to reduce or eliminate, as far as reasonably practica-ble, any risks identified;
- continually monitoring and improving site management and developing best practices to pro-
vide a safe and healthy work environment, to prevent pollution and to minimise the use of natural resources in line with the principles of sustainable development;
- controlling all food safety related process hazards using the Hazard Analysis and Critical Con-
trol Point (HACCP) principles; - providing products which, according to their intended use, are safe for customers and meet
agreed specifications; - continual improvement and performance measurement by setting and reviewing, on a regular
basis, QSE objectives, targets and management programmes at all levels within the organi-sation;
- ensuring, through appropriate training, planning, resource availability and communication,
that all personnel on-site at Midleton are aware of their QSE responsibilities; - consulting with, and encouraging employees to participate in, the QSE management system; - maintaining the QSE management system through regular auditing, reviewing and updating; - continually improving emergency preparedness and response procedures. The success of this policy requires commitment from all employees, visitors, suppliers and contrac-tors. It is the responsibility of each employee to observe all rules and procedures and co-operate with the company in complying with its statutory obligations. Employees must be aware at all times of the responsibility that they have for both their own safety and the safety of others. Responsibility for implementation of this policy lies with the Group Production Director, who ensures through the Head of Distilling Operations and line management that the objectives of the policy are achieved. This policy is communicated, implemented and maintained at all levels throughout Midleton Distiller-ies. It is available to external interested parties upon request.

Organisation Chart
General Manager
Engineering Manager Administration/Stock Control-ler
Group Environmental & Safety Manager
Environmental & Energy Manager
Head Distiller Process Manager Quality Assurance Manager Distillery Operations Man-ager
Production Supervisors Vathouse Controller
Warehouse Supervisor
Spirit Store Supervisor
Relief Supervisor
Cask Supervisor
Transport Supervisor
Production Services Supervi-sor
QSE Systems Coordinator
Fire & Safety Officer
Stock Controller/Wages Clerk Laboratory Technicians Engineering Supervisor
Electrical Safety Officer

2.0 Summary Information Self Monitoring Data Emission to Waters/Sewer Emissions to Air Energy and Water Consumption Environmental Incidents and Complaints Waste Arisings

Emissions to Waters/Sewer The Integrated Pollution Control Licence was issued in October 1999. The informa-tion contained in the “Present Year” column relates to the calendar year 2008 with the “Previous year” column relating to the calendar year 2007. During the course of the year the IPPC License was reviewed and amended. Heretofore only the treated wastewater emission point (SE1) was subject to a monitoring regime whereas the amended license further imposes the Urban Waste Water Regulation limits on the combined discharge (SE Final) from the site. Therefore it is not possible to compare the year’s performance with the previous year’s performance. Suffice it to say that the emissions to waters/sewer were in compliance with the conditions of the license. Licensed Emission Point SE1 (January to December)
Parameter Mass Emissions (kg) (Previous year)
Mass Emissions (kg) (Present year)
Licensed Mass Emissions (kg)
Volume 191262 m3 250572 m3 426500 m3 COD N/A 7768 53313 TOC 2801 3508 51180
Suspended Solids 644 1002 14928 OFG N/A <2505 8530
Table 1: Summary Emissions to Waters/Sewer Licensed Emission Point SE Final (March to December)
Parameter Mass Emissions (kg) (Previous year)
Mass Emissions (kg) (Present year)
Licensed Mass Emissions (kg)
Volume N/A 306718 1520000 m3 pH N/A 8.2 6.5 – 9.0
COD N/A 9723 190000 BOD N/A 2024 38000
Suspended Solids N/A 1595 53200 Total Nitrogen N/A 828 22800
Sulphates N/A 1963 912000 Cadmium N/A 0.00 304 Chromium N/A 0.306 760
Copper N/A 14.72 760 Lead N/A 1.07 760 Nickel N/A 0.00 760 Zinc N/A 10.43 760 OFG N/A <3067 30400
Faecal Coliforms N/A <250 per 100ml <250 per 100ml Table 1a: Summary Emissions to Waters/Sewer

Date 08/04/08 Parameter pH Emission Point Ref. No. SE Final No. of exceedences vs. No. of samples
1 vs. 120
Maximum Exceedence vs. Emission Limit Value
6.29 vs. 6.5
Cause Acidic chemicals being used to clean Reverse Osmosis unit caused pH to drop to 6.29. A license limit of 6.5 had only recently been introduced. New automatic pH controls were being installed at the time but had not been com-pleted. The volume involved was 11.5 m3. The total vol-ume discharged that day was 1372 m3. The average pH for the day was 8.04, the normal range would be 8.0 to 8.4
Corrective Action Automatic pH controls now in operation. Table 2: Summary of non-compliances Surface Water Emissions (SE5 & SWE2 to SWE8)
Emission Point pH Range COD Range Visual SE5 & SWE2 to SWE8 7.1 to 8.2 14 to 122 ppm Occasionally Turbid
Table 3: Summary of Surface Water Emissions Emission points SWE2 to SWE8 drain the surface water from the warehousing area to the dry bed of the disused millstream. As part of the whiskey maturation process ethanol evaporates from the casks and escapes to atmosphere. The rate of evapora-tion is temperature dependent with the losses being higher in the summer than in the winter. When it rains this ethanol is washed out of the atmosphere and results in the TOC levels reported above. These emission points serve 30 maturation warehouses with approximately 200,000 m2 of impermeable surface area. Ethanol is highly bio-degradable and is not persistent. Until March 2000 the millstream was in use and had a thriving fish population, which was not affected by the surface water dis-charges. The occasional turbidity is caused by the construction activities in the area. Since the revision of the license in March 2008 the monitoring requirement has changed from TOC to COD and emission point SE5 has been removed since it forms one of the constituent streams monitored in SE Final. Process emissions to Water (SWE1)
Emission Point pH Range Average TOC Range Visual SWE1 7.1 to 8.5 <15 ppm Clear
Table 4: Summary of Process Emissions to Water Process emissions to water were within the agreed limits.

Emissions to Air The Integrated Pollution Control Licence was issued in October 1999. The informa-tion contained in the “Present Year” column relates to the calendar year 2008 with the “Previous year” column relating to the calendar year 2007. Licensed Emission Points A1-1, A1-2 and A1-3
Parameter Mass Emissions (kg) (Previous year)
Mass Emissions (kg) (Present year)
Licensed Mass Emissions (kg)
CO <200 7762 N/A NO2 24994 38584 245952
Table 5: Summary Emissions to Atmosphere (Boilers) Licensed Emission Point A2-1
Parameter Mass Emissions (kg) (Previous year)
Mass Emissions (kg) (Present year)
Licensed Mass Emissions (kg)
Volume 71146529 m3 109477080 m3
321494400 m3
Particulates 9427 2061 16074 Table 6: Summary Emissions to Atmosphere (Feeds Recovery Stack) The average measured emission from the stack was 18.83 mg/Nm3 measured by two separate service providers each of whom carried out three half-hour sampling campaigns. The results ranged from 12 mg/Nm3 to 24 mg/Nm3 with the volumetric flows ranging from 17125 Nm3/h to 29908 Nm3/h giving an average mass emission rate of 0.389 kg/h particulate matter. The driers were operated for approximately 5328 hours during the year. Copies of both reports are contained in Appendix II.
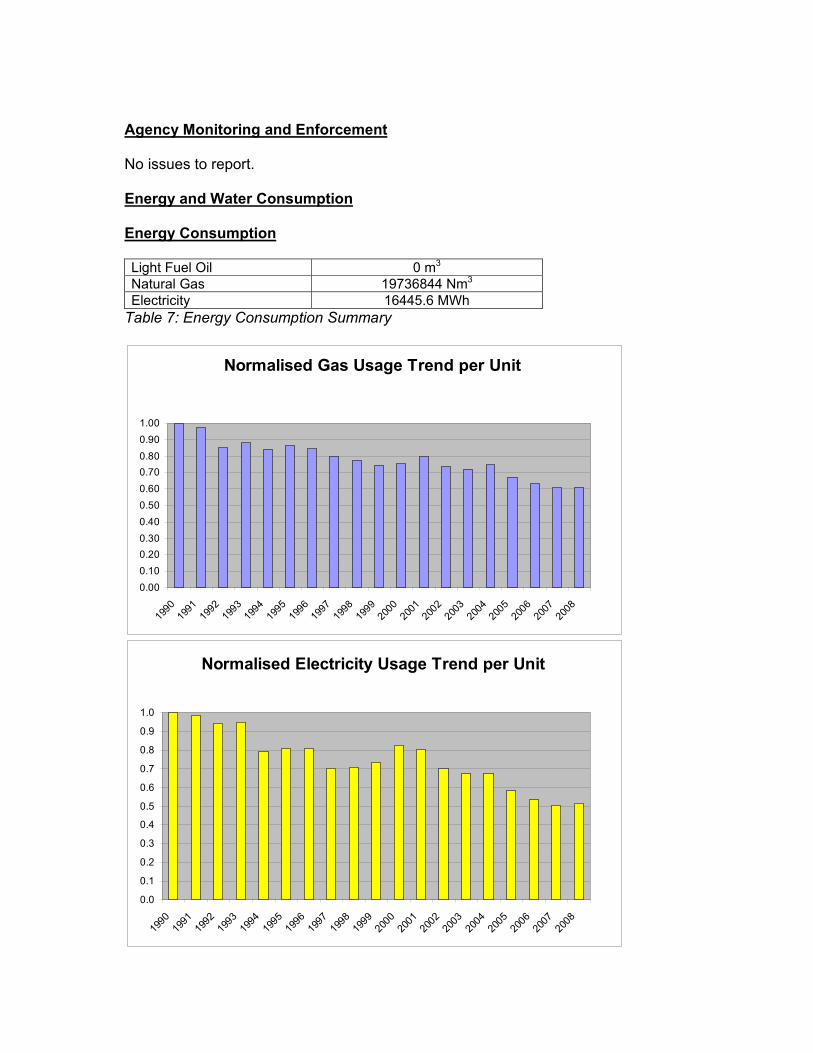
Agency Monitoring and Enforcement No issues to report. Energy and Water Consumption Energy Consumption Light Fuel Oil 0 m3 Natural Gas 19736844 Nm3 Electricity 16445.6 MWh
Table 7: Energy Consumption Summary
Normalised Gas Usage Trend per Unit
0.000.100.200.300.400.500.600.700.800.901.00
1990
1991
1992
1993
1994
1995
1996
1997
1998
1999
2000
2001
2002
2003
2004
2005
2006
2007
2008
Normalised Electricity Usage Trend per Unit
0.0
0.1
0.2
0.3
0.4
0.5
0.6
0.7
0.8
0.9
1.0
1990
1991
1992
1993
1994
1995
1996
1997
1998
1999
2000
2001
2002
2003
2004
2005
2006
2007
2008

Water Consumption On-site ground water (m3) 837112 On-site surface water (m3) 574002 Municipal supply (m3) 53220 Table 8: Water Consumption Summary Environmental Incidents and Complaints Incidents There were no environmental incidents during the year. Complaints There were no complaints during the year.

Waste Arisings

| PRTR# : P0442 | Facility Name : Irish Distillers Limited | Filename : P0442_2008(1).xls | Return Year : 2008 | 2266 11/03/2009 12:39
Version 1.1.01REFERENCE YEAR 2008
1. FACILITY IDENTIFICATIONParent Company Name Irish Distillers Limited
Facility Name Irish Distillers LimitedPRTR Identification Number P0442
Licence Number P0442-01
Waste or IPPC Classes of ActivityNo. class_name
Address 1 Midleton DistilleriesAddress 2 MidletonAddress 3 Co. CorkAddress 4
Country IrelandCoordinates of Location 18850735
River Basin DistrictNACE Code 1101
Main Economic Activity Distilling, rectifying and blending of spiritsAER Returns Contact Name Aidan Curran
AER Returns Contact Email Address [email protected] Returns Contact Position Environmental, Health & Safety Manager
AER Returns Contact Telephone Number 021-4631821AER Returns Contact Mobile Phone Number
AER Returns Contact Fax Number 021-4631602Production Volume 0.0
Production Volume UnitsNumber of Installations 0
Number of Operating Hours in Year 0Number of Employees 0
User Feedback/CommentsWeb Address
2. PRTR CLASS ACTIVITIESActivity Number Activity Name
3. SOLVENTS REGULATIONS (S.I. No. 543 of 2002)Is it applicable? No
Have you been granted an exemption ?If applicable which activity class applies (as per
Schedule 2 of the regulations) ?Is the reduction scheme compliance route being
used ?
AER Returns Worksheet

4.1 RELEASES TO AIR | PRTR# : P0442 | Facility Name : Irish Distillers Limited | Filename : P0442_2008(1).xls | Return Year : 2008 | 11/03/2009 12:398 8 16 18 26 26 6 6 6 6 6 6 28
SECTION A : SECTOR SPECIFIC PRTR POLLUTANTS
QUANTITY
No. Annex II Name M/C/E Method Code Designation or Description Emission Point 1 T (Total) KG/Year A (Accidental) KG/Yea F (Fugitive) KG/Yea0.0 0.0 0.0 0.0
* Select a row by double-clicking on the Pollutant Name (Column B) then click the delete button
SECTION B : REMAINING PRTR POLLUTANTS
QUANTITYA1-1, A1-2, A1-3
No. Annex II Name M/C/E Method Code Designation or Description Emission Point 1 T (Total) KG/Year A (Accidental) KG/Yea F (Fugitive) KG/Yea02 Carbon monoxide (CO) M OTH BS3405:1983 7686.0 7686.0 0.0 0.003 Carbon dioxide (CO2) C ETS 41406590.0 41406590.0 0.0 0.008 Nitrogen oxides (NOx/NO2) M OTH BS3405:1983 38584.0 38584.0 0.0 0.0
* Select a row by double-clicking on the Pollutant Name (Column B) then click the delete button
SECTION C : REMAINING POLLUTANT EMISSIONS (As required in your Licence)
QUANTITYA2-1
Pollutant No. Name M/C/E Method Code Designation or Description Emission Point 1 T (Total) KG/Year A (Accidental) KG/Yea F (Fugitive) KG/Yea210 Dust M OTH BS3405:1983 2061.0 2061.0 0.0 0.0
* Select a row by double-clicking on the Pollutant Name (Column B) then click the delete button
Additional Data Requested from Landfill operators
Landfill: Irish Distillers Limited
Please enter summary data on the quantitiesof methane flared and / or utilised
additional_pollutant_no T (Total) kg/Year M/C/E Method CodeDesignation or
DescriptionFacility Total Capacity m3
per hourTotal estimated methane generation (as per sit
model) 0.0 N/AMethane flared 0.0 0.0 (Total Flaring Capacity)
Methane utilised in engine/s 0.0 0.0 (Total Utilising Capacity)Net methane emission (as reported in Section A
above) 0.0 N/A
METHOD
POLLUTANT METHODMethod Used
For the purposes of the National Inventory on Greenhouse Gases, landfill operators are requested to provide summary data on landfill gas (Methane) flared or utilised on their facilities to accompany the figures for total methane generated. Operators should only report their Net methane (CH4) emission to the environment under T(total) KG/yr for Section A: Sector specific PRTR pollutants above. Please complete the table below:
Method Used
RELEASES TO AIRPOLLUTANT METHOD
Method Used
POLLUTANT
RELEASES TO AIR
RELEASES TO AIR
Method Used

4.2 RELEASES TO WATERS | PRTR# : P0442 | Facility Name : Irish Distillers Limited | Filename : P0442_2008(1).xls | Return Year : 2008 | 18/03/2009 13:498 8 16 22 30 34 6 6 6 6 6 6 34
SECTION A : SECTOR SPECIFIC PRTR POLLUTANTS Data on ambient monitoring of storm/surface water or groundwater, conducted as part of your licence requirements, should NOT be submitted under AER / PRTR Reporting as this only concerns Releases from your facility
QUANTITY
No. Annex II Name M/C/E Method Code Designation or Description Emission Point 1 T (Total) KG/Year A (Accidental) KG/Year F (Fugitive) KG/Year0.0 0.0 0.0 0.0
* Select a row by double-clicking on the Pollutant Name (Column B) then click the delete button
SECTION B : REMAINING PRTR POLLUTANTS
QUANTITYSE Final
No. Annex II Name M/C/E Method Code Designation or Description Emission Point 1 T (Total) KG/Year A (Accidental) KG/Year F (Fugitive) KG/Year18 Cadmium and compounds (as Cd) M OTH ICP MS 0.0 0.0 0.0 0.019 Chromium and compounds (as Cr) M OTH ICP MS 0.306 0.306 0.0 0.020 Copper and compounds (as Cu) M OTH ICP MS 14.72 14.72 0.0 0.023 Lead and compounds (as Pb) M OTH ICP MS 1.07 1.07 0.0 0.022 Nickel and compounds (as Ni) M OTH ICP MS 0.0 0.0 0.0 0.0
12 Total nitrogen MEN ISO 11905-1:1998 828.0 828.0 0.0 0.0
24 Zinc and compounds (as Zn) M OTH ICP MS 10.43 10.43 0.0 0.0* Select a row by double-clicking on the Pollutant Name (Column B) then click the delete button
SECTION C : REMAINING POLLUTANT EMISSIONS (as required in your Licence)
QUANTITYSE Final
Pollutant No. Name M/C/E Method Code Designation or Description Emission Point 1 T (Total) KG/Year A (Accidental) KG/Year F (Fugitive) KG/Year303 BOD M OTH APHA98.5210.B 2024.0 2024.0 0.0 0.0306 COD M OTH HACH Method 8000 9723.0 9723.0 0.0 0.0314 Fats, Oils and Greases M OTH APHA98.5520.D 3067.0 3067.0 0.0 0.0343 Sulphate M OTH Ion Chromatography 1963.0 1963.0 0.0 0.0240 Suspended Solids M OTH AWWA 2540 1595.0 1595.0 0.0 0.0
* Select a row by double-clicking on the Pollutant Name (Column B) then click the delete button
Method Used
POLLUTANTMethod Used
POLLUTANT
POLLUTANTRELEASES TO WATERS
Method Used
RELEASES TO WATERS
RELEASES TO WATERS

4.3 RELEASES TO WASTEWATER OR SEWER | PRTR# : P0442 | Facility Name : Irish Distillers Limited | Filename : P0442_2008(1).xls | Return Year : 11/03/2009 12:448 8 16 16 6 6 6 6
SECTION A : PRTR POLLUTANTS
QUANTITY
No. Annex II Name M/C/E Method Code Designation or Description Emission Point 1 T (Total) KG/Year A (Accidental) KG/Year F (Fugitive) KG/Year0.0 0.0 0.0 0.0
* Select a row by double-clicking on the Pollutant Name (Column B) then click the delete button
SECTION B : REMAINING POLLUTANT EMISSIONS (as required in your Licence)
QUANTITY
Pollutant No. Name M/C/E Method Code Designation or Description Emission Point 1 T (Total) KG/Year A (Accidental) KG/Year F (Fugitive) KG/Year0.0 0.0 0.0 0.0
* Select a row by double-clicking on the Pollutant Name (Column B) then click the delete button
OFFSITE TRANSFER OF POLLUTANTS DESTINED FOR WASTE-WATER TREATMENT OR SEWER
OFFSITE TRANSFER OF POLLUTANTS DESTINED FOR WASTE-WATER TREATMENT OR SEWER
Method Used
Method Used
POLLUTANT METHOD
POLLUTANT METHOD

4.4 RELEASES TO LAND | PRTR# : P0442 | Facility Name : Irish Distillers Limited | Filename : P0442_2008(1).xls | Return Year : 2008 | 11/03/2009 12:448 8 16 16 6 6 6 6
SECTION A : PRTR POLLUTANTS
QUANTITY
No. Annex II Name M/C/E Method Code Designation or Description Emission Point 1 T (Total) KG/Year A (Accidental) KG/Year0.0 0.0 0.0
* Select a row by double-clicking on the Pollutant Name (Column B) then click the delete button
SECTION B : REMAINING POLLUTANT EMISSIONS (as required in your Licence)
QUANTITY
Pollutant No. Name M/C/E Method Code Designation or Description Emission Point 1 T (Total) KG/Year A (Accidental) KG/Year0.0 0.0 0.0
* Select a row by double-clicking on the Pollutant Name (Column B) then click the delete button
POLLUTANT METHODMethod Used
RELEASES TO LAND
RELEASES TO LAND
POLLUTANT METHODMethod Used

5. ONSITE TREATMENT & OFFSITE TRANSFERS OF WASTE | PRTR# : P0442 | Facility Name : Irish Distillers Limited | Filename : P0442_2008(1).xls | Return Year : 2008 | 11/03/2009 12:445 39 31
Transfer DestinationEuropean Waste
Code HazardousQuantity T/Year Description of Waste
Waste Treatment Operation M/C/E Method Used
Location of Treatment
Name and Licence / Permit No. of Recoverer / Disposer /
BrokerAddress of Recoverer /
Disposer / Broker
Name and Address of Final Destination i.e. Final
Recovery / Disposal Site (HAZARDOUS WASTE
ONLY)
Licence / Permit No. of Final Destination i.e. Final
Recovery / Disposal Site (HAZARDOUS WASTE
ONLY)
Within the Country 17 06 01 Yes 0.150 Asbestos Insulation D1 M Weighed Abroad
BIS Willich Industrial Services Ltd. (CK WMC 32/01)
15, Crag Terrace, Clondalkin Ind. Est., Dublin 22.
Buhck GmbH & Co. KG, Rappenberg, DE21502 Weirshop, Germany A53F00502
Within the Country 17 05 03 Yes 19.320 Contaminated Soil R5 M Weighed Offsite in IrelandM. McGuire Haulage Ltd. (CK WMC 241/04)
Ahenure, Callan, Co. Kilkenny
Enva Ireland Ltd., Clonminam Ind. Est., Portlaoise, Co. Laois, Ireland W0184-1
Within the Country 20 01 21 Yes 0.180 Fuorescent Tubes R4 M Weighed AbroadContec Ltd. (CK WMC 31-01; WP 98092)
Davitt Rd., Inchicore, Dublin 12, Ireland
Mercury Recycling Ltd., Mercury House, 17 Commerce way, Trafford Park, Manachester M17 1HW, UK YP373533
Within the Country 11 01 13 Yes 0.360 Kerosene (from spent degreaser) R1 M Weighed Offsite in IrelandSafety Kleen (CK WMC 56/01; W0099-01)
Unit 5, Airton Rd., Tallaght, Dublin 24, Ireland
Enva Ireland Ltd., Clonminam Ind. Est., Portlaoise, Co. Laois, Ireland W0184-1
Within the Country 11 01 13 Yes 0.070 Kerosene (from spent degreaser) R2 M Weighed AbroadSafety Kleen (CK WMC 56/01; W0099-01)
Unit 5, Airton Rd., Tallaght, Dublin 24, Ireland
Solvent Resource Management Ltd. (SRM Ltd.), Weeland Road, Knottingly,West Yorkshire, WF11 8DZ, UK TP33345F
Within the Country 06 01 06 Yes 5.921 Hazardous Waste Chemicals [Aqueous D9 M Weighed Abroad South Coast Transport (CK Corrin, Fermoy, Co. Cork, Bredox BV, Industrieterrein 02/14323Within the Country 16 03 03 Yes 3.430 Hazardous Waste Chemicals [Aqueous D9 M Weighed Offsite in Ireland Lehane Environmental & Unit 5, Wallingstown Ind. Rilta Environmental Ltd., W0192-02 Within the Country 13 05 03 Yes 4.350 Interceptor Sludge D9 M Weighed Offsite in Ireland Lehane Environmental & Unit 5, Wallingstown Ind. Rilta Environmental Ltd., W0192-02 Within the Country 13 07 03 Yes 1.400 Oily Water R1 M Weighed Offsite in Ireland Enva Ireland Ltd. (CK WMC Clonminam Ind. Est., Enva Ireland Ltd., W0184-1Within the Country 13 02 08 Yes 2.580 Waste Oil R1 M Weighed Offsite in Ireland Enva Ireland Ltd. (CK WMC Clonminam Ind. Est., Enva Ireland Ltd., W0184-1Within the Country 20 01 35 Yes 0.591 WEEE (discarded IT equipment) R13 M Weighed Offsite in Ireland Rehab Recycle (CK WMC Monahan Road, Cork, Rehab Recycle, Parkmore WR/121Within the Country 16 06 04 No 0.014 Alkaline Batteries R4 M Weighed Abroad Returnbatt Ltd. (CK WMC Old Mill Industrial Estate, Within the Country 20 01 40 No 0.463 Aluminium Tags R4 M Weighed Offsite in Ireland Rehab Recycle (CK WMC Monahan Road, Cork, Within the Country 17 09 04 No 37.680 General C&D Waste R5 M Weighed Offsite in Ireland O'Brien Skip Hire (CK WMC Ballyrussell, Midleton Co. Within the Country 17 02 01 No 9.170 General C&D Timber Waste R13 M Weighed Offsite in Ireland O'Brien Skip Hire (CK WMC Ballyrussell, Midleton Co. Within the Country 20 01 01 No 1.540 Confidential Paper/Paper ISM R3 M Weighed Offsite in Ireland Rehab Recycle (CK WMC Monahan Road, Cork, Within the Country 20 01 25 No 0.175 Edible Oil R9 M Weighed Offsite in Ireland Frylite Ltd. (CK WMC Frylite Ltd., Orchard Road, Within the Country 15 01 02 No 0.079 Empty Plastic Drums (triple-rinsed) R5 M Weighed Offsite in Ireland Greenstar Recycling Sarsfield Court, Glanmire, Within the Country 16 01 03 No 1.953 Tyres R3 M Weighed Offsite in Ireland Hanover Tyres Ltd. (Permit Carrigtwohill, Co. Cork, Within the Country 16 01 03 No 0.042 Tyres R3 M Weighed Offsite in Ireland Cork Truck Services Ltd. Mallow Rd., Cork, IrelandWithin the Country 20 01 40 No 97.180 Waste Metal R4 M Weighed Offsite in Ireland Cork Metal (CK WMC 26/01; Dublin Hill, Cork, IrelandWithin the Country 02 07 02 No 241.988 Fusel Oil R1 M Weighed Onsite in Ireland Midleton Distilleries (IPPC Midleton, Co. Cork, IrelandWithin the Country 02 07 99 No 13.730 General Waste R5 M Weighed Offsite in Ireland Midleton Skip Hire (CK WMC Knockgriffin, Midleton, Co. Within the Country 20 03 01 No 42.100 General Waste D5 M Weighed Offsite in Ireland Veolia (CK WMC 10/01) Forge Hill, Kinsale Rd., Cork, Within the Country 15 01 07 No 3.210 Glass R5 M Weighed Offsite in Ireland REHAB Recycle (CK WMC Monahan Rd., Cork, Ireland; Within the Country 02 07 04 No 390.120 Grain Intake Screenings R3 M Weighed Offsite in Ireland Midleton Skip Hire (CK WMC Knockgriffin, Midleton, Co. Within the Country 15 01 10 Yes 0.318 Empty IBC residues of or contaminated by D9 E Weighed Offsite in Ireland Johnston Logistics Ltd. (CK Blackchurch Business Park, Rilta Environmental Ltd., W0192-02 Within the Country 15 01 06 No 9.222 Mixed Packaging Waste R5 E Weighed Offsite in Ireland Johnston Logistics Ltd. (CK Blackchurch Business Park, Within the Country 20 01 01 No 1.650 Newspaper/Newsprint R3 M Weighed Offsite in Ireland Greenstar Recycling Sarsfield Court, Glanmire, Within the Country 20 01 01 No 15.020 Paper & Cardboard R13 M Weighed Offsite in Ireland Veolia (CK WMC 10/01) Forge Hill, Kinsale Rd., Cork, Within the Country 20 01 39 No 1.740 Plastic R5 M Weighed Offsite in Ireland Midleton Skip Hire (CK WMC Knockgriffin, Midleton, Co. Within the Country 02 07 04 No 42.160 Spoilt Grains R3 M Weighed Offsite in Ireland Veolia (CK WMC 10/01); Forge Hill, Kinsale Rd., Cork, Within the Country 02 07 04 No 66.760 Spoilt Grains R3 M Weighed Offsite in Ireland Midleton Skip Hire (CK WMC Knockgriffin, Midleton, Co. Within the Country 20 01 38 No 22.120 Wood Pallets/Shavings R13 M Weighed Offsite in Ireland Veolia (CK WMC 10/01) Forge Hill, Kinsale Rd., Cork, Within the Country 19 08 12 No 990.390 WWTP Sludge R3 M Weighed Offsite in Ireland Veolia (CK WMC 10/01); Forge Hill, Kinsale Rd., Cork,
* Select a row by double-clicking the Description of Waste then click the delete button
Method Used

3.0 Management of the Activity Environmental Management Programme Report
Environmental Management Programme Proposal Pollution Emission Register

Environmental Management Programme – Report

Objective Objective Rationale1 To develop and improve site-wide environmental
management in accordance with ISO 14001 and related IPC Licence.
The environmental management system provides a structured framework for co-ordinating site-wide environmental affairs and sustaining IDLs policy of continual improvement.
Target Plan Responsible Creation Date Target Date Status Update1.1 IDL has established a baseline for river water
quality and will continue to ensure that it has no adverse effect on same.
1.1.1 To repeat the biological survey of river water quality for Dungourney and Millstream
Environmental & Energy Manager 07 Feb 2006 31 Dec 2009 Deferred pending future expansion plansfor the site
1.2 IDL intends to establish a baseline for flora andfauna levels at the sites so as to preserve theecological habitats that exist.
1.1.2 To perform a baseline flora and fauna survey. Environmental & Energy Manager 07 Feb 2006 31 Dec 2009 Deferred pending future expansion plansfor the site
Objective Objective Rationale2 To reduce emissions to sewer from IDL. The IPPC licence (No. P0442-01) contains a number
of specific conditions regarding the monitoring, control and reduction of emissions to sewer and waters. The emissions have been calculated as significant
Target Plan Responsible Creation Date Target Date Status Update2.1 To replace the existing pumps within the main on-
site pumping station.2.1.1 Upgrade existing pumps within the main on-site
pumping station (this project will be implemented as part of the overall plant upgrade works).
Environmental & Energy Manager 01 Jan 2006 31 Dec 2008 Not required in the immediate future. Deferred pending future expansion plansfor the site
Environmental Objectives & Targets Progress Report for 2008
Return to Index
18/03/2009 Page 1/5

Objective Objective Rationale3 To reduce emissions to atmosphere from the IDL
Site.The evaluation of environmental impacts has identified emissions to atmosphere as significant.
Target Responsible Creation Date Target Date Status Update3.2 To continue to investigate possible methods of
CO2 recovery. 3.2.1 IDL intend to continue to investigate methods of
recovering process CO2 emissions. Environmental & Energy Manager 07 Feb 2006 31 Dec 2008 No outlets identified
as yet.3.3 To address the issue of particulate emissions
from the Feeds Recovery stack.3.3.1 Service agents to visit site and develop a solution to
the problem.Distillery Operations Manager 27 Feb 2008 31 Dec 2008 High turbulence in
stack may have contributed adversely to the non-compliant results. The sampling port was less thasn 5D downstream of the horizontal bend. The port was relocated and the emissions analysed by two separate service providers. All results were compliant.
18/03/2009 Page 3/5

Objective Objective Rationale4 To reduce emissions to ground and water,
including groundwater, from IDLThe Register of Aspects & Impacts has identified the impacts associated with emissions to ground as significant. In addition, the IPPC licence contains a number of specific conditions regarding monitoring, control and other measures to protectground and groundwater
Target Plan Responsible Creation Date Target Date Status Update4.3 Review containment measures for spillage of
waste water at the effluent outfall.4.2.1 IDL intend to check the adequacy of containment
measures for spillage of waste water at the effluentoutfall.
Environmental & Energy Manager 07 Feb 2006 31 Dec 2008 Deferred pending future expansion plansfor the site
4.4 To ensure that the oil/water interceptors arestructurally sound.
4.3.1 To perform an integrity check on the oil/water interceptors.
Environmental & Energy Manager 07 Feb 2006 31 Dec 2008 One checked and deemed to be structurally sound. The second due to be decommissioned wit the installation of the MVR evaporator
4.6 To ensure the integrity of unbunded vessels.. 4.6.1 Conduct integrity tests on specific bulk tanks every two years using external contractor.
Environmental & Energy Manager 27 Feb 2008 31 Dec 2009 Due in 2009.
4.6.2 To replace the Thick Stillage Tank and provide bunding for same
Environmental & Energy Manager 27 Feb 2008 31 Dec 2008 Complete.
4.6.3 To replace the Thin Stillage Tank and provide bunding for same
Environmental & Energy Manager 27 Feb 2008 31 Dec 2008 Not possible to relocate the tank.
Objective Objective Rationale6 To control and minimise waste generated at
IDL Midleton so as to prevent pollution. The control of waste (storage, segregation, disposal, etc) and reduction of waste at source is an integral part of IDLs business and is part of IDLs IPC Licence (No. 442).
Target Plan Responsible Creation Date Target Date Status Update6.1 Conduct waste contractor audits. 6.1.1 Continue waste contractor audit programme
(Composting contractor, wood shaving contractor, grain rubble agents).
Environmental & Energy Manager 07 Feb 2006 31 Dec 2008 Deferred due to lack of resources.
Objective Objective RationaleTo prevent incidents with the potential forenvironmental consequences.
Projects designed to prevent incidents with the potential for environmental consequences will help to minimise emergency emissions to air, water and land.
Target Responsible Creation Date Target Date Status Update7.7 Ensure that old fermenters are decommissioned
in a proper manner.7.7.1 Decommissioning plan to be documented for old
fermenters as per IPPC licence requirements. Environmental & Energy Manager 07 Feb 2006 31 Dec 2012 Deferred pending
future expansion plansfor the site
18/03/2009 Page 4/5

Objective Objective Rationale8 To improve the efficiency of resource and
energy use.IDL is committed to energy conservation and recognise that the environmental impacts associated with on-site energy and resource usage are significant.
Target Plan Responsible Creation Date Target Date Status Update8.3 Reuse cavern water as process water in the
plant, thus saving on total volume of water usage.8.3.1 IDL intend to divert the cavern water that has been
used for process cooling to the Bowen Water Treatment Plant, thus making it available as process water.
Distillery Operations Manager 07 Feb 2006 31 Dec 2009 Deferred. Additional controls would be required before this would be acceptable under ISO 22000
Objective Objective Rationale9 To improve the level of environmental
awareness and training at IDL. Employee and contractor training to address (i) the prevention of incidents with the potential for environmental consequences (ii) a site-wide awareness and commitment to achieving IDLs environmental
Target Plan Creation Date Target Date Status Update9.1 Provide training to all employees on general
environmental awareness.9.1.1 Re-induct all employees and cover site rules and
best practice.Environmental & Energy Manager 07 Feb 2006 31 Dec 2009 Ongoing.
18/03/2009 Page 5/5

Environmental Management Programme - Proposal

Objective Objective Rationale1 To develop and improve site-wide environmental
management in accordance with ISO 14001 and related IPC Licence.
The environmental management system provides a structured framework for co-ordinating site-wide environmental affairs and sustaining IDLs policy of continual improvement.
Target Plan Responsible Creation Date Target Date Status Update1.1 IDL has established a baseline for river water
quality and will continue to ensure that it has no adverse effect on same.
1.1.1 To repeat the biological survey of river water quality for Dungourney and Millstream
Environmental & Energy Manager 07 Feb 2006 31 Dec 2012
1.2 IDL intends to establish a baseline for flora andfauna levels at the sites so as to preserve theecological habitats that exist.
1.1.2 To perform a baseline flora and fauna survey. Environmental & Energy Manager 07 Feb 2006 31 Dec 2012
Objective Objective Rationale2 To reduce emissions to sewer from IDL. The IPPC licence (No. P0442-01) contains a number
of specific conditions regarding the monitoring, control and reduction of emissions to sewer and waters. The emissions have been calculated as significant
Target Plan Responsible Creation Date Target Date Status Update2.1 To replace the existing pumps within the main on-
site pumping station.2.1.1 Upgrade existing pumps within the main on-site
pumping station (this project will be implemented as part of the overall plant upgrade works).
Environmental & Energy Manager 01 Jan 2006 31 Dec 2012
Objective Objective Rationale3 To reduce emissions to atmosphere from the IDL
Site.The evaluation of environmental impacts has identified emissions to atmosphere as significant.
Target Responsible Creation Date Target Date Status Update3.2 To continue to investigate possible methods of
CO2 recovery. 3.2.1 IDL intend to continue to investigate methods of
recovering process CO2 emissions. Environmental & Energy Manager 07 Feb 2006 31 Dec 2012
Environmental Objectives & Targets Proposal 2009
Return to Index
18/03/2009 Page 1/3

Objective Objective Rationale4 To reduce emissions to ground and water,
including groundwater, from IDLThe Register of Aspects & Impacts has identified the impacts associated with emissions to ground as significant. In addition, the IPPC licence contains a number of specific conditions regarding monitoring, control and other measures to protectground and groundwater
Target Plan Responsible Creation Date Target Date Status Update4.3 Review containment measures for spillage of
waste water at the effluent outfall.4.2.1 IDL intend to check the adequacy of containment
measures for spillage of waste water at the effluentoutfall.
Environmental & Energy Manager 07 Feb 2006 31 Dec 2012
4.6 To ensure the integrity of unbunded vessels. 4.6.1 Conduct integrity tests on specific bulk tanks every two years using external contractor.
Environmental & Energy Manager 27 Feb 2008 31 Dec 2009
4.7 To ensure the integrity of the foul sewer. 4.7.1 Carry out the 3-year test and inspection. Environmental & Energy Manager 19 Feb 2009 31 Dec 20094.8 To ensure the integrity of the organic drainage
system.4.8.1 Carry out the 3-year test and inspection. Environmental & Energy Manager 19 Feb 2009 31 Dec 2009
4.9 To ensure the integrity of the bund system. 4.9.1 Carry out the 3-year test and inspection. Environmental & Energy Manager 19 Feb 2009 31 Dec 2009
Objective Objective Rationale6 To control and minimise waste generated at
IDL Midleton so as to prevent pollution. The control of waste (storage, segregation, disposal, etc) and reduction of waste at source is an integral part of IDLs business and is part of IDLs IPC Licence (No. 442).
Target Plan Responsible Creation Date Target Date Status Update6.1 Conduct waste contractor audits. 6.1.1 Continue waste contractor audit programme
(Composting contractor, wood shaving contractor, grain rubble agents).
Environmental & Energy Manager 07 Feb 2006 31 Dec 2009
Objective Objective RationaleTo prevent incidents with the potential forenvironmental consequences.
Projects designed to prevent incidents with the potential for environmental consequences will help to minimise emergency emissions to air, water and land.
Target Responsible Creation Date Target Date Status Update7.7 Ensure that old fermenters are decommissioned
in a proper manner.7.7.1 Decommissioning plan to be documented for old
fermenters as per IPPC licence requirements. Environmental & Energy Manager 07 Feb 2006 31 Dec 2012
18/03/2009 Page 2/3

Objective Objective Rationale8 To improve the efficiency of resource and
energy use.IDL is committed to energy conservation and recognise that the environmental impacts associated with on-site energy and resource usage are significant.
Target Plan Responsible Creation Date Target Date Status Update8.3 Reuse cavern water as process water in the
plant, thus saving on total volume of water usage.8.3.1 IDL intend to divert the cavern water that has been
used for process cooling to the Bowen Water Treatment Plant, thus making it available as process water.
Distillery Operations Manager 07 Feb 2006 31 Dec 2012
8.4 To reduce energy consumption and GHG emissions.
8.4.1 To replace the quadruple effect evaporator with a mechanical vapour recompression unit.
General Manager 01 Jul 2007 31 Mar 2009
8.4.2 To investigate to potential for low temperature brewing.
General Manager 01 Oct 2008 31 Dec 2009
Objective Objective Rationale9 To improve the level of environmental
awareness and training at IDL. Employee and contractor training to address (i) the prevention of incidents with the potential for environmental consequences (ii) a site-wide awareness and commitment to achieving IDLs environmental
Target Plan Creation Date Target Date Status Update9.1 Provide training to all employees on general
environmental awareness.9.1.1 Re-induct all employees and cover site rules and
best practice.Environmental & Energy Manager 07 Feb 2006 31 Dec 2009
18/03/2009 Page 3/3

4.0 RELATIONSHIP WITH IPPC LICENCE CONDITIONS AND REGISTER OF ENVI-
RONMENTAL ASPECTS AND IMPACTS Schedule 6(i) of IDL’s IPPC Licence (No. P0442-01) includes a list of specific items
to be addressed in the Schedule of Objectives and Targets. Table 4.1 summarises the targets listed in the IPPC licence (No. P0442-01) and the plans IDL has to en-sure that they are achieved.
TABLE 4.1
Reuse of timber pallets 6.6 List I and List II substance reductions
1.2
Reduction in noise emis-sions from the site
5.2
Reduction in the volume and pollutant concentration of emissions to sewer
2.2
Integrity testing of tanks 4.17 Recovery of CO2 from fer-menters
3.3
Table 4.2 below summarises the targets and plans, which relate to the significant
environmental impacts identified in the Register of Environmental Aspects and Im-pacts.
TABLE 4.2
Emissions to sewer 2.1 to 2.20 inclusive Emissions to water (includ-ing groundwater)
4.1 to 4.19 in-clusive
Water Usage 8.1 8.2 8.3 8.4 8.7 Air Emissions 3.1 3.2 Hazardous waste 6.1 6.2 6.3 Emergencies 7.1 to
7.10 in-clusive

Pollution Emission Register – Proposal

Reg No. 442 1 of 7
PROPOSAL
FOR A
POLLUTION EMISSIONS REGISTER
AT
IRISH DISTILLERS LTD.
MIDLETON

Reg No. 442 2 of 7
Contents
1.0 INTRODUCTION 2.0 IDENTIFICATION OF SUBSTANCES 3.0 PROPOSED METHODOLOGY 4.0 CONCLUSIONS Appendix 1 EPA Pollution Emissions Register List

Reg No. 442 3 of 7
1.0 INTRODUCTION Irish Distillers Ltd’s Integrated Pollution Control Licence (Register No. P-
0442-01) requires the licensee to prepare a Pollution Emissions Register (PER) for the activity.
The list of substances to be considered for inclusion in the PER is speci-
fied in the EPA Annual Environmental Report (AER) Guidance Note (in-cluded as Appendix 1 of this report).
Irish Distillers Ltd. have compared the materials used at the site with the
list of substances in Appendix 1 of this report and have proposed a list of materials for inclusion for a PER in Section 4.0 of this report for review by the EPA. The proposed methodology for quantification of material flows of the PER materials at Irish Distillers Ltd. is also described.
Reg No. 442 4 of 7
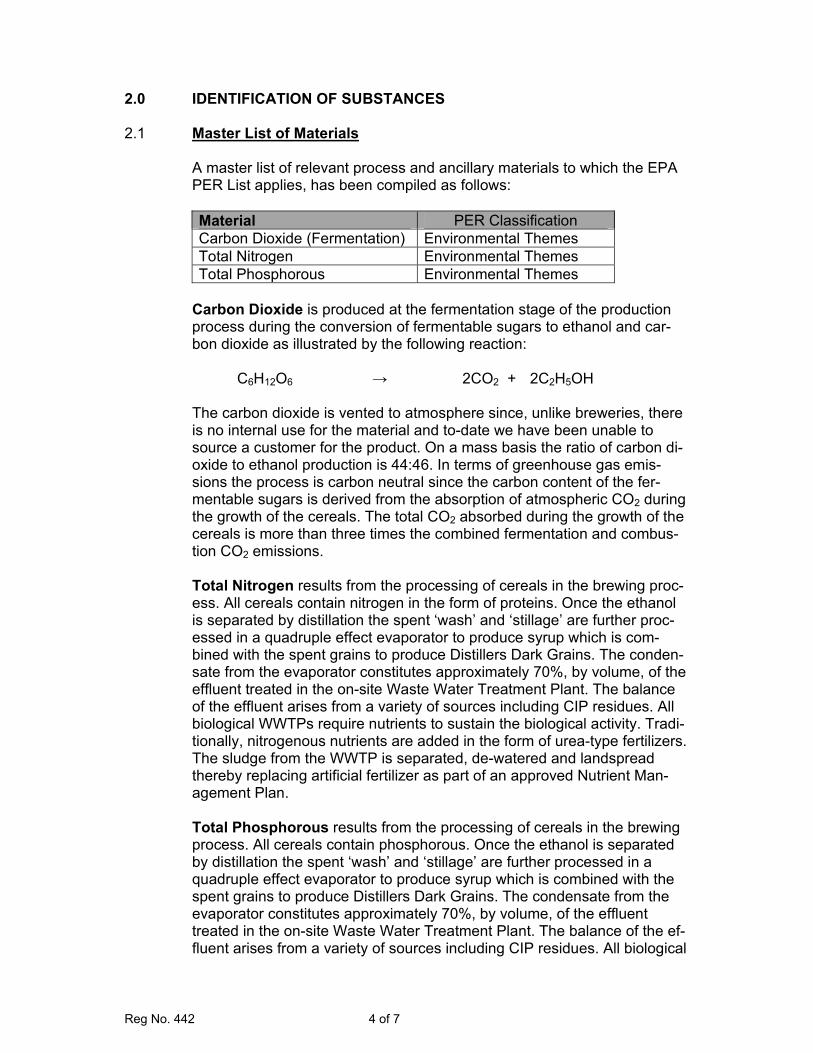
2.0 IDENTIFICATION OF SUBSTANCES 2.1 Master List of Materials A master list of relevant process and ancillary materials to which the EPA
PER List applies, has been compiled as follows:
Material PER Classification Carbon Dioxide (Fermentation) Environmental Themes Total Nitrogen Environmental Themes Total Phosphorous Environmental Themes
Carbon Dioxide is produced at the fermentation stage of the production process during the conversion of fermentable sugars to ethanol and car-bon dioxide as illustrated by the following reaction: C6H12O6 → 2CO2 + 2C2H5OH The carbon dioxide is vented to atmosphere since, unlike breweries, there is no internal use for the material and to-date we have been unable to source a customer for the product. On a mass basis the ratio of carbon di-oxide to ethanol production is 44:46. In terms of greenhouse gas emis-sions the process is carbon neutral since the carbon content of the fer-mentable sugars is derived from the absorption of atmospheric CO2 during the growth of the cereals. The total CO2 absorbed during the growth of the cereals is more than three times the combined fermentation and combus-tion CO2 emissions.
Total Nitrogen results from the processing of cereals in the brewing proc-ess. All cereals contain nitrogen in the form of proteins. Once the ethanol is separated by distillation the spent ‘wash’ and ‘stillage’ are further proc-essed in a quadruple effect evaporator to produce syrup which is com-bined with the spent grains to produce Distillers Dark Grains. The conden-sate from the evaporator constitutes approximately 70%, by volume, of the effluent treated in the on-site Waste Water Treatment Plant. The balance of the effluent arises from a variety of sources including CIP residues. All biological WWTPs require nutrients to sustain the biological activity. Tradi-tionally, nitrogenous nutrients are added in the form of urea-type fertilizers. The sludge from the WWTP is separated, de-watered and landspread thereby replacing artificial fertilizer as part of an approved Nutrient Man-agement Plan. Total Phosphorous results from the processing of cereals in the brewing process. All cereals contain phosphorous. Once the ethanol is separated by distillation the spent ‘wash’ and ‘stillage’ are further processed in a quadruple effect evaporator to produce syrup which is combined with the spent grains to produce Distillers Dark Grains. The condensate from the evaporator constitutes approximately 70%, by volume, of the effluent treated in the on-site Waste Water Treatment Plant. The balance of the ef-fluent arises from a variety of sources including CIP residues. All biological
Reg No. 442 5 of 7
WWTPs require nutrients to sustain the biological activity. Traditionally, phosphate nutrients are added in the form of tri-sodium phosphate or phosphoric acid. The sludge from the WWTP is separated, de-watered and landspread thereby replacing artificial fertilizer as part of an approved Nutrient Management Plan..
2.2 Materials requiring Full PER It is not proposed to carry out a full PER on any of the substances listed in
2.1 due to the limited use and/or lack of persistence of these substances in the environment.
2.3 Materials subject to Discharge Reporting
Irish Distillers Ltd proposes that the following material be subjected to a
PER Discharge Report:
Reference Material PER1 Carbon Dioxide (Fermentation) PER2 Total Nitrogen PER3 Total Phosphorous
3.0 PROPOSED METHODOLOGY In each case, the PER will be based on a material balance equation. If the
site is considered as a “box”, then all material entering, leaving and accu-mulating must be accounted for. Manipulation of this data will result in a percentage of material that cannot be accounted for. It does not automati-cally follow that this is to be considered as an emission.
The proposed timeframe for individual mass balances is twelve months. 3.1 Carbon Dioxide (Fermentation) The CO2 generated during the fermentation process is determined by ref-
erence to the total ethanol production. CO2 and ethanol are produced in equimolar quantities and the quantity of CO2 relative to ethanol is the same as the ratio of their molecular weights i.e. 44 and 46, respectively. All CO2 is vented to atmosphere.
3.2 Total Nitrogen
The bulk of the nitrogen content of the cereals used in the process is re-covered in the Distillers Dark Grains. The nitrogen content of the cereals ranges from 1.28% (m/m) in the case of maize to 1.78% (m/m) in the case

Reg No. 442 6 of 7
of barley. The nitrogen in the waste water results from the processing of various cereals and is essentially absorbed by the biomass in the WWTP as a nutrient and subsequently shed as sludge or is discharged in the treated waste water. The sludge was then used for landspreading accord-ing to an approved Nutrient Management Plan. This is classed as offsite waste recovery. Since the beginning of 2005 all sludge produced in the WWTP has been disposed of by composting. Some residual sludge pro-duced in 2004 and stored in the on-farm slurry pit was landspread in 2005. Reference Measurement C Total Nitrogen content of cereals N Total Nitrogen added as nutrient G Total Nitrogen content of Dark Grains D Total Nitrogen content of Waste Water Discharge S Total Nitrogen recovered in WWTP Sludge
The PER determination may be expressed by the formula:
C + N = G + D + S
3.4 Total Phosphorous
The bulk of the phosphorous content of the cereals used in the process is recovered in the Distillers Dark Grains. The phosphorous content of the cereals ranges from 0.27% (m/m)in the case of maize to 1.0% (m/m) in the case of malt. The phosphorous in the waste water results from the proc-essing of various cereals and is essentially absorbed by the biomass in the WWTP as a nutrient and subsequently shed as sludge or is discharged in the treated waste water. The sludge is then used for landspreading ac-cording to an approved Nutrient Management Plan. This is classed as off-site waste recovery. Since the beginning of 2005 all sludge produced in the WWTP has been disposed of by composting. Some residual sludge produced in 2004 and stored in the on-farm slurry pit was landspread in 2005. Reference Measurement C Total Phosphorous content of cereals N Total Phosphorous added as nutrient G Total Phosphorous content of Dark Grains D Total Phosphorous content of Waste Water Dis-
charge S Total Phosphorous recovered in WWTP Sludge
The PER determination may be expressed by the formula:

Reg No. 442 7 of 7
C + N = G + D + S
4.0 CONCLUSIONS This report has reviewed the criteria set by the EPA for a PER and submits
the following list of materials at Irish Distillers Ltd. for inclusion in a PER.
Reference Material PER1 Carbon Dioxide (Fermentation) PER2 Total Nitrogen PER3 Total Phosphorous

APPENDIX 1
EPA POLLUTION EMISSIONS REGISTER LIST (PERL)

PERL
1. Environmental Themes 4. Other Organic Compounds CH4 Benzene CO Benzene, toluene, ethylbenzene, xy-
lene CO2 Brominated diphenylether HFCs Organotin - compounds N2O Polycyclic Aromatic Hydrocarbons NH3 Phenols Non-Methane VOCs Total Organic Carbon NOX PFCs 5. Other Compounds SF6 Chlorides SOX Chlorine and inorganic compounds Total Nitrogen Cyanides Total Phosphorus
Fluorides
Fluorine and inorganic compounds 2. Heavy Metals HCN As and compounds PM10
Cd and compounds Cr and compounds Cu and compounds Hg and compounds Ni and compounds Pb and compounds Zn and compounds 3. Chlorinated Organic Sub-stances
Dichloroethane-1,2 (DCE) Dichloromethane (DCM)Chloro-alkanes (C10-13)
Hexachlorobenzene (HCB) Hexachlorobutadiene (HCBD) Hexachlorocyclohexane (HCH) Halogenated organic compounds PCDD+PCDF (dioxins+furans) Pentachlorophenol (PCP) Tetrachloroethylene (PER) Tetrachloromethane (TCM) Trichlorobenzenes (TCB) Trichloroethane-1,1,1 (TCE) Trichloroethylene (TRI) Trichloromethane

4.0 Licence-Specific Reports
Tank and pipeline testing and inspection report
Noise Monitoring
Groundwater Monitoring (GW1 to GW5)
List I & II substance reductions
Bund Inspection Report
Pollution Emission Register – Report
Review of Environmental Liabilities Insurance Cover
All other required reports are contained in the previous sections. Appendix I: Boundary Noise Report Appendix II: Atmospheric Monitoring Report Appendix III: Groundwater Monitoring Results

Tank and pipeline testing and inspection report A weekly inspection of valves and flanges in sensitive areas is carried and a record of the inspection is maintained. There were no issues to report. A list of critical vessels is maintained and these are subjected to an inspection every two years by an independent agency. The report was last conducted in 2007. The next inspection is scheduled for 2009. The foul and organic drains were subjected to inspection/ testing programme during 2006. The remedial work indicated in the report was undertaken in 2007. The next scheduled inspection is due to take place in 2009. Noise Monitoring A boundary noise survey was conducted on 8th June 2008 by AWN Consult-ing. The results (Appendix I) show that the noise levels are in compliance with the License conditions with the exception of the nighttime levels at Noise Sen-sitive Location 1 (NSL1). A repeat survey will be conducted before the end of March 2008, weather permitting. Groundwater Monitoring (GW1 to GW5) Four boreholes, GW1 to GW4, are monitored annually for groundwater and the fifth, GW5, is monitored biannually for groundwater and landfill gas. The analytical results for GW1 to GW4 (Appendix III) show normal groundwater values. GW5 is located in the disused landfill and was sunk to bedrock level and for the past number of years the borehole has been dry indicating little or no infiltration. The landfill gas analysis occasionally shows trace levels of methane and carbon dioxide. List I & II substance reductions There are no List I or List II substances on site. Bund Inspection Report All bunds were inspected by an independent third party in 2006 as required by the Licence. The next scheduled inspection will take place in 2009.
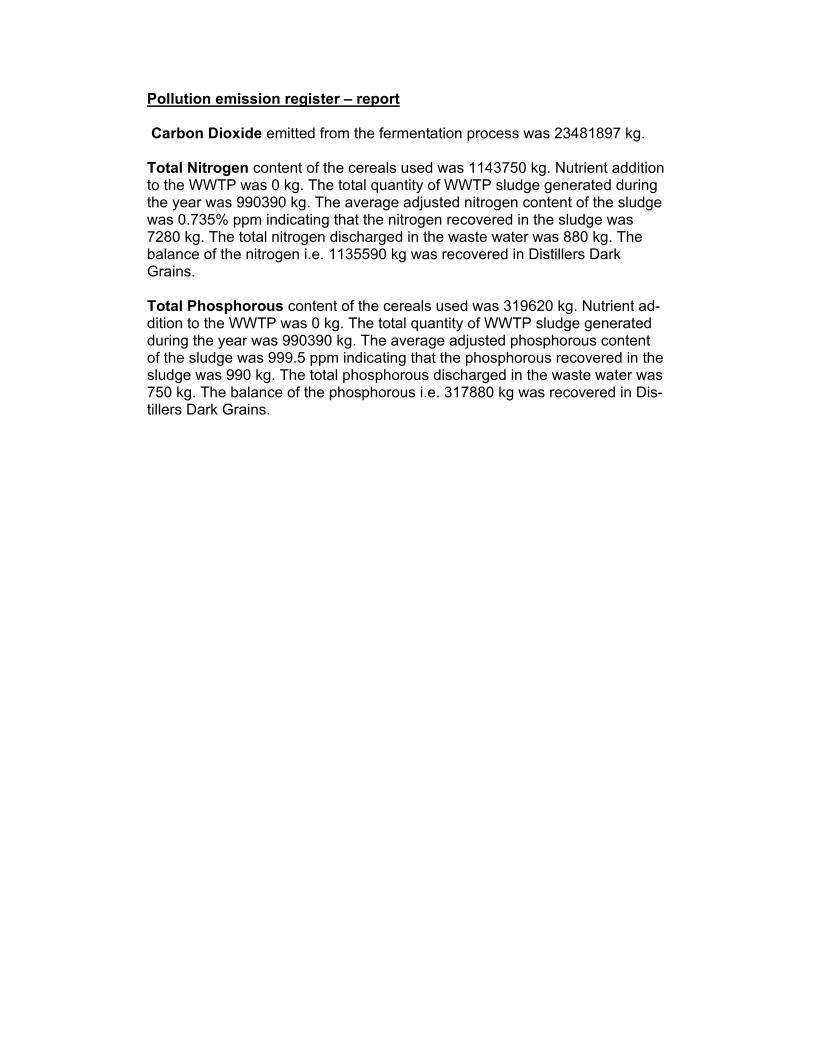
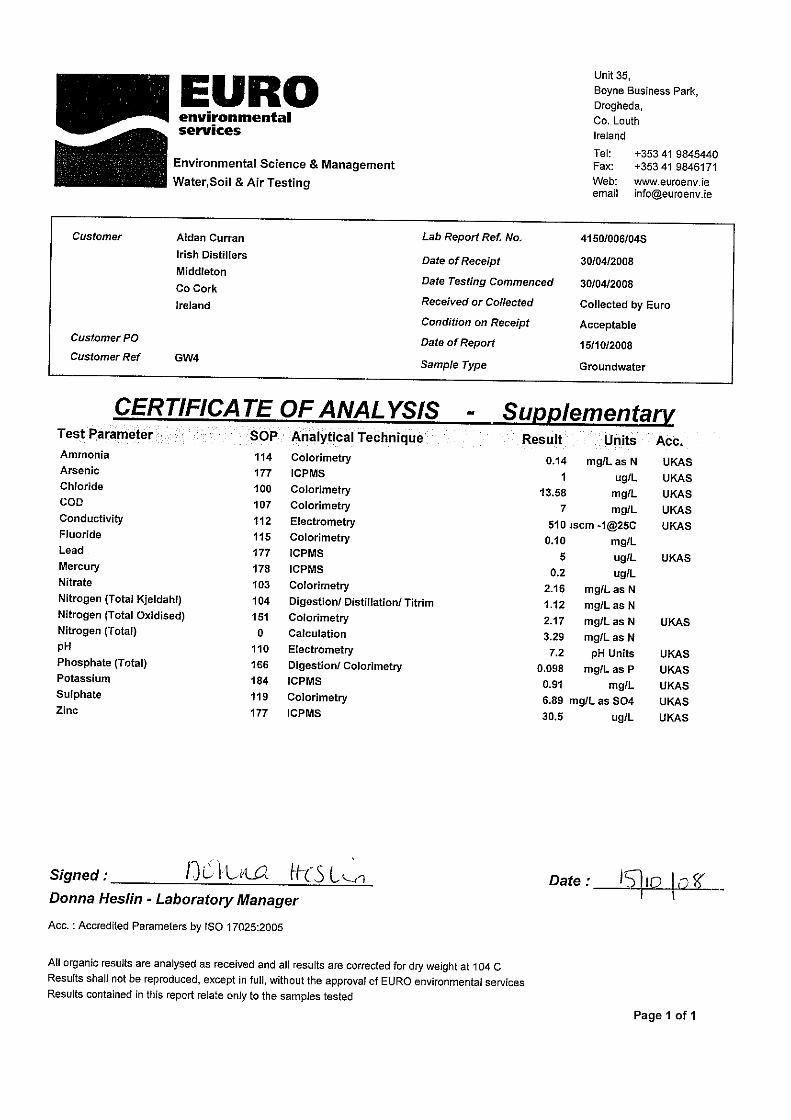
Pollution emission register – report Carbon Dioxide emitted from the fermentation process was 23481897 kg. Total Nitrogen content of the cereals used was 1143750 kg. Nutrient addition to the WWTP was 0 kg. The total quantity of WWTP sludge generated during the year was 990390 kg. The average adjusted nitrogen content of the sludge was 0.735% ppm indicating that the nitrogen recovered in the sludge was 7280 kg. The total nitrogen discharged in the waste water was 880 kg. The balance of the nitrogen i.e. 1135590 kg was recovered in Distillers Dark Grains. Total Phosphorous content of the cereals used was 319620 kg. Nutrient ad-dition to the WWTP was 0 kg. The total quantity of WWTP sludge generated during the year was 990390 kg. The average adjusted phosphorous content of the sludge was 999.5 ppm indicating that the phosphorous recovered in the sludge was 990 kg. The total phosphorous discharged in the waste water was 750 kg. The balance of the phosphorous i.e. 317880 kg was recovered in Dis-tillers Dark Grains.

Pollution Emissions Register If PER does not apply to your license, please tick here
Outputs
Pollutant Name CAS No. Input Gross Usage Emissions to air MOM Emissions to waters
MOM Waste MOM Product MOM Recovery Treated Unaccounted
Carbon Dioxide 23,481,897 23,481,897 23,481,897 C Total Nitrogen 1,143,750 1,143,750 0 880 M 0 1,135,590 C 7,280 0 0Total Phosphorous 319,620 319,620 0 750 M 0 317,880 C 990 0 0

Review of Environmental Liabilities Insurance Cover Irish Distillers Ltd. and its parent company Irish Distillers Group Ltd are sub-sidiaries of the French multinational drinks company Group Pernod Ricard. Irish Distillers Group and Subsidiary Companies carry a Public Liability Policy which is placed with a panel of insurers, AXA Insurance Company being the leading office. They also have a policy enforce for pollution through AIG with a limit of in-demnity of €35,000,000 including the following sub limits: Accidental Contamination - €30,000,000 – AIG and Nassau. Criminal Contamination - €35,000,000. Pollution cover applies if it is caused by a sudden, identifiable, unattended and unexpected incident which takes place in its entirety at a specific time and place during the period of insurance. Pollution or contamination is defined in the policy to mean: 1. All pollution or contamination of buildings or other structures or of water or
land or the atmosphere and; 2. All loss or damage or injury directly or indirectly caused by such pollution
or contamination. This level of cover is in excess of the potential liabilities outlined in the Envi-ronmental Liabilities Risk Assessment report submitted to and approved by the Environmental Protection Agency.

Appendix I: Boundary Noise Report

IRISH DISTILLERS IPPC NOISE EMISSION SURVEY
MIDLETON CO CORK
_______________________________________________ Technical Report Prepared For
Irish Distillers Midleton Distilleries
Midleton Co. Cork
_______________________________________________
Technical Report Prepared By
Brian S. Johnson BSci (Eng), MIOA
_______________________________________________
Our Reference
BJ/08/4329NR01a
_______________________________________________
Date Of Issue
30 June 2008
_______________________________________________

BJ/08/4329NR01a AWN Consulting Limited _____________________________________________________________________________________________________
_____________________________________________________________________________________________________
Page 2
EXECUTIVE SUMMARY The Environmental Protection Agency (EPA) have recommended that noise monitoring be carried out at a number of locations in the vicinity of the Irish Distillers facility in Midleton, Co. Cork to demonstrate compliance with the appropriate guidance. Environmental noise surveys have been carried out at selected locations in and around the Midleton site during both daytime and night time periods. The surveys were conducted in accordance with the Environmental Survey Guidance Document 2003 as issued by the EPA. The nearest noise sensitive locations in relation to the site are located immediately adjacent to the northern boundary of the property and 150m to the east. The results of the survey indicate that noise emissions associated with the facility in question are within the EPA licensing noise criteria at all off site noise sensitive locations during daytime periods. Night time noise emissions were in excess of the criteria at the north boundary noise sensitive locations but were compliant at all other locations.
Report Prepared By: Report Checked By:
BRIAN JOHNSON DAMIAN KELLY Senior Acoustic Consultant Principal Acoustic Consultant

BJ/08/4329NR01a AWN Consulting Limited _____________________________________________________________________________________________________
_____________________________________________________________________________________________________
Page 3
CONTENTS Page
Executive Summary 2
1.0 Introduction 4
2.0 Survey Details 4
2.1 Choice Of Measurement Locations 4
2.2 Survey Periods 5
2.3 Personnel & Instrumentation 5
2.4 Procedure 5
2.5 Measurement Parameters 5
2.6 Results 6
3.0 Discussion & Conclusions 8
3.1 Daytime Noise Levels 8
3.2 Night Time Noise Levels 9
Figure 1 – Noise Measurement & Noise Sensitive Location Map 10
Appendix A – One Third Octave Band Centre Frequency Data 11

BJ/08/4329NR01a AWN Consulting Limited _____________________________________________________________________________________________________
_____________________________________________________________________________________________________
Page 4
1.0 INTRODUCTION AWN Consulting Limited have been commissioned by Irish Distillers to conduct a noise monitoring survey at their facility in Midleton, Co. Cork. This noise monitoring is being conducted in order to comply with the recommendations of the Environmental Protection Agency (EPA). The operational hours for the facility are continuous and 24 hours in nature. Appropriate guidance may be taken from the current EPA license as follows.
Activities on site shall not give rise to noise levels off site at noise sensitive locations which exceed the following sound pressure limits (Leq, 15min): Daytime: 55dB(A) Night-time: 45dB(A) There shall be no clearly audible tonal component or impulsive component in the noise emission from the activity at any noise sensitive location.
The following criteria would therefore apply at the façades of those residential properties closest to the development:
Daytime (08:00 hrs to 22:00 hrs) 55dB LAeq,30min Night-time (22:00 hrs to 08:00 hrs) 45dB LAeq,30min
2.0 SURVEY DETAILS
An environmental noise survey was conducted in order to quantify the existing noise environment. The survey was conducted generally in accordance with the Environmental Survey Guidance Document 2003. Specific details are set out below.
2.1 Choice of Measurement Locations
Measurements were conducted at four locations along the Irish Distillers facility property boundary. Location NSL1 This measurement position is located along the northern
boundary adjacent to the nearest residence. Location N1 This measurement position is located along the western
boundary approximately 150m away from Midleton college. Location N2 This measurement position is located along the southern
boundary and is adjacent to a green fields site. Location N3 This measurement position is also located along the southern
boundary and is also adjacent to a green fields site. The nearest noise sensitive locations to the facility are a number of detached houses along the northern boundary adjacent to NSL1.

BJ/08/4329NR01a AWN Consulting Limited _____________________________________________________________________________________________________
_____________________________________________________________________________________________________
Page 5
Midleton College locates approximately 150m to the east of N1; we will refer to the nearest college building as Noise Sensitive Location 2 (NSL2). Noise measurements conducted at N1 were used to project levels at NSL2 . All survey measurement and nearest noise sensitive locations are detailed in Figure 1 to the rear of this document.
2.2 Survey Period Measurements were conducted over the course of both day and night time survey periods as follows:
• Daytime: 2:05hrs to 16:05hrs on 15 May 2008;
• Night time : 22:15hrs to 00:40hrs on 28/29 May 2008. The weather throughout the daytime survey period was warm and clear with a mild breeze of approximately 1 – 2 m/s. The weather throughout the night time survey period was also warm and clear with no significant wind present.
2.3 Personnel & Instrumentation
Brian S. Johnson (AWN) conducted the noise level measurements during both survey periods. The measurements were performed using a Brüel & Kjær Type 2260 Type 1 Sound Level Meter which satisfies BS EN 60651:1994. Before and after the survey, the measurement apparatus was check calibrated using a Brüel & Kjær Type 4231 Sound Level Calibrator.
2.4 Procedure
Measurements were conducted at Locations 1 to 4 on a cyclical basis during both survey periods. Sample periods for the noise measurements were nominally 15 minutes. The results were noted onto a Survey Record Sheet immediately following each sample, and were also saved to the instrument memory for later analysis where appropriate. Survey personnel noted all primary noise sources contributing to noise build-up.
2.5 Measurement Parameters
The survey results are presented in terms of the following five parameters: LAeq is the equivalent continuous sound level. It is a type of average and is used
to describe a fluctuating noise in terms of a single noise level over the sample period.
LAmax is the instantaneous maximum sound level measured during the sample
period. LAmin is the instantaneous minimum sound level measured during the sample
period. LA10 is the sound level that is exceeded for 10% of the sample period. It is
typically used as a descriptor for traffic noise.

BJ/08/4329NR01a AWN Consulting Limited _____________________________________________________________________________________________________
_____________________________________________________________________________________________________
Page 6
LA90 is the sound level that is exceeded for 90% of the sample period. It is
typically used as a descriptor for background noise. The “A” suffix denotes the fact that the sound levels have been “A-weighted” in order to account for the non-linear nature of human hearing. All sound levels in this report are expressed in terms of decibels (dB) relative to 2x10⁻⁵ Pa.
2.6 Results 2.6.1 Location NSL1
The results of measurements conducted at Location NSL1 are summarised in Table 1.
Measured Noise Levels (dB re. 2x10
-5 Pa) Time Period
LAeq LAmax LAmin LA10 LA90
Dominant Noise Sources
12:10 – 12:25 55 69 48 58 50 Plant noise. Frequent
dog barking from NSL1.
13:30 – 13:45 53 61 48 57 50 Plant noise.
14:50 – 15:05
Day
53 66 48 55 50 Plant noise.
22:15 – 22:30 50 61 49 51 49 Plant noise.
23:30 – 23:45 Night
58 62 47 60 49 Plant noise.
Table 1 Summary of results for Location NSL1
Daytime noise measurements at this location were dominated by plant noise. There were also contributions from birdsong, roosters crowing at a nearby residence and occasional car park event contributions. A dog at NSL1 barked frequently during the first survey period. Noise levels were in the range of 53 to 55dB LAeq and of the order of 50dB LA90. No audible tonal or impulsive characteristics were noted in plant noise emissions at this location. Night time noise measurements were controlled almost exclusively by plant noise with occasional contributions from the dog at NSL1. During the second survey period, a CIP process (cleaning in place) of the fermenter vessels occurred which significantly increased the measured noise levels (we understand this process to be an occasional noise source only). Noise levels were in the range of 50 to 58dB LAeq and of the order of 49dB LA90. No audible tonal or impulsive characteristics were noted in plant noise emissions at this location.

BJ/08/4329NR01a AWN Consulting Limited _____________________________________________________________________________________________________
_____________________________________________________________________________________________________
Page 7
2.6.2 Location N1 The results of measurements conducted at Location N1 are summarised in Table 2.
Measured Noise Levels (dB re. 2x10
-5 Pa) Time Period
LAeq LAmax LAmin LA10 LA90
Dominant Noise Sources
12:30 – 12:45 56 63 54 56 55 Plant noise.
13:50 – 14:05 56 78 52 55 53 Plant noise.
15:10 – 15:25
Day
54 63 52 55 53 Plant noise.
22:35 – 22:50 53 55 51 53 52 Plant noise.
23:45 – 00:00 Night
53 64 52 54 53 Plant noise.
Table 2 Summary of results for Location N1
Daytime noise measurements at this location were dominated by plant noise. There were also contributions from birdsong and occasional activity noise from the adjacent school playground. A forklift drive by event occurred during the second survey period. Noise levels were in the range of 54 to 56dB LAeq and 53 to 55dB LA90. No audible tonal or impulsive characteristics were noted in plant noise emissions at this location. Night time noise measurements were exclusively dominated by plant noise. One car drive by event occurred during the second survey period. Noise levels were in the range of 53 to 54dB LAeq and 52 to 53dB LA90. No audible tonal or impulsive characteristics were noted in plant noise emissions at this location.
2.6.3 Location N2 The results of measurements conducted at Location N2 are summarised in Table 3.
Measured Noise Levels (dB re. 2x10
-5 Pa) Time Period
LAeq LAmax LAmin LA10 LA90
Dominant Noise Sources
12:50 – 13:05 53 62 51 54 52 Plant noise. Birdsong.
14:10 – 14:25 51 61 48 52 49 Plant noise. Birdsong.
15:30 – 15:45
Day
51 63 48 52 49 Plant noise. Birdsong.
22:50 – 23:05 50 55 49 50 49 Plant noise.
00:05 – 00:20 Night
50 61 45 49 48 Plant noise.
Table 3 Summary of results for Location N2
Daytime noise measurements at this location were dominated by plant noise with some contributions from birdsong in the nearby trees. Noise levels were in the range of 51 to 53dB LAeq and 49 to 52dB LA90. No audible tonal or impulsive characteristics were noted in plant noise emissions at this location. Night time noise measurements were exclusively dominated both by noise from the main plant facility and the nearby pumping station. Noise levels were of the order of 50dB LAeq and in the range of 48 to 49dB LA90. No audible tonal or impulsive characteristics were noted in plant noise emissions at this location.

BJ/08/4329NR01a AWN Consulting Limited _____________________________________________________________________________________________________
_____________________________________________________________________________________________________
Page 8
2.6.4 Location N3 The results of measurements conducted at Location N4 are summarised in Table 4.
Measured Noise Levels (dB re. 2x10
-5 Pa) Time Period
LAeq LAmax LAmin LA10 LA90
Dominant Noise Sources
13:10 – 13:25 50 58 46 51 48 Plant noise. Birdsong.
14:30 – 14:45 49 62 46 50 48 Plant noise. Birdsong.
15:50 – 16:05
Day
50 64 45 51 47 Plant noise. Birdsong.
23:10 – 23:25 48 53 46 49 47 Plant noise.
00:25 – 00:40 Night
48 55 46 48 47 Plant noise.
Table 4 Summary of results for Location N3
Daytime noise measurements at this location were exclusively dominated by plant noise with some contributions from birdsong in the nearby trees. Distant traffic noise was also faintly audible. Noise levels were of in the range of 49 to 50dB LAeq and 47 to 48dB LA90. No audible tonal or impulsive characteristics were noted in plant noise emissions at this location. Night time noise measurements were exclusively dominated both by main facility plant noise. Noise levels were of the order of 48dB LAeq and 47dB LA90. No audible tonal or impulsive characteristics were noted in plant noise emissions at this location.
3.0 DISCUSSION & CONCLUSIONS Table 5 below outlines LAeq and LA90 level ranges monitored at all locations.
Reference Period LAeq (dB) LA90 (dB)
NSL1 53 - 55 50
N1 54 - 56 53 - 55
N2 51 - 53 49 - 52
N3
Day
49 - 50 47 - 48
NSL1 50 - 58 49
N1 53 - 54 52 - 53
N2 50 48 - 49
N3
Night
48 47
Table 5 Review of Measured LAeq and LA90 Levels
These noise levels are discussed in relation to the EPA daytime and night time noise criteria at the nearest noise sensitive locations in the following sections.
3.1 Daytime Noise Levels
Measured noise levels during the daytime period were all consistent with the daytime EPA noise sensitive location criterion of 55dB LAeq at the property boundary. Given that measurements conducted at location NSL1 were measured at the property line, predicted noise levels at the façade of NSL1 would therefore be of the same order (i.e. 53 – 55dB LAeq). Measurements conducted at location N1 were measured at a distance of approximately 20m from the western side of the main plant facility. Assuming that the measured noise levels were entirely due to plant operation noise and taking into account the likely attenuation due to distance, the estimated plant emission noise

BJ/08/4329NR01a AWN Consulting Limited _____________________________________________________________________________________________________
_____________________________________________________________________________________________________
Page 9
level at NSL2 (150m to the west) would be of the order of 36 – 38dB LAeq. These levels would be within the daytime EPA criterion of 55dB LAeq. No audible tonal or impulsive characteristics were noted in plant noise emissions at any of the measurement locations. In summary, all measured daytime noise levels were in accordance with the daytime EPA criterion. Plant daytime noise emission would therefore be compliant with EPA licensing requirements.
3.2 Night Time Noise Levels Measured night time noise levels at the property boundary with NSL1 were of the order of 50 – 58dB LAeq and would therefore be of the same order at the NSL1 dwelling façade. These levels would be some 5dB in excess of the night time EPA noise criterion of 45dB LAeq during normal plant operation and 13dB in excess of the criterion during CIP fermenter vessel events. Measurements conducted at location N1 were projected to NSL2 in similar fashion to the daytime calculations. The results of this calculation indicated that the plant emission noise level at NSL2 would be of the order of 35 – 36dB LAeq. These levels would be within the night time EPA criterion of 45dB LAeq. No audible tonal or impulsive characteristics were noted in plant noise emissions at any of the measurement locations. In summary, night time noise levels were generally in accordance with the night time EPA criterion except at NSL1.

Figure 1: Measurement Location & Noise Sensitive Location M
ap
N1
N3
NSL2
N2
NSL1

BJ/0
8/4
329N
R01
A
WN
Consultin
g L
imited
__________________
_________
__________________
______
___
__________________
_________
__________________
___
______
__________________
_________
__________________
_____
__________________
_________
__________________
______
___
__________________
_________
__________________
___
______
__________________
_________
__________________
____
P
age 1
1
APPENDIX A
1/3 Octave Band Centre Frequency Data
1/3
Octa
ve
Ba
nd
Fre
que
ncy D
ata
Lo
catio
n
Pe
rio
d
50
6
3
80
1
00
1
25
1
60
2
00
2
50
3
15
4
00
5
00
6
30
8
00
1
k
1.2
5k 1
.6k
2k
2.5
k 3
.15k
4k
5k
6.3
k
8k
10
k
12
.5k
dB
(A)
Da
y 1
6
0
57
5
4
53
4
9
48
4
9
43
4
2
43
4
4
47
4
8
46
4
6
44
4
3
42
4
0
38
3
4
31
2
7
23
1
9
55
Da
y 2
5
9
55
5
2
52
4
9
49
4
8
43
4
4
43
4
3
43
4
3
42
4
2
42
4
2
41
4
0
38
3
4
30
2
6
23
1
9
53
Da
y 3
5
9
56
5
2
51
4
9
48
4
9
43
4
1
41
4
1
44
4
5
43
4
4
44
4
1
41
3
9
36
3
4
30
2
7
24
2
1
53
Nig
ht
1
58
5
5
51
5
1
49
4
7
45
4
2
41
4
0
40
4
2
42
4
1
40
3
9
38
3
8
36
3
4
30
2
6
22
1
7
12
50
NS
L1
Nig
ht
2
59
5
5
50
5
1
48
4
6
48
4
5
47
4
7
46
4
7
47
4
7
47
4
8
49
4
8
46
4
3
40
3
6
31
2
5
18
58
Da
y 1
6
1
59
5
5
56
5
3
54
5
8
49
4
8
47
4
5
45
4
5
45
4
5
44
4
4
42
4
3
39
3
6
30
2
6
21
1
7
56
Da
y 2
6
3
59
5
5
56
5
3
53
5
7
49
4
9
49
4
7
46
4
4
45
4
4
44
4
4
43
4
3
39
3
6
32
2
8
23
2
0
56
Da
y 3
6
2
59
5
4
55
5
2
53
5
6
48
4
9
46
4
4
44
4
4
44
4
3
43
4
1
41
4
0
36
3
3
28
2
5
20
1
7
54
Nig
ht
1
60
5
9
53
5
4
52
5
2
56
4
5
46
4
4
42
4
4
43
4
3
41
4
1
39
3
9
37
3
4
31
2
5
20
1
4
11
53
N1
Nig
ht
2
61
6
0
54
5
4
53
5
1
55
4
5
46
4
5
44
4
4
44
4
4
43
4
2
41
4
0
39
3
5
32
2
7
22
1
7
14
53
Da
y 1
5
6
62
5
2
52
5
1
49
6
0
48
4
8
44
4
1
40
4
1
41
3
9
40
3
7
36
3
5
33
3
1
28
2
5
22
1
9
53
Da
y 2
5
7
62
5
1
51
5
4
52
5
6
45
4
4
43
4
1
41
4
0
40
3
8
37
3
6
33
3
3
31
2
8
25
2
2
19
1
6
51
Da
y 3
5
6
63
5
4
52
5
3
49
5
4
45
4
4
44
4
2
42
4
0
39
3
8
37
3
5
34
3
2
31
2
9
27
2
4
20
1
7
51
Nig
ht
1
57
6
1
49
4
9
54
5
1
53
4
4
42
4
2
38
3
8
39
3
9
38
3
9
35
3
4
33
3
0
27
2
3
21
1
6
12
50
N2
Nig
ht
2
57
6
1
51
5
0
55
5
0
50
4
6
44
4
5
41
3
9
38
3
8
37
3
6
34
3
3
31
2
8
26
2
2
19
1
4
11
50
Da
y 1
5
8
57
5
2
51
4
8
44
4
7
39
4
0
42
4
1
42
4
1
40
3
9
37
3
4
33
3
4
35
3
5
33
3
0
17
1
5
50
Da
y 2
5
8
57
5
3
51
4
9
45
4
5
39
4
0
42
4
2
42
4
1
41
3
9
36
3
5
33
3
3
33
3
1
29
3
0
18
1
4
49
Da
y 3
5
6
56
5
2
51
4
8
43
4
4
38
3
9
41
4
1
41
4
0
40
3
8
36
3
6
36
3
6
38
3
8
34
3
1
17
1
4
50
Nig
ht
1
56
5
5
51
4
9
47
4
2
41
3
9
39
4
2
41
4
1
41
3
9
37
3
6
34
3
1
28
2
3
20
1
4
10
9
1
2
48
N3
Nig
ht
2
57
5
5
50
4
9
46
4
1
40
3
9
41
4
4
41
4
1
40
3
9
37
3
4
31
2
8
25
2
1
18
1
5
14
1
3
12
48
Table A1
Su
mm
ary
of
1/3
Octa
ve
Fre
que
ncy D
ata
. Note A
Da
ta d
eta
iled
in
the
tab
le a
bo
ve
has b
ee
n r
evie
we
d in
ord
er
to id
en
tify
an
y t
on
al com
po
ne
nts
fro
m s
ite
no
ise
em
issio
ns in lin
e w
ith
EP
A r
eq
uir
em
en
t.

Appendix II: Atmospheric Monitoring Report

Atmospheric Emissions Monitoring at
Irish Distillers Ltd., Midleton, Co. Cork
Final Report Dated: 7th January 2009
Moloney & Associates, Acoustic & Environmental Consultants, Greenhills House, Kilmoney, Carrigaline, Co. Cork. Telephone No: 021 4374333 Fax No: 021 4374336

C O N T E N T S PAGE 1. INTRODUCTION 1
2. ATMOSPHERIC EMISSION MONITORING 2
3. ATMOSPHERIC EMISSION MONITORING RESULTS 3 4. CONCLUSION 5 APPENDIX I DETAILED EMISSION MONITORING RESULTS
APPENDIX II SAMPLING AND ANALYTICAL METHODS
APPENDIX III INSTRUMENTATION AND CALIBRATION DETAILS

Moloney & Associates, Acoustic & Environmental Consultants Report No. 070208 ________________________________________________________________________________
_________________________________________________________________________________ Atmospheric Emission Monitoring at Irish Distillers Ltd. Page 1 of 5
1. Introduction Moloney & Associates were commissioned by Irish Distillers Limited (IDL) to undertake an atmospheric emission monitoring programme at the company’s Midleton distillery. Atmospheric emissions from the plant’s boilers and the Feeds Recovery Building were measured in accordance with the terms and conditions of the company’s IPPC licence (Reg. No. 442-01).
Sampling at the emission points was conducted on the 17th of November 2008 when the facility
was operating normally. A preliminary report was issued on the 2nd of December 2008 and this final report describes the methodology of the emission monitoring programme and presents the full set of results.

Moloney & Associates, Acoustic & Environmental Consultants Report No. 070208 ________________________________________________________________________________
_________________________________________________________________________________ Atmospheric Emission Monitoring at Irish Distillers Ltd. Page 2 of 5
2. Atmospheric Emission Monitoring The emissions to atmosphere from four emission points (A1- 1, A1- 2, A1- 3, and A2-1) were determined in accordance with the licence requirements. Table 1: Irish Distillers Limited Licensed Atmospheric Emission Points.
Emission Point Source of Emission
A1- 1 Natural gas boiler
A1- 2 Natural gas boiler
A1- 3 Natural gas boiler
A2 - 1 Feeds Recovery A summary of the sampling and analytical methodology is presented in Appendix II.
Boiler emissions were tested for: carbon monoxide, nitrogen oxides and oxygen using a Eurotron GL 8000, flue gas analyser. The concentrations are reported in mg/Nm3 and calculated on a dry gas basis and corrected to 3% oxygen as specified in the IPPC Licence. Total particulates were sampled isokinetically at the Feeds Recovery Stack (A2-1) using a TCR Tecora Izostack sampler. The methodology used was based on B.S. 3405 and the concentration of particulates was determined gravimetrically by conditioning and weighing a series of collecting filters before and after sampling. The filters and entrained particulates were oven-dried at 160oC and after conditioning the collected particulate was determined to exceed 20% of the filter weight following sampling. The particulate concentrations are reported in mg/Nm3 and calculated with no correction for water vapour or oxygen as specified in the IPPC Licence. The particulate mass emissions are reported in kg/h.

Moloney & Associates, Acoustic & Environmental Consultants Report No. 070208 ________________________________________________________________________________
_________________________________________________________________________________ Atmospheric Emission Monitoring at Irish Distillers Ltd. Page 3 of 5
3. Atmospheric Emission Monitoring Results All analytical results have been converted to standard reference conditions as specified under Condition 3 of the IPC licence. The detailed analytical results are presented in Appendix I of this report. A summary of the emission monitoring results is presented in a series of tables below: Table 2: Summary of Feeds Recovery (A2-1) Emission Results.
Date/Time Concentration
Licence Limit Gas Flow Rate Licence Limit
Sample Number 17.11.2008 mg/Nm3 mg/Nm3 Nm3/h Nm3/h
1 11.18 - 11.48 22 50 17125 36600
2 11.52 - 12.22 12 50 21329 36600
3 12.25 – 12-55 21 50 20495 36600

Moloney & Associates, Acoustic & Environmental Consultants Report No. 070208 ________________________________________________________________________________
_________________________________________________________________________________ Atmospheric Emission Monitoring at Irish Distillers Ltd. Page 4 of 5
Table 3: Summary of Boiler Emission Results (arithmetic mean results).
Source Date/Time Oxygen Carbon Monoxide NOx as NO2
17.11.2008 % Concentration mg/Nm3
Corrected to 3% Oxygen
A1-1 12.02 – 12.32 4.6 < 1 144
A1-2 13.17 – 13.27 6.8 < 1 194
A1-3 12.36 – 13.15 2.9 101 169
A full set of analytical results is presented in Appendix I of this report. A1-1 and A1-3 were on full fire A1-2 was cycling in and out on demand during the monitoring programme.

Moloney & Associates, Acoustic & Environmental Consultants Report No. 070208 ________________________________________________________________________________ 4. Conclusion The particulate monitoring results for the Feeds Recovery emission point (A2-1) are within the licence limit (50 mg/Nm3). The nitrogen oxide emission concentrations for the boiler-house emission points are typical of the results of previous monitoring tests which demonstrated that the mass emissions were well within the licence limit (28 kg/h, for the total of the three boiler emission points).
_________________________________________________________________________________ Atmospheric Emission Monitoring at Irish Distillers Ltd. Page 5 of 5
_____________________
APPENDIX I
_____________________ Tables A - F: Detailed Emission Monitoring Results.

Table A: Stack Sampling Results - Particulates Company: Irish Distillers Address: Midleton, Co. Cork Plant: Feeds Recovery Stack: A2-1 Date: 17.11.2008 Time: 11.18 - 11.48 Test No.: 1 Activity Normal 1. Test Conditions 1.1 Stack Diameter m 0.8
1.2 Stack Cross Sectional Area m2 0.503
1.3 Gas Velocity (average) m/s 12.0
1.4 Gas Volume Nm3/hr 17125
1.5 Gas Temperature oC 74 1.6 Duration of Test mins. 30 2. Results 2.1 Emission Rate kg/hr 0.38
2.2 Concentration (Wet)
mg/Nm3 22.4

Table B: Stack Sampling Results - Particulates Company: Irish Distillers Address: Midleton, Co. Cork Plant: Feeds Recovery Stack: A2-1 Date: 17.11.2008 Time: 11.52 - 12.22 Test No.: 2 Activity Normal 1. Test Conditions 1.1 Stack Diameter m 0.8
1.2 Stack Cross Sectional Area m2 0.503 1.3 Gas Velocity (average) m/s 15.0
1.4 Gas Volume Nm3/hr 21329
1.5 Gas Temperature oC 74 1.6 Duration of Test mins. 30 2. Results 2.1 Emission Rate kg/hr 0.26
2.2 Concentration (Wet)
mg/Nm3 12.3

Table C: Stack Sampling Results - Particulates Company: Irish Distillers Address: Midleton, Co. Cork Plant: Feeds Recovery Stack: A2-1 Date: 17.11.2008 Time: 13.31 – 14.00 Test No.: 3 Activity Normal 1. Test Conditions 1.1 Stack Diameter m 0.8
1.2 Stack Cross Sectional Area m2 0.503 1.3 Gas Velocity (average) m/s 14.4
1.4 Gas Volume Nm3/hr 20495
1.5 Gas Temperature oC 75 1.6 Duration of Test mins. 29 2. Results 2.1 Emission Rate kg/hr 0.43
2.2 Concentration (Wet)
mg/Nm3 21

Table D: Boiler emission results – Emission point A1-1.
Time
% O2
CO mg/Nm3
NOx as NO2 mg/Nm3
12:02 4.9 0 127 12:03 4.7 0 125 12:04 4.5 0 131 12:05 4.6 0 135 12:06 4.6 0 133 12:07 4.7 0 135 12:08 4.5 0 127 12:09 4.7 0 129 12:10 4.6 0 129 12:11 4.5 0 127 12:12 4.6 0 127 12:13 4.6 0 127 12:14 4.5 0 129 12:15 4.5 0 131 12:16 4.4 0 129 12:17 4.4 0 131 12:18 4.5 0 133 12:19 4.8 0 129 12:20 4.5 0 131 12:21 4.5 0 131 12:22 4.5 0 131 12:23 4.6 0 131 12:24 4.5 0 131 12:25 4.5 0 133 12:26 4.6 0 133 12:27 4.6 0 133 12:28 4.6 0 133 12:29 4.6 0 133 12:30 4.5 0 133 12:31 4.7 0 133 12:32 4.5 0 135
Average 4.6 0 131

Table E: Boiler emission results – Emission point A1-3.
Time
% O2
CO mg/Nm3
NOx as NO2 mg/Nm3
12:36 2.8 195 166 12:37 2.9 114 168 12:38 2.9 96 168 12:39 2.9 112 170 12:40 3.0 87 168 12:41 2.9 97 170 12:42 2.9 109 170 12:43 2.9 102 174 12:44 2.8 181 170 12:45 2.8 127 170 12:46 2.8 141 172 12:47 2.8 166 170 12:48 2.8 126 172 12:49 3.0 214 170 12:50 3.0 126 170 12:51 2.9 122 170 12:52 2.8 129 170 12:53 2.9 105 168 12:54 2.9 116 168 12:55 2.8 161 168 12:56 2.8 117 168 12:57 3.1 76 179 12:58 2.8 124 170 12:59 3.0 30 179 13:00 2.8 141 168 13:01 2.8 81 168 13:02 2.7 144 170 13:03 2.8 174 168 13:04 3.3 100 168 13:05 2.7 169 168 13:06 2.8 114 168 13:07 2.8 157 168 13:08 2.8 129 168 13:09 2.9 72 168 13:10 2.9 149 168 13:11 2.8 137 168 13:12 2.9 117 168 13:13 2.8 132 168 13:14 2.8 150 168 13:15 3.1 109 168
Average 2.9 126 170

Table F: Boiler emission results – Emission point A1-2.
Time
% O2
CO mg/Nm3
NOx as NO2 mg/Nm3
13:17 6.8 0 144 13:18 6.5 0 144 13:19 6.5 0 144 13:20 6.6 0 144 13:21 6.5 0 144 13:22 6.4 0 144 13:23 6.4 0 144 13:24 6.5 0 144 13:25 6.5 0 144 13:26 6.6 0 144 13:27 9.2 0 125
Average 6.8 0 142

_____________________
APPENDIX II
_____________________ Summary of Sampling and Analytical Methods

Summary of Sampling and Analytical Methods
Nitrogen oxides, carbon monoxide, oxygen and temperature were measured in the flue gas from the boilers using a flue gas analyser. The concentrations are reported in mg/Nm3. Particulate monitoring at the Feeds Recovery stack was undertaken using an isokinetic sampling method based on methodologies B.S. 3405. The concentrations of particulate emissions from the Feeds Recovery stack have been calculated to standard reference conditions as follows. Temperature : 273 K. Pressure : 101.3 KPa. Wet Gas no correction for oxygen The concentrations of the gaseous emissions from the boilers have been calculated to standard reference conditions as follows. Temperature: 273 K. Pressure: 101.3 KPa. Dry Gas corrected to 3% oxygen

APPENDIX III
Instrumentation and Calibration Details

INSTRUMENTATION AND CALIBRATION DETAILS
Unit Serial Number Date of Calibration Calibration Certificate
Number
Eurotron GL-8000 Flue gas analyser
96810/96811 19-11-2007 9716
AGB Digital Thermometer
0295/139 25-07-2007 TO7255
TCR Tecora Izostack sampler SKC DryCal Electronic
Calibrator
108283 14-11-2007 80810

STACK EMISSION TESTING AT IRISH DISTILLERS LTD. MIDLETON, CO. CORK.
PERFORMED BY ODOUR MONITORING IRELAND ON BEHALF OF IRISH DISTILLERS LTD. Prepared by: Dr. Brian Sheridan Attention: Mr. John Colbert Date: 12th Sept 2008 Report Number: 2008.A231 (2) Version: Document Version 2 Licence No. PO442-01 Reviewers: Mr. Aidan Curran
ODOUR & ENVIRONMENTAL ENGINEERING CONSULTANTS Unit 32 De Granville Court, Dublin Rd, Trim, Co. Meath Tel: +353 46 9437922 Mobile: +353 86 8550401 E-mail: [email protected] www.odourireland.com

Report Number 2008A231(2) Irish Distillers Ltd
www.odourireland.com i
TABLE OF CONTENTS Section Page number TABLE OF CONTENTS i DOCUMENT AMENDMENT RECORD ii 1. Introduction 1 2. Materials and Methods 2 2.1 Volumetric flow rate measurement 2 2.2 Particulate sampling and analysis 3 2.2.1 Total Particulate matter sampling methodology 3 2.2.1.1 Job preparation 3 2.2.1.2 Filter selection and preparation 3 2.2.2 Sampling location 4 2.2.2.1 Suitability of sampling location 4 2.2.2.2 Leak checks 4 2.2.2.3 Sampling 5 2.2.2.4 Duration of sampling 5 2.2.2.5 Cumulative sampling 5 2.2.2.6 Repeat Velocity and temperature readings. 5 2.2.2.7 Weighing of the sample 5 3. Results-Emission testing . 6 3.1 Volumetric flow rate 6 3.2 Total particulates emissions 6 4. Discussion of results 8 5. Conclusion 9 6. Recommendations 9 7. Appendix I-Sampling and analysis details 10 8. Appendix I-Volumetric airflow rate calculation 11 9. Appendix III-Total particulates calculations 11

Report Number 2008A231(2) Irish Distillers Ltd
www.odourireland.com ii
Document Amendment Record Client: Irish Distillers Ltd. TITLE: Stack Emission Testing at Irish Distillers Ltd, Midleton, Co. Cork.
Project Number: 2008.A231(1) Document reference: Stack Emission Testing at Irish Distillers Ltd. Midleton, Co. Cork.
2008.A231(1) Document for review B.A.S JWC B.A.S 28/08/2008 Revision Purpose/Description Originated Checked Authorised Date

Report Number 2008A231(2) Irish Distillers Ltd
www.odourireland.com 1
1. Introduction Odour Monitoring Ireland was commissioned by Irish Distillers Ltd to perform stack emission testing from the exhaust stack (A2-1) from the cyclones treating emissions from the driers. The parameters monitored are identified in Table 1.1. Table 1.1. Monitored parameters and techniques for Irish Distillers Ltd. Midleton, Co. Cork. Sample location
Parameter Analytical method
Stack locations A2-1 Volumetric Flow Rate Pilot tube method
Stack locations A2-1 Temperature 0C PT100 type thermocouple
Stack locations A2-1 Total Particulate Matter Isokinetic sampling train
This report presents details of this monitoring programme. The environmental monitoring was carried out by Dr. John Casey and Dr. Brian Sheridan, Odour Monitoring Ireland at Irish Distillers Ltd. Midleton, Co. Cork on the 19th Aug 2008. Methodology, Results, Discussion and Conclusions are presented herein.
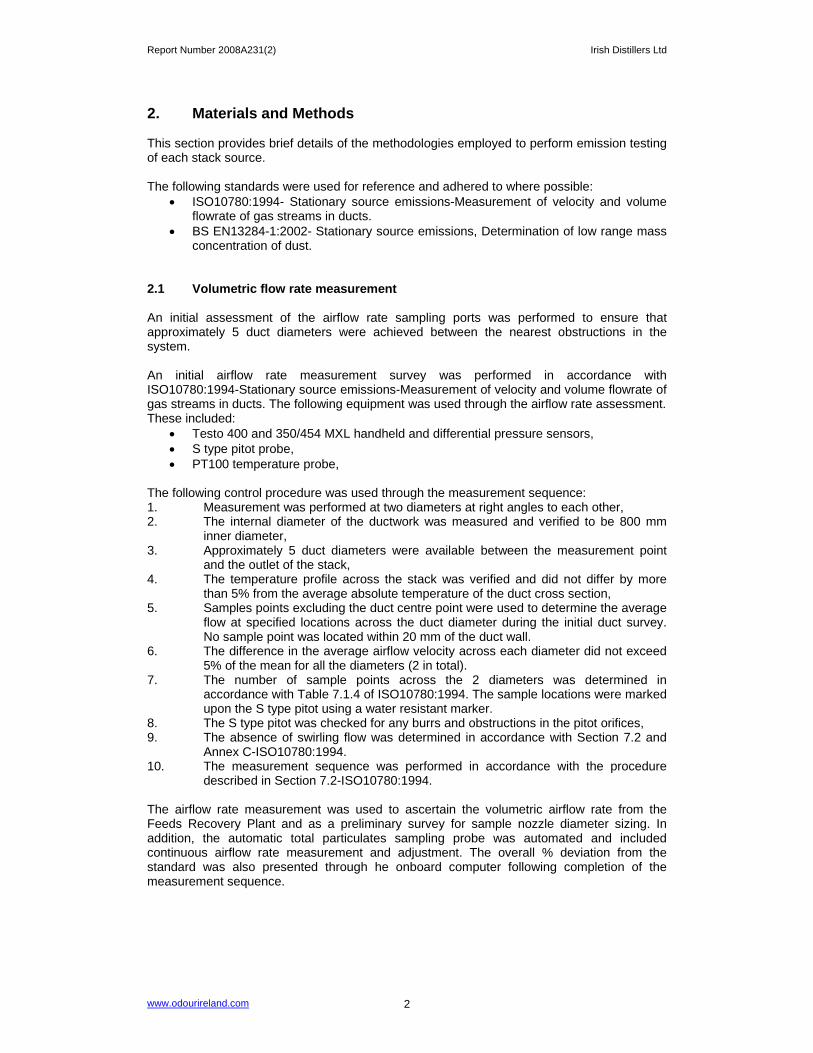
Report Number 2008A231(2) Irish Distillers Ltd
www.odourireland.com 2
2. Materials and Methods This section provides brief details of the methodologies employed to perform emission testing of each stack source. The following standards were used for reference and adhered to where possible:
• ISO10780:1994- Stationary source emissions-Measurement of velocity and volume flowrate of gas streams in ducts.
• BS EN13284-1:2002- Stationary source emissions, Determination of low range mass concentration of dust.
2.1 Volumetric flow rate measurement An initial assessment of the airflow rate sampling ports was performed to ensure that approximately 5 duct diameters were achieved between the nearest obstructions in the system. An initial airflow rate measurement survey was performed in accordance with ISO10780:1994-Stationary source emissions-Measurement of velocity and volume flowrate of gas streams in ducts. The following equipment was used through the airflow rate assessment. These included:
• Testo 400 and 350/454 MXL handheld and differential pressure sensors, • S type pitot probe, • PT100 temperature probe,
The following control procedure was used through the measurement sequence: 1. Measurement was performed at two diameters at right angles to each other, 2. The internal diameter of the ductwork was measured and verified to be 800 mm
inner diameter, 3. Approximately 5 duct diameters were available between the measurement point
and the outlet of the stack, 4. The temperature profile across the stack was verified and did not differ by more
than 5% from the average absolute temperature of the duct cross section, 5. Samples points excluding the duct centre point were used to determine the average
flow at specified locations across the duct diameter during the initial duct survey. No sample point was located within 20 mm of the duct wall.
6. The difference in the average airflow velocity across each diameter did not exceed 5% of the mean for all the diameters (2 in total).
7. The number of sample points across the 2 diameters was determined in accordance with Table 7.1.4 of ISO10780:1994. The sample locations were marked upon the S type pitot using a water resistant marker.
8. The S type pitot was checked for any burrs and obstructions in the pitot orifices, 9. The absence of swirling flow was determined in accordance with Section 7.2 and
Annex C-ISO10780:1994. 10. The measurement sequence was performed in accordance with the procedure
described in Section 7.2-ISO10780:1994. The airflow rate measurement was used to ascertain the volumetric airflow rate from the Feeds Recovery Plant and as a preliminary survey for sample nozzle diameter sizing. In addition, the automatic total particulates sampling probe was automated and included continuous airflow rate measurement and adjustment. The overall % deviation from the standard was also presented through he onboard computer following completion of the measurement sequence.

Report Number 2008A231(2) Irish Distillers Ltd
www.odourireland.com 3
2.2 Particulate sampling and analysis Samples of the gas stream were extracted through a probe and filter holder arrangement containing a pre-conditioned and pre-weighed quartz fibre filter using a TCR automated iso-kinetic sampling train. Sampling was performed in accordance with BS EN13284-1:2002, where possible. Emissions were measured over a minimum of 30 to 40 -minute period. Upon completion of sampling, the filters were placed in their original container and sealed. All sampled were labelled and logged onto a laboratory submission sheet. All filters were sent to a UKAS accredited laboratory for gravimetric analysis. Filter head wash was also packaged into a sealed container for gravimetric analysis. Results are presented in mg Nm-3 at standard temperature of 273.15K and standard pressure of 101.3 kPa without correction for moisture content. 2.2.1 Total Particulate matter sampling methodology 2.2.1.1 Job preparation A pre-site survey must first be taken to obtain the following information. Client details (name and address), description of stack to include name and location), sample platform/access, Hazards, Power supply and location, additional PPE required. The Iso stack TCR Tecora automatic isokinetic particulates measurement equipment is fully inspected prior to use and its calibration stats observed. This includes: Pitot tube-All pitot tubes are checked for damage/burrs, paying particular attention to the inlet holes. All dirt and blockages are removed. Micro manometer-Digital differential pressure metres that are used are capable of measuring in the range of 0 Pa to 2250 Pa with a sensitivity of ±1 Pa. The instrument is checked for physical damage, battery life test and calibration status observed. Nozzles-All nozzles used have been constructed in accordance with EN13284-1 and ISO 9096:2003. Each nozzle is physical checked for damage and removed if necessary. The nozzle calibration status is observed. Flow metre-The flow metre is checked for blockages and obvious physical damage. Its calibration status is also observed. Rope kit-All lifting tackle are physical checked for cuts and contamination. Laboratory-The gravimetric testing house selected is UKAS accredited for the particular test method. 2.2.1.2 Filter selection and preparation Stack conditions can vary for temperature, moisture, acidity, low and heavy particulate loading. Following the pre-site survey, the stack condition should be known and the appropriate filter can be selected and prepared as described below. Filter mediums-glass wool, quartz wool, Low ash PVC membranes and a range of thimbles can be used depending on stack characteristics. Quartz filters were used in this instance as glass fibre filters can react to SO3 and lead to inaccurate measurement.
Report Number 2008A231(2) Irish Distillers Ltd
www.odourireland.com 4
Filters are prepared by drying in an oven at 1800C for a period of 1 hour and placed in a dessicator to cool. The filters are weighed accurately on a 4-figure balance and then placed in clean filter holder before transport to site. Spare filters are also prepared. 2.2.2 Sampling location 2.2.2.1 Suitability of sampling location Before sampling can commence, a preliminary velocity and temperature survey must be undertaken along the two sampling lines at nine equally concentric spaced areas in the stack. This is performed in accordance with ISO10780:1994 where possible. The procedures as set out in Section 2.1 were followed. The stack diameter is measured using a steel rod. The angle of gas flow must be less than 150 with regard to duct axis. There should be no local negative flow. The minimum velocity should be larger than 5 Pa for Pitot tube measurement. Sampling is undertaken from either four or eight sampling points on each plane. Sampling points shall be located either more than 3% of the sampling line length or more than 5 cm whichever is the greater value from the inner wall. If the ratio of the highest to the lowest dynamic pressure exceeds 9:1 of the ratio of the highest to lowest gas velocity exceeds 3:1, another sampling plane should be used. Sampling is undertaken from four sampling points on each plane. Temperature is also measured at nine equally spaced points along the sampling line and average temperature calculated during the initial survey. Should the temperature at any of the sampling points differ by more that ±10% from that of the average, then that point must not be used. The required number of sampling points can now be calculated using the following:
• 8 point sampling, circular stacks 0.067 X D, 0.25 X D, 0.75 X D, 0.933 X D. 2.2.2.2 Leak checks A leak check is undertaken before and after the isokinetic sampling is carried out. This is to make sure that all intake volume is through the sampling nozzle only.

Report Number 2008A231(2) Irish Distillers Ltd
www.odourireland.com 5
2.2.2.3 Sampling Once the isokinetic sampling flow rates have been calculated, the probe is inserted into the stack at 900 to the stack gas flow, as not to impinge any particulate matter on to the filter media prior to sampling. The filter head is allowed to attain stack temperature. The pump is started and the nozzle is turned into the flow and the timing device is started (automatic on TCR Tecora kit). 2.2.2.4 Duration of sampling Duration of sampling time depends on:
• Ensuring adequate quantities of particulate matter on the filter for weighing (> 0.3% of the filter weight),
• Whether cumulative or incremental sampling is undertaken, • The number of sampling points, • The continuity of the plant operation.
2.2.2.5 Cumulative sampling After the first sample is taken from the first sampling location, the probe is moved to the next position and the values recorded. This should be performed until all sampling points have been used. Sampling is continued till all locations are sampled. 2.2.2.6 Repeat Velocity and temperature readings. Since the TCR Tecora is an automatic system, continuous velocity and temperature readings are carried out using the instrument. All data is stored upon the on board computer and recorded following the sampling event. The % DI (deviation) is also computed and recorded continuously. 2.2.2.7 Weighing of the sample When finished, the sample filter is placed in its container and all particulate from the filter head is added to the particulate matter on the filter (i.e. filter wash). The used filter is placed in an over at 1600C for at least 1 hour and dried thoroughly, cooled and equilibrated in a dessicator and weighed as quickly as possible so as to avoid any errors to moisture. The gross weight of the filter should be measured to within ±0.01 to 0.10 mg. The filter weight and any of the residual particulate matter from the filter head can then be used in the final report to calculate the particulate concentration.

Report Number 2008A231(2) Irish Distillers Ltd
www.odourireland.com 6
3. Results-Emission testing. The results of testing emission sources A2-1 are presented in Table 3.1 and 3.2. 3.1 Volumetric flow rate Sampling for airflow rate was performed in accordance with ISO 10780:1994. Table 3.1 summarises the flow measurements from the stack and includes the stack velocity, expressed in metres per second (m s-1) and volumetric airflow rates expressed in m3 hr-1 at both actual and standard reference conditions of 273.15 K, 101.3 kPa (i.e. normalised temperature and pressure). Stack pressure was determined using a pitot tube turned at right angles to the airflow rate. This is expressed in Kilo Pascal (kPa). The atmospheric pressure was also recorded during the sampling event in kPa. Table 3.1. Measurement of Volumetric airflow rate and normalisation of data.
Stack Reference- A2-1 Value Stack diameter (m) 0.80 Average temperature (K) 346 Airflow rate (m s-1) 13.90 to 20.20 Area (m2) 0.50272 Atmospheric pressure (kPa) 101.60 Static pressure (kPa) 0.045 Standard barometric pressure (kPa) 101.30 Actual volumetric airflow rate (Am3/s) 6.98 to 10.15 Normalised volumetric airflow (Nm3/s)1 5.53 to 8.03 Normalised volumetric airflow rate (Nm3/hr) 19,908 to 29,908
Notes: 1 denotes normalised to 273.15 Kelvin and 101.3 kPa, with no correction for moisture content. All calculations are presented in Appendix I of this document. 3.2 Total particulates emissions Total Particulates concentrations were monitored using a TCR Tecora automated Particulate sampler. The results of Total Particulates are presented in Table 3.2. The results of mg m-3 have been converted to mg Nm-3 at 273.15 K, 101.3 kPa, on a wet gas basis without correction for oxygen content.

Report Number 2008A231(2) Irish Distillers Ltd
www.odourireland.com 7
Table 3.2. Emission value results from emission point A2-1 located in Irish Distillers Ltd. Midleton, Co. Cork.
Emission Point A2-1 Start / Finish time Values (mg/Nm3) Sample id3 Normalised Volumetric flow
rate (Nm3/hr) Mass emission
rate (kg/hr) Emission limit values
Total particulates Run 11 , 2, 11.25AM to 11.55AM 18 04375 19,908 0.358 50 mg/Nm3 or a mass flow of 0.50 kg/hr
Total particulates Run 21, 2 12.20 PM to 12.50PM 24 04378 19,908 0.477 50 mg/Nm3 or a mass flow of 0.50 kg/hr
Total particulates Run 31, 2 1.20PM to 2.20 PM 16 04385 29,908 0.478 50 mg/Nm3 or a mass flow of 0.50 kg/hr
Average Conc 19.33 - 23,241 0.449 50 mg/Nm3 or a mass flow of 0.50 kg/hr
Notes: 1 denotes the sample volume acquired was greater than 1 Nm3 per sample run and therefore in accordance with the requirements of the EN13284-1
standard. 2 denotes the particulate matter collection upon the filter was within the recommended 20% of the filter paper weight following sampling. 3 denotes QMA quartz filters were used throughout the study.

Report Number 2008A231(2) Irish Distillers Ltd
www.odourireland.com 8
4. Discussion of results Tables 3.1 to 3.2 present the results of the emission-monitoring program carried out on the 19th August 2008 in Irish Distillers Ltd. Midleton, Co. Cork. As can be observed in Tables 3.1 and 3.2, volumetric airflow rate and emissions of Total particulates are in compliance with the values stated in IPPC licence PO442-01. There are many difficulties in performing monitoring of this exhaust point to include: Previous monitoring was performed only on one plane and in location which would not facilitate the formation of laminar flow. Upon initial screening, swirling flow was identified within the stack which was resulting in both –ive and +ive pressure readings on the pitot tube. Therefore it was concluded that the required Isokinetic conditions could not be attained and erroneous results would be recorded if monitoring were performed at this location. IDL were requested to move the sample port to an appropriate location to ensure laminar flow. In addition, the levels of moisture coupled with temperature below 105 deg C will not facilitate the repeatable measurements of total particulates on this emission point at any time due to the dew point of the airstream. This needs to be taken into account when anybody is reporting results. It is very unlikely that Absolute reporting values will ever be possible on this emission source and therefore it is important to ensure the implementation of an efficient operation and maintenance plan for both the drier and cyclone operation. This should be strictly adhered to and outline the steps that should or should not occur in relation to the mitigation and minimisation of Particulate carryover to the exhaust flue.

Report Number 2008A231(2) Irish Distillers Ltd
www.odourireland.com 9
5. Conclusion The following conclusions were drawn from the study:
1. The volumetric airflow rate and Total Particulates emission values on emission point A2-1 were in compliance with IPPC licence PO442-01.
6. Recommendations The following recommendations were generated from the study:
• The cyclones should be checked once per week in order to ascertain the headloss across the cyclone and also in addition to verify that the cyclone is clear of material build up. The differential headloss across the cyclone will dictate the cut point efficiency of the technology. If this differential headloss drops to unacceptable levels (i.e. less than 100 mmWG), then the removal efficiency of particulate will reduce and may result in breach of the emission limit values contained in IPPC licence PO442-01. On the day of the survey, the following differential headloss measurement were recorded:
a. Cyclone 1 inlet = -ive 48.437, Outlet = -ive 175.799. Differential headloss = 127.362 mmWG
b. Cyclone 2 inlet = -ive 25.493, Outlet = -ive 137.152. Differential headloss = 111.659 mmWG
c. Cyclone 3 inlet = -ive 41.095, Outlet = -ive 124.405. Differential headloss = 83.31 mmWG.
d. In this instance, cyclone 3 did not have the required 100 mmWG headloss
and therefore should be checked for blockage on the cone side of the cyclone.
• The drier drum should be emptied of material following each changeover or
shutdown. Failure to empty the drier drum could result in significant emissions of dust from the drier due to over drying of the material. In addition, the over drying of material within the drum can result in dust emissions to the cyclone and therefore may result in unnecessary carryover in the system. This should be eliminated through operational practices and / or sensor / engineering solution.
• Sampling should be performed during continuous process operation in order to obtain representative samples of the airstream.

Report Number 2008A231(2) Irish Distillers Ltd
www.odourireland.com 10
7. Appendix I-Sampling and analysis details B.1.1 Location of Sampling
Irish Distillers Ltd. Midleton, Co. Cork
B.1.2 Date & Time of Sampling 19th Aug 2008
B.1.3 Personnel Present During Sampling Dr. John Casey, Odour Monitoring Ireland, Unit 32 DeGranville Court, Dublin Road, Trim, Co. Meath. Dr. Brian Sheridan, Odour Monitoring Ireland, Unit 32 DeGranville Court, Dublin Road, Trim, Co. Meath.
B.1.4 Instrumentation
Testo 350 MXL/454 in stack analyser. L type pitot and PT100 thermocouple. Testo 400 handheld and appropriate probes. TCR Tecora Isokinetic Particulate sampler.
B.1.5 Standards ISO 10780:1994 EN13284-1:2002
ISO 9096:2003

Report Number 2008A231(2) Irish Distillers Ltd
www.odourireland.com 11
8. Appendix II-Volumetric airflow rate calculations V = Stack gas velocity (m/s) = 13.90 to 20.20 D = Stack diameter(m) = 0.800 A = Stack area (m2) = 0.50272 Pi = Pi = 3.142 T = Stack temperature (K) = 346 PA = Atmospheric pressure (kPa) = 101.60 PST = Static pressure (kPa) =0.045 PB = Standard barometric Pressure (kPa) = 101.3 Qactual = V × A = 13.90 m/s ×0.50272 m2 = 6.987m3/s
QSTP = ×T
15.273 ( )
B
STA
PAVPP ××+
QSTP = ×346
15.273 ( )3.101
50272.090.13045.06.101 ××+= 5.53 Nm3/s
9. Appendix III-Total particulates calculations 9.1 Sample run 1: Duration of sampling: 30 minutes (1800 seconds) Nozzle internal diameter: 10 mm Nozzle area (m2)=7.86 X E-05 Deviation in velocity over sampling period = -ive 2.93% (limit permitted is 5%) Start filter weight= 0.13240 g Finish filter weight= 0.15868 g Probe rinse= 0.00000 g Total dust mass = 0.02628 g Sample as a percentage of filter weight 20% Total volume sampled (Vgn) (Nm3) = 1.46 Nm3 Total dust concentration (m) = 26.28mg/1.46 Nm3 Total dust concentration (m) = 18 mg/Nm3 Total dust emission rate (g/s) = (QSTP × m) /1000 Total dust mass emission rate (g/s) = (5.53 Nm3/s × 18 mg/Nm3)/1000 = 0.09954 g/s or 0.358 kg/hr The calculations for Sample Run 2 and Sample run 3 were performed using the same format. The DI % value for Sample run 2 and 3 was –ive 1.86 and –ive 1.55, respectively.


Appendix III: Ground Water Monitoring Report