irle working paper #156-13 december 2013
TRANSCRIPT

IRLE
IRLE WORKING PAPER#156-13
December 2013
Clair Brown, Timothy Sturgeon, and Connor Cole
The 2010 National Organizations Survey: Examining theRelationships Between Job Quality and the Domestic andInternational Sourcing of Business Functions by UnitedStates Organizations
Cite as: Clair Brown, Timothy Sturgeon, and Connor Cole. (2014). “The 2010 National OrganizationsSurvey: Examining the Relationships Between Job Quality and the Domestic and InternationalSourcing of Business Functions by United States Organizations”. IRLE Working Paper No. 156-13. http://irle.berkeley.edu/workingpapers/156-13.pdf
irle.berkeley.edu/workingpapers

The 2010 National Organizations Survey: Examining the Relationships Between Job Quality and the Domestic and International Sourcing
of Business Functions by United States Organizations
Clair Brown, University of California at Berkeley ([email protected])
Timothy Sturgeon, Massachusetts Institute of Technology
Connor Cole, University of Michigan ([email protected])
Final Draft: 12/26/2013
Cite as: Brown, Clair; Sturgeon, Timothy; and Cole, Connor. 2013 "The 2010 National Organizations Survey: Examining the Relationships Between Job Quality and the Domestic and International Sourcing of Business Functions by United States Organizations". IRLE Working Paper No. 156-13.
This research was supported by the National Science Foundation under Grant No. 0926746

The 2010 National Organizations Survey
The 2010 NOS was supported by the National Science Foundation under Grant No. 0926746
ii
Acknowledgements
The authors wish to thank the National Science Foundation’s Innovation and Organizational Sciences Program for supporting the research, including the program officers that provided constructive feedback during the panel review process, as well as seven anonymous peer reviewers. We would also like to thank the Alfred P. Sloan Foundation for funding the module of questions for the 2008 GSS survey, and UC Berkeley’s Institute for Research on Labor and Employment for supporting and administering the project. Input on the General Social Survey (GSS) module used as a basis for the study was provided by Eileen Appelbaum (Rutgers University), Arne Kalleberg (University of North Carolina), Rosemary Batt (Cornell University), Frank Levy (MIT), Susan Helper (Case Western Reserve University), Melissa Appleyard (Portland State), Lori Kletzer (UC Santa Cruz), Peter Gourevitch (UC San Diego), Rafiq Dossani (Stanford University), and John Paul Macduffie (Wharton). At the National Opinion Research Center, which administered the GSS, support was provided by Chet Bowie, Tom Smith, John Sokolowski, Norman Bradburn, Jaesok Son, and Kim Jibum. In preparing the NOS study and questionnaire, a workshop was held in Boston in May 2008, funded by the Alfred P. Sloan Foundation, where we received input from Ana Aizcorbe (US Bureau of Economic Analysis), Sharon Brown (US Bureau of Labor Statistics), Michael Handel (Northeastern University), Susan Helper, (Case Western Reserve University), Ursula Huws, (London Metropolitan University), John Paul MacDuffie (Wharton), Margaret McMillan (Tufts University), Frits Pil (University of Pittsburgh), and Tom Smith (NORC). Further input on the NOS survey questions as they were developed, along with other aspects of the work, was provided by this group as well as Lee Badgett (University of Massachusetts Amherst), Mari Sako (Oxford University), David Weil (Boston University), Brian McCall (University of Minnesota), Chip Hunter (University of Wisconsin–Madison), Ben Campbell (Ohio State University), Melissa Appleyard (Portland State University), J. Bradford Jensen (Georgetown University), David Autor (MIT), E. J. Reedy (Kauffman Foundation), Susan Woodward (Sand Hill Econometrics), John Walsh (Georgia Tech), Carol Corrado (The Conference Board), Gary Gereffi (Duke University), Peter Bøegh Nielsen (Statistics Denmark), and Carine Peeters (L'Université libre de Bruxelles). Jeff Henne, Patrick Thompson, Kevin Conners, and Eric Park of The Henne Group in San Francisco provided effective and highly professional survey research services, including survey design, web implementation, survey administration, and data compilation. Tom Piazza provided the probability weighting scheme used for the study. At UC Berkeley, excellent research assistance was provided by Sean Tanner, Kate Belohalv, and Connor Cole. Special thanks go to Peter Marsden (Harvard University), Wesley Cohen (Duke University), Julia Lane (American Institutes for Research), and Gail Pesyna (Sloan Foundation) for wise advice, help, and encouragement provided throughout the project.

The 2010 National Organizations Survey
The 2010 NOS was supported by the National Science Foundation under Grant No. 0926746
iii
Abstract This paper presents the results from the 2010 National Organizations Survey (NOS). The survey is representative of U.S. full-time jobs. It collects data on the international and domestic sourcing practices of United States organizations, including non-profit and public organizations as well as for-profit firms, and on the characteristics of domestic jobs. Using an approach similar to what is being used in Europe and Canada, the survey collects data on domestic and international sourcing according to eight standardized business functions intended to be mutually exclusive and cover all activities of the organization. The business function list includes: 1) the primary business function (typically associated with main product or service produced), 2) research and development (R&D), 3) sales and marketing, 4) transportation, logistics, and distribution, 5) customer and after-sales service, 6) management, administration, and back office functions, 7) informational technology (IT) systems, and 8) facilities maintenance. For organizations engaged in international sourcing, the distribution of sourcing costs are collected across three types of countries (1) “developing” with much lower costs, 2) “emerging” with moderately lower costs, and 3) “industrialized” with costs similar to or higher than to the United States). The survey collects data on the earnings distribution of domestic employment by business function. The ability to quantify the importance of international sourcing practices by business function allows the relationships between international sourcing and employment and wages to be examined. The survey finds about 2/3rds of employment in the primary business function, that almost one-half (48%) of full-time employees work at organizations that have some domestic outsourcing, and almost one-quarter (23%) work at organizations that source internationally. International sourcing is concentrated in organizations in the goods producing and trade industry groupings. It is spread across all functions, including R&D, and is mainly carried out by large firms through foreign affiliates. Most international sourcing is to high cost locations, and secondarily to very low cost locations. Non-goods-producing organizations are more likely to source from low cost locations. Domestic outsourcing is concentrated in transport, IT services, and facilities maintenance business functions, and no consistent relationships between domestic outsourcing and employment or wages were evident in the data. In general, international sourcing is related to above-average high-wage domestic employment and below-average low-wage domestic employment. For the primary business function, the share of domestic employment decreases as international sourcing increases; the distribution of earnings, i.e., shares of low-wage or high-wage employment in the primary business function, is not significantly related to the international sourcing of this function. This pattern is consistent with at least two outcomes: international sourcing of the primary business function substitutes for domestic jobs in the primary business function; or the international activity expands markets and thus requires an expansion of domestic employment in support functions more than in the primary business function. In either case, domestic high-wage and low-wage jobs in the primary business function appear to expand or contract at similar rates. The relationships between an organization’s domestic employment (and job quality) and international sourcing costs vary by support function. For example, as international sourcing increases, the share of domestic employment increases in customer service, IT, and sales and marketing. As international sourcing increases, the share of high-wage jobs in customer service, facilities maintenance, management and administration, and transportation also increase. R&D was the only business function where the share of low-wage jobs increased with higher international sourcing costs.

The 2010 National Organizations Survey
The 2010 NOS was supported by the National Science Foundation under Grant No. 0926746
iv
Table of Contents
INTRODUCTION ...................................................................................................................................................... 1 SURVEY METHODOLOGY ..................................................................................................................................... 4
SAMPLE FRAMES ...................................................................................................................................................................... 4 DATA COLLECTION AND RESPONSE RATE .......................................................................................................................... 5 THE BUSINESS FUNCTION FRAMEWORK ............................................................................................................................. 6
DESCRIPTIVE RESULTS ........................................................................................................................................ 7 INTERNATIONAL AND DOMESTIC SOURCING BY BUSINESS FUNCTION .......................................................................... 7
How prevalent is outsourcing and offshoring by United States organizations? ......................................... 9 External and international sourcing by organization size ................................................................................ 10 Sourcing by industry ............................................................................................................................................................ 11 International sourcing by type of location ................................................................................................................ 14
EMPLOYMENT BY BUSINESS FUNCTION ............................................................................................................................. 17 WAGES BY BUSINESS FUNCTION ......................................................................................................................................... 18 OTHER DESCRIPTIVE VARIABLES ....................................................................................................................................... 21
Unionization ............................................................................................................................................................................. 21 International sales ................................................................................................................................................................ 22
ANALYTIC RESULTS ........................................................................................................................................... 23 DOMESTIC OUTSOURCING AND INTERNATIONAL SOURCING ......................................................................................... 23 INTERNATIONAL SOURCING BY TYPE OF INTERNATIONAL LOCATION ......................................................................... 25 DOMESTIC OUTSOURCING OF PRIMARY AND SUPPORT BUSINESS FUNCTIONS .......................................................... 30 DOMESTIC OUTSOURCING, INTERNATIONAL SOURCING AND JOB QUALITY ................................................................ 31
Share of domestic jobs and international sourcing ............................................................................................... 31 International sourcing by type of international location and domestic earnings .................................. 33 Health and retirement benefits and sourcing activities ...................................................................................... 34
SUMMARY OF FINDINGS ................................................................................................................................... 34 APPENDIX A: THE 2010 NOS PUBLIC USE DATASET .............................................................................. 37 APPENDIX B: DATA CORRECTIONS AND ADJUSTMENTS ...................................................................... 38 APPENDIX C: DATA QUALITY INDICATORS ............................................................................................... 39
DATA QUALITY INDICATORS FROM SURVEY RESPONSES ................................................................................................. 39 COMPARISON OF 2010 NOS TO EUROSTAT’S INTERNATIONAL SOURCING/GLOBAL VALUE CHAINS SURVEY .... 39
APPENDIX D: PROBABILITY WEIGHTS........................................................................................................ 41 APPENDIX E: INDUSTRY GROUPINGS .......................................................................................................... 43 APPENDIX F: COMPREHENSIVE DESCRIPTIVE TABLES (FULL AND GSS SAMPLES) .................... 45 REFERENCES ......................................................................................................................................................... 64

The 2010 National Organizations Survey
The 2010 NOS was supported by the National Science Foundation under Grant No. 0926746
v
Tables:
TABLE 1: RESPONSE RATE TO SURVEY ........................................................................................................................... 6 TABLE 2: RESPONSE RATE TO SURVEY BY SAMPLE ........................................................................................................ 6 TABLE 3. SHARE OF FULL-TIME DOMESTIC U.S. EMPLOYEES WORKING AT ORGANIZATIONS THAT ENGAGE IN SOME
EXTERNAL SOURCING, BY BUSINESS FUNCTION (FULL SAMPLE) .......................................................................... 9 TABLE 4. DISTRIBUTION OF SOURCING COSTS FOR U.S. ORGANIZATIONS BY BUSINESS FUNCTION (FULL SAMPLE) .... 10 TABLE 5. DISTRIBUTION OF SOURCING COSTS FOR U.S. ORGANIZATIONS BY SIZE (FULL SAMPLE) ............................. 11 TABLE 6. DISTRIBUTION OF SOURCING COSTS FOR U.S. ORGANIZATIONS BY INDUSTRY (FULL SAMPLE) .................... 12 TABLE 7. SHARE OF FULL-TIME DOMESTIC U.S. EMPLOYEES WORKING AT LARGE (≥500 U.S. EMPLOYEES), GOODS-
PRODUCING ORGANIZATIONS THAT ENGAGE IN SOME EXTERNAL SOURCING, BY BUSINESS FUNCTION (FULL SAMPLE) .............................................................................................................................................................. 13
TABLE 8. DISTRIBUTION OF SOURCING COSTS FOR LARGE (≥500 U.S. EMPLOYEES), GOODS-PRODUCING ORGANIZATIONS U.S. ORGANIZATIONS BY BUSINESS FUNCTION (FULL SAMPLE) .............................................. 14
TABLE 9: DISTRIBUTION OF INTERNATIONAL SOURCING LOCATION TYPES FOR U.S. ORGANIZATIONS BY BUSINESS FUNCTION (FULL SAMPLE) .................................................................................................................................. 15
TABLE 10. DISTRIBUTION OF EMPLOYMENT BY BUSINESS FUNCTION AT U.S. ORGANIZATIONS, BY SIZE, INDUSTRY, AND BUSINESS FUNCTION (FULL SAMPLE) ........................................................................................................... 17
TABLE 11. PERCENTAGE OF FULL-TIME DOMESTIC EMPLOYEES WORKING AT U.S. ORGANIZATIONS WITH AT LEAST ONE EMPLOYEE IN A BUSINESS FUNCTION (FULL SAMPLE) ................................................................................. 18
TABLE 12. SHARE OF FULL-TIME DOMESTIC U.S. EMPLOYEES WORKING AT ORGANIZATIONS THAT HAVE SOME PERCENTAGE OF UNIONIZED EMPLOYEES ........................................................................................................... 22
TABLE 13. SHARE OF FULL-TIME DOMESTIC U.S. EMPLOYEES THAT WORK AT ORGANIZATIONS THAT HAVE INTERNATIONAL REVENUES................................................................................................................................ 22
TABLE 14. DOMESTIC OUTSOURCING AND INTERNATIONAL SOURCING IN A BUSINESS FUNCTION (FULL SAMPLE) ..... 23 TABLE 15. INTERNATIONAL SOURCING OF SUPPORT BUSINESS FUNCTIONS AND THE PRIMARY BUSINESS FUNCTION
(FULL SAMPLE).................................................................................................................................................... 25 TABLE 16. INTERNATIONAL SOURCING OF SUPPORT BUSINESS FUNCTIONS BY LOCATION TYPE AND INTERNATIONAL
SOURCING OF THE PRIMARY BUSINESS FUNCTION TO SIMILAR LOCATION (FULL SAMPLE) ................................ 27 TABLE 17. TOTAL INTERNATIONAL SOURCING AND INTERNATIONAL SOURCING BY TYPE OF LOCATION (FULL
SAMPLE) .............................................................................................................................................................. 28 TABLE 18. DOMESTIC OUTSOURCING OF SUPPORT BUSINESS FUNCTIONS AND DOMESTIC OUTSOURCING OF PRIMARY
BUSINESS FUNCTION (FULL SAMPLE) .................................................................................................................. 30 TABLE 19. SOURCING AND SHARE OF EMPLOYMENT IN A BUSINESS FUNCTION (FULL SAMPLE) .................................. 32 TABLE 20. SOURCING AND SHARE OF LOW-WAGE EMPLOYMENT AND HIGH-WAGE EMPLOYMENT IN A BUSINESS
FUNCTION (FULL SAMPLE) .................................................................................................................................. 33 TABLE 21: INDUSTRY GROUPINGS AND NAICS CLASSIFICATIONS............................................................................... 43 TABLE 22. FULL SAMPLE - SHARE OF FULL-TIME DOMESTIC U.S. EMPLOYEES WORKING AT ORGANIZATIONS THAT
ENGAGE IN SOME DOMESTIC OUTSOURCING, OR INTERNATIONAL INTERNAL OR EXTERNAL SOURCING, BY ORGANIZATION SIZE, INDUSTRY, REGARDLESS OF BUSINESS FUNCTION .............................................................. 45
TABLE 23. GSS SAMPLE - SHARE OF FULL-TIME DOMESTIC U.S. EMPLOYEES WORKING AT ORGANIZATIONS THAT ENGAGE IN SOME DOMESTIC OUTSOURCING, OR INTERNATIONAL INTERNAL OR EXTERNAL SOURCING, BY ORGANIZATION SIZE, INDUSTRY, REGARDLESS OF BUSINESS FUNCTION .............................................................. 45
TABLE 24. FULL SAMPLE - DISTRIBUTION OF SOURCING COSTS FOR ORGANIZATION OF TYPICAL FULL-TIME DOMESTIC U.S. EMPLOYEE, BY ORGANIZATION SIZE, INDUSTRY, AND BUSINESS FUNCTION............................. 46
TABLE 25. GSS SAMPLE - DISTRIBUTION OF SOURCING COSTS FOR ORGANIZATION OF TYPICAL FULL-TIME DOMESTIC U.S. EMPLOYEE, BY ORGANIZATION SIZE, INDUSTRY, AND BUSINESS FUNCTION ............................... 48
TABLE 26. FULL SAMPLE - SHARE OF FULL-TIME DOMESTIC U.S. EMPLOYEES WORKING AT ORGANIZATIONS THAT ENGAGE IN SOME EXTERNAL SOURCING, BY ORGANIZATION SIZE, INDUSTRY, AND BUSINESS FUNCTION ............ 50
TABLE 27. GSS SAMPLE - SHARE OF FULL-TIME DOMESTIC U.S. EMPLOYEES WORKING AT ORGANIZATIONS THAT ENGAGE IN SOME EXTERNAL SOURCING, BY ORGANIZATION SIZE, INDUSTRY, AND BUSINESS FUNCTION ............ 52
TABLE 28: FULL DATA SET - DISTRIBUTION OF INTERNATIONAL SOURCING LOCATION TYPES FOR ORGANIZATION OF TYPICAL FULL-TIME DOMESTIC U.S. EMPLOYEE, BY INDUSTRY AND BUSINESS FUNCTION ............................... 54
TABLE 29: GSS DATA SET - DISTRIBUTION OF INTERNATIONAL SOURCING LOCATION TYPES FOR ORGANIZATION OF TYPICAL FULL-TIME DOMESTIC U.S. EMPLOYEE, BY INDUSTRY AND BUSINESS FUNCTION ............................... 54

The 2010 National Organizations Survey
The 2010 NOS was supported by the National Science Foundation under Grant No. 0926746
vi
TABLE 30: FULL SAMPLE - DISTRIBUTION OF EMPLOYMENT AT THE ORGANIZATION OF THE TYPICAL DOMESTIC FULL-TIME U.S. EMPLOYEE ......................................................................................................................................... 55
TABLE 31: GSS SAMPLE - DISTRIBUTION OF EMPLOYMENT AT THE ORGANIZATION OF THE TYPICAL DOMESTIC FULL-TIME U.S. EMPLOYEE ......................................................................................................................................... 56
TABLE 32. FULL DATA SET - DISTRIBUTION OF WAGES FOR ORGANIZATION OF TYPICAL FULL-TIME DOMESTIC U.S. EMPLOYEE (SORTED BY BUSINESS FUNCTION) ................................................................................................... 57
TABLE 33. GSS DATA SET - DISTRIBUTION OF WAGES FOR ORGANIZATION OF TYPICAL FULL-TIME DOMESTIC U.S. EMPLOYEE (SORTED BY BUSINESS FUNCTION) ................................................................................................... 59
TABLE 34. FULL DATA SET - SHARE OF FULL-TIME U.S. DOMESTIC EMPLOYEES AT ORGANIZATIONS THAT HAVE VARIOUS TYPES OF RETIREMENT BENEFITS ....................................................................................................... 61
TABLE 35. GSS DATA SET - SHARE OF FULL-TIME U.S. DOMESTIC EMPLOYEES AT ORGANIZATIONS THAT HAVE VARIOUS TYPES OF RETIREMENT BENEFITS ....................................................................................................... 61
TABLE 36. FULL DATA SET - SHARE OF FULL-TIME DOMESTIC U.S. EMPLOYEES THAT WORK AT ORGANIZATIONS THAT HAVE INTERNATIONAL REVENUES ............................................................................................................ 62
TABLE 37. GSS DATA SET - SHARE OF FULL-TIME DOMESTIC U.S. EMPLOYEES THAT WORK AT ORGANIZATIONS THAT HAVE INTERNATIONAL REVENUES ............................................................................................................ 62
TABLE 38. FULL DATA SET - SHARE OF FULL-TIME DOMESTIC U.S. EMPLOYEES WORKING AT ORGANIZATIONS THAT HAVE A % OF EMPLOYEES UNIONIZED ............................................................................................................... 63
TABLE 39. GSS DATA SET - SHARE OF FULL-TIME DOMESTIC U.S. EMPLOYEES WORKING AT ORGANIZATIONS THAT HAVE A % OF EMPLOYEES UNIONIZED ............................................................................................................... 63
Figures:
FIGURE 1. FOUR SOURCING OPTIONS FOR BUSINESS FUNCTIONS ................................................................................... 8 FIGURE 2. DISTRIBUTION OF INTERNATIONAL SOURCING LOCATION TYPES FOR U.S. GOODS-PRODUCING AND NON-
GOODS-PRODUCING ORGANIZATIONS BY BUSINESS FUNCTION (FULL SAMPLE) .................................................. 16 FIGURE 3. DISTRIBUTION OF WAGES FOR ORGANIZATION OF FULL-TIME U.S. DOMESTIC EMPLOYEES, BY BUSINESS
FUNCTION (FULL SAMPLE) ................................................................................................................................... 19 FIGURE 4. WAGE RANGE DISTRIBUTION IN PRIMARY BUSINESS FUNCTIONS, BY INDUSTRY ........................................ 20 FIGURE 5. WAGE DISTRIBUTION IN HIGH AND LOW WAGE BUSINESS FUNCTIONS BY INDUSTRY ................................ 21 FIGURE 6. EMPLOYMENT BY BUSINESS FUNCTION, COMPARISON OF 2010 NOS WITH EUROSTAT 2011
INTERNATIONAL SOURCING/GLOBAL VALUE CHAIN (IS/GVC) SURVEY............................................................ 40 FIGURE 7. SHARE OF ORGANIZATIONS/ENTERPRISES DOMESTICALLY OUTSOURCING AND INTERNATIONALLY
SOURCING THE PRIMARY/CORE BUSINESS FUNCTION, COMPARISON OF 2010 NOS WITH EUROSTAT 2011 INTERNATIONAL SOURCING/GLOBAL VALUE CHAIN (IS/GVC) SURVEY............................................................ 41

The 2010 National Organizations Survey
The 2010 NOS was supported by the National Science Foundation under Grant No. 0926746
1
Introduction There is an ongoing debate in the United States and elsewhere on the effects of economic globalization on employment and wages, and how changes in the geography of firms and industries are contributing, or not contributing, to undesirable economic outcomes, including slow wage growth, growing income inequality, and the current “jobless recovery” (see for example, Chatterji, 2013). Since the 1990s, outsourcing and offshoring1 by high profile firms in economically important industries such as electronics (Sturgeon, 2002; Brown and Linden, 2009) and motor vehicles (Sturgeon and Florida, 2004) has profoundly altered public perceptions and expectations about the geography of manufacturing and associated employment. Whether true or untrue, the sense is that work across the spectrum of business functions, from innovation to production to distribution, has become highly mobile, especially in manufacturing industries. In the early 2000s, the outsourcing and offshoring trend spread to services and service industries. Public anxiety increased when software coding work, call centers for sales and customer service, and a range of back office functions began to crop up in lower cost locations such as India and the Philippines, enabled by the new, low-cost, high-capacity digital voice and data communications networks underpinning the global Internet (Dossani and Kenney, 2003 and 2005). About ten years ago, the cover of a special issue of Business Week magazine on services offshoring asked, “Is your job next?” (Engardio et al, 2003). Some scholars have tried to counter the widespread anxiety and apparent inevitability of economic globalization in popular opinion, either by pointing out that falling costs for key imported goods and services (e.g., personal computers and information technology (IT) services) can help to drive economic growth at home (Mann and Kirkegaard, 2006); by arguing that outsourcing and offshoring are, in fact, less pervasive than generally thought, especially in services (Jensen, 2011); or by making the case for a return of manufacturing to the United States and other high-wage economies to counter the degradation of ‘industrial ecosystems,’ with substitution of new manufacturing technologies, such as 3-D printing, for experiments in offshoring to low wage economies that had not taken totals costs2 into account (Berger, et al, 2013). The truth is that we lack the basic facts needed to make judgments about the benefits and costs of economic globalization, or to devise effective policy responses. Basic questions such as, “How big are outsourcing and offshoring?” and “Is outsourcing and offshoring confined to specific industries or types of companies?” cannot be answered with current data resources, much less questions about how outsourcing and offshoring are affecting employment and wages in the United States. The data gaps related to outsourcing and offshoring are not new or unknown. Definitive research on the scale and effects of outsourcing and offshoring practices of commercial enterprises and other organizations has long been hampered by a lack of data, especially on traded services (Sturgeon et al, 2006; NAPA, 2006; Graham, 2007). This has led statistical agencies in Europe (Eurostat) and Canada
1 By outsourcing we mean the practice of sourcing goods and services externally, from suppliers, vendors and other service providers. Outsourcing can be from domestic or international suppliers. By offshoring we mean international sourcing. International sources can be either internal, from foreign affiliates, or external, from independent suppliers. 2 Total costs,in this context refer to costs beyond direct labor, including managerial, logistics and material costs, and also the less tangible costs that can come with offshoring, including degradation of quality, responsiveness, and the innovation ‘ecosystem’ at home. Innovation ecosystems include institutional supports, supply-base, and labor markets underpinning new product development.

The 2010 National Organizations Survey
The 2010 NOS was supported by the National Science Foundation under Grant No. 0926746
2
(Statistics Canada) to experiment with new surveys on international sourcing.3 These surveys have used a business function framework to collect information about international sourcing, not only for the primary outputs of the organization (i.e., the production of goods or services for use by external customers), but for a generic set of “support functions” 4 as well, such as research and development, information technology systems, transportation, and sales and marketing, functions that can also be subject to outsourcing and offshoring. This paper presents the results from a pilot international sourcing survey of United States organizations. Because the survey collected data on conditions in 2010, it is called the 2010 National Organizations Survey (2010 NOS). The survey has four important characteristics.
1. The 2010 NOS is representative of the employers of all full-time U.S. workers (aged 25 thru 62 years old), which includes non-profit and public organizations as well as for-profit firms ( “organization” is used here as an inclusive term). Although the data are for organizations, organizations are sampled according to their relative proportion of the United States full-time workforce. Because of this, the sample is representative of full-time jobs, not of organizations per se. The study also includes an oversampling of large firms, in order to ensure adequate data points for large employers. Prior prior research in Europe has shown large enterprises to be more likely to engage in international sourcing than smaller enterprises (Neilsen, 2008).
2. The survey collects data by eight business functions, which together are meant to capture all business activities: the primary business function (the core profit-making, customer facing activities of the organization), along with seven “support functions,” including 1) research and development (R&D); 2) sales and marketing; 3) transportation, logistics, and distribution; 4) customer and after-sales service; 5) management, administration and back-office functions; 6) information technology (IT) systems, and 7) facilities maintenance.
3. The survey quantifies both domestic and international sourcing as a percentage of costs within each business function. In surveys conducted in Europe and Canada, respondents were asked if their organization engaged in international sourcing or not, with no quantitative information collected.
4. The survey combines questions about sourcing (domestic and international) with questions about job quality (wages and distribution of employment by business function). Research in Europe and Canada has examined the relationships between international sourcing and employment by linking survey data to micro-data representing the whole enterprise (e.g., Neilsen and Luppes, 2012). The 2010 NOS’s quantification of international sourcing, employment, and wages according to business function allows these relationships to be explored with a high level of precision.
While the current study, as a non-mandatory pilot study, has limitations because of its small sample size and a single round of data collection, the 2010 NOS provides the first representative, comprehensive, conceptually robust, and internationally comparable evidence of the domestic and international sourcing practices of U.S. organizations. The resulting dataset allows the relationships between sourcing practices and domestic employment and earnings to be explored. To stimulate broad use of the data, a freely available public use file has been created and archived at the Inter-university Consortium for Political and Social Research (ISCPR).5 3 See http://epp.eurostat.ec.europa.eu/statistics_explained/index.php/International_sourcing and http://www.ic.gc.ca/eic/site/eas-aes.nsf/eng/h_ra02092.html 4 Porter (1985) first popularized the concept of production and support business functions within firms. 5 See http://www.icpsr.umich.edu/icpsrweb/landing.jsp, archived under the title: 2010 National Organizations Survey (NOS); Examining the Relationships Between Job Quality and the Outsourcing and Offshoring of Business Functions by United States Organizations.

The 2010 National Organizations Survey
The 2010 NOS was supported by the National Science Foundation under Grant No. 0926746
3
Our most general, descriptive results show that almost one-half (48%) of full-time employees work at organizations that have some domestic outsourcing, and almost one-quarter (23%) work at organizations that source internationally. While it is not uncommon for full-time employees to work at organizations that domestically outsource and internationally source business functions, the actual share of business costs from domestic outsourcing and international sourcing in 2010 are, on average, quite modest. For the typical U.S. employee’s organization, the majority of costs continue to be in the United States and within the organization. International sourcing is concentrated in organizations in the goods producing and trade industry groupings. It is spread across all functions, including R&D, and is mainly carried out by large firms through foreign affiliates. Most international sourcing is to high cost locations (most likely because of the long history of foreign direct investment by U.S. organizations in Canada and Western Europe) and secondarily to very low cost locations. Non-goods-producing organizations are more likely to source from very low cost locations. Domestic outsourcing is concentrated in transport, IT services, and facilities maintenance business functions, and no consistent relationships between domestic outsourcing and employment or wages were found. For the primary business function, the share of domestic employment decreases as international sourcing increases; the distribution of earnings, i.e., shares of low-wage or high-wage employment in the primary business function, is not significantly related to the international sourcing of the this function. This pattern is consistent with at least two outcomes: international sourcing of the primary business function substitutes for domestic jobs in the primary business function; or the international activity expands markets and thus requires an expansion of domestic employment in support functions more than in the primary business function. In either case, domestic high-wage and low-wage jobs in the primary business function appear to expand or contract at similar rates. The relationships between an organization’s domestic employment (and job quality) and international sourcing costs vary by support function. For example, as international sourcing increases, the share of domestic employment increases in customer service, IT, and sales and marketing. As international sourcing increases, the share of high-wage jobs in customer service, facilities maintenance, management and administration, and transportation also increase. R&D was the only business function where the share of low-wage jobs increased with higher international sourcing costs. In addition to these preliminary observations, the survey provides proof-of-concept, in the context of the United States, for the efficacy and usefulness of the data collection using a business function approach. The concepts and questions in the 2010 NOS were apparently well understood and answerable by respondents and despite the small sample size, the findings from to be in keeping with results from much larger studies (see Appendix C). It is important to note that the results of the 2010 NOS record only point-in-time information about sourcing and employment characteristics; they do not include measures of sourcing practices over time. Thus, the results reveal organizations’ sourcing patterns and locational choices, but cannot explain the causes of these decisions or show how they have changed over time. Information about trends and the causes of observed employment effects can only come from repeated surveys. However, the richness of the data, especially the detail provided by the business function framework, permits a more thorough examination of the outsourcing and offshoring practices of organizations than has been possible before. The following section describes the survey methodology, data collection methods, and response rates. The paper then describes the data distributions in detail for the full sample, and presents simple regression analysis of the basic relationships for the full sample, and the two overlapping subsamples (GSS and F-1K) depending upon the significance of the statistical relationships. The paper includes appendices describing the public use version of the dataset and how to access it, corrections made to the data, probability weighting methods, data quality indicators and validation, and how the industry groupings
The 2010 National Organizations Survey
The 2010 NOS was supported by the National Science Foundation under Grant No. 0926746
4
were derived. A final appendix (Appendix F) contains comprehensive tables for the full and GSS samples, including detailed results omitted from the main text of the paper for clarity, and standard deviations, when applicable.
Survey Methodology Sample Frames The information in the 2010 NOS dataset comes from two samples: a sample of organizations derived from the workplaces of individuals in a nationally-representative survey of individuals, and an additional oversample of large organizations drawn from the Fortune 1000. The 2010 NOS is a study of U.S. organizations; foreign-owned companies are excluded from both samples. The first sample is linked to responses to the General Social Survey (GSS), a survey of individuals in the U.S. conducted every two years by the National Opinion Research Center based at the University of Chicago.6 In 2008, the GSS survey included a module of questions that asked full-time employed respondents, among other things, for the name, address and phone number of their current workplace.7 The second sample for the 2010 NOS is drawn from Fortune Magazine’s 2008 list of the largest 1000 U.S.-headquartered companies, otherwise known as the Fortune 1000. While any employer in the U.S. could have employees sampled in the GSS, only 81 Fortune 1000 organizations in the 2010 NOS were linked to the 2008 GSS. The Fortune 1000 oversample was included because prior research indicates that large organizations tend to be more globally engaged than smaller organizations,8 and therefore more power was needed to analyze domestic and international sourcing by large organizations. The Fortune 1000 was selected as the population for the large firm oversample because it is a known population, and information about total domestic employment of the Fortune 1000 and their global revenues could be used to construct appropriate weights for these cases. In these two samples, surveys were administered at different levels of the organization depending on their size and sample source. For workplaces from the GSS that were not Fortune 1000 firms, the survey was administered at the organization’s headquarters to capture the characteristics of the whole organization. For Fortune 1000 companies that were sampled in either the GSS or the Fortune 1000 oversample, sampled organizations were identifiable revenue-producing business segments.9 To identify business segments in Fortune 1000 organizations, annual reports and company websites were analyzed to create lists of relevant business segments for each sampled organization. Because the target was revenue-producing organizations in the United States, fully international business segments and cross-functional, non-revenue-producing segments such as corporate finance were excluded from the sample. The number of business segments found at a given Fortune 1000 organization ranged from one to eleven, with an average of 2.7 segments per company. 6 The GSS is uses a randomly selected sample of adults of eighteen years of age or older who are not institutionalized. For more information on the GSS, see the main website for the data: http://www3.norc.org/gss+website/. 7 The National Organization Survey (NOS) has been conducted three prior times using this sampling method: in 1991, 1996 and 2002. In earlier versions of NOS the sample frame consisted only of the workplaces of full-time workers surveyed in the GSS; no oversample was added. 8 U.S. multinational firms, which tend to be large firms, account for about three-fourths of U.S. exports (Slaughter et al, 2012) and by definition, all foreign affiliate trade. 9 Business segments are sometimes referred to ad “divisions” or “lines of business” in company annual reports.

The 2010 National Organizations Survey
The 2010 NOS was supported by the National Science Foundation under Grant No. 0926746
5
The use of business segments reflects prior research regarding the location of decisions about sourcing within large organizations, which suggests these decisions are generally made at the business segment level in very large organizations (e.g., Berger et al, 2005). Differences in products, technology, and markets often require distinct management and decision-making structures for various business segments within large organizations. For example: a large transportation and logistics company may have distinct and separately managed trucking, warehousing, and logistics services business segments; while a large oil company may have distinct exploration and extraction, refining, and retail gasoline segments.
Data Collection and Response Rate Overall, 1,871 private and public organizations and Fortune 1000 business segments were in the two samples, with 1,103 organizations from the GSS and 768 additional Fortune 1000 business segments derived from the Fortune 1000 oversample. After the survey was administered, a handful of organizations were identified as being either duplicates of another organization already sampled, not headquartered domestically, or having gone out-of-business after they were identified for the sample. Since these organizations could not provide usable responses to the survey, a more accurate size for the sample can be calculated by subtracting these organizations from the overall sample, producing an adjusted sample size of 1,777 organizations and business segments, with 1,046 organizations from the GSS and 731 from the Fortune 1000 oversample (see Table 1). Note that the size of the GSS sample (and by extension the entire 2010 NOS sample) was limited by the number of workplaces identified by full-time employed GSS respondents, a tally that does not include any workplaces with fewer than 10 employees, which were excluded for confidentiality reasons. The NOS was administered from July 1 through December 31, 2011. The Henne Group, a survey research company based in San Francisco, California, developed and administered the web and telephone surveys. As part of its development, the survey was tested in small rounds with respondents at organizations not in the sample. The survey included explicit instructions to respondents about the time frame for various data. For single point data, such as the total domestic U.S. employment of the organization, the survey asked respondents to supply information for December 31, 2010. For annual data, such as sourcing costs by business function and total revenues, the survey asked respondents to supply data for the calendar year 2010. Of the adjusted sample size of 1,777 organizations and business segments, 333 organizations responded to the survey, with 264 responses coming from the GSS and 69 responses coming from the Fortune 1000 oversample. Overall, the response rate from these surveys was 18.7%, as shown in Table 1. The response rate from non-Fortune 1000 organizations in the GSS sample was 28.1%, the response rate from the Fortune 1000 observations in the GSS sample was 14.4%, and the overall Fortune 1000 response rate was 10.6%, as shown in Table 2. In some instances, alterations were made to the data to estimate missing data and make adjustments for errors and inconsistencies (see Appendix B). In addition, all statistics in this paper have been weighted by employment of organizations. This weighting method was devised in order to maintain sample representation of U.S. full-time employment. While large organizations only make up a small fraction of the number of organizations in the U.S., they represent a large share of employment and are hence accorded a comparatively larger weight in these statistics. A full discussion of the probability weighting methods used in the study can be found in Appendix D.

The 2010 National Organizations Survey
The 2010 NOS was supported by the National Science Foundation under Grant No. 0926746
6
Table 1: Response Rate to Survey
Fortune 1000 Oversample GSS Full Sample
Final Sample 768 1103 1871 Adjusted Sample 731 1046 1777 Completed Responses 69 264 333 Response Rate 9.4% 25.2% 18.7%
Table 2: Response Rate to Survey by Sample
Fortune 1000 Oversample GSS: Fortune 1000 Total Fortune 1000
segments GSS: Not Fortune
1000 Final Sample 768 217 985 886 Adjusted Sample 731 216 947 830 Completed Responses 69 31 100 233 Response Rate 9.4% 14.4% 10.6% 28.1%
The Business Function Framework A business function framework is used in the 2010 NOS to categorize data on sourcing, employment, and wages. Business functions offer a set of generic, easy-to-understand categories that describe the various business activities of organizations in a concise yet comprehensive and mutually exclusive way. The framework is based on the recognition that organizations, in addition to producing the goods and services for which they are generally known and earn revenues, typically engage in a variety of other activities to support the organization’s primary line of business. The 2011 NOS survey defined eight business functions for respondents as follows:
1) Primary Business Function: The main thing the organization makes or does; 2) Research and Development of Products, Services, or Technology: Including designing, redesigning, or
improving products or services, equipment, or procedures; and basic research and experimentation with new technology, systems, and processes;
3) Sales and Marketing: Including pre-sale interactions with existing or potential buyers, advertising, market research, account management, managing brands or products;
4) Transportation, Logistics, and Distribution: Including packing, storing, shipping or transporting in-process and finished products, and warehousing inventory;
5) Customer and After-Sales Service: Including call center services (excepting sales), maintaining and repairing products, technical support, customer service, and warranty support;
6) Management, Administration, and Back Office Functions: Including top management and centralized administrative support and procurement, human resources, accounting, legal, and finance;
7) Information Technology Systems: Including developing, maintaining, and repairing computer systems for internal use, writing software for internal use, and processing or managing data for internal use; and
8) Facilities Maintenance: Including maintenance and repair of owned or leased space or buildings, and janitorial and cleaning services.
With technological change and economic globalization, nearly all business functions have become susceptible to outsourcing and offshoring. The business function framework provides a generic framework for capturing information about a full range of business activity and job categories without the ambiguity in occupational or industry categories, though the organization’s main industry code can

The 2010 National Organizations Survey
The 2010 NOS was supported by the National Science Foundation under Grant No. 0926746
7
typically be associated with its primary business function.10 While efforts to establish international classification for business functions is underway,11 alignment of business function definitions currently have minor inconsistencies across surveys. However, given the simplicity of the framework, comparison is possible, and this significantly increases the value of the approach.
Descriptive Results Before presenting the descriptive results of the survey, the categories used to present the data are explained. First, in the main sections of the paper, all results are derived from the full sample. Differences between the two samples (GSS and Fortune 1000) are mainly a factor of firm size, and since the GSS sample included 81 Fortune 1000 firms and many other larger firms (defined as having more than 500 U.S. employees), the data is generally organized by firm size rather than sample source. However, for informational purposes, the full results from the GSS sample are included in a set of comprehensive tables in Appendix F. Second, the descriptive results are for the organization where the typical U.S. domestic full-time employee works.12 This is true whether the data represent the full sample or a set of organizations within a specific size or industry category. Again, this is because the sample frame is representative of the U.S. population of full-time employed workers rather than the population of organizations. Third, some of the descriptive statistics do not show the quantity of sourcing or employment in an organization, only if there is any employment or sourcing costs in a specific business function. For example, across the entire sample, on average, organizations had 3.1% of U.S. employment in the R&D business function. On the other hand, 50.5% of full-time employees had at least one co-worker in the R&D function (compare Table 10 to Table 11). Similarly, the organizations where full-time employees work incur, on average, only 2.9% of primary business function costs in international affiliates, but 13.8% of domestic full-time employees work at organizations that incur some costs at international affiliates (compare Table 10 to Table 11). This measure helps to gauge the level of employee exposure to a given sourcing practice in the United States, and is comparable to statistics collected in Europe (see Appendix C). Finally, the industry categories used in the descriptive statistics and analytic results are few (goods producing, trade, public/health/education, and other services), again because of the small sample size and limited response rate. A full description of how these industry categories were assigned to the cases is provided in Appendix E.
International and Domestic Sourcing by Business Function
10 For example engineering occupations might cut across business functions, and industry codes are most useful as designations of the organization’s primary business function. 11 United Nations Statistical Division; Technical Subgroup on the Classification of Business Functions. 12 Again, organizations with fewer than 10 employees and foreign-owned organizations were excluded from the 1020 NOS.

The 2010 National Organizations Survey
The 2010 NOS was supported by the National Science Foundation under Grant No. 0926746
8
The 2010 NOS Survey collected information about sourcing based on a four-part division of organizational and geographic sourcing options: 1) domestic sourcing in internal operations (in-house); 2) domestic sourcing to external suppliers; 3) international sourcing to affiliated companies; and 4) international sourcing to external suppliers. International affiliates were defined as foreign organizations where a domestic U.S. parent had a 10% or greater equity stake. These four categories are described in more detail in Figure 1. To measure the degree to which organizations engaged in these different sourcing practices, the survey asked respondents to quantify the distribution of costs across the four sourcing options described in Figure 1 for each of the eight business functions described above for calendar year 2010. To help illustrate how the survey’s data collection framework helps to describe the sourcing practices of an organization, consider a hypothetical example of a firm that primarily manufactures automotive parts. It may produce some of those parts (its “primary business function”) in-house in one or more of its domestic factories and also manufacture other parts internationally (“offshore”) in the factories of affiliated companies, have in-house expenditures devoted to research and development of new products, domestically source transportation services from a local domestic trucking company, and internationally source a portion of its software design and coding work (included in the IT services function) from an external supplier.
Figure 1. Four Sourcing Options for Business Functions
Domestic Sourcing International Sourcing (Offshoring)
Internal Sourcing
1) Domestic in-house sourcing
Work performed within the enterprise or enterprise group within the U.S.
3) International (offshore) sourcing to affiliates
Work performed within the enterprise or enterprise group outside the U.S. (a foreign operation in which a U.S. parent has 10% or greater equity stake)
Four sourcing options for any business function
External Sourcing
(Outsourcing)
2) Domestic outsourcing
Work performed outside the enterprise or enterprise group by non-affiliated enterprises within the U.S. (e.g., sourced from independent suppliers, service providers, vendors, contractors, etc.)
4) International (offshore) outsourcing
Work performed outside the enterprise or enterprise group by non-affiliated enterprises outside the U.S. (e.g., sourced from independent suppliers, service providers, vendors, contractors, etc.)
The combination of the business function framework with the four sourcing options shown in Figure 1 provides a framework for capturing and quantifying these four possible sourcing practices, even if they are carried our in combination. For example, the hypothetical automotive parts manufacturer just discussed might incur 60% of its IT services from its in-house software development group, and 40% of IT services internationally from an external supplier. Because respondents were asked to indicate the distribution of costs across the four sourcing options for each function, the relative importance of each option was measured for each business function and not for the whole organization (organizations have costs that cannot be associated with sourcing, such as the cost of capital). To ensure a consistent understanding of what constitutes a cost, the survey provided respondents specific definitions of costs for different industries as follows:
The 2010 National Organizations Survey
The 2010 NOS was supported by the National Science Foundation under Grant No. 0926746
9
1) Manufacturing: Costs represent the costs of goods sold (COGS), or the costs of materials, labor, and factory overhead;
2) Retail: Costs represent the COGS, described as what the organization pays to buy the goods that it sells to its customers;
3) Other Services: Costs represent the costs associated with persons or machines directly applying the service, a measure of costs typically referred to as the cost of sales by accountants; and,
4) Public Administration: Costs represent spending in the organization’s operating budget.
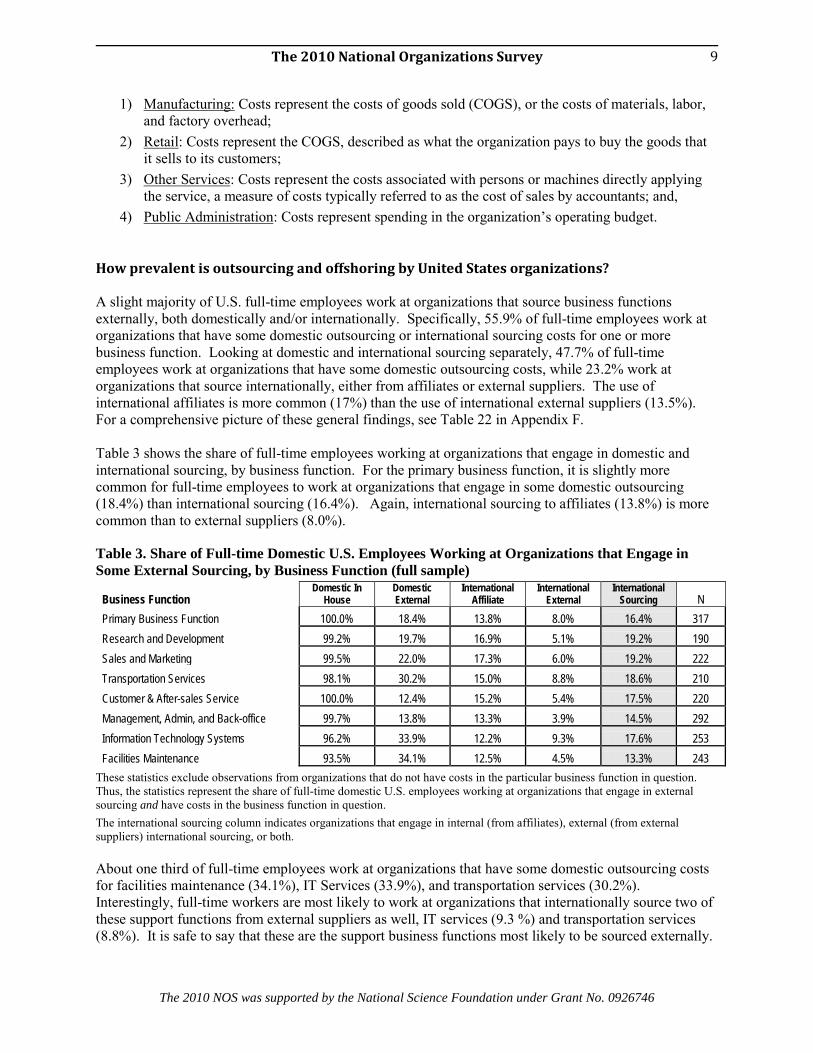
How prevalent is outsourcing and offshoring by United States organizations? A slight majority of U.S. full-time employees work at organizations that source business functions externally, both domestically and/or internationally. Specifically, 55.9% of full-time employees work at organizations that have some domestic outsourcing or international sourcing costs for one or more business function. Looking at domestic and international sourcing separately, 47.7% of full-time employees work at organizations that have some domestic outsourcing costs, while 23.2% work at organizations that source internationally, either from affiliates or external suppliers. The use of international affiliates is more common (17%) than the use of international external suppliers (13.5%). For a comprehensive picture of these general findings, see Table 22 in Appendix F. Table 3 shows the share of full-time employees working at organizations that engage in domestic and international sourcing, by business function. For the primary business function, it is slightly more common for full-time employees to work at organizations that engage in some domestic outsourcing (18.4%) than international sourcing (16.4%). Again, international sourcing to affiliates (13.8%) is more common than to external suppliers (8.0%).
Table 3. Share of Full-time Domestic U.S. Employees Working at Organizations that Engage in Some External Sourcing, by Business Function (full sample)
Business Function Domestic In
House Domestic External
International Affiliate
International External
International Sourcing N
Primary Business Function 100.0% 18.4% 13.8% 8.0% 16.4% 317 Research and Development 99.2% 19.7% 16.9% 5.1% 19.2% 190 Sales and Marketing 99.5% 22.0% 17.3% 6.0% 19.2% 222 Transportation Services 98.1% 30.2% 15.0% 8.8% 18.6% 210 Customer & After-sales Service 100.0% 12.4% 15.2% 5.4% 17.5% 220 Management, Admin, and Back-office 99.7% 13.8% 13.3% 3.9% 14.5% 292 Information Technology Systems 96.2% 33.9% 12.2% 9.3% 17.6% 253 Facilities Maintenance 93.5% 34.1% 12.5% 4.5% 13.3% 243
These statistics exclude observations from organizations that do not have costs in the particular business function in question. Thus, the statistics represent the share of full-time domestic U.S. employees working at organizations that engage in external sourcing and have costs in the business function in question. The international sourcing column indicates organizations that engage in internal (from affiliates), external (from external suppliers) international sourcing, or both. About one third of full-time employees work at organizations that have some domestic outsourcing costs for facilities maintenance (34.1%), IT Services (33.9%), and transportation services (30.2%). Interestingly, full-time workers are most likely to work at organizations that internationally source two of these support functions from external suppliers as well, IT services (9.3 %) and transportation services (8.8%). It is safe to say that these are the support business functions most likely to be sourced externally.

The 2010 National Organizations Survey
The 2010 NOS was supported by the National Science Foundation under Grant No. 0926746
10
On the other side of the spectrum lie management, administration and back office functions. These functions are, in general, more likely to be sourced internally. Only 13.3% of employees work at organizations that outsource management, administration and back office functions domestically, and 3.9% of employees work at organizations that outsource them internationally. While it is not uncommon for full-time employees to work at organizations that domestically outsource and internationally source business functions, the actual share of business costs from domestic outsourcing and international sourcing in 2010 are, on average, quite modest. For the typical U.S. employee’s organization, the majority of costs continue to be in the United States and within the organization. As Table 4 shows, 93.3% of primary business function costs are in-house, on average, while costs for domestic outsourcing and sourcing from international affiliates are small and roughly equal (about 3% of primary business function costs). Outsourcing from international external suppliers is negligible, on average, at less than 1% of primary business function costs. This is true, not only for the primary business function, but across all business functions. Most variation is in domestic outsourcing costs, which range from 1.8% of management, administration, and back-office function costs to 14.5% of facilities maintenance costs. As is suggested by the figures in Table 3 above on organizations with any external or international costs, the highest domestic outsourcing costs are in facilities maintenance (14.5%), transport, logistics, and distribution services (12.6%), and IT services (12.4%), and the lowest is for management, administration, and back-office functions (1.8%). Domestic outsourcing costs for other business functions range from 2.3% (customer and after-sales service) to 4.2% (sales and marketing), with a similar level of costs for international affiliates.
Table 4. Distribution of Sourcing Costs for U.S. Organizations by Business Function (full sample)
Business Function Domestic In
House Domestic External
International Affiliate
International External
International Sourcing N
Primary Business Function 93.3% 3.0% 2.9% 0.8% 3.7% 317 Research and Development 91.8% 3.4% 3.9% 0.9% 4.8% 190 Sales and Marketing 91.5% 4.2% 4.0% 0.3% 4.3% 222 Transportation Services 82.6% 12.6% 3.2% 1.7% 4.8% 210 Customer & After-sales Service 92.9% 2.3% 4.2% 0.6% 4.8% 220 Management, Admin, and Back-office 94.9% 1.8% 3.0% 0.4% 3.4% 292 Information Technology Systems 83.2% 12.4% 3.1% 1.4% 4.5% 253 Facilities Maintenance 81.6% 14.5% 3.4% 0.5% 3.9% 243 The international sourcing column indicates organizations that engage in internal (from affiliates), external (from external suppliers) international sourcing, or both.
External and international sourcing by organization size As Table 5 shows, large organizations (defined in these descriptive statistics as organizations with 500 employees or greater in the U.S.) and small organizations (defined as having fewer than 500 employees) incur about the same share of costs, on average, for domestic outsourcing across most business functions, with smaller firms slightly more likely to engage in domestic outsourcing. Exceptions are IT services, where smaller organizations domestically outsource 18.0% of costs compared with only 9.4% for larger organizations; and facilities maintenance, with 23.0% of costs domestically outsourced by smaller organizations compared with only 9.6% by larger organizations.

The 2010 National Organizations Survey
The 2010 NOS was supported by the National Science Foundation under Grant No. 0926746
11
The most pronounced difference between small and large organizations is in international sourcing. The average smaller organization sources only 1.8% of its primary business function costs internationally, nearly equally divided between affiliates and external suppliers. The average larger organization internationally sources 5.1% of its primary business function, with the bulk of those costs (4.4%) incurred from affiliates. This pattern holds up across all business functions. The business functions with the highest level of international sourcing costs by large organizations are customer and after sales service (7.4%), with the bulk (6.5%) again incurred from affiliates. Business functions showing the highest level of international sourcing costs from external suppliers are transportation (2.2%) and IT services (2.0%).
Table 5. Distribution of Sourcing Costs for U.S. Organizations by Size (full sample)
Business Function US Emp.
Size Domestic In
House Domestic External
International Affiliate
International External
International Sourcing N
Primary Business Function <500 95.1% 3.2% 0.8% 1.0% 1.8% 121 ≥500 92.1% 2.9% 4.4% 0.7% 5.1% 196
Research and Development <500 95.6% 2.9% 0.6% 1.0% 1.6% 51 ≥500 90.2% 3.6% 5.3% 0.9% 6.2% 139
Sales and Marketing <500 93.8% 3.7% 2.2% 0.3% 2.5% 76 ≥500 90.1% 4.5% 5.1% 0.4% 5.4% 146
Transportation Services <500 86.8% 12.3% 0.5% 0.4% 0.9% 63
≥500 80.7% 12.7% 4.4% 2.2% 6.6% 147
Customer & After-sales Service
<500 97.5% 2.1% 0.3% 0.0% 0.3% 76
≥500 90.3% 2.3% 6.5% 0.9% 7.4% 144
Management, Admin, and Back-office
<500 98.5% 1.1% 0.3% 0.1% 0.3% 104 ≥500 92.6% 2.2% 4.6% 0.6% 5.3% 188
Information Technology Systems
<500 81.7% 18.0% 0.1% 0.2% 0.2% 80 ≥500 83.9% 9.4% 4.6% 2.0% 6.7% 173
Facilities Maintenance <500 76.8% 23.0% 0.2% 0.1% 0.2% 84 ≥500 84.3% 9.6% 5.3% 0.8% 6.1% 159
The international sourcing column indicates organizations that engage in internal (from affiliates), external (from external suppliers) international sourcing, or both. From these data, it can be said that international sourcing is a very modest cost for U.S. organizations in general, but represents a more significant cost, on average, for larger organizations. About one third of full-time U.S. employees at large organizations work at organizations that engage in some international sourcing, compared to about 9.45 for smaller organizations. Only 5.6% of employees work at smaller organizations that source from international affiliates compared to 25.7% of employees at large organizations. These differences are consistent across business functions. Interestingly, while smaller organizations are unlikely to engage in international sourcing, when they do they are equally likely to source from affiliates and external international suppliers (5.6% for each). By contrast, larger organizations, when they do engage in some internal sourcing, are more likely to source from affiliates (26%) than from external international suppliers (19.4%). For a comprehensive picture of these general findings, see Table 22 in Appendix F.
Sourcing by industry
The 2010 National Organizations Survey
The 2010 NOS was supported by the National Science Foundation under Grant No. 0926746
12
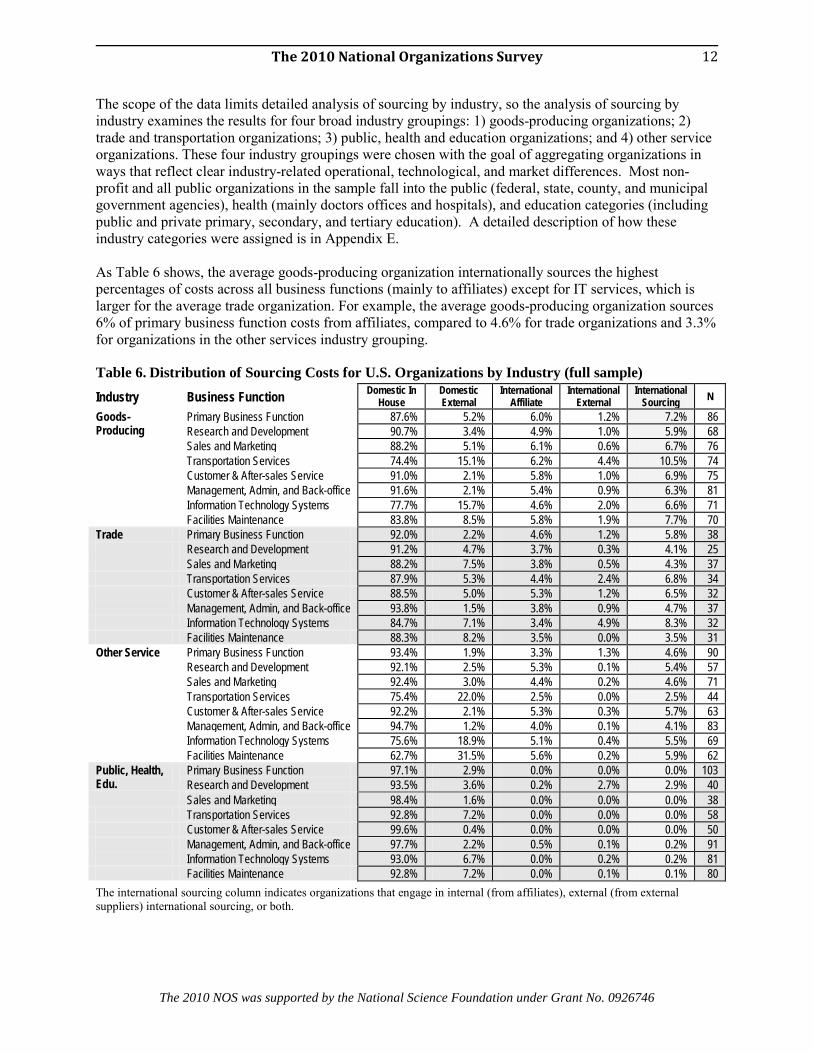
The scope of the data limits detailed analysis of sourcing by industry, so the analysis of sourcing by industry examines the results for four broad industry groupings: 1) goods-producing organizations; 2) trade and transportation organizations; 3) public, health and education organizations; and 4) other service organizations. These four industry groupings were chosen with the goal of aggregating organizations in ways that reflect clear industry-related operational, technological, and market differences. Most non-profit and all public organizations in the sample fall into the public (federal, state, county, and municipal government agencies), health (mainly doctors offices and hospitals), and education categories (including public and private primary, secondary, and tertiary education). A detailed description of how these industry categories were assigned is in Appendix E. As Table 6 shows, the average goods-producing organization internationally sources the highest percentages of costs across all business functions (mainly to affiliates) except for IT services, which is larger for the average trade organization. For example, the average goods-producing organization sources 6% of primary business function costs from affiliates, compared to 4.6% for trade organizations and 3.3% for organizations in the other services industry grouping.
Table 6. Distribution of Sourcing Costs for U.S. Organizations by Industry (full sample) Industry Business Function Domestic In
House Domestic External
International Affiliate
International External
International Sourcing N
Goods-Producing
Primary Business Function 87.6% 5.2% 6.0% 1.2% 7.2% 86 Research and Development 90.7% 3.4% 4.9% 1.0% 5.9% 68
Sales and Marketing 88.2% 5.1% 6.1% 0.6% 6.7% 76 Transportation Services 74.4% 15.1% 6.2% 4.4% 10.5% 74 Customer & After-sales Service 91.0% 2.1% 5.8% 1.0% 6.9% 75 Management, Admin, and Back-office 91.6% 2.1% 5.4% 0.9% 6.3% 81 Information Technology Systems 77.7% 15.7% 4.6% 2.0% 6.6% 71 Facilities Maintenance 83.8% 8.5% 5.8% 1.9% 7.7% 70 Trade Primary Business Function 92.0% 2.2% 4.6% 1.2% 5.8% 38 Research and Development 91.2% 4.7% 3.7% 0.3% 4.1% 25 Sales and Marketing 88.2% 7.5% 3.8% 0.5% 4.3% 37 Transportation Services 87.9% 5.3% 4.4% 2.4% 6.8% 34 Customer & After-sales Service 88.5% 5.0% 5.3% 1.2% 6.5% 32 Management, Admin, and Back-office 93.8% 1.5% 3.8% 0.9% 4.7% 37 Information Technology Systems 84.7% 7.1% 3.4% 4.9% 8.3% 32 Facilities Maintenance 88.3% 8.2% 3.5% 0.0% 3.5% 31 Other Service Primary Business Function 93.4% 1.9% 3.3% 1.3% 4.6% 90 Research and Development 92.1% 2.5% 5.3% 0.1% 5.4% 57 Sales and Marketing 92.4% 3.0% 4.4% 0.2% 4.6% 71 Transportation Services 75.4% 22.0% 2.5% 0.0% 2.5% 44 Customer & After-sales Service 92.2% 2.1% 5.3% 0.3% 5.7% 63 Management, Admin, and Back-office 94.7% 1.2% 4.0% 0.1% 4.1% 83 Information Technology Systems 75.6% 18.9% 5.1% 0.4% 5.5% 69 Facilities Maintenance 62.7% 31.5% 5.6% 0.2% 5.9% 62 Public, Health, Edu.
Primary Business Function 97.1% 2.9% 0.0% 0.0% 0.0% 103 Research and Development 93.5% 3.6% 0.2% 2.7% 2.9% 40 Sales and Marketing 98.4% 1.6% 0.0% 0.0% 0.0% 38
Transportation Services 92.8% 7.2% 0.0% 0.0% 0.0% 58 Customer & After-sales Service 99.6% 0.4% 0.0% 0.0% 0.0% 50 Management, Admin, and Back-office 97.7% 2.2% 0.5% 0.1% 0.2% 91 Information Technology Systems 93.0% 6.7% 0.0% 0.2% 0.2% 81 Facilities Maintenance 92.8% 7.2% 0.0% 0.1% 0.1% 80 The international sourcing column indicates organizations that engage in internal (from affiliates), external (from external suppliers) international sourcing, or both.
The 2010 National Organizations Survey
The 2010 NOS was supported by the National Science Foundation under Grant No. 0926746
13
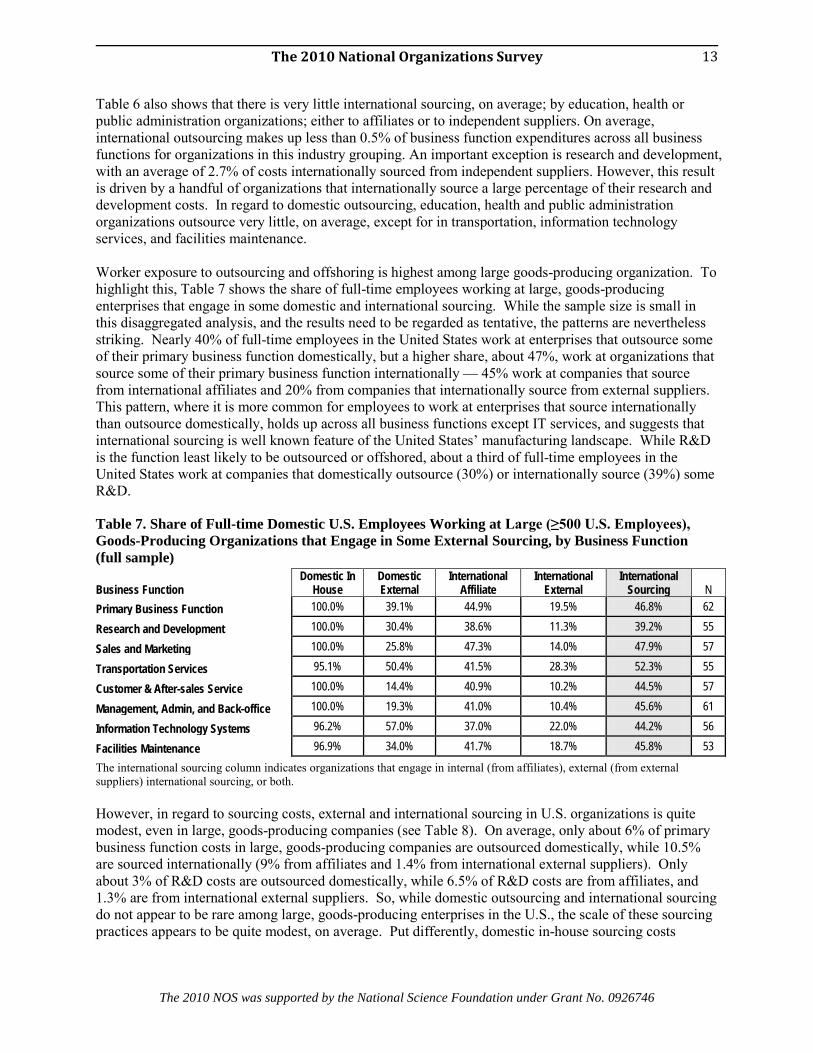
Table 6 also shows that there is very little international sourcing, on average; by education, health or public administration organizations; either to affiliates or to independent suppliers. On average, international outsourcing makes up less than 0.5% of business function expenditures across all business functions for organizations in this industry grouping. An important exception is research and development, with an average of 2.7% of costs internationally sourced from independent suppliers. However, this result is driven by a handful of organizations that internationally source a large percentage of their research and development costs. In regard to domestic outsourcing, education, health and public administration organizations outsource very little, on average, except for in transportation, information technology services, and facilities maintenance. Worker exposure to outsourcing and offshoring is highest among large goods-producing organization. To highlight this, Table 7 shows the share of full-time employees working at large, goods-producing enterprises that engage in some domestic and international sourcing. While the sample size is small in this disaggregated analysis, and the results need to be regarded as tentative, the patterns are nevertheless striking. Nearly 40% of full-time employees in the United States work at enterprises that outsource some of their primary business function domestically, but a higher share, about 47%, work at organizations that source some of their primary business function internationally — 45% work at companies that source from international affiliates and 20% from companies that internationally source from external suppliers. This pattern, where it is more common for employees to work at enterprises that source internationally than outsource domestically, holds up across all business functions except IT services, and suggests that international sourcing is well known feature of the United States’ manufacturing landscape. While R&D is the function least likely to be outsourced or offshored, about a third of full-time employees in the United States work at companies that domestically outsource (30%) or internationally source (39%) some R&D.
Table 7. Share of Full-time Domestic U.S. Employees Working at Large (≥500 U.S. Employees), Goods-Producing Organizations that Engage in Some External Sourcing, by Business Function (full sample)
Business Function Domestic In
House Domestic External
International Affiliate
International External
International Sourcing N
Primary Business Function 100.0% 39.1% 44.9% 19.5% 46.8% 62
Research and Development 100.0% 30.4% 38.6% 11.3% 39.2% 55
Sales and Marketing 100.0% 25.8% 47.3% 14.0% 47.9% 57
Transportation Services 95.1% 50.4% 41.5% 28.3% 52.3% 55
Customer & After-sales Service 100.0% 14.4% 40.9% 10.2% 44.5% 57
Management, Admin, and Back-office 100.0% 19.3% 41.0% 10.4% 45.6% 61
Information Technology Systems 96.2% 57.0% 37.0% 22.0% 44.2% 56
Facilities Maintenance 96.9% 34.0% 41.7% 18.7% 45.8% 53
The international sourcing column indicates organizations that engage in internal (from affiliates), external (from external suppliers) international sourcing, or both. However, in regard to sourcing costs, external and international sourcing in U.S. organizations is quite modest, even in large, goods-producing companies (see Table 8). On average, only about 6% of primary business function costs in large, goods-producing companies are outsourced domestically, while 10.5% are sourced internationally (9% from affiliates and 1.4% from international external suppliers). Only about 3% of R&D costs are outsourced domestically, while 6.5% of R&D costs are from affiliates, and 1.3% are from international external suppliers. So, while domestic outsourcing and international sourcing do not appear to be rare among large, goods-producing enterprises in the U.S., the scale of these sourcing practices appears to be quite modest, on average. Put differently, domestic in-house sourcing costs
The 2010 National Organizations Survey
The 2010 NOS was supported by the National Science Foundation under Grant No. 0926746
14
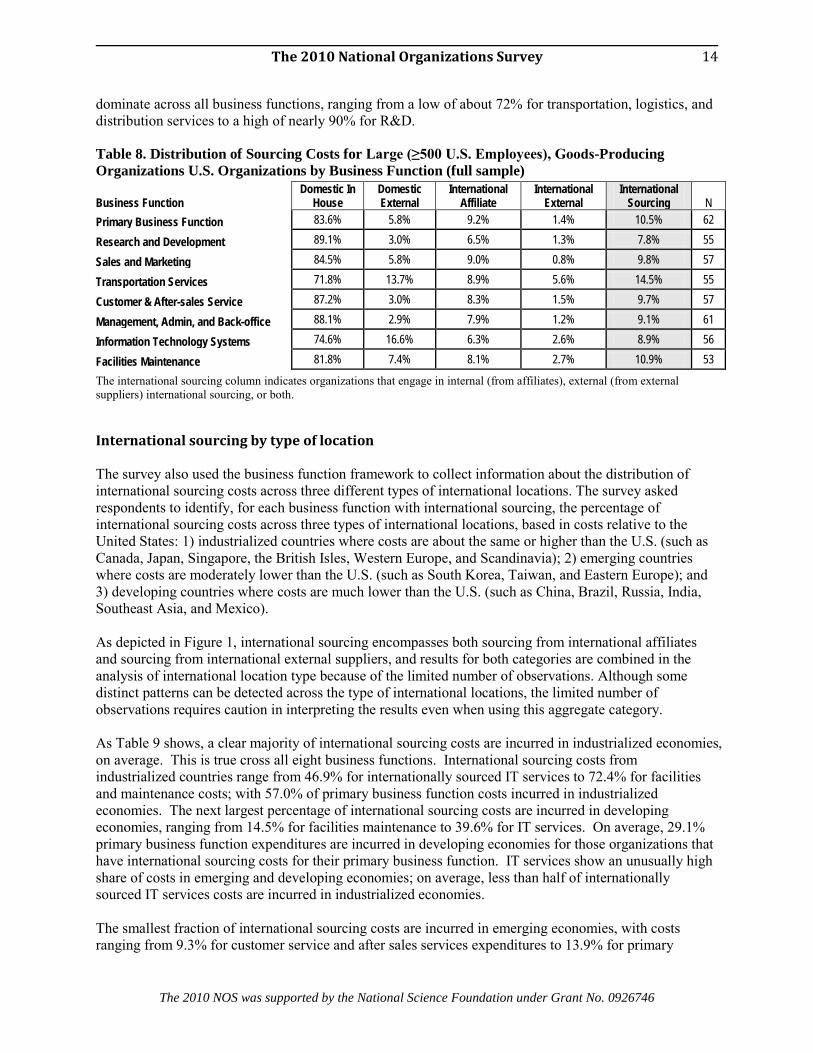
dominate across all business functions, ranging from a low of about 72% for transportation, logistics, and distribution services to a high of nearly 90% for R&D.
Table 8. Distribution of Sourcing Costs for Large (≥500 U.S. Employees), Goods-Producing Organizations U.S. Organizations by Business Function (full sample)
Business Function Domestic In
House Domestic External
International Affiliate
International External
International Sourcing N
Primary Business Function 83.6% 5.8% 9.2% 1.4% 10.5% 62
Research and Development 89.1% 3.0% 6.5% 1.3% 7.8% 55
Sales and Marketing 84.5% 5.8% 9.0% 0.8% 9.8% 57
Transportation Services 71.8% 13.7% 8.9% 5.6% 14.5% 55
Customer & After-sales Service 87.2% 3.0% 8.3% 1.5% 9.7% 57
Management, Admin, and Back-office 88.1% 2.9% 7.9% 1.2% 9.1% 61
Information Technology Systems 74.6% 16.6% 6.3% 2.6% 8.9% 56
Facilities Maintenance 81.8% 7.4% 8.1% 2.7% 10.9% 53
The international sourcing column indicates organizations that engage in internal (from affiliates), external (from external suppliers) international sourcing, or both.
International sourcing by type of location The survey also used the business function framework to collect information about the distribution of international sourcing costs across three different types of international locations. The survey asked respondents to identify, for each business function with international sourcing, the percentage of international sourcing costs across three types of international locations, based in costs relative to the United States: 1) industrialized countries where costs are about the same or higher than the U.S. (such as Canada, Japan, Singapore, the British Isles, Western Europe, and Scandinavia); 2) emerging countries where costs are moderately lower than the U.S. (such as South Korea, Taiwan, and Eastern Europe); and 3) developing countries where costs are much lower than the U.S. (such as China, Brazil, Russia, India, Southeast Asia, and Mexico). As depicted in Figure 1, international sourcing encompasses both sourcing from international affiliates and sourcing from international external suppliers, and results for both categories are combined in the analysis of international location type because of the limited number of observations. Although some distinct patterns can be detected across the type of international locations, the limited number of observations requires caution in interpreting the results even when using this aggregate category. As Table 9 shows, a clear majority of international sourcing costs are incurred in industrialized economies, on average. This is true cross all eight business functions. International sourcing costs from industrialized countries range from 46.9% for internationally sourced IT services to 72.4% for facilities and maintenance costs; with 57.0% of primary business function costs incurred in industrialized economies. The next largest percentage of international sourcing costs are incurred in developing economies, ranging from 14.5% for facilities maintenance to 39.6% for IT services. On average, 29.1% primary business function expenditures are incurred in developing economies for those organizations that have international sourcing costs for their primary business function. IT services show an unusually high share of costs in emerging and developing economies; on average, less than half of internationally sourced IT services costs are incurred in industrialized economies. The smallest fraction of international sourcing costs are incurred in emerging economies, with costs ranging from 9.3% for customer service and after sales services expenditures to 13.9% for primary

The 2010 National Organizations Survey
The 2010 NOS was supported by the National Science Foundation under Grant No. 0926746
15
business function expenditures. Thus, for the organization of the typical employee, the largest share of costs for international sourcing, on average, are incurred in high-cost locations, similar to the United States, and secondarily in very low-cost locations.
Table 9: Distribution of International Sourcing Location Types for U.S. Organizations by Business Function (full sample)
Business Function Industrialized
Economies Emerging
Economies Developing Economies N
Primary Business Function 57.0% 13.9% 29.1% 59 Research and Development 63.7% 9.9% 26.4% 39 Sales and Marketing 66.2% 11.1% 22.7% 51 Transportation Services 68.0% 12.0% 20.0% 41 Customer & After-sales Service 70.6% 9.3% 20.2% 38 Management, Admin, and Back-office 70.0% 11.9% 18.0% 46 Information Technology Systems 46.9% 13.5% 39.6% 46 Facilities Maintenance 72.4% 13.0% 14.5% 29
International sourcing indicates organizations that engage in internal (from affiliates), external (from external suppliers) international sourcing, or both. Since most organizations that reported international sourcing costs have more than 500 employees, it is not revealing to examine how international sourcing locations vary by organization size. However, it is instructive to look at how these patterns vary by industry. While the limited number of organizations that engaged in international sourcing makes it difficult to have confidence in statistics on types of international sourcing locations across all four industries, comparing goods-producing firms with the average in all other industries is revealing. The organization of the typical goods-producing employee sources 67.6% of primary business function costs in industrialized economies, on average, compared with only 48.9% for non-goods-producing organizations. In fact, for non-goods-producing organizations, the share of international sourcing costs in industrialized countries is below 50%, on average, for all business functions except facilities maintenance. These differences in international sourcing patterns are illustrated in Figure 2. The greater use of emerging and developing economy locations by non-goods producing organizations with international sourcing costs might be explained by the recent vintage of services offshoring, and the rise of low cost countries such as India as services exporters, on one hand, and the long history of internationalization by goods producing firms in high-cost countries such as Canada and Western Europe, on the other (see Sturgeon and Florida, 2000, for a discussion of early international sourcing in the automotive industry). It is hoped that future research can delve into the timing of international sourcing by type of location.
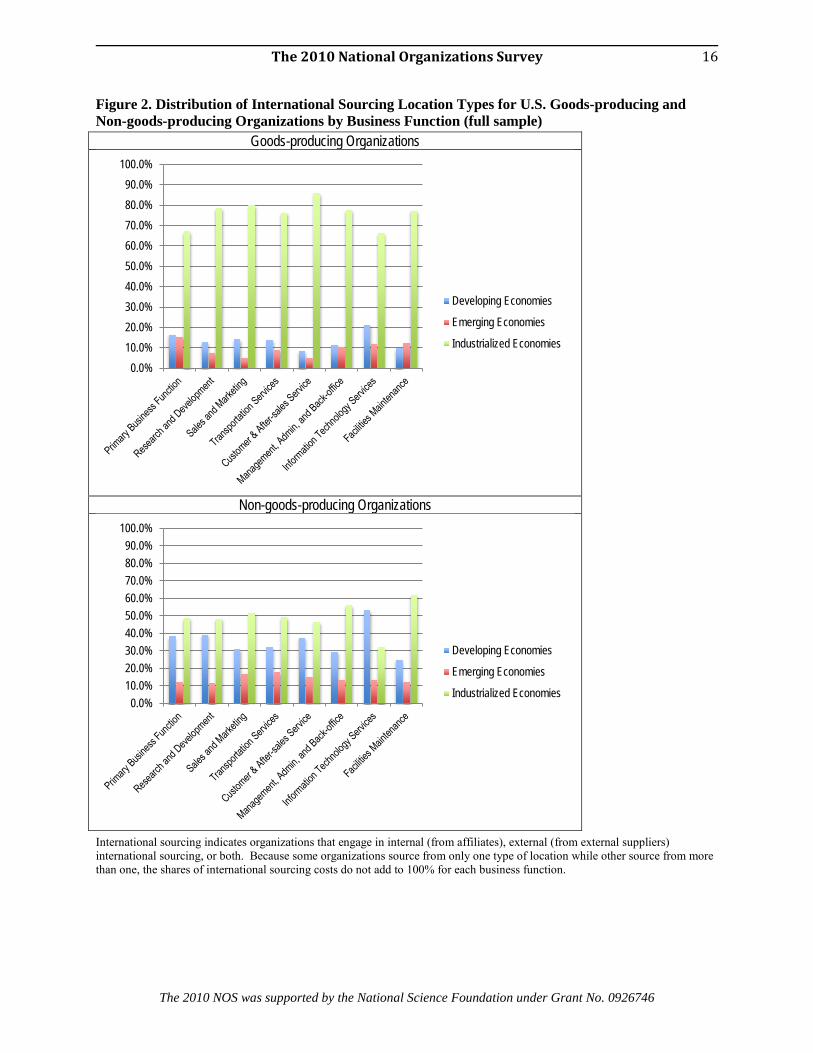
The 2010 National Organizations Survey
The 2010 NOS was supported by the National Science Foundation under Grant No. 0926746
16
Figure 2. Distribution of International Sourcing Location Types for U.S. Goods-producing and Non-goods-producing Organizations by Business Function (full sample)
Goods-producing Organizations
Non-goods-producing Organizations
International sourcing indicates organizations that engage in internal (from affiliates), external (from external suppliers) international sourcing, or both. Because some organizations source from only one type of location while other source from more than one, the shares of international sourcing costs do not add to 100% for each business function.
0.0%10.0%20.0%30.0%40.0%50.0%60.0%70.0%80.0%90.0%
100.0%
Developing Economies
Emerging Economies
Industrialized Economies
0.0%10.0%20.0%30.0%40.0%50.0%60.0%70.0%80.0%90.0%
100.0%
Developing Economies
Emerging Economies
Industrialized Economies
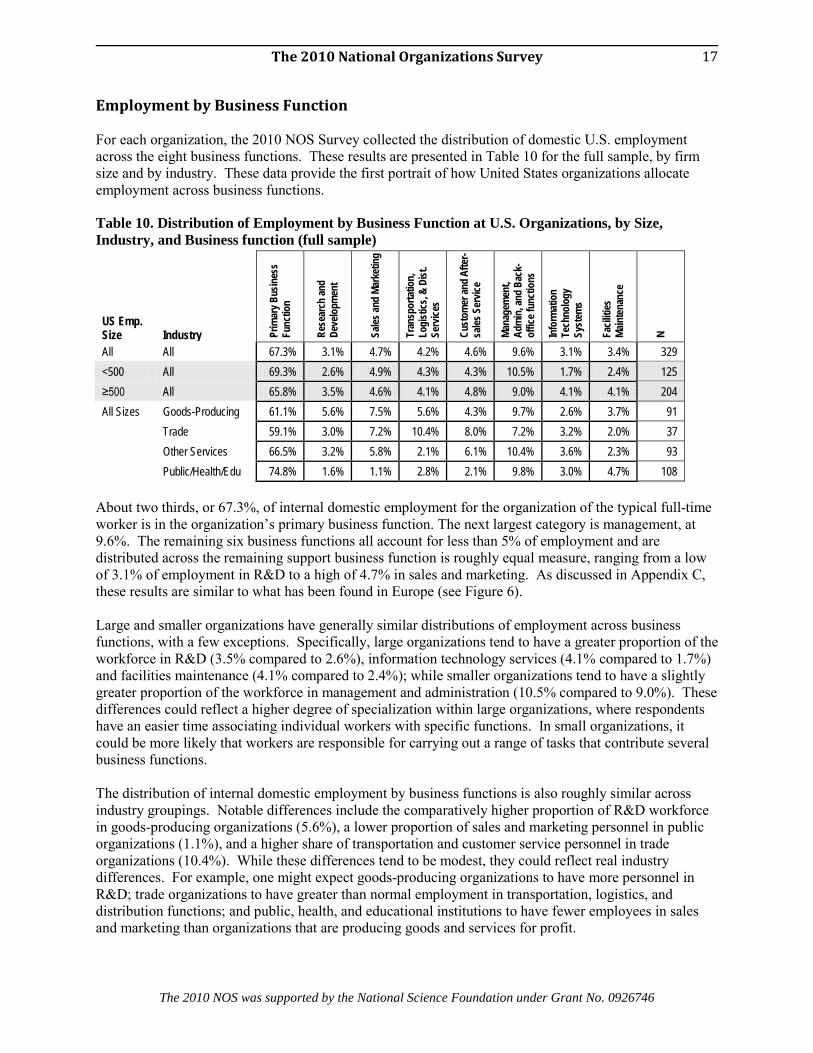
The 2010 National Organizations Survey
The 2010 NOS was supported by the National Science Foundation under Grant No. 0926746
17
Employment by Business Function For each organization, the 2010 NOS Survey collected the distribution of domestic U.S. employment across the eight business functions. These results are presented in Table 10 for the full sample, by firm size and by industry. These data provide the first portrait of how United States organizations allocate employment across business functions.
Table 10. Distribution of Employment by Business Function at U.S. Organizations, by Size, Industry, and Business function (full sample)
US Emp. Size Industry Pr
imar
y Bus
ines
s Fu
nctio
n
Rese
arch
and
Deve
lopm
ent
Sales
and
Mark
etin
g
Tran
spor
tatio
n,
Logi
stics
, & D
ist.
Serv
ices
Cust
omer
and
Afte
r-sa
les S
ervic
e
Mana
gem
ent,
Adm
in, a
nd B
ack-
offic
e fun
ctio
ns
Info
rmat
ion
Tech
nolo
gy
Syst
ems
Facil
ities
Ma
inte
nanc
e
N
All All 67.3% 3.1% 4.7% 4.2% 4.6% 9.6% 3.1% 3.4% 329 <500 All 69.3% 2.6% 4.9% 4.3% 4.3% 10.5% 1.7% 2.4% 125 ≥500 All 65.8% 3.5% 4.6% 4.1% 4.8% 9.0% 4.1% 4.1% 204 All Sizes Goods-Producing 61.1% 5.6% 7.5% 5.6% 4.3% 9.7% 2.6% 3.7% 91
Trade 59.1% 3.0% 7.2% 10.4% 8.0% 7.2% 3.2% 2.0% 37 Other Services 66.5% 3.2% 5.8% 2.1% 6.1% 10.4% 3.6% 2.3% 93 Public/Health/Edu 74.8% 1.6% 1.1% 2.8% 2.1% 9.8% 3.0% 4.7% 108
About two thirds, or 67.3%, of internal domestic employment for the organization of the typical full-time worker is in the organization’s primary business function. The next largest category is management, at 9.6%. The remaining six business functions all account for less than 5% of employment and are distributed across the remaining support business function is roughly equal measure, ranging from a low of 3.1% of employment in R&D to a high of 4.7% in sales and marketing. As discussed in Appendix C, these results are similar to what has been found in Europe (see Figure 6). Large and smaller organizations have generally similar distributions of employment across business functions, with a few exceptions. Specifically, large organizations tend to have a greater proportion of the workforce in R&D (3.5% compared to 2.6%), information technology services (4.1% compared to 1.7%) and facilities maintenance (4.1% compared to 2.4%); while smaller organizations tend to have a slightly greater proportion of the workforce in management and administration (10.5% compared to 9.0%). These differences could reflect a higher degree of specialization within large organizations, where respondents have an easier time associating individual workers with specific functions. In small organizations, it could be more likely that workers are responsible for carrying out a range of tasks that contribute several business functions. The distribution of internal domestic employment by business functions is also roughly similar across industry groupings. Notable differences include the comparatively higher proportion of R&D workforce in goods-producing organizations (5.6%), a lower proportion of sales and marketing personnel in public organizations (1.1%), and a higher share of transportation and customer service personnel in trade organizations (10.4%). While these differences tend to be modest, they could reflect real industry differences. For example, one might expect goods-producing organizations to have more personnel in R&D; trade organizations to have greater than normal employment in transportation, logistics, and distribution functions; and public, health, and educational institutions to have fewer employees in sales and marketing than organizations that are producing goods and services for profit.

The 2010 National Organizations Survey
The 2010 NOS was supported by the National Science Foundation under Grant No. 0926746
18
These differences are more pronounced when the share of workers at organizations with any employment in a given business function is examined, as shown in Table 11. While only 45.4% of employees at small organizations work at organizations with any employment in information technology, 91.7% of employees at large organizations work do. Similarly, while 36.8% of workers at small organizations have at least one R&D employee in their organization, 60.8% of workers at large firms have co-workers in R&D. For every business function except for the primary business function, larger organizations have a greater range of personnel that are specialized enough to be associated with specific business function. Again, this pattern could be due to the fact that there are fewer specialized groups and managers and workers typically perform a variety of functions at smaller organizations.
Table 11. Percentage of Full-Time Domestic Employees Working at U.S. Organizations with at least one Employee in a Business Function (full sample)
US Emp. Size Industry Pr
imar
y B
usin
ess
Func
tion
Res
earc
h an
d D
evel
opm
ent
Sale
s and
M
arke
ting
Tra
nspo
rtat
ion,
L
ogis
tics,
& D
ist.
Serv
ices
Cus
tom
er a
nd
Afte
r-sa
les S
ervi
ce
Man
agem
ent,
Adm
in, a
nd B
ack-
offic
e fu
nctio
ns
Info
rmat
ion
Tec
hnol
ogy
Syst
ems
Faci
litie
s M
aint
enan
ce
All All 100.0% 50.5% 68.2% 55.7% 59.5% 89.6% 71.8% 68.0%
<500 All 100.0% 36.8% 62.8% 40.7% 49.0% 83.2% 45.4% 68.0%
≥500 All 100.0% 60.8% 72.2% 66.9% 67.4% 94.4% 91.7% 84.7%
All Sizes Goods-Producing 100.0% 81.1% 93.5% 82.1% 81.4% 100.0% 76.9% 75.9%
Trade 100.0% 50.1% 97.0% 73.2% 77.5% 91.1% 79.7% 63.3%
Service 100.0% 55.3% 74.1% 39.6% 56.9% 89.8% 66.6% 52.5%
Public 100.0% 28.6% 37.2% 47.6% 42.2% 82.7% 70.3% 78.6% Note: These statistics exclude observations from organizations that do not have costs in the particular business function in question. Thus, the statistics represent the share of full-time domestic U.S. employees working at organizations that engage in external sourcing and have costs in the business function in question. With regard to industry, there are also clear differences in employment patterns. A full 81.1% of workers at goods-producing organization have co-workers in R&D, compared to only 28.6% of employees in public, health and education organizations. As would be expected, most employees at goods producing and trade organizations have co-workers in transportation, logistics, and distribution (81.4% and 77.5%) while only 39.6% of employees at service-producing organizations do.
Wages by Business Function The 2010 NOS survey used the business function framework to collect the percentage distribution of domestic wages in each business function across four ranges for annual wages: 1) the percentage of U.S. employees earning less than $40,000 annually; 2) the percentage of U.S. employees earning $40,000 to $60,000 annually; 3) the percentage of U.S. employees earning $60,000 to $90,000 annually; and 4) the percentage of U.S. employees earning more than $90,000 annually. These four earning groups approximate the four quartiles of annual earnings for full-time domestic workers in the U.S. in 2010. The four categories add up to 100% in each business function for each organization where respondents provided wage data. Organizations of full-time U.S. employees in the primary business have, on average:
• 39% of employees making less than $40,000 annually, • 29% of employees making $40,000 to $60,000 annually,

The 2010 National Organizations Survey
The 2010 NOS was supported by the National Science Foundation under Grant No. 0926746
19
• 23% making $60,000 to $90,000 annually, and • 9% making more than $90,000 annually.
The overall distribution of wages at small and larger organizations are broadly similar, but large organizations have a greater share of high-wage employment. For example, while the average small organization has 49.4% of employees making less than $40,000 and 5.6% of employees making more than $90,000, the average large organization has 28.8% of employees making less than $40,000 and 12.5% of employees making more than $90,000. This pattern holds across all business functions. However, wages show clear variation across business functions. As Figure 3 shows, wages are skewed toward the low and low-middle ranges (less than $40,000 and $40,000-$60,000 per year) in the primary business function, transportation services, customer and after-sales service, and facilities maintenance. On the other side of the spectrum, wages are skewed toward the high-middle and high ranges ($60,000-$90,000 and more than $90,000 per year) in R&D and IT services. Wages in the sales and marketing and management, administration, and back-office functions are more balanced across the four wage groupings, possibly because of the broad mix of occupations within them. For example, workers in the sales and marketing function might range from low paid call center workers to highly compensated workers in sales and marketing. Similarly, workers providing management, administration, and back-office functions might range from low paid clerical workers to highly paid top managers.
Figure 3. Distribution of Wages for Organization of Full-time U.S. Domestic Employees, by Business function (full sample)
PrimaryBusinessFunction
R&D Sales andMarketing
Trans.Services
Customer& After-sales
Service
Mgmt.Admin,
and Back-office
ITServices
FacilitiesMaint
Less than $40,000 39.3% 10.0% 13.6% 42.7% 39.4% 22.7% 11.5% 43.7%$40,000 - $60,000 28.5% 25.0% 29.0% 34.7% 31.6% 29.0% 31.1% 33.9%$60,000 - 90,000 23.3% 37.4% 29.0% 18.1% 20.6% 29.8% 39.7% 17.8%More than $90,000 9.0% 27.6% 28.4% 4.5% 8.3% 18.5% 17.8% 4.5%
0.0%
5.0%
10.0%
15.0%
20.0%
25.0%
30.0%
35.0%
40.0%
45.0%
50.0%
Shar
e of U
.S. D
omrs
tic W
orkf
orce
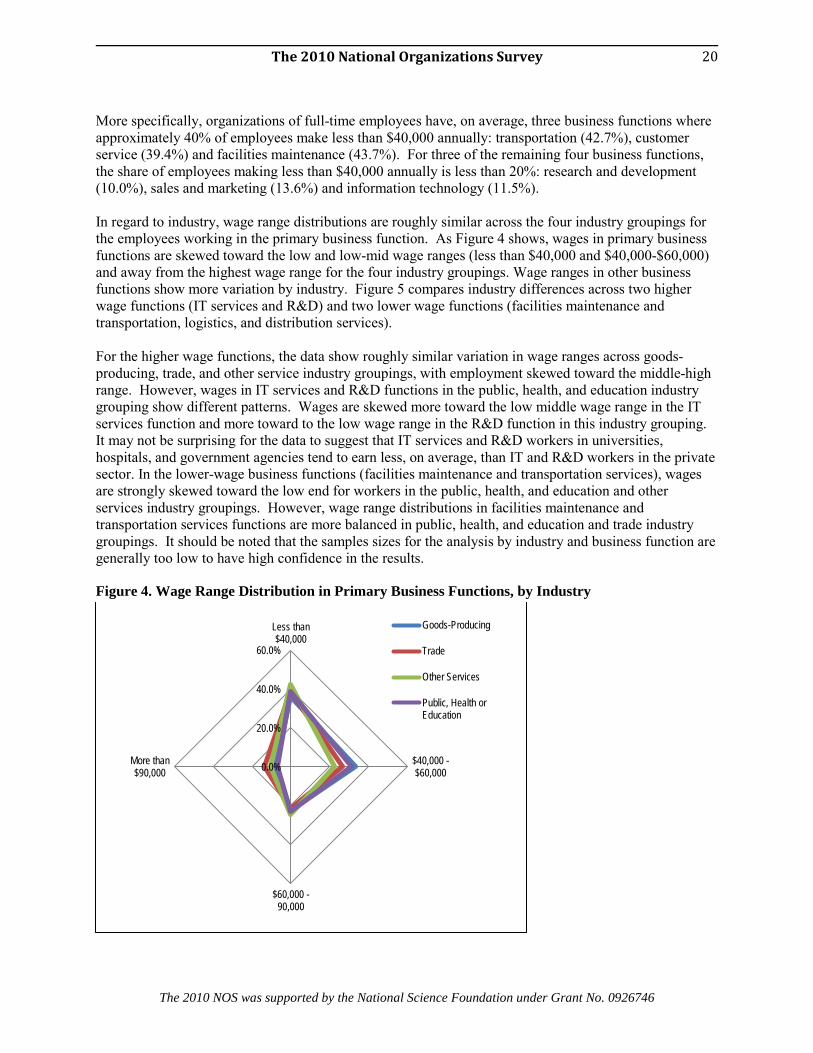
The 2010 National Organizations Survey
The 2010 NOS was supported by the National Science Foundation under Grant No. 0926746
20
More specifically, organizations of full-time employees have, on average, three business functions where approximately 40% of employees make less than $40,000 annually: transportation (42.7%), customer service (39.4%) and facilities maintenance (43.7%). For three of the remaining four business functions, the share of employees making less than $40,000 annually is less than 20%: research and development (10.0%), sales and marketing (13.6%) and information technology (11.5%). In regard to industry, wage range distributions are roughly similar across the four industry groupings for the employees working in the primary business function. As Figure 4 shows, wages in primary business functions are skewed toward the low and low-mid wage ranges (less than $40,000 and $40,000-$60,000) and away from the highest wage range for the four industry groupings. Wage ranges in other business functions show more variation by industry. Figure 5 compares industry differences across two higher wage functions (IT services and R&D) and two lower wage functions (facilities maintenance and transportation, logistics, and distribution services). For the higher wage functions, the data show roughly similar variation in wage ranges across goods-producing, trade, and other service industry groupings, with employment skewed toward the middle-high range. However, wages in IT services and R&D functions in the public, health, and education industry grouping show different patterns. Wages are skewed more toward the low middle wage range in the IT services function and more toward to the low wage range in the R&D function in this industry grouping. It may not be surprising for the data to suggest that IT services and R&D workers in universities, hospitals, and government agencies tend to earn less, on average, than IT and R&D workers in the private sector. In the lower-wage business functions (facilities maintenance and transportation services), wages are strongly skewed toward the low end for workers in the public, health, and education and other services industry groupings. However, wage range distributions in facilities maintenance and transportation services functions are more balanced in public, health, and education and trade industry groupings. It should be noted that the samples sizes for the analysis by industry and business function are generally too low to have high confidence in the results.
Figure 4. Wage Range Distribution in Primary Business Functions, by Industry
0.0%
20.0%
40.0%
60.0%
Less than$40,000
$40,000 -$60,000
$60,000 -90,000
More than$90,000
Goods-Producing
Trade
Other Services
Public, Health orEducation

The 2010 National Organizations Survey
The 2010 NOS was supported by the National Science Foundation under Grant No. 0926746
21
Figure 5. Wage Distribution in High and Low Wage Business Functions by Industry
Higher Wage Business Functions IT Services R&D
Lower Wage Business Functions Facilities Maintenance Transportation
Other Descriptive Variables The survey collected other data that did not rely on the business function framework: total and part-time United States employment within the organization, separations and new hires, employee benefits, unionization, international revenues. This section summarizes those findings for the full sample. Comprehensive statistics for these variables for the full and GSS samples can be found in Appendix F.
Unionization As Table 12 shows, about 45% of U.S. full-time employees work for organizations that have some of the workforce unionized. Employees at larger organizations are much more likely (59.5%) to have least some share of the workforce unionized than employees at smaller organizations (24.4%). Organizations in the
-10.0%10.0%30.0%50.0%70.0%
Less than$40,000
$40,000 -$60,000
$60,000 -90,000
More than$90,000
Goods-ProducingTrade
Other Services
Public, Health orEducation
0.0%10.0%20.0%30.0%40.0%50.0%60.0%70.0%
Less than$40,000
$40,000 -$60,000
$60,000 -90,000
More than$90,000
0.0%10.0%20.0%30.0%40.0%50.0%60.0%70.0%
Less than$40,000
$40,000 -$60,000
$60,000 -90,000
More than$90,000 -10.0%
10.0%30.0%50.0%70.0%
Less than$40,000
$40,000 -$60,000
$60,000 -90,000
More than$90,000
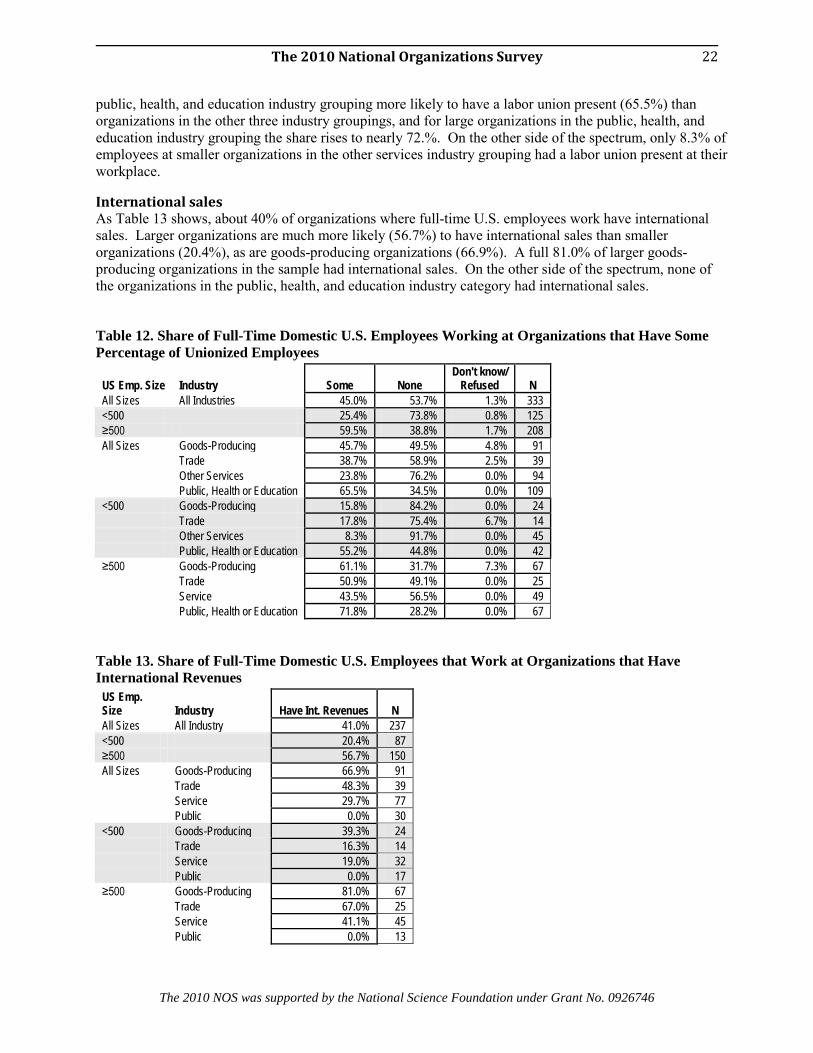
The 2010 National Organizations Survey
The 2010 NOS was supported by the National Science Foundation under Grant No. 0926746
22
public, health, and education industry grouping more likely to have a labor union present (65.5%) than organizations in the other three industry groupings, and for large organizations in the public, health, and education industry grouping the share rises to nearly 72.%. On the other side of the spectrum, only 8.3% of employees at smaller organizations in the other services industry grouping had a labor union present at their workplace.
International sales As Table 13 shows, about 40% of organizations where full-time U.S. employees work have international sales. Larger organizations are much more likely (56.7%) to have international sales than smaller organizations (20.4%), as are goods-producing organizations (66.9%). A full 81.0% of larger goods-producing organizations in the sample had international sales. On the other side of the spectrum, none of the organizations in the public, health, and education industry category had international sales.
Table 12. Share of Full-Time Domestic U.S. Employees Working at Organizations that Have Some Percentage of Unionized Employees
US Emp. Size Industry Some None Don't know/
Refused N All Sizes All Industries 45.0% 53.7% 1.3% 333 <500 25.4% 73.8% 0.8% 125 ≥500 59.5% 38.8% 1.7% 208 All Sizes Goods-Producing 45.7% 49.5% 4.8% 91 Trade 38.7% 58.9% 2.5% 39 Other Services 23.8% 76.2% 0.0% 94 Public, Health or Education 65.5% 34.5% 0.0% 109 <500 Goods-Producing 15.8% 84.2% 0.0% 24 Trade 17.8% 75.4% 6.7% 14 Other Services 8.3% 91.7% 0.0% 45 Public, Health or Education 55.2% 44.8% 0.0% 42 ≥500 Goods-Producing 61.1% 31.7% 7.3% 67 Trade 50.9% 49.1% 0.0% 25 Service 43.5% 56.5% 0.0% 49 Public, Health or Education 71.8% 28.2% 0.0% 67
Table 13. Share of Full-Time Domestic U.S. Employees that Work at Organizations that Have International Revenues
US Emp. Size Industry Have Int. Revenues N All Sizes All Industry 41.0% 237 <500 20.4% 87 ≥500 56.7% 150 All Sizes Goods-Producing 66.9% 91 Trade 48.3% 39 Service 29.7% 77 Public 0.0% 30 <500 Goods-Producing 39.3% 24 Trade 16.3% 14 Service 19.0% 32 Public 0.0% 17 ≥500 Goods-Producing 81.0% 67 Trade 67.0% 25 Service 41.1% 45 Public 0.0% 13
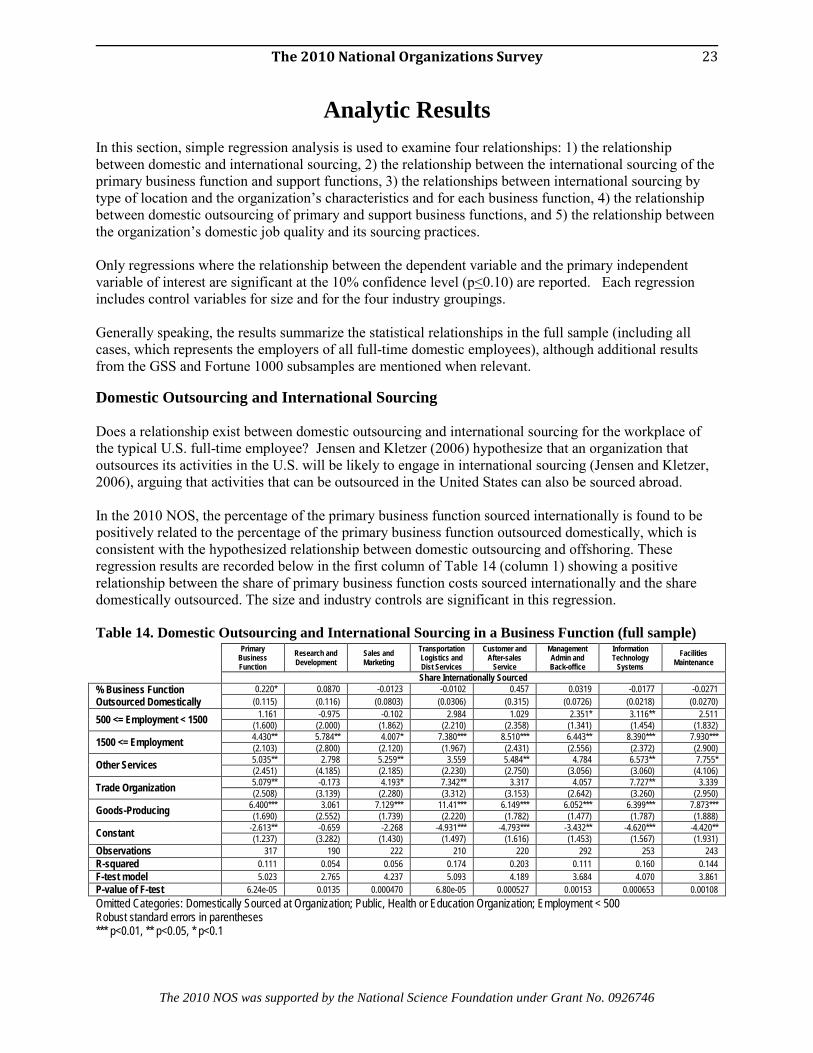
The 2010 National Organizations Survey
The 2010 NOS was supported by the National Science Foundation under Grant No. 0926746
23
Analytic Results In this section, simple regression analysis is used to examine four relationships: 1) the relationship between domestic and international sourcing, 2) the relationship between the international sourcing of the primary business function and support functions, 3) the relationships between international sourcing by type of location and the organization’s characteristics and for each business function, 4) the relationship between domestic outsourcing of primary and support business functions, and 5) the relationship between the organization’s domestic job quality and its sourcing practices. Only regressions where the relationship between the dependent variable and the primary independent variable of interest are significant at the 10% confidence level (p<0.10) are reported. Each regression includes control variables for size and for the four industry groupings. Generally speaking, the results summarize the statistical relationships in the full sample (including all cases, which represents the employers of all full-time domestic employees), although additional results from the GSS and Fortune 1000 subsamples are mentioned when relevant.
Domestic Outsourcing and International Sourcing Does a relationship exist between domestic outsourcing and international sourcing for the workplace of the typical U.S. full-time employee? Jensen and Kletzer (2006) hypothesize that an organization that outsources its activities in the U.S. will be likely to engage in international sourcing (Jensen and Kletzer, 2006), arguing that activities that can be outsourced in the United States can also be sourced abroad. In the 2010 NOS, the percentage of the primary business function sourced internationally is found to be positively related to the percentage of the primary business function outsourced domestically, which is consistent with the hypothesized relationship between domestic outsourcing and offshoring. These regression results are recorded below in the first column of Table 14 (column 1) showing a positive relationship between the share of primary business function costs sourced internationally and the share domestically outsourced. The size and industry controls are significant in this regression.
Table 14. Domestic Outsourcing and International Sourcing in a Business Function (full sample)
Primary Business Function
Research and Development
Sales and Marketing
Transportation Logistics and Dist Services
Customer and After-sales
Service
Management Admin and Back-office
Information Technology
Systems Facilities
Maintenance
Share Internationally Sourced % Business Function Outsourced Domestically
0.220* 0.0870 -0.0123 -0.0102 0.457 0.0319 -0.0177 -0.0271 (0.115) (0.116) (0.0803) (0.0306) (0.315) (0.0726) (0.0218) (0.0270)
500 <= Employment < 1500 1.161 -0.975 -0.102 2.984 1.029 2.351* 3.116** 2.511 (1.600) (2.000) (1.862) (2.210) (2.358) (1.341) (1.454) (1.832)
1500 <= Employment 4.430** 5.784** 4.007* 7.380*** 8.510*** 6.443** 8.390*** 7.930*** (2.103) (2.800) (2.120) (1.967) (2.431) (2.556) (2.372) (2.900)
Other Services 5.035** 2.798 5.259** 3.559 5.484** 4.784 6.573** 7.755* (2.451) (4.185) (2.185) (2.230) (2.750) (3.056) (3.060) (4.106)
Trade Organization 5.079** -0.173 4.193* 7.342** 3.317 4.057 7.727** 3.339 (2.508) (3.139) (2.280) (3.312) (3.153) (2.642) (3.260) (2.950)
Goods-Producing 6.400*** 3.061 7.129*** 11.41*** 6.149*** 6.052*** 6.399*** 7.873*** (1.690) (2.552) (1.739) (2.220) (1.782) (1.477) (1.787) (1.888)
Constant -2.613** -0.659 -2.268 -4.931*** -4.793*** -3.432** -4.620*** -4.420** (1.237) (3.282) (1.430) (1.497) (1.616) (1.453) (1.567) (1.931)
Observations 317 190 222 210 220 292 253 243 R-squared 0.111 0.054 0.056 0.174 0.203 0.111 0.160 0.144 F-test model 5.023 2.765 4.237 5.093 4.189 3.684 4.070 3.861 P-value of F-test 6.24e-05 0.0135 0.000470 6.80e-05 0.000527 0.00153 0.000653 0.00108 Omitted Categories: Domestically Sourced at Organization; Public, Health or Education Organization; Employment < 500 Robust standard errors in parentheses *** p<0.01, ** p<0.05, * p<0.1
The 2010 National Organizations Survey
The 2010 NOS was supported by the National Science Foundation under Grant No. 0926746
24
While the positive relationship between domestic outsourcing and international sourcing of the primary business function is significant and robust across samples, no significant relationship is observed for any support functions in the full sample (Table 13). For the Fortune 1000 sample, two support functions indicate significant relationships between domestic outsourcing and international sourcing: customer service displays a positive relationship between domestic outsourcing and international sourcing, while facilities maintenance displays a negative relationship. These individual relationships may result from characteristics specific to these business functions, or they may reflect underlying dynamics in international sourcing not captured by this simple model. For example, the negative relationship for facilities maintenance may be a sign that an organization has facilities located in the U.S. maintained by an externally contracted service provider and no international facilities. Another organization might contract facilities maintenance services both in the U.S. and abroad. In other words, higher domestic outsourcing costs for facilities maintenance could reflect an organization with few or no international sourcing activities, resulting in a negative association between domestic outsourcing and international sourcing. Externalized customer service activities do not need to be tied to an organization’s own facilities, as facilities maintenance services are, and so domestic outsourcing of this function may indicate, at least among Fortune 1000 organizations, that this function can also be sourced internationally. The statistical weakness of these two particular results suggests that these results should not be interpreted too closely. They illustrate that, unlike the primary business function, support business functions do not show a clear and consistent relationship between domestic outsourcing and international sourcing. In the next set of regressions we ask if the workplace of the typical full-time U.S. employee that sources a primary business function internationally is also likely to source support business functions internationally. The answer is yes, as would be expected when firms are locating operations abroad to service foreign markets. The extent to which the international sourcing of a specific support function mirrors the international sourcing of the primary business function suggests that the support function needs to operate in proximity to the end market. For all seven business functions—R&D, management, customer service, transportation, IT, sales and marketing, facilities maintenance—the percent of the support function internationally sourced (by cost) is significantly positively related to the percent of the primary business function internationally sourced for the full, GSS, and Fortune 1000 samples. These results are recorded in Table 15 for the full data set. While these relationships are uniformly significant, we see that the coefficients in these regressions vary by business function. Because they have diverse characteristics, we can expect the extent to which different support functions need to be co-located with the primary business function to vary. The coefficients on international sourcing of research and development, transportation, and management range from .7 to .8, while sales and marketing and information technology show a smaller positive relationship, with coefficients closer to .5. In effect, these coefficients represent the proportion of support business function costs internationally sourced compared to the share of primary business function costs internationally sourced. These patterns are consistent with the interpretation that organizations are more likely to source a business function internationally if they also source the primary business function abroad.

The 2010 National Organizations Survey
The 2010 NOS was supported by the National Science Foundation under Grant No. 0926746
25
Table 15. International Sourcing of Support Business Functions and the Primary Business Function (full sample)
Research and Development
Sales and Marketing
Transportation Logistics and Dist Services
Customer and After-sales
Service
Management Admin and Back-office
Information Technology
Systems Facilities
Maintenance
Share Internationally Sourced
Share of Primary Business Function Sourced to Similar Location Types
0.739*** 0.430*** 0.797*** 0.647*** 0.690*** 0.544*** 0.709*** (0.0835) (0.115) (0.0661) (0.124) (0.171) (0.123) (0.177)
500 ≤ Employment < 1500 -3.194 -0.158 1.859 1.879** 1.638** 2.739*** 1.653 (2.446) (1.283) (1.192) (0.924) (0.731) (0.998) (1.059)
1500 ≤ Employment 1.009 1.286 2.892* 4.798** 3.118** 5.815*** 4.359** (1.796) (2.034) (1.508) (1.847) (1.243) (1.817) (1.900)
Other Services -1.166 2.273 2.249 2.418 0.972 3.317* 2.901 (2.709) (1.848) (1.964) (1.936) (1.027) (1.914) (2.023)
Trade -4.686* 1.720 2.332 2.218 0.408 4.440* 0.118 (2.489) (2.167) (1.544) (1.891) (1.345) (2.552) (1.324)
Goods-Producing -4.347* 2.800** 3.761** 1.013 0.341 1.219 1.666 (2.269) (1.149) (1.680) (1.362) (1.465) (1.586) (1.901)
Constant 2.734 -0.733 -2.149** -2.854** -1.721** -3.391*** -2.596** (2.702) (1.340) (1.062) (1.149) (0.763) (1.203) (1.237)
Observations 188 220 209 219 290 252 242 R-squared 0.506 0.282 0.550 0.582 0.649 0.454 0.566 F-test model 19.92 11.16 59.03 25.35 16.80 12.35 13.08 P-value of F-test 0 8.02e-11 0 0 0 0 0 Omitted Categories: Domestically Sourced at Organization; Public, Health or Education Organization; Employment < 500 Robust standard errors in parentheses *** p<0.01, ** p<0.05, * p<0.1
International Sourcing by Type of International Location The question of why enterprises internationalize is important. Is it to access new markets or to cut costs for export back home (and/or to global markets)? Because it is likely that multiple business functions would be needed to access new markets in high cost locations, and that offshoring single or narrow sets of business functions to low cost locations would be common practice, we explore this question first by looking at the co-location of the primary business function and support business functions. The NOS breaks down the share of international sourcing to three types of countries, defined by operating costs relative to the U.S. as follows:
• Industrialized countries: costs are similar to costs in the U.S. (such as Canada, Japan, Singapore, the British Isles, Western Europe, and Scandinavia);
• Emerging countries: costs are somewhat less than in the U.S. (such as South Korea, Taiwan, and Eastern Europe); and
• Developing countries: costs are much less than in the U.S. (such as China, Brazil, Russia, India, Southeast Asia, and Mexico).
To simplify the discussion, we sometimes combine emerging and developing countries into one category called “low-cost countries.” In examining the relationships between the types of international locations where primary and support functions are sourced, we must remember that the number of organizations that source internationally is quite low and so sample sizes are very small. Also, the patterns that emerge in the data can only shed light on the locational practices, and not on the causality or timing of these decisions.

The 2010 National Organizations Survey
The 2010 NOS was supported by the National Science Foundation under Grant No. 0926746
26
We examine the international sourcing of business functions from various types of international locations by the characteristics of the organization (industry and size). We find that the location of the primary business function sourcing does not display a significant relationship with size or industry of the organization in any of the samples. The support business functions display a variety of patterns across business functions, with two key patterns regarding size and organization industry that are worth highlighting and that reinforce findings from the descriptive statistics. First, organizations with more than 1500 employees show a positive significant relationship with international sourcing to lower-cost countries in research and development, sales and marketing, and customer service, and a positive significant relationship with international sourcing to industrialized countries in facilities maintenance. For the support functions, we observe that organizations in goods-producing organizations generally have a greater share of international costs sourced to industrialized countries, while larger organizations source more to developing or emerging countries. However, the small sample of organizations that internationally source business functions requires caution in interpreting any of these results by organization characteristic. Does the pattern of international sourcing by type of international location for support functions follow the pattern for the primary business function? As is evident in Table 16, all support business functions sourced to a specific type of international location display a significant positive relationship to the international sourcing of the primary business function to that same type of location in the full sample; only sourcing of IT to developing regions does not have a significant relationship. However the size of this coefficient varies by support business function. The pattern of support function international sourcing to emerging counties follows the primary function international sourcing to emerging countries closely for R&D, management, IT, and facilities maintenance (coefficient above 0.9). R&D also follows the pattern of the primary business international sourcing to developing and industrialized countries (coefficient above 0.7). Facilities maintenance follows the pattern of the primary function international sourcing to industrialized countries, but not to developing countries. Other than the patterns for international sourcing from emerging country locations, the patterns for the other support business functions do not follow the locational patterns of the primary business function (coefficients under 0.6). What is the relationship between the proportion of business function costs internationally sourced and sourcing to various types of international locations? This relationship sheds light on where a specific business function is sourced internationally as the internationally sourced proportion of the function (by cost) increases. Total international sourcing (i.e., to all types of locations) of the primary business function has a positive relationship with international sourcing of the primary business function to developing countries, a negative relationship with sourcing to industrialized countries, and no significant relationship with sourcing to emerging countries (see Table 17). The seven support functions exhibit the same pattern as the primary business function in regard to sourcing from developing and industrialized countries, although the significance varies by sample; R&D, transportation, and sales and marketing appear to be closely tied to the primary business function because they closely track the locational pattern of the primary business function. Although the relationships are not causal and the sample sizes are small, these results suggest that a tie might exist between an organization’s overall level of international sourcing and the sourcing strategies of the organization. Two strategies that are consistent with these observed relationships include international activities being initially set up in industrialized countries and then expanded to developing countries, or specialized activities being set up in industrialized markets to service only those markets and global activities being set up in developing countries to service all markets. In future work, we will explore these questions further.
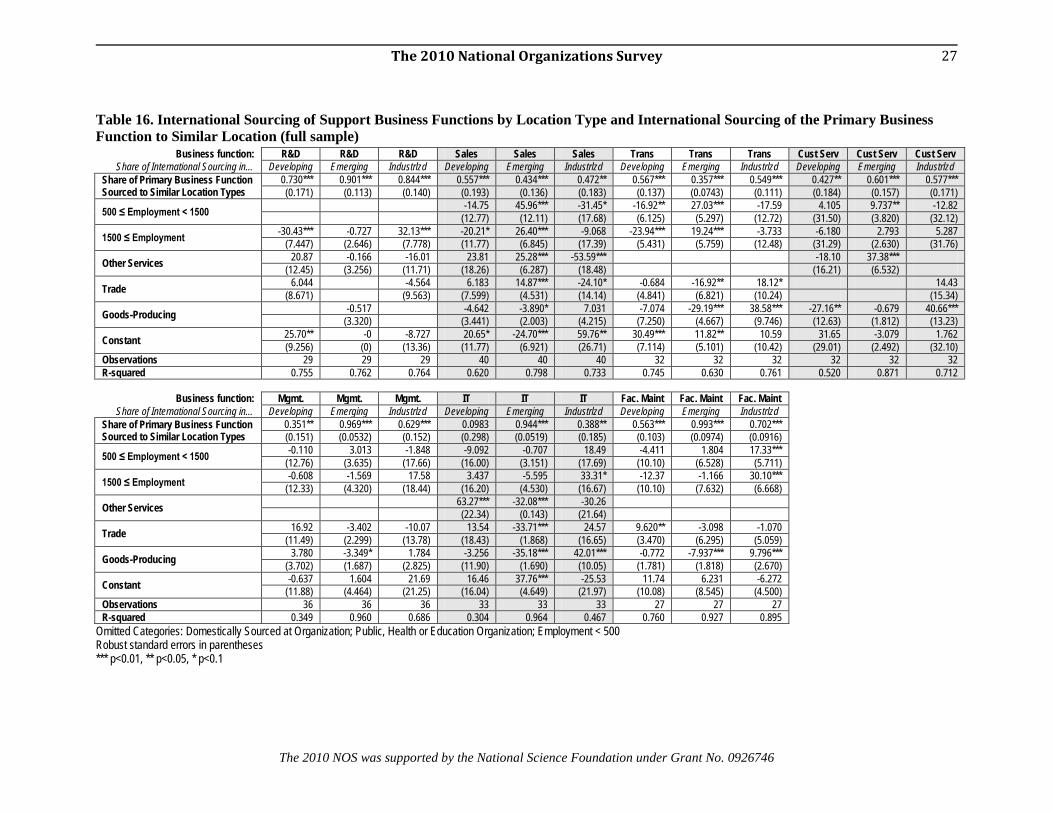
The 2010 National Organizations Survey
The 2010 NOS was supported by the National Science Foundation under Grant No. 0926746
27
Table 16. International Sourcing of Support Business Functions by Location Type and International Sourcing of the Primary Business Function to Similar Location (full sample)
Business function: R&D R&D R&D Sales Sales Sales Trans Trans Trans Cust Serv Cust Serv Cust Serv Share of International Sourcing in… Developing Emerging Industrlzd Developing Emerging Industrlzd Developing Emerging Industrlzd Developing Emerging Industrlzd
Share of Primary Business Function Sourced to Similar Location Types
0.730*** 0.901*** 0.844*** 0.557*** 0.434*** 0.472** 0.567*** 0.357*** 0.549*** 0.427** 0.601*** 0.577*** (0.171) (0.113) (0.140) (0.193) (0.136) (0.183) (0.137) (0.0743) (0.111) (0.184) (0.157) (0.171)
500 ≤ Employment < 1500 -14.75 45.96*** -31.45* -16.92** 27.03*** -17.59 4.105 9.737** -12.82 (12.77) (12.11) (17.68) (6.125) (5.297) (12.72) (31.50) (3.820) (32.12)
1500 ≤ Employment -30.43*** -0.727 32.13*** -20.21* 26.40*** -9.068 -23.94*** 19.24*** -3.733 -6.180 2.793 5.287 (7.447) (2.646) (7.778) (11.77) (6.845) (17.39) (5.431) (5.759) (12.48) (31.29) (2.630) (31.76)
Other Services 20.87 -0.166 -16.01 23.81 25.28*** -53.59*** -18.10 37.38*** (12.45) (3.256) (11.71) (18.26) (6.287) (18.48) (16.21) (6.532)
Trade 6.044 -4.564 6.183 14.87*** -24.10* -0.684 -16.92** 18.12* 14.43 (8.671) (9.563) (7.599) (4.531) (14.14) (4.841) (6.821) (10.24) (15.34)
Goods-Producing -0.517 -4.642 -3.890* 7.031 -7.074 -29.19*** 38.58*** -27.16** -0.679 40.66*** (3.320) (3.441) (2.003) (4.215) (7.250) (4.667) (9.746) (12.63) (1.812) (13.23)
Constant 25.70** -0 -8.727 20.65* -24.70*** 59.76** 30.49*** 11.82** 10.59 31.65 -3.079 1.762 (9.256) (0) (13.36) (11.77) (6.921) (26.71) (7.114) (5.101) (10.42) (29.01) (2.492) (32.10)
Observations 29 29 29 40 40 40 32 32 32 32 32 32 R-squared 0.755 0.762 0.764 0.620 0.798 0.733 0.745 0.630 0.761 0.520 0.871 0.712
Business function: Mgmt. Mgmt. Mgmt. IT IT IT Fac. Maint Fac. Maint Fac. Maint
Share of International Sourcing in… Developing Emerging Industrlzd Developing Emerging Industrlzd Developing Emerging Industrlzd Share of Primary Business Function Sourced to Similar Location Types
0.351** 0.969*** 0.629*** 0.0983 0.944*** 0.388** 0.563*** 0.993*** 0.702*** (0.151) (0.0532) (0.152) (0.298) (0.0519) (0.185) (0.103) (0.0974) (0.0916)
500 ≤ Employment < 1500 -0.110 3.013 -1.848 -9.092 -0.707 18.49 -4.411 1.804 17.33*** (12.76) (3.635) (17.66) (16.00) (3.151) (17.69) (10.10) (6.528) (5.711)
1500 ≤ Employment -0.608 -1.569 17.58 3.437 -5.595 33.31* -12.37 -1.166 30.10*** (12.33) (4.320) (18.44) (16.20) (4.530) (16.67) (10.10) (7.632) (6.668)
Other Services 63.27*** -32.08*** -30.26 (22.34) (0.143) (21.64)
Trade 16.92 -3.402 -10.07 13.54 -33.71*** 24.57 9.620** -3.098 -1.070 (11.49) (2.299) (13.78) (18.43) (1.868) (16.65) (3.470) (6.295) (5.059)
Goods-Producing 3.780 -3.349* 1.784 -3.256 -35.18*** 42.01*** -0.772 -7.937*** 9.796*** (3.702) (1.687) (2.825) (11.90) (1.690) (10.05) (1.781) (1.818) (2.670)
Constant -0.637 1.604 21.69 16.46 37.76*** -25.53 11.74 6.231 -6.272 (11.88) (4.464) (21.25) (16.04) (4.649) (21.97) (10.08) (8.545) (4.500)
Observations 36 36 36 33 33 33 27 27 27 R-squared 0.349 0.960 0.686 0.304 0.964 0.467 0.760 0.927 0.895
Omitted Categories: Domestically Sourced at Organization; Public, Health or Education Organization; Employment < 500 Robust standard errors in parentheses *** p<0.01, ** p<0.05, * p<0.1
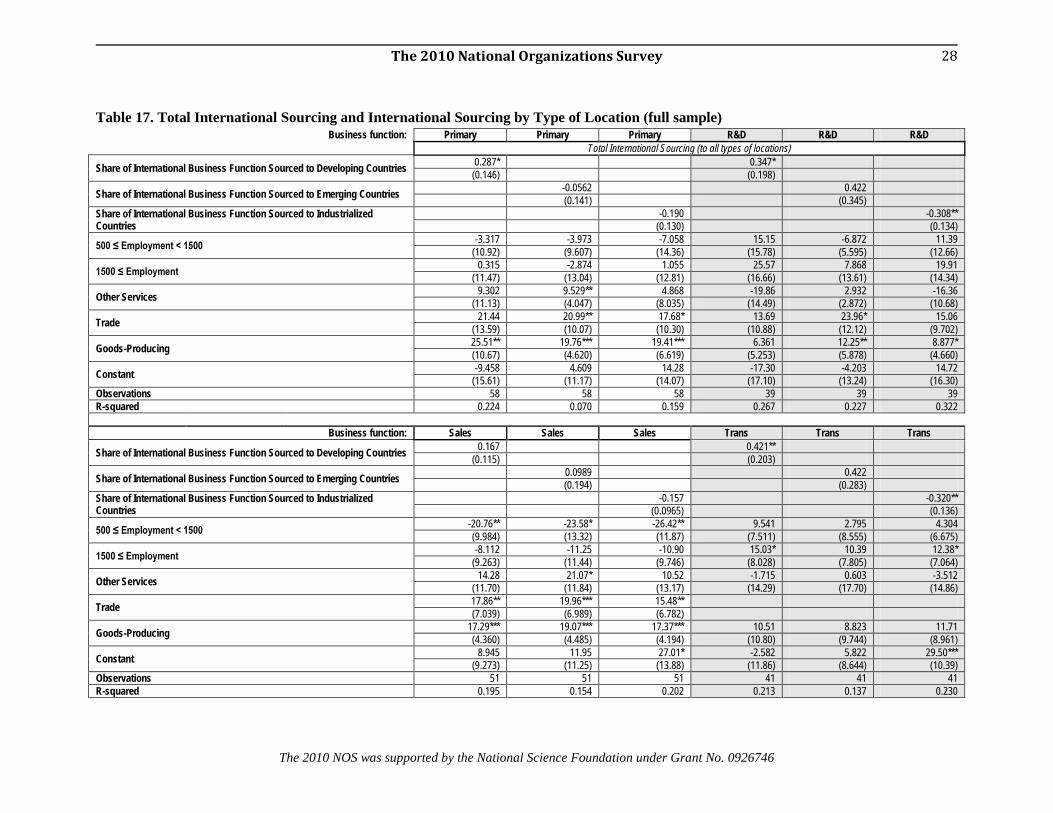
The 2010 National Organizations Survey
The 2010 NOS was supported by the National Science Foundation under Grant No. 0926746
28
Table 17. Total International Sourcing and International Sourcing by Type of Location (full sample)
Business function: Primary Primary Primary R&D R&D R&D Total International Sourcing (to all types of locations)
Share of International Business Function Sourced to Developing Countries 0.287* 0.347* (0.146) (0.198)
Share of International Business Function Sourced to Emerging Countries -0.0562 0.422 (0.141) (0.345)
Share of International Business Function Sourced to Industrialized Countries
-0.190 -0.308** (0.130) (0.134)
500 ≤ Employment < 1500 -3.317 -3.973 -7.058 15.15 -6.872 11.39 (10.92) (9.607) (14.36) (15.78) (5.595) (12.66)
1500 ≤ Employment 0.315 -2.874 1.055 25.57 7.868 19.91 (11.47) (13.04) (12.81) (16.66) (13.61) (14.34)
Other Services 9.302 9.529** 4.868 -19.86 2.932 -16.36 (11.13) (4.047) (8.035) (14.49) (2.872) (10.68)
Trade 21.44 20.99** 17.68* 13.69 23.96* 15.06 (13.59) (10.07) (10.30) (10.88) (12.12) (9.702)
Goods-Producing 25.51** 19.76*** 19.41*** 6.361 12.25** 8.877* (10.67) (4.620) (6.619) (5.253) (5.878) (4.660)
Constant -9.458 4.609 14.28 -17.30 -4.203 14.72 (15.61) (11.17) (14.07) (17.10) (13.24) (16.30)
Observations 58 58 58 39 39 39 R-squared 0.224 0.070 0.159 0.267 0.227 0.322
Business function: Sales Sales Sales Trans Trans Trans
Share of International Business Function Sourced to Developing Countries 0.167 0.421** (0.115) (0.203)
Share of International Business Function Sourced to Emerging Countries 0.0989 0.422 (0.194) (0.283)
Share of International Business Function Sourced to Industrialized Countries
-0.157 -0.320** (0.0965) (0.136)
500 ≤ Employment < 1500 -20.76** -23.58* -26.42** 9.541 2.795 4.304 (9.984) (13.32) (11.87) (7.511) (8.555) (6.675)
1500 ≤ Employment -8.112 -11.25 -10.90 15.03* 10.39 12.38* (9.263) (11.44) (9.746) (8.028) (7.805) (7.064)
Other Services 14.28 21.07* 10.52 -1.715 0.603 -3.512 (11.70) (11.84) (13.17) (14.29) (17.70) (14.86)
Trade 17.86** 19.96*** 15.48** (7.039) (6.989) (6.782)
Goods-Producing 17.29*** 19.07*** 17.37*** 10.51 8.823 11.71 (4.360) (4.485) (4.194) (10.80) (9.744) (8.961)
Constant 8.945 11.95 27.01* -2.582 5.822 29.50*** (9.273) (11.25) (13.88) (11.86) (8.644) (10.39)
Observations 51 51 51 41 41 41 R-squared 0.195 0.154 0.202 0.213 0.137 0.230
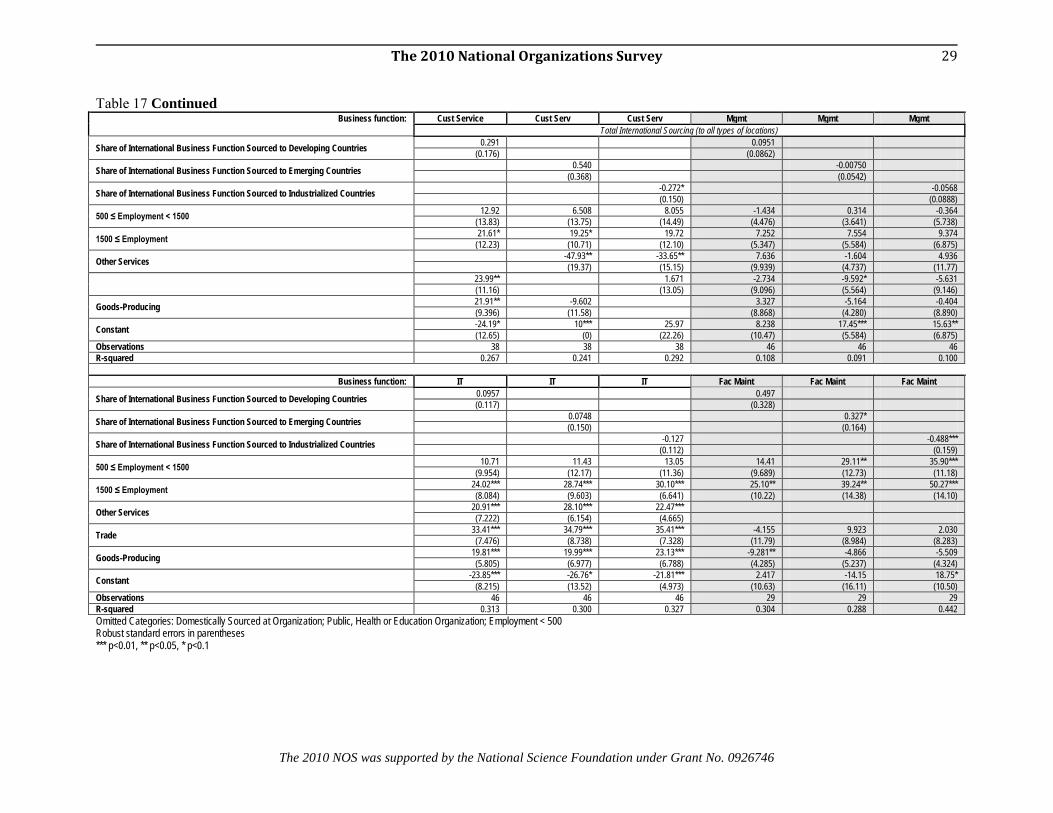
The 2010 National Organizations Survey
The 2010 NOS was supported by the National Science Foundation under Grant No. 0926746
29
Table 17 Continued Business function: Cust Service Cust Serv Cust Serv Mgmt Mgmt Mgmt
Total International Sourcing (to all types of locations)
Share of International Business Function Sourced to Developing Countries 0.291 0.0951 (0.176) (0.0862)
Share of International Business Function Sourced to Emerging Countries 0.540 -0.00750 (0.368) (0.0542)
Share of International Business Function Sourced to Industrialized Countries -0.272* -0.0568 (0.150) (0.0888)
500 ≤ Employment < 1500 12.92 6.508 8.055 -1.434 0.314 -0.364 (13.83) (13.75) (14.49) (4.476) (3.641) (5.738)
1500 ≤ Employment 21.61* 19.25* 19.72 7.252 7.554 9.374 (12.23) (10.71) (12.10) (5.347) (5.584) (6.875)
Other Services -47.93** -33.65** 7.636 -1.604 4.936 (19.37) (15.15) (9.939) (4.737) (11.77)
23.99** 1.671 -2.734 -9.592* -5.631 (11.16) (13.05) (9.096) (5.564) (9.146)
Goods-Producing 21.91** -9.602 3.327 -5.164 -0.404 (9.396) (11.58) (8.868) (4.280) (8.890)
Constant -24.19* 10*** 25.97 8.238 17.45*** 15.63** (12.65) (0) (22.26) (10.47) (5.584) (6.875)
Observations 38 38 38 46 46 46 R-squared 0.267 0.241 0.292 0.108 0.091 0.100
Business function: IT IT IT Fac Maint Fac Maint Fac Maint
Share of International Business Function Sourced to Developing Countries 0.0957 0.497 (0.117) (0.328)
Share of International Business Function Sourced to Emerging Countries 0.0748 0.327* (0.150) (0.164)
Share of International Business Function Sourced to Industrialized Countries -0.127 -0.488*** (0.112) (0.159)
500 ≤ Employment < 1500 10.71 11.43 13.05 14.41 29.11** 35.90*** (9.954) (12.17) (11.36) (9.689) (12.73) (11.18)
1500 ≤ Employment 24.02*** 28.74*** 30.10*** 25.10** 39.24** 50.27*** (8.084) (9.603) (6.641) (10.22) (14.38) (14.10)
Other Services 20.91*** 28.10*** 22.47*** (7.222) (6.154) (4.665)
Trade 33.41*** 34.79*** 35.41*** -4.155 9.923 2.030 (7.476) (8.738) (7.328) (11.79) (8.984) (8.283)
Goods-Producing 19.81*** 19.99*** 23.13*** -9.281** -4.866 -5.509 (5.805) (6.977) (6.788) (4.285) (5.237) (4.324)
Constant -23.85*** -26.76* -21.81*** 2.417 -14.15 18.75* (8.215) (13.52) (4.973) (10.63) (16.11) (10.50)
Observations 46 46 46 29 29 29 R-squared 0.313 0.300 0.327 0.304 0.288 0.442 Omitted Categories: Domestically Sourced at Organization; Public, Health or Education Organization; Employment < 500 Robust standard errors in parentheses *** p<0.01, ** p<0.05, * p<0.1

The 2010 National Organizations Survey
30
At this point, we can summarize our descriptive regressions as showing: • Organizations that domestically outsource the primary business function are more likely to
internationally source the primary business function; this relationship is not observed for the support business functions.
• In general, support business functions follow the primary business function abroad, although the pattern varies across support functions. In addition, the support functions track the pattern of the primary business function abroad by type of location.
• International sourcing of business functions tends to increase with international sourcing to developing locations and decrease with international sourcing to industrialized locations (significance varies by business function and sample).
Domestic Outsourcing of Primary and Support Business Functions The finding that international sourcing and domestic outsourcing of the primary business function have a positive relationship, and this relationship is not observed for other business functions, has already been discussed. Now we ask: in the organization of the typical worker, are domestic outsourcing of support business functions and the primary business function related? For the full sample, the answer is no. Only domestic outsourcing of sales and marketing shows a weak positive significant relationship with domestic outsourcing of the primary business function (see Table 18).
Table 18. Domestic Outsourcing of Support Business Functions and Domestic Outsourcing of Primary Business Function (full sample)
Research and Development
Sales and Marketing
Transportation Logistics and Dist Services
Customer and After-sales
Service
Management Admin and Back-office
Information Technology
Systems Facilities
Maintenance
Share Domestically Outsourced % Business Function Outsourced Domestically
0.109 0.259* 0.487 0.140 0.104 0.430 -0.133 (0.111) (0.143) (0.315) (0.0957) (0.0650) (0.305) (0.131)
500 ≤ Employment < 1500 -2.904 0.0403 3.136 2.302 0.233 -4.729 -9.273* (2.076) (3.578) (8.136) (3.435) (1.436) (6.217) (5.444)
1500 ≤ Employment 0.928 0.524 0.609 -0.181 1.245 -8.086* -8.629* (1.950) (1.676) (7.608) (1.802) (0.936) (4.417) (4.807)
Other Services -1.486 1.517 15.57 1.948 -0.695 10.91** 21.35*** (2.695) (1.345) (13.17) (1.216) (1.325) (4.901) (6.215)
Trade 0.238 5.989** -1.410 4.994 -0.695 0.0462 -0.460 (3.455) (2.809) (4.200) (3.137) (1.544) (3.375) (3.721)
Goods-Producing -0.653 2.812 6.375 1.116 -0.341 7.366 1.188 (2.343) (2.149) (5.330) (1.492) (1.423) (5.487) (3.447)
Constant 3.431 0.609 5.178 -0.229 1.183 11.11*** 14.26*** (3.419) (1.466) (6.666) (1.321) (1.413) (4.185) (4.588)
Observations 188 220 209 219 290 252 242 R-squared 0.021 0.075 0.075 0.064 0.023 0.071 0.172 F-test model 3.744 1.635 1.811 1.283 1.195 2.121 3.154 P-value of F-test 0.00155 0.139 0.0985 0.266 0.309 0.0515 0.00540 Omitted Categories: Domestically Sourced at Organization; Public, Health or Education Organization; Employment < 500 Robust standard errors in parentheses *** p<0.01, ** p<0.05, * p<0.1 However, for the Fortune 1000 sample, we find a significant positive relationship between domestic outsourcing of the primary business function and four support business functions (sales and marketing, customer service, management, and information technology) and a significant negative relationship with facilities maintenance. The positive relationship may reflect the economies of scale for outsourcing by Fortune 1000 organizations. Overall these results may reflect the fact that many organizations in the sample engage in outsourcing, and only the large Fortune 1000 organizations display a significant pattern.

The 2010 National Organizations Survey
31
Domestic Outsourcing, International Sourcing and Job Quality The previous section examined relationships between sourcing practices. Next, we examine the ties between sourcing practices and the distribution of an organization’s domestic jobs across business functions, as well as the quality of domestic jobs as measured by salaries and benefits.
Share of domestic jobs and international sourcing We next analyze how both the distribution of employment and earnings of domestic jobs across business functions are related to sourcing activities. In order to capture the conjoint effects of domestic outsourcing and international sourcing, we regress the share of employment in a business function in both domestic outsourcing and international sourcing along with the control variables for industry sector and organization size (see Table 18). We then analyze how the distribution of earnings by business function is related to sourcing practices. The data on earnings by business function has four categories:
• Less than $40,000 (referred to as “low wage”) • $40,000 to $60,000 • $60,000 to $90,000 • More than $90,000 (referred to as “high wage”)
These four categories for annual worker earnings add up to 100% in each business function for each organization that provided wage data. We regress the proportion of low-wage jobs and of high-wage jobs on the proportion (by cost) of domestic outsourcing and international sourcing for each business function (see Table 19). The share of employment in the primary business function for the organization of the typical employee is negatively related to international sourcing of the primary business function (all samples), but the distribution of earnings, i.e., shares of low-wage or high-wage employment in the primary business function, is not significantly related to the international sourcing of the primary business function (see Table 19, Table 20). This pattern is consistent with at least two outcomes: international sourcing of the primary business function substitutes for domestic jobs in the primary business function; or the international activity develops new markets requiring expansion of domestic employment in support business functions more than in the primary business function. In either case, domestic high-wage and low-wage jobs in the primary business function expand or contract at similar rates. The relationship between international sourcing of business functions and domestic jobs display several distinct patterns:
• The share of domestic employment in three support functions—customer service, IT, and sales and marketing—is positively related to international sourcing in the given business function (significance varies by sample). No significant negative relationship is observed.
• The share of low-wage jobs in two support functions (customer service, facilities maintenance) varies negatively, and share of low-wage jobs in one support function (R&D) varies positively with share of international sourcing of given business function (significance varies by sample).
• The share of high-wage jobs in four support functions (customer service, facilities maintenance, management and administration, and transportation) varies positively with share of international sourcing of given business function (significance varies by sample). No significant negative relationship is observed.

The 2010 National Organizations Survey
32
Table 19. Sourcing and Share of Employment in a Business Function (full sample)
Primary
Business Function
Research and
Development Sales and Marketing
Transportation Logistics and Dist Services
Customer and After-
sales Service
Management Admin and Back-office
Information Technology
Systems Facilities
Maintenance
Internationally Sourced -0.276*** -0.0204 0.0566 -0.0398 0.257*** 0.0105 0.0525* -0.0108 (0.103) (0.0282) (0.0389) (0.0567) (0.0939) (0.0260) (0.0280) (0.0182)
Domestically Outsourced -0.0433 -0.0591*** -0.0385 0.00674 0.0661 0.199*** -0.0145** -0.0229** (0.109) (0.0222) (0.0370) (0.0200) (0.133) (0.0633) (0.00732) (0.0102)
500 ≤ Employment < 1500 0.598 -2.246 -0.328 -4.992** -0.630 -0.900 0.317 -0.947 (3.966) (1.522) (2.101) (2.181) (1.743) (1.629) (0.865) (0.916)
1500 ≤ Employment -4.436 0.522 -1.660 -2.685 -2.104 -4.053*** 1.973** 1.118 (3.450) (1.581) (1.168) (2.231) (1.285) (1.281) (0.780) (0.680)
Other Services -6.248 -0.397 3.576*** -2.383 2.831 -1.142 0.0357 -2.868*** (3.920) (1.483) (1.173) (1.645) (1.725) (1.638) (0.996) (0.881)
Trade Organization -12.42** -1.918 3.924*** 4.974 2.804 -3.695** -1.202 -4.459*** (5.423) (2.299) (1.433) (3.022) (1.963) (1.529) (0.883) (0.890)
Goods-Producing -10.86*** 0.786 4.701*** 1.215 -1.555 -1.604 -1.181 -1.882** (3.740) (1.324) (1.212) (2.245) (1.168) (1.419) (0.749) (0.865)
Constant 76.75*** 5.192*** 3.804*** 8.005*** 5.549*** 12.95*** 2.838*** 5.923*** (3.424) (1.633) (0.984) (2.004) (1.223) (1.455) (0.965) (0.847)
Observations 313 186 219 206 217 288 250 240 R-squared 0.104 0.032 0.087 0.087 0.208 0.107 0.113 0.169 F-test model 5.292 2.208 5.726 1.694 2.455 4.316 4.285 5.651 P-value of F-test 1.01e-05 0.0357 4.44e-06 0.112 0.0194 0.000148 0.000174 4.88e-06 Omitted Categories: Domestically Sourced at Organization; Public, Health or Education Organization; Employment < 500 Robust standard errors in parentheses *** p<0.01, ** p<0.05, * p<0.1 These results indicate that international sourcing of support functions tends to complement domestic jobs, with a higher domestic wage distribution for five support functions. This pattern is consistent with international sourcing of support functions complementing domestic activities, and particularly complementing high-wage jobs. An alternative explanation is also possible—international sourcing replaces domestic employment in a variety of business functions, and domestic high-wage jobs in a given function shrink less than low-wage jobs. However a different pattern is observed in one support function, R&D, where international sourcing is associated with a lower domestic wage distribution for R&D, while any changes in domestic employment are shared across functions (i.e., if employment grows across functions, then R&D has increase in low-wage jobs). Domestic outsourcing displays a different empirical pattern with domestic internal jobs than we observed for international sourcing. Domestic outsourcing of the primary business function is not significantly related to its share of employment or to the distribution of wages in the primary business function (all samples). The proportion of domestic jobs in three support business functions (research and development, IT, and facilities maintenance) is negatively related to domestic outsourcing. The pattern observed in these three business functions is consistent with at least two interpretations: domestic outsourcing may be substituting for employment in these business functions; or domestic outsourcing is increasing the share of employment in other business functions such that the relative share of employment in these business functions shrinks. Domestic outsourcing of R&D is related to an increase in the share of low-wage employment in R&D as well as to a decline in share of employment, which is consistent with domestic outsourcing of R&D replacing high-wage jobs in R&D. In contrast, domestic outsourcing of management and administration is positively related to the proportion of domestic jobs in management and administration, and an increase in the share of low-wage employment. This is consistent with domestic outsourcing of management and administration complementing low-wage employment in this set of functions.

The 2010 National Organizations Survey
33
Table 20. Sourcing and Share of Low-Wage Employment and High-Wage Employment in a Business Function (full sample)
Low-wage Employment
Primary
Business Function
Research and
Development Sales and Marketing
Transportation Logistics and Dist Services
Customer and After-
sales Service
Management Admin and Back-office
Information Technology
Systems Facilities
Maintenance
Domestically Outsourced 0.0162 0.702* 0.0664 0.0630 0.801 0.264* 0.0396 0.0441 (0.242) (0.395) (0.204) (0.188) (0.572) (0.145) (0.136) (0.219)
Internationally Sourced -0.255 0.0670 -0.0814 -0.317 -0.561** -0.0145 -0.137 -0.466*** (0.195) (0.0793) (0.117) (0.221) (0.275) (0.104) (0.0870) (0.116)
500 ≤ Employment < 1500 -22.88*** 2.015 -9.546 -11.40 -4.469 -11.21* -3.943 -14.97 (7.532) (8.927) (6.457) (15.67) (12.27) (6.002) (5.859) (11.94)
1500 ≤ Employment -17.97** -8.319** -9.936* -14.20* -5.475 -18.45*** -0.366 -11.79 (7.098) (3.961) (5.177) (8.233) (7.829) (4.794) (5.771) (7.469)
Other Services 1.464 -28.18*** -19.11** -22.39* -17.28 -2.933 -3.741 -10.02 (8.122) (8.756) (8.302) (11.86) (10.62) (6.364) (5.709) (9.286)
Trade Organization -1.794 -18.56* -12.74 -45.33*** 1.451 -8.442 -0.00367 -41.56*** (9.252) (9.995) (11.20) (10.01) (11.01) (6.567) (8.437) (10.56)
Goods-Producing 1.319 -24.56*** -23.93*** -36.40*** -26.12*** -14.18*** -8.503* -25.09*** (6.872) (8.495) (8.304) (10.65) (9.057) (5.086) (4.868) (9.085)
Constant 49.71*** 32.46*** 36.24*** 76.24*** 58.68*** 36.52*** 16.18*** 67.36*** (5.500) (9.605) (8.100) (8.917) (8.556) (5.363) (6.022) (7.659)
Observations 237 113 154 127 142 208 161 143 R-squared 0.087 0.314 0.120 0.252 0.158 0.147 0.037 0.217 F-test model 2.615 2.396 2.795 7.993 3.427 5.188 1.536 9.997 P-value of F-test 0.0129 0.0258 0.00930 6.14e-08 0.00211 1.89e-05 0.159 5.02e-10
High-wage Employment Domestically Outsourced -0.0756 -0.293 -0.178 0.00699 0.152 -0.00949 0.0935 -0.0186
(0.0828) (0.349) (0.303) (0.0224) (0.205) (0.106) (0.175) (0.0258)
Internationally Sourced 0.107 -0.00151 0.0578 0.432** 0.433** 0.200* 0.179 0.209** (0.112) (0.243) (0.163) (0.214) (0.190) (0.102) (0.161) (0.0878)
500 ≤ Employment < 1500 2.367 -20.14** -5.068 1.025 -5.263 7.443 -7.315 0.543 (2.149) (10.04) (10.41) (2.029) (3.828) (4.775) (6.038) (1.029)
1500 ≤ Employment 8.763*** 5.736 12.01* 4.655** 3.692 11.10*** 7.247 4.238*** (2.707) (8.976) (6.669) (2.288) (4.693) (4.207) (6.565) (1.451)
Other Services 4.122 -2.291 26.38*** 3.631 3.654 8.288** 11.82* 1.927 (3.090) (11.01) (5.708) (2.661) (4.176) (3.627) (6.663) (1.530)
Trade 6.315* 0.523 18.12** 9.426** 2.781 7.589* 11.24* 3.375 (3.775) (11.00) (7.767) (3.900) (3.788) (4.437) (6.193) (3.813)
Goods-Producing 0.313 2.909 34.59*** -0.659 3.609 15.45*** 12.98** -1.484 (2.515) (10.06) (7.739) (2.141) (3.791) (5.457) (5.735) (1.480)
Constant 2.884* 27.26** -0.105 -2.275 1.922 4.700 5.569 0.299 (1.549) (10.55) (5.366) (1.658) (2.910) (2.856) (5.641) (1.138)
Observations 237 113 154 127 142 208 161 143 R-squared 0.095 0.062 0.155 0.331 0.200 0.146 0.131 0.254 F-test model 3.183 2.174 8.451 2.229 3.981 6.486 5.164 3.522 P-value of F-test 0.00310 0.0423 1.16e-08 0.0364 0.000551 6.74e-07 2.68e-05 0.00167 Omitted Categories: Domestically Sourced at Organization; Public, Health or Education Organization; Employment < 500 Robust standard errors in parentheses *** p<0.01, ** p<0.05, * p<0.1
International sourcing by type of international location and domestic earnings Next, we examine the relationship between the type of international sourcing locations used and the distribution of an organization’s domestic wages in a given business function. Specifically, we focus on the relationship between international sourcing to lower cost countries (either developing, emerging, or both) and the earnings distribution of business functions. We ask, do organizations that source business functions from countries with "lower costs" have higher proportion of "low wage" jobs or of "high wage" jobs in the United States?
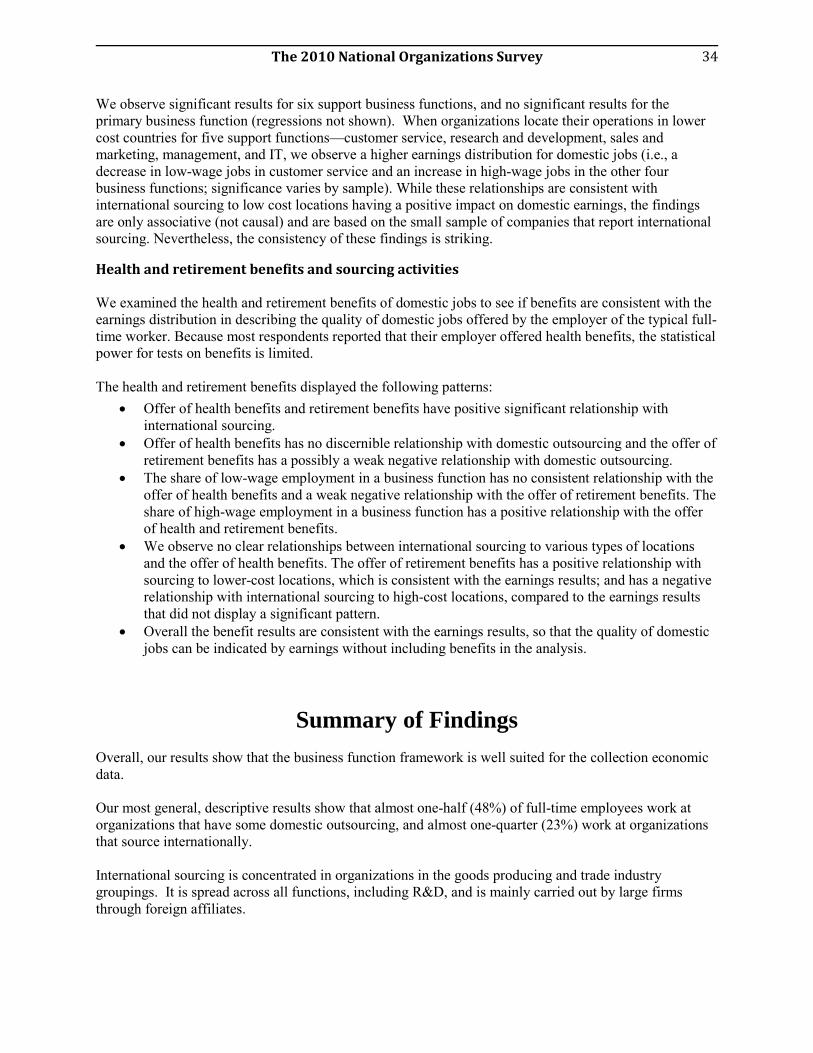
The 2010 National Organizations Survey
34
We observe significant results for six support business functions, and no significant results for the primary business function (regressions not shown). When organizations locate their operations in lower cost countries for five support functions—customer service, research and development, sales and marketing, management, and IT, we observe a higher earnings distribution for domestic jobs (i.e., a decrease in low-wage jobs in customer service and an increase in high-wage jobs in the other four business functions; significance varies by sample). While these relationships are consistent with international sourcing to low cost locations having a positive impact on domestic earnings, the findings are only associative (not causal) and are based on the small sample of companies that report international sourcing. Nevertheless, the consistency of these findings is striking.
Health and retirement benefits and sourcing activities We examined the health and retirement benefits of domestic jobs to see if benefits are consistent with the earnings distribution in describing the quality of domestic jobs offered by the employer of the typical full-time worker. Because most respondents reported that their employer offered health benefits, the statistical power for tests on benefits is limited.
The health and retirement benefits displayed the following patterns:
• Offer of health benefits and retirement benefits have positive significant relationship with international sourcing.
• Offer of health benefits has no discernible relationship with domestic outsourcing and the offer of retirement benefits has a possibly a weak negative relationship with domestic outsourcing.
• The share of low-wage employment in a business function has no consistent relationship with the offer of health benefits and a weak negative relationship with the offer of retirement benefits. The share of high-wage employment in a business function has a positive relationship with the offer of health and retirement benefits.
• We observe no clear relationships between international sourcing to various types of locations and the offer of health benefits. The offer of retirement benefits has a positive relationship with sourcing to lower-cost locations, which is consistent with the earnings results; and has a negative relationship with international sourcing to high-cost locations, compared to the earnings results that did not display a significant pattern.
• Overall the benefit results are consistent with the earnings results, so that the quality of domestic jobs can be indicated by earnings without including benefits in the analysis.
Summary of Findings Overall, our results show that the business function framework is well suited for the collection economic data. Our most general, descriptive results show that almost one-half (48%) of full-time employees work at organizations that have some domestic outsourcing, and almost one-quarter (23%) work at organizations that source internationally. International sourcing is concentrated in organizations in the goods producing and trade industry groupings. It is spread across all functions, including R&D, and is mainly carried out by large firms through foreign affiliates.

The 2010 National Organizations Survey
35
Most international sourcing is to high cost locations, and secondarily to very low cost locations. Non-goods-producing organizations are more likely to source from low cost locations. Domestic outsourcing is concentrated in transport, IT services, and facilities maintenance business functions, and no consistent relationships between domestic outsourcing and employment or wages were found. Our simple linear regressions show us the significance of the relationship between selected variables, with controls for industry and size. These associations are only suggestive of the underlying forces, and do not imply causality or trends over time. Domestic outsourcing and international sourcing of the primary business function have a significant positive relationship, which is consistent with the hypothesis that activities that are outsourced domestically in the U.S. are candidates for being sourced abroad. However this relationship is not significant for support business functions. International sourcing of all seven support business functions have a significant positive relationship with international sourcing of the primary business. In other words, when organizations perform their primary business function abroad, they also tend to perform support functions abroad. The relationships between international sourcing by type of international location (industrialized, emerging, developing) for the primary and support functions is positive and significant, except sourcing of IT systems to developing countries, which is not significant. The pattern between support functions and the primary business function is the strongest for sourcing to emerging countries. R&D follows the patterns of international sourcing of the primary business function for all three international location types (coefficients above 0.7). Sales & marketing and transportation, logistics, & distribution follow the pattern of international sourcing of the primary business function more weakly (coefficients under 0.6). For support functions, goods-producing organizations generally incur a greater share of international sourcing costs from industrialized countries, while larger organizations (>1500 employees) source more from developing or emerging countries. Domestic outsourcing of support business functions are not significantly related to domestic outsourcing of the primary business function, except for Fortune 1000 firms. The relationships between an organization’s domestic job quality and the international sourcing of business functions display several distinct patterns:
• The share of domestic employment in three support functions—customer service, IT, and sales and marketing—is positively related to international sourcing in the given business function. No significant negative relationship is observed.
• The share of low-wage jobs in two support functions (customer service and facilities maintenance) varies negatively, and the share of low-wage jobs in one support function (R&D) varies positively with share of international sourcing of given business function.
• The share of high-wage jobs in four support functions (customer service, facilities maintenance, management and administration, and transportation) varies positively with share of international sourcing of a given business function. No significant negative relationship is observed.
The relationships between an organization’s domestic job quality and the domestic outsourcing of business functions display these patterns:

The 2010 National Organizations Survey
36
• Domestic outsourcing of the primary business function is not significantly related to its share of employment or to the distribution of wages in the primary business function.
• The proportion of domestic jobs in three support business functions (research and development, IT, and facilities maintenance) is negatively related to domestic outsourcing.
• Domestic outsourcing of R&D is related to an increase in the share of low-wage employment in R&D, as well as to a decline in share of employment, which is consistent with domestic outsourcing of R&D replacing high-wage jobs in R&D.
• Domestic outsourcing of management and administration is positively related to the proportion of domestic jobs in management and administration, and an increase in the share of low-wage employment. This is consistent with domestic outsourcing of management and administration complementing low-wage employment.
Overall the benefit results are consistent with the earnings results, so that the quality of domestic jobs can be indicated by earnings without including benefits in the analysis.

The 2010 National Organizations Survey
37
Appendix A: The 2010 NOS Public Use Dataset
A public use data set and supporting materials for the 2010 NOS have been uploaded to the Inter-university Consortium for Political and Social Research (ICPSR) website located at the University of Michigan (www.icpsr.umich.edu) with the title: 2010 National Organizations Survey: Examining the Relationships Between Job Quality and the Domestic and International Sourcing of Business Functions by United States Organizations. The data set includes all data corrections and weights. The public use data set has been uploaded in three formats:
• DTA, for use with Stata • Excel, for use with Microsoft Office • CSV, for use with SAS and other software programs
Uploaded supporting material includes:
• A codebook describing the study, data set and variables • An Excel workbook with tables containing summary descriptive statistics • Screen shots of the actual web survey in PDF format
A few variables collected from the survey have been omitted from the public dataset to protect the confidentiality of respondents and reduce the potential for reidentification of organizations. These omitted variables include both organization data, and information about the sampling source of each organization. For organization data, omitted variables include:
1) NAICS Codes: NAICS codes describing the specific primary business function of each organization.
2) Industry Classifications (Detailed): A categorical set of industry classifications more detailed than what is used in the public dataset. This set of industry classifications classifies organizations as being in education, financial activities, manufacturing, other goods-producing, health, information, other-services, professional and business services, retail, trade, transportation public administration, public education, public health, public services and public transportation as presented in Table 21.
3) Unionization Rates: A categorical variable describing the share of employees unionized at an organization.
4) Total Revenues: A continuous variable describing the organization’s total revenues for 2010. 5) Domestic U.S. Employment: A continuous variable describing the organization’s domestic U.S.
employment.
The dual sample frame of the survey required that the GSS sample and Fortune 1000 oversample have weights constructed for the two samples separately before they were merged. To protect the confidentiality of respondents and reduce the potential for reidentification of organizations, both the categorical variables identifying the sample source of organizations and the appropriate weights for their samples were omitted from the public data set. The only weight reported in the public dataset is the full sample weight for the combined sample. While the full data set is available upon request, any release of omitted data will require the requester to arrange for a secure enclave and provide other safeguards. For more information about the full data, please e-mail [email protected] or [email protected].
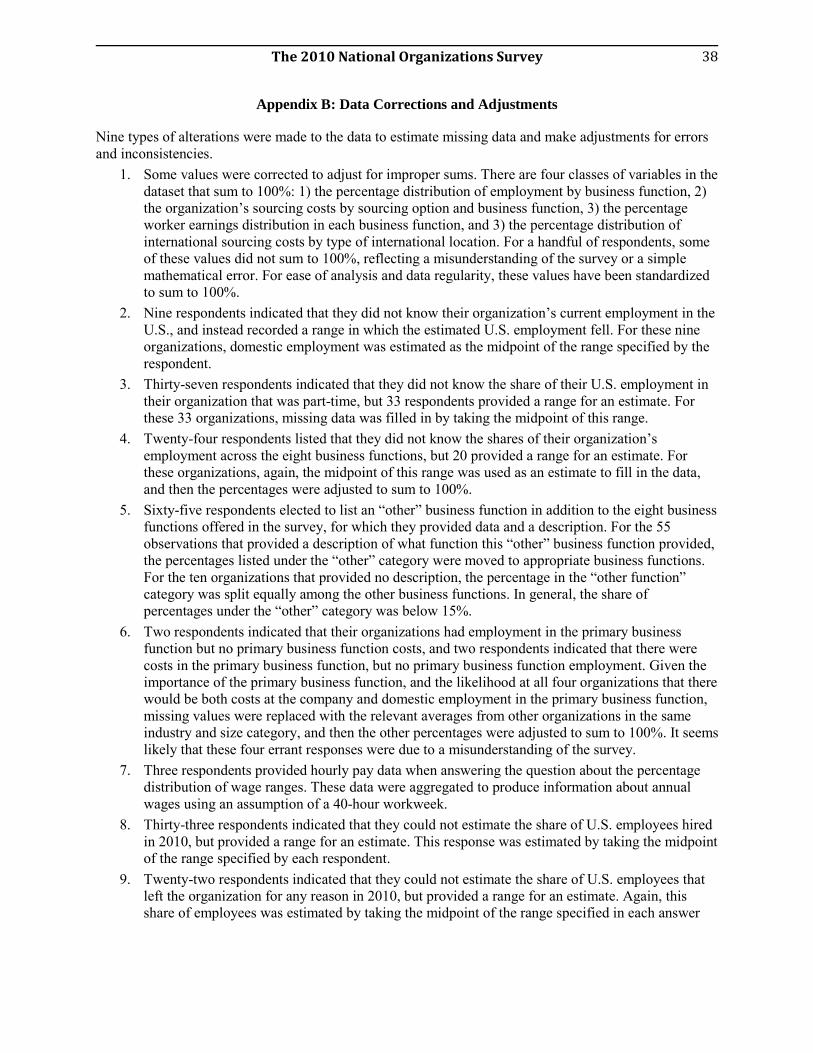
The 2010 National Organizations Survey
38
Appendix B: Data Corrections and Adjustments
Nine types of alterations were made to the data to estimate missing data and make adjustments for errors and inconsistencies.
1. Some values were corrected to adjust for improper sums. There are four classes of variables in the dataset that sum to 100%: 1) the percentage distribution of employment by business function, 2) the organization’s sourcing costs by sourcing option and business function, 3) the percentage worker earnings distribution in each business function, and 3) the percentage distribution of international sourcing costs by type of international location. For a handful of respondents, some of these values did not sum to 100%, reflecting a misunderstanding of the survey or a simple mathematical error. For ease of analysis and data regularity, these values have been standardized to sum to 100%.
2. Nine respondents indicated that they did not know their organization’s current employment in the U.S., and instead recorded a range in which the estimated U.S. employment fell. For these nine organizations, domestic employment was estimated as the midpoint of the range specified by the respondent.
3. Thirty-seven respondents indicated that they did not know the share of their U.S. employment in their organization that was part-time, but 33 respondents provided a range for an estimate. For these 33 organizations, missing data was filled in by taking the midpoint of this range.
4. Twenty-four respondents listed that they did not know the shares of their organization’s employment across the eight business functions, but 20 provided a range for an estimate. For these organizations, again, the midpoint of this range was used as an estimate to fill in the data, and then the percentages were adjusted to sum to 100%.
5. Sixty-five respondents elected to list an “other” business function in addition to the eight business functions offered in the survey, for which they provided data and a description. For the 55 observations that provided a description of what function this “other” business function provided, the percentages listed under the “other” category were moved to appropriate business functions. For the ten organizations that provided no description, the percentage in the “other function” category was split equally among the other business functions. In general, the share of percentages under the “other” category was below 15%.
6. Two respondents indicated that their organizations had employment in the primary business function but no primary business function costs, and two respondents indicated that there were costs in the primary business function, but no primary business function employment. Given the importance of the primary business function, and the likelihood at all four organizations that there would be both costs at the company and domestic employment in the primary business function, missing values were replaced with the relevant averages from other organizations in the same industry and size category, and then the other percentages were adjusted to sum to 100%. It seems likely that these four errant responses were due to a misunderstanding of the survey.
7. Three respondents provided hourly pay data when answering the question about the percentage distribution of wage ranges. These data were aggregated to produce information about annual wages using an assumption of a 40-hour workweek.
8. Thirty-three respondents indicated that they could not estimate the share of U.S. employees hired in 2010, but provided a range for an estimate. This response was estimated by taking the midpoint of the range specified by each respondent.
9. Twenty-two respondents indicated that they could not estimate the share of U.S. employees that left the organization for any reason in 2010, but provided a range for an estimate. Again, this share of employees was estimated by taking the midpoint of the range specified in each answer
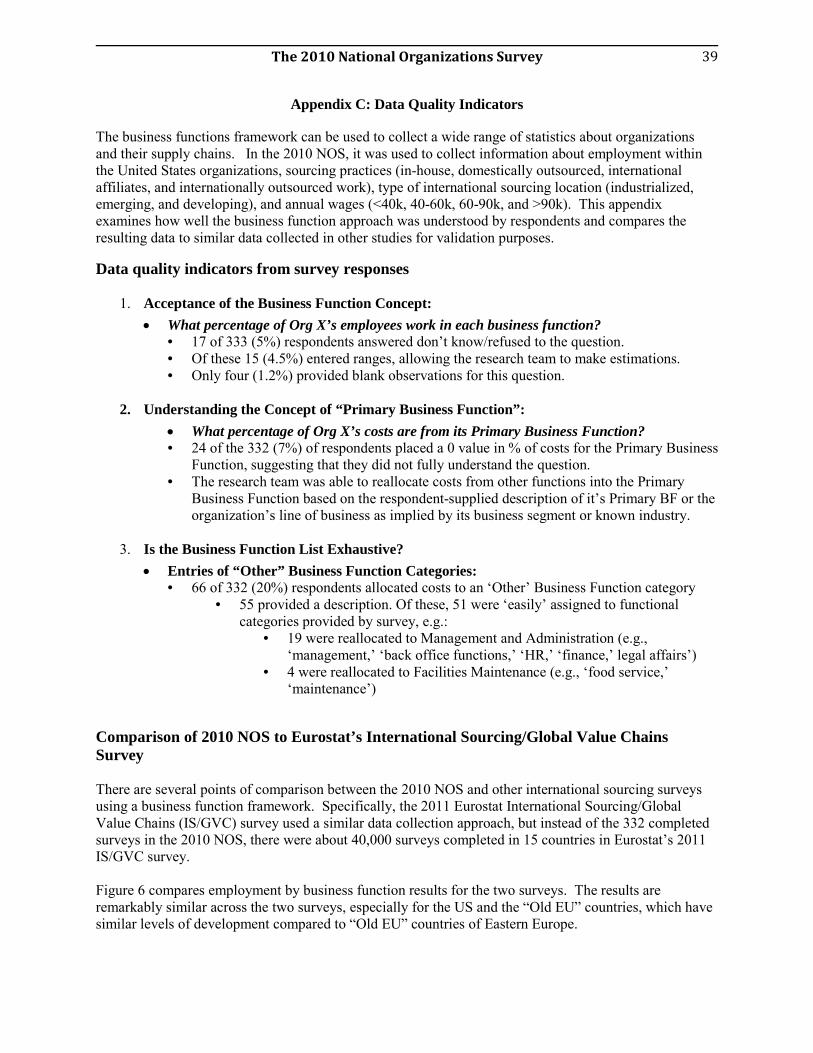
The 2010 National Organizations Survey
39
Appendix C: Data Quality Indicators
The business functions framework can be used to collect a wide range of statistics about organizations and their supply chains. In the 2010 NOS, it was used to collect information about employment within the United States organizations, sourcing practices (in-house, domestically outsourced, international affiliates, and internationally outsourced work), type of international sourcing location (industrialized, emerging, and developing), and annual wages (<40k, 40-60k, 60-90k, and >90k). This appendix examines how well the business function approach was understood by respondents and compares the resulting data to similar data collected in other studies for validation purposes.
Data quality indicators from survey responses
1. Acceptance of the Business Function Concept: • What percentage of Org X’s employees work in each business function?
• 17 of 333 (5%) respondents answered don’t know/refused to the question. • Of these 15 (4.5%) entered ranges, allowing the research team to make estimations. • Only four (1.2%) provided blank observations for this question.
2. Understanding the Concept of “Primary Business Function”:
• What percentage of Org X’s costs are from its Primary Business Function? • 24 of the 332 (7%) of respondents placed a 0 value in % of costs for the Primary Business
Function, suggesting that they did not fully understand the question. • The research team was able to reallocate costs from other functions into the Primary
Business Function based on the respondent-supplied description of it’s Primary BF or the organization’s line of business as implied by its business segment or known industry.
3. Is the Business Function List Exhaustive?
• Entries of “Other” Business Function Categories: • 66 of 332 (20%) respondents allocated costs to an ‘Other’ Business Function category
• 55 provided a description. Of these, 51 were ‘easily’ assigned to functional categories provided by survey, e.g.:
• 19 were reallocated to Management and Administration (e.g., ‘management,’ ‘back office functions,’ ‘HR,’ ‘finance,’ legal affairs’)
• 4 were reallocated to Facilities Maintenance (e.g., ‘food service,’ ‘maintenance’)
Comparison of 2010 NOS to Eurostat’s International Sourcing/Global Value Chains Survey There are several points of comparison between the 2010 NOS and other international sourcing surveys using a business function framework. Specifically, the 2011 Eurostat International Sourcing/Global Value Chains (IS/GVC) survey used a similar data collection approach, but instead of the 332 completed surveys in the 2010 NOS, there were about 40,000 surveys completed in 15 countries in Eurostat’s 2011 IS/GVC survey. Figure 6 compares employment by business function results for the two surveys. The results are remarkably similar across the two surveys, especially for the US and the “Old EU” countries, which have similar levels of development compared to “Old EU” countries of Eastern Europe.

The 2010 National Organizations Survey
40
A second, but less direct point of comparison is the frequency of domestic outsourcing and international sourcing. Because the IS/GVC did not collect quantitative information about the distribution of sourcing costs within each business function, only data on organizations that had any costs in each of the four sourcing options can be compared. The comparison is shown in Figure 7 for the core, or primary business function. While the results are generally comparable, a major difference in methods produced different results. In the IS/GVC survey respondents were asked to report only new outsourcing and offshoring events for the period 2009-2001, while in the 2010 NOS respondents were asked to report on current practices, regardless of when the initial outsourcing and offshoring events occurred. As a result, the share of U.S. organizations reporting some outsourcing and offshoring is generally higher than in the IS/GVC survey across all business functions. For example, about 34% of cases from the 2010 NOS reported some domestic outsourcing costs for IT services, and about 12% reported some international sourcing costs for IT services. In the IS/GVC survey, the share of enterprises reporting domestic outsourcing of IT services ranged from a low of .6% for Lithuania to a high of 29% for Ireland, while international sourcing of IT services ranged from a low of .3% for Lithuania to a high of 7.9% for Denmark. While these differences could be due, in part, to a higher propensity of U.S. enterprises to engage in outsourcing and offshoring, it might also be due to European enterprises initially engaging in domestic outsourcing and international sourcing before 2009.
Figure 6. Employment by Business Function, Comparison of 2010 NOS with Eurostat 2011 International Sourcing/Global Value Chain (IS/GVC) Survey
Source: 2010 NOS and Eurostat (http://epp.eurostat.ec.europa.eu/portal/page/portal/european_business/special_sbs_topics/international_sourcing)
3.1% 2.8% 1.7% 3.5% 3.4%
3.7% 3.8% 3.5%
4.2% 4.1% 3.2% 4.7%
9.3% 5.0%
3.4%
6.1%
9.6%
6.4% 6.0%
6.6%
67.3% 76.8%
81.2% 73.9%
0.0%
10.0%
20.0%
30.0%
40.0%
50.0%
60.0%
70.0%
80.0%
90.0%
100.0%
USA (2010 NOSSurvey)
Europe (IS/GVCSurvey, All)
Average New EU Average Old EU
Core/Primary function
Administrative and management
Marketing, sales and after sales services
Distribution and logistics
Other functions
Research, development, engineeringand related technical services
ICT services

The 2010 National Organizations Survey
41
Figure 7. Share of Organizations/Enterprises Domestically Outsourcing and Internationally Sourcing the Primary/Core Business Function, Comparison of 2010 NOS with Eurostat 2011 International Sourcing/Global Value Chain (IS/GVC) Survey
Source: 2010 NOS and Eurostat (http://epp.eurostat.ec.europa.eu/portal/page/portal/european_business/special_sbs_topics/international_sourcing)
Appendix D: Probability Weights
As with many surveys, different observations in the NOS have different probabilities of being selected for the sample frame and for responding to the survey. To adjust for these differences, weights were constructed for each observation so the resulting statistics are representative of employment (domestic full-time U.S. employees), or, alternatively, representative of the organization where the typical domestic full-time U.S. employee works. To calculate these weights, organizations in the two samples were assigned weights independently of each other, and then the two weights were combined after appropriate scaling to match up weights with relevant measures of employment. Weights for Observations from the GSS Since the GSS sample is a household survey, there are some differences in the probability of surveying respondents that result from both the fact that the survey selects only a single respondent from each household, and from differential response rates in different areas around the country. The organization that collects and publishes the GSS data, the National Opinion Research Center at the University of Chicago, provides a person-level weight for GSS data that adjusts for these two possible sources of bias.
0.0%
5.0%
10.0%
15.0%
20.0%
25.0%
30.0%
35.0%
40.0%
Domestic Outsourcing International Sourcing
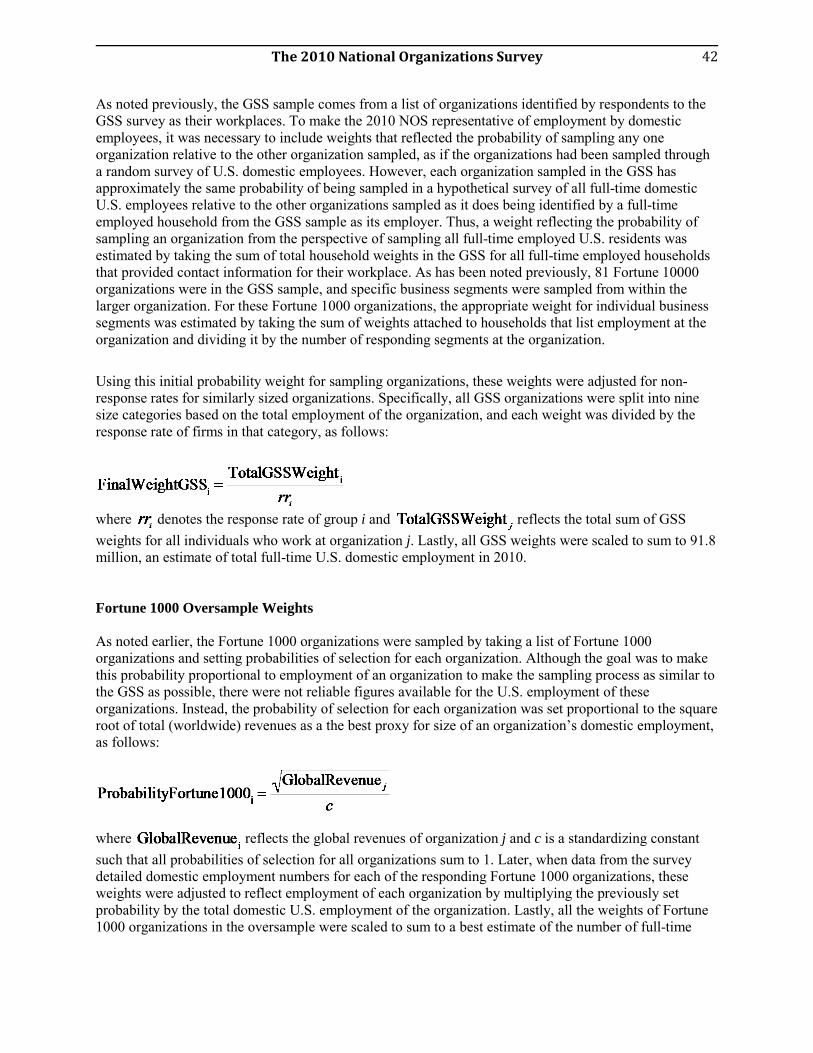
The 2010 National Organizations Survey
42
As noted previously, the GSS sample comes from a list of organizations identified by respondents to the GSS survey as their workplaces. To make the 2010 NOS representative of employment by domestic employees, it was necessary to include weights that reflected the probability of sampling any one organization relative to the other organization sampled, as if the organizations had been sampled through a random survey of U.S. domestic employees. However, each organization sampled in the GSS has approximately the same probability of being sampled in a hypothetical survey of all full-time domestic U.S. employees relative to the other organizations sampled as it does being identified by a full-time employed household from the GSS sample as its employer. Thus, a weight reflecting the probability of sampling an organization from the perspective of sampling all full-time employed U.S. residents was estimated by taking the sum of total household weights in the GSS for all full-time employed households that provided contact information for their workplace. As has been noted previously, 81 Fortune 10000 organizations were in the GSS sample, and specific business segments were sampled from within the larger organization. For these Fortune 1000 organizations, the appropriate weight for individual business segments was estimated by taking the sum of weights attached to households that list employment at the organization and dividing it by the number of responding segments at the organization.
Using this initial probability weight for sampling organizations, these weights were adjusted for non-response rates for similarly sized organizations. Specifically, all GSS organizations were split into nine size categories based on the total employment of the organization, and each weight was divided by the response rate of firms in that category, as follows:
where denotes the response rate of group i and reflects the total sum of GSS weights for all individuals who work at organization j. Lastly, all GSS weights were scaled to sum to 91.8 million, an estimate of total full-time U.S. domestic employment in 2010. Fortune 1000 Oversample Weights As noted earlier, the Fortune 1000 organizations were sampled by taking a list of Fortune 1000 organizations and setting probabilities of selection for each organization. Although the goal was to make this probability proportional to employment of an organization to make the sampling process as similar to the GSS as possible, there were not reliable figures available for the U.S. employment of these organizations. Instead, the probability of selection for each organization was set proportional to the square root of total (worldwide) revenues as a the best proxy for size of an organization’s domestic employment, as follows:
where reflects the global revenues of organization j and c is a standardizing constant such that all probabilities of selection for all organizations sum to 1. Later, when data from the survey detailed domestic employment numbers for each of the responding Fortune 1000 organizations, these weights were adjusted to reflect employment of each organization by multiplying the previously set probability by the total domestic U.S. employment of the organization. Lastly, all the weights of Fortune 1000 organizations in the oversample were scaled to sum to a best estimate of the number of full-time

The 2010 National Organizations Survey
43
domestic workers who work in Fortune 1000 organizations as of 2010, 21.1% of 91.8 million, or 19.4 million.13 Combining the Weights for GSS and Fortune 1000 Oversample Organizations After these weights were calculated separately for organizations in the two samples, the two weights were combined so that all data could be used together with the same weighting scale. First, the Fortune 1000 samples were combined into one group. Since the Fortune 1000 organizations sampled in the GSS sample and the Fortune 1000 organizations sampled in the Fortune 1000 oversample comprised two independent samples of the Fortune 1000 organizations, and since the weights for both were properly scaled to be representative of employment in their respective samples, these weights could simply be used together without any individual changes to the weights, and then rescaled conjointly to represent the estimated 19.4 million domestic U.S. employees at Fortune 1000 organizations. The remaining observations, the non-Fortune 1000 organizations from the GSS sample, were rescaled to have weights that sum to 74.2 million, representing the remaining 78.9% of domestic U.S. employment estimated to be outside the Fortune 1000 organizations. With these last adjustments, all weights could be used conjointly with the full dataset.
Appendix E: Industry Groupings
Each organization in the data set was assigned one of four industry groupings: 1) goods-producing organizations; 2) trade and transportation organizations; 3) other services-producing organizations, and 4) public administration, health and educational organizations. To create these groupings, both information from respondent-provided descriptions about an organization’s primary business function and desk research using the organization’s name were used to identify a NAICS code. These two-digit NAICS codes were organized into the four industry categories as described in Table 21.
Table 21: Industry Groupings and NAICS Classifications Goods-Producing Industry Grouping NAICS Code NAICS Description
11 Agriculture, Forestry, Fishing and Hunting
21 Mining, Quarrying, and Oil and Gas Extraction
23 Construction
31-33 Manufacturing
Trade and Transportation Industry Grouping NAICS Code NAICS Description
22 Utilities
42 Wholesale Trade
44-45 Retail Trade
48-49 Transportation and Warehousing
48-49 Transportation and Warehousing (Public)
13 Professor Lee Badgett (University of Massachusetts Amherst) provided an estimate of total domestic full-time employment of Fortune 1000 firms, which she calculated for her own research on health benefits. U.S. firms are not required to report their domestic employment, and so the figure is not easily obtained.
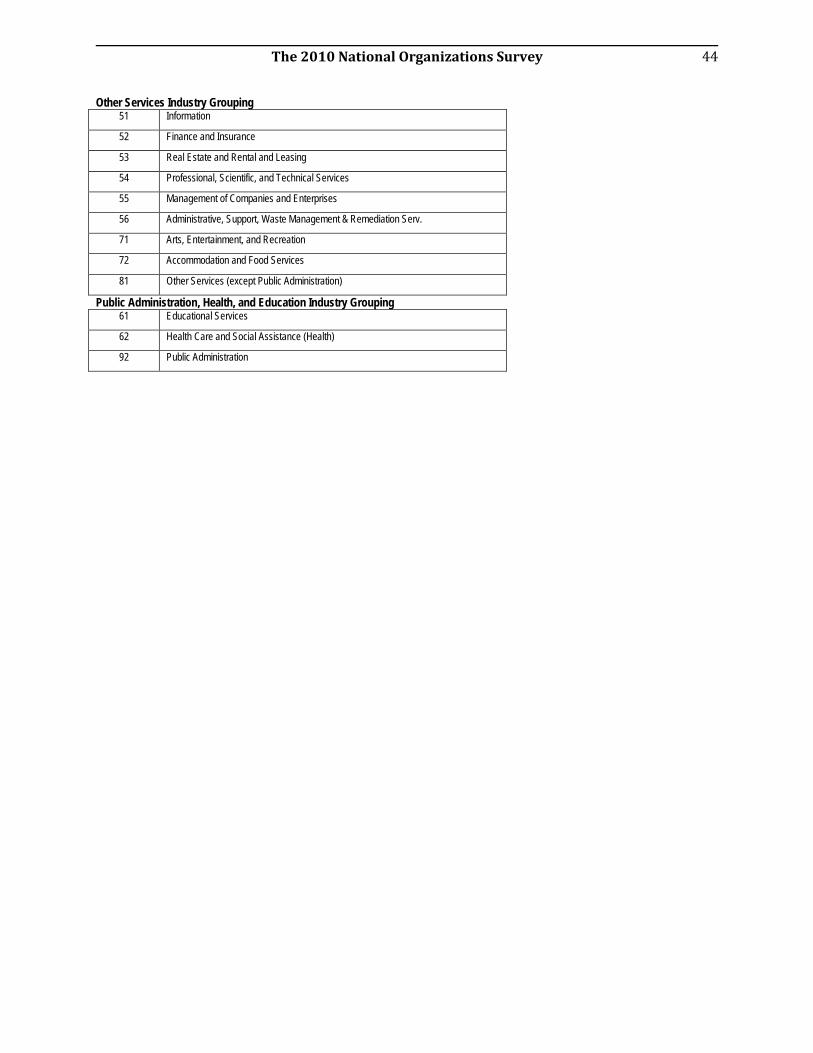
The 2010 National Organizations Survey
44
Other Services Industry Grouping 51 Information
52 Finance and Insurance
53 Real Estate and Rental and Leasing
54 Professional, Scientific, and Technical Services
55 Management of Companies and Enterprises
56 Administrative, Support, Waste Management & Remediation Serv.
71 Arts, Entertainment, and Recreation
72 Accommodation and Food Services
81 Other Services (except Public Administration)
Public Administration, Health, and Education Industry Grouping 61 Educational Services
62 Health Care and Social Assistance (Health)
92 Public Administration

The 2010 National Organizations Survey
45
Appendix F: Comprehensive Descriptive Tables (Full and GSS samples)
Table 22. Full Sample - Share of full-time domestic U.S. employees working at organizations that engage in some domestic outsourcing, or international internal or external sourcing, by organization size, industry, regardless of business function
US Emp. Size Industry Domestic External International Affiliate International External Some International
Sourcing* Some Domestic External or
International Sourcing** N All Sizes All Industries 47.7% 17.1% 13.5% 23.2% 55.9% 320 <500 41.7% 5.6% 5.6% 9.4% 46.2% 123 ≥500 52.2% 25.7% 19.4% 33.4% 63.0% 197 All Sizes Goods-Producing 65.9% 36.4% 24.9% 42.4% 76.1% 87 Trade 58.7% 26.1% 27.6% 37.5% 72.5% 38 Service 51.1% 18.1% 11.2% 24.8% 63.1% 91 Public, Health or Education 29.9% 1.6% 3.4% 5.0% 31.2% 104 <500 Goods-Producing 46.2% 5.9% 11.7% 11.7% 46.2% 24 Trade 51.8% 9.5% 3.4% 12.9% 58.0% 13 Service 47.1% 8.6% 7.2% 13.8% 55.5% 45 Public, Health or Education 28.7% 0.0% 1.3% 1.3% 29.9% 41 ≥500 Goods-Producing 76.8% 53.1% 32.1% 59.3% 92.5% 63 Trade 62.5% 35.2% 40.9% 50.9% 80.5% 25 Service 56.2% 30.1% 16.3% 38.7% 72.8% 46 Public, Health or Education 31.2% 2.6% 4.7% 7.3% 32.0% 63
Table 23. GSS Sample - Share of full-time domestic U.S. employees working at organizations that engage in some domestic outsourcing, or international internal or external sourcing, by organization size, industry, regardless of business function
US Emp. Size Industry Domestic External International Affiliate International External Some International
Sourcing* Some Domestic External or
International Sourcing** N All Sizes All Industries 44.3% 15.0% 11.0% 19.1% 50.9% 253 <500 41.7% 5.6% 5.6% 9.4% 46.2% 122 ≥500 46.7% 23.4% 15.8% 27.8% 55.1% 131 All Sizes Goods-Producing 62.8% 32.9% 23.3% 36.0% 72.3% 55 Trade 60.9% 25.4% 22.4% 29.5% 66.7% 24 Service 43.2% 13.7% 7.3% 21.7% 55.5% 70 Public, Health or Education 29.9% 1.6% 3.4% 5.0% 31.2% 104 <500 Goods-Producing 46.2% 5.9% 11.7% 11.7% 46.2% 24 Trade 51.8% 9.5% 3.4% 12.9% 58.0% 13 Service 47.1% 8.6% 7.2% 13.8% 55.5% 44 Public, Health or Education 28.7% 0.0% 1.3% 1.3% 29.9% 41 ≥500 Goods-Producing 74.1% 51.0% 31.1% 52.3% 89.9% 31 Trade 67.0% 36.1% 35.1% 40.5% 72.5% 11 Service 34.8% 31.2% 7.7% 38.9% 55.6% 26 Public, Health or Education 30.7% 2.6% 4.7% 7.3% 32.0% 63
* Indicates share of full-time domestic U.S. employees working at organizations that engage in international sourcing from internal sources (affiliates), external sources (external suppliers), or both. ** Indicates share of full-time domestic U.S. employees working at organizations that engage in domestic outsourcing (domestic external suppliers), international sourcing from internal sources (affiliates), international sourcing from external sources (external suppliers), or all three.

The 2010 National Organizations Survey
46
Table 24. Full Sample - Distribution of Sourcing Costs for Organization of Typical Full-Time Domestic U.S. Employee, by Organization Size, Industry, and Business Function
US Emp. Size Industry Business Function Domestic In
House Domestic External
International Affiliate
International External
International Sourcing* N
<500 Goods Producing Primary Business Function 94.8% 4.0% 0.3% 0.9% 1.2% 24 Research and Development 95.3% 4.7% 0.0% 0.0% 0.0% 13 Sales and Marketing 95.9% 3.6% 0.4% 0.1% 0.5% 19 Transportation Services 80.0% 18.4% 0.0% 1.6% 1.6% 19 Customer & After-sales Service 100.0% 0.0% 0.0% 0.0% 0.0% 18 Management, Admin, and Back-office 99.1% 0.4% 0.1% 0.4% 0.5% 20 Information Technology Systems 86.6% 13.1% 0.0% 0.3% 0.3% 15 Facilities Maintenance 88.5% 11.3% 0.3% 0.0% 0.3% 17 ≥500 Goods Producing Primary Business Function 83.6% 5.8% 9.2% 1.4% 10.5% 62 Research and Development 89.1% 3.0% 6.5% 1.3% 7.8% 55 Sales and Marketing 84.5% 5.8% 9.0% 0.8% 9.8% 57 Transportation Services 71.8% 13.7% 8.9% 5.6% 14.5% 55 Customer & After-sales Service 87.2% 3.0% 8.3% 1.5% 9.7% 57 Management, Admin, and Back-office 88.1% 2.9% 7.9% 1.2% 9.1% 61 Information Technology Systems 74.6% 16.6% 6.3% 2.6% 8.9% 56 Facilities Maintenance 81.8% 7.4% 8.1% 2.7% 10.9% 53 <500 Trade Primary Business Function 99.0% 0.3% 0.6% 0.0% 0.6% 13 Research and Development 100.0% 0.0% 0.0% 0.0% 0.0% 5 Sales and Marketing 88.4% 7.5% 3.1% 1.0% 4.1% 13 Transportation Services 94.1% 5.0% 1.0% 0.0% 1.0% 13 Customer & After-sales Service 91.7% 8.3% 0.0% 0.0% 0.0% 11 Management, Admin, and Back-office 97.8% 1.5% 0.7% 0.0% 0.7% 13 Information Technology Systems 96.8% 3.2% 0.0% 0.0% 0.0% 11 Facilities Maintenance 86.8% 13.2% 0.0% 0.0% 0.0% 12 ≥500 Trade Primary Business Function 88.2% 3.3% 6.7% 1.8% 8.6% 25 Research and Development 88.7% 6.0% 4.8% 0.4% 5.2% 20 Sales and Marketing 88.0% 7.6% 4.2% 0.2% 4.4% 24 Transportation Services 84.0% 5.5% 6.5% 3.9% 10.5% 21 Customer & After-sales Service 86.9% 3.3% 7.9% 1.8% 9.7% 21 Management, Admin, and Back-office 91.5% 1.5% 5.5% 1.5% 7.0% 24 Information Technology Systems 78.0% 9.2% 5.3% 7.5% 12.8% 21 Facilities Maintenance 89.2% 5.0% 5.8% 0.0% 5.8% 19 <500 Service Primary Business Function 94.2% 2.1% 1.7% 2.0% 3.8% 44 Research and Development 98.4% 0.4% 1.2% 0.0% 1.2% 20 Sales and Marketing 93.5% 3.0% 3.4% 0.1% 3.5% 31 Transportation Services 85.9% 13.3% 0.8% 0.0% 0.8% 16 Customer & After-sales Service 97.6% 1.7% 0.8% 0.0% 0.8% 27 Management, Admin, and Back-office 98.9% 0.7% 0.4% 0.0% 0.4% 39 Information Technology Systems 70.7% 29.2% 0.1% 0.0% 0.1% 30 Facilities Maintenance 63.6% 36.1% 0.3% 0.0% 0.3% 31

The 2010 National Organizations Survey
47
US Emp. Size Industry Business Function Domestic In
House Domestic External
International Affiliate
International External
International Sourcing* N
≥500 Service Primary Business Function 92.5% 1.8% 5.3% 0.4% 5.7% 46 Research and Development 87.7% 4.0% 8.1% 0.2% 8.3% 37 Sales and Marketing 91.2% 3.0% 5.5% 0.3% 5.8% 40 Transportation Services 68.4% 27.9% 3.7% 0.0% 3.7% 28 Customer & After-sales Service 87.1% 2.6% 9.7% 0.6% 10.3% 36 Management, Admin, and Back-office 89.7% 1.8% 8.3% 0.2% 8.5% 44 Information Technology Systems 80.3% 8.9% 10.0% 0.9% 10.8% 39 Facilities Maintenance 61.6% 25.9% 12.1% 0.5% 12.6% 31 <500 Public, Health or Education Primary Business Function 94.8% 5.2% 0.0% 0.0% 0.0% 40 Research and Development 84.7% 9.6% 0.0% 5.7% 5.7% 13 Sales and Marketing 98.9% 1.1% 0.0% 0.0% 0.0% 12 Transportation Services 88.0% 12.0% 0.0% 0.0% 0.0% 14 Customer & After-sales Service 100.0% 0.0% 0.0% 0.0% 0.0% 19 Management, Admin, and Back-office 98.0% 2.0% 0.0% 0.0% 0.0% 30 Information Technology Systems 89.9% 9.6% 0.0% 0.5% 0.5% 22 Facilities Maintenance 84.0% 15.7% 0.0% 0.3% 0.3% 22 ≥500 Public, Health or Education Primary Business Function 98.4% 1.5% 0.0% 0.1% 0.1% 63 Research and Development 96.5% 1.6% 0.3% 1.6% 1.9% 27 Sales and Marketing 98.2% 1.8% 0.0% 0.1% 0.1% 25 Transportation Services 93.8% 6.2% 0.0% 0.0% 0.0% 43 Customer & After-sales Service 99.4% 0.6% 0.0% 0.0% 0.0% 30 Management, Admin, and Back-office 97.6% 2.2% 0.1% 0.2% 0.2% 59 Information Technology Systems 94.6% 5.3% 0.0% 0.1% 0.1% 57 Facilities Maintenance 95.5% 4.5% 0.0% 0.0% 0.0% 56
* Indicates share of full-time domestic U.S. employees working at organizations that engage in international sourcing from internal sources (affiliates), external sources (external suppliers), or both. Note: These statistics exclude observations from organizations that do not have costs in the particular business function in question. Thus, the statistics represent the share of full-time domestic U.S. employees working at organizations that engage in external sourcing and have costs in the business function in question.

The 2010 National Organizations Survey
48
Table 25. GSS Sample - Distribution of Sourcing Costs for Organization of Typical Full-Time Domestic U.S. Employee, by organization size, industry, and business function
US Emp. Size Industry Business Function Domestic In
House Domestic External
International Affiliate
International External
International Sourcing* N
<500 Goods Producing Primary Business Function 94.8% 4.0% 0.3% 0.9% 1.2% 24 Research and Development 95.3% 4.7% 0.0% 0.0% 0.0% 13 Sales and Marketing 95.9% 3.6% 0.4% 0.1% 0.5% 19 Transportation Services 80.0% 18.4% 0.0% 1.6% 1.6% 19 Customer & After-sales Service 100.0% 0.0% 0.0% 0.0% 0.0% 18 Management, Admin, and Back-office 99.1% 0.4% 0.1% 0.4% 0.5% 20 Information Technology Systems 86.6% 13.1% 0.0% 0.3% 0.3% 15 Facilities Maintenance 88.5% 11.3% 0.3% 0.0% 0.3% 17 ≥500 Goods Producing Primary Business Function 83.0% 7.5% 8.2% 1.3% 9.5% 31 Research and Development 92.7% 1.9% 4.3% 1.1% 5.4% 27 Sales and Marketing 85.9% 6.5% 7.2% 0.5% 7.7% 28 Transportation Services 72.6% 15.5% 6.9% 5.0% 11.9% 27 Customer & After-sales Service 90.2% 3.1% 6.7% 0.1% 6.7% 28 Management, Admin, and Back-office 90.7% 2.5% 6.4% 0.3% 6.8% 30 Information Technology Systems 74.8% 19.4% 4.5% 1.3% 5.8% 29 Facilities Maintenance 87.5% 4.0% 7.9% 0.6% 8.5% 27 <500 Trade Primary Business Function 99.1% 0.3% 0.6% 0.0% 0.6% 13 Research and Development 100.0% 0.0% 0.0% 0.0% 0.0% 5 Sales and Marketing 88.4% 7.4% 3.1% 1.0% 4.1% 13 Transportation Services 94.1% 5.0% 1.0% 0.0% 1.0% 13 Customer & After-sales Service 91.7% 8.3% 0.0% 0.0% 0.0% 11 Management, Admin, and Back-office 97.8% 1.6% 0.7% 0.0% 0.7% 13 Information Technology Systems 96.8% 3.2% 0.0% 0.0% 0.0% 11 Facilities Maintenance 86.8% 13.2% 0.0% 0.0% 0.0% 12 ≥500 Trade Primary Business Function 85.6% 5.7% 5.8% 2.8% 8.6% 11 Research and Development 88.5% 8.0% 3.0% 0.5% 3.5% 10 Sales and Marketing 88.2% 11.3% 0.3% 0.3% 0.5% 11 Transportation Services 79.0% 9.4% 5.9% 5.7% 11.6% 10 Customer & After-sales Service 83.0% 5.7% 8.3% 3.0% 11.3% 10 Management, Admin, and Back-office 89.8% 2.6% 5.1% 2.6% 7.7% 11 Information Technology Systems 78.7% 12.3% 6.0% 3.0% 9.0% 9 Facilities Maintenance 86.1% 4.6% 9.4% 0.0% 9.4% 9 <500 Service Primary Business Function 94.2% 2.1% 1.7% 2.0% 3.8% 44 Research and Development 98.4% 0.4% 1.2% 0.0% 1.2% 20 Sales and Marketing 93.5% 3.0% 3.4% 0.1% 3.5% 31 Transportation Services 85.9% 13.3% 0.8% 0.0% 0.8% 16 Customer & After-sales Service 97.5% 1.7% 0.8% 0.0% 0.8% 27 Management, Admin, and Back-office 98.9% 0.7% 0.4% 0.0% 0.4% 39 Information Technology Systems 70.7% 29.2% 0.1% 0.0% 0.1% 30 Facilities Maintenance 63.6% 36.1% 0.3% 0.0% 0.3% 31

The 2010 National Organizations Survey
49
US Emp. Size Industry Business Function Domestic In
House Domestic External
International Affiliate
International External
International Sourcing* N
≥500 Service Primary Business Function 96.6% 2.2% 1.2% 0.0% 1.2% 25 Research and Development 94.7% 3.8% 1.0% 0.5% 1.5% 21 Sales and Marketing 98.4% 1.2% 0.4% 0.0% 0.4% 20 Transportation Services 93.7% 5.5% 0.8% 0.0% 0.8% 18 Customer & After-sales Service 97.9% 1.5% 0.0% 0.6% 0.6% 17 Management, Admin, and Back-office 96.0% 3.2% 0.4% 0.4% 0.8% 24 Information Technology Systems 83.3% 11.5% 5.0% 0.2% 5.2% 22 Facilities Maintenance 90.9% 7.5% 1.6% 0.0% 1.6% 17 <500 Public, Health or Education Primary Business Function 94.8% 5.2% 0.0% 0.0% 0.0% 40 Research and Development 84.7% 9.6% 0.0% 5.7% 5.7% 13 Sales and Marketing 99.0% 1.1% 0.0% 0.0% 0.0% 13 Transportation Services 88.5% 11.6% 0.0% 0.0% 0.0% 15 Customer & After-sales Service 100.0% 0.0% 0.0% 0.0% 0.0% 20 Management, Admin, and Back-office 98.0% 2.0% 0.0% 0.0% 0.0% 32 Information Technology Systems 88.5% 10.9% 0.0% 0.5% 0.5% 24 Facilities Maintenance 84.4% 15.3% 0.0% 0.3% 0.3% 24 ≥500 Public, Health or Education Primary Business Function 98.4% 1.5% 0.0% 0.1% 0.1% 63 Research and Development 96.5% 1.6% 0.3% 1.6% 1.9% 27 Sales and Marketing 98.2% 1.8% 0.0% 0.1% 0.1% 25 Transportation Services 93.8% 6.2% 0.0% 0.0% 0.0% 43 Customer & After-sales Service 99.4% 0.6% 0.0% 0.0% 0.0% 30 Management, Admin, and Back-office 97.6% 2.2% 0.1% 0.2% 0.2% 59 Information Technology Systems 94.6% 5.3% 0.0% 0.1% 0.1% 57 Facilities Maintenance 95.5% 4.5% 0.0% 0.0% 0.0% 56
*Indicates share of full-time domestic U.S. employees working at organizations that engage in international sourcing from internal sources (affiliates), external sources (external suppliers), or both. Note: These statistics exclude observations from organizations that do not have costs in the particular business function in question. Thus, the statistics represent the share of full-time domestic U.S. employees working at organizations that engage in external sourcing and have costs in the business function in question.

The 2010 National Organizations Survey
50
Table 26. Full Sample - Share of full-time domestic U.S. employees working at organizations that engage in some external sourcing, by organization size, industry, and business function
US Emp. Size Industry Business Function Domestic In
House Domestic External
International Affiliate
International External
International Sourcing* N
<500 Goods Producing Primary Business Function 100.0% 24.3% 5.9% 5.7% 11.7% 24 Research and Development 100.0% 30.4% 0.0% 0.0% 0.0% 13 Sales and Marketing 100.0% 18.1% 7.1% 7.1% 7.1% 19 Transportation Services 97.0% 23.2% 0.0% 8.0% 8.0% 19 Customer & After-sales Service 100.0% 0.0% 0.0% 0.0% 0.0% 18 Management, Admin, and Back-office 100.0% 2.9% 6.9% 6.9% 6.9% 20 Information Technology Systems 92.6% 31.9% 0.0% 9.6% 9.6% 15 Facilities Maintenance 93.5% 39.8% 8.4% 0.0% 8.4% 17 ≥500 Goods Producing Primary Business Function 100.0% 39.1% 44.9% 19.5% 46.8% 62 Research and Development 100.0% 30.4% 38.6% 11.3% 39.2% 55 Sales and Marketing 100.0% 25.8% 47.3% 14.0% 47.9% 57 Transportation Services 95.1% 50.4% 41.5% 28.3% 52.3% 55 Customer & After-sales Service 100.0% 14.4% 40.9% 10.2% 44.5% 57 Management, Admin, and Back-office 100.0% 19.3% 41.0% 10.4% 45.6% 61 Information Technology Systems 96.2% 57.0% 37.0% 22.0% 44.2% 56 Facilities Maintenance 96.9% 34.0% 41.7% 18.7% 45.8% 53 <500 Trade Primary Business Function 100.0% 3.3% 6.2% 0.0% 6.2% 13 Research and Development 100.0% 0.0% 0.0% 0.0% 0.0% 5 Sales and Marketing 96.6% 33.0% 6.2% 3.4% 9.6% 13 Transportation Services 96.7% 27.6% 9.5% 0.0% 9.5% 13 Customer & After-sales Service 100.0% 16.6% 0.0% 0.0% 0.0% 11 Management, Admin, and Back-office 100.0% 15.5% 3.3% 0.0% 3.3% 13 Information Technology Systems 100.0% 24.8% 0.0% 0.0% 0.0% 11 Facilities Maintenance 96.5% 35.2% 0.0% 0.0% 0.0% 12 ≥500 Trade Primary Business Function 100.0% 25.8% 33.2% 20.6% 35.4% 25 Research and Development 97.9% 16.9% 27.4% 6.6% 29.5% 20 Sales and Marketing 98.1% 26.8% 13.4% 4.6% 13.7% 24 Transportation Services 100.0% 31.7% 24.2% 23.3% 31.3% 21 Customer & After-sales Service 100.0% 20.1% 26.4% 20.4% 31.2% 21 Management, Admin, and Back-office 100.0% 14.7% 23.9% 14.7% 23.9% 24 Information Technology Systems 100.0% 56.2% 23.8% 35.1% 42.7% 21 Facilities Maintenance 100.0% 18.4% 19.3% 0.0% 19.3% 19 <500 Service Primary Business Function 100.0% 8.6% 8.6% 7.2% 13.8% 44 Research and Development 100.0% 3.7% 6.1% 0.0% 6.1% 20 Sales and Marketing 100.0% 22.0% 9.5% 2.7% 9.5% 31 Transportation Services 100.0% 25.3% 7.8% 0.0% 7.8% 16 Customer & After-sales Service 100.0% 12.0% 8.0% 0.0% 8.0% 27 Management, Admin, and Back-office 100.0% 10.7% 4.3% 0.0% 4.3% 39 Information Technology Systems 89.2% 37.9% 2.7% 0.0% 2.7% 30 Facilities Maintenance 74.3% 54.5% 2.7% 0.0% 2.7% 31

The 2010 National Organizations Survey
51
US Emp. Size Industry Business Function Domestic In
House Domestic External
International Affiliate
International External
International Sourcing* N
≥500 Service Primary Business Function 100.0% 17.7% 20.5% 28.3% 21.3% 46 Research and Development 99.1% 23.2% 18.7% 25.3% 25.4% 37 Sales and Marketing 99.9% 17.6% 25.3% 23.3% 30.9% 40 Transportation Services 96.5% 31.8% 19.2% 0.0% 19.2% 28 Customer & After-sales Service 100.0% 15.4% 19.6% 24.5% 25.8% 36 Management, Admin, and Back-office 100.0% 14.2% 24.1% 16.1% 26.7% 44 Information Technology Systems 98.7% 27.2% 23.6% 23.9% 29.5% 39 Facilities Maintenance 95.0% 56.1% 24.7% 31.2% 24.7% 31 <500 Public, Health or Education Primary Business Function 100.0% 15.1% 0.0% 0.0% 0.0% 40 Research and Development 94.3% 22.7% 0.0% 5.7% 5.7% 13 Sales and Marketing 100.0% 5.2% 0.0% 0.0% 0.0% 13 Transportation Services 100.0% 14.4% 0.0% 0.0% 0.0% 15 Customer & After-sales Service 100.0% 0.0% 0.0% 0.0% 0.0% 20 Management, Admin, and Back-office 100.0% 7.4% 0.0% 0.0% 0.0% 32 Information Technology Systems 92.9% 22.8% 0.0% 2.6% 2.6% 24 Facilities Maintenance 90.5% 26.2% 0.0% 2.7% 2.7% 24 ≥500 Public, Health or Education Primary Business Function 100.0% 14.6% 0.0% 3.4% 3.4% 63 Research and Development 100.0% 17.8% 3.3% 1.6% 4.9% 27 Sales and Marketing 100.0% 20.1% 0.0% 4.7% 4.7% 25 Transportation Services 100.0% 21.2% 0.0% 0.0% 0.0% 43 Customer & After-sales Service 100.0% 11.4% 0.0% 0.0% 0.0% 30 Management, Admin, and Back-office 98.9% 17.5% 1.4% 0.6% 2.0% 59 Information Technology Systems 98.3% 18.1% 0.0% 2.8% 2.8% 57 Facilities Maintenance 100.0% 17.8% 0.0% 0.0% 0.0% 56
* Indicates share of full-time domestic U.S. employees working at organizations that engage in international sourcing from internal sources (affiliates), external sources (external suppliers), or both. Note: These statistics exclude observations from organizations that do not have costs in the particular business function in question. Thus, the statistics represent the share of full-time domestic U.S. employees working at organizations that engage in external sourcing and have costs in the business function in question.
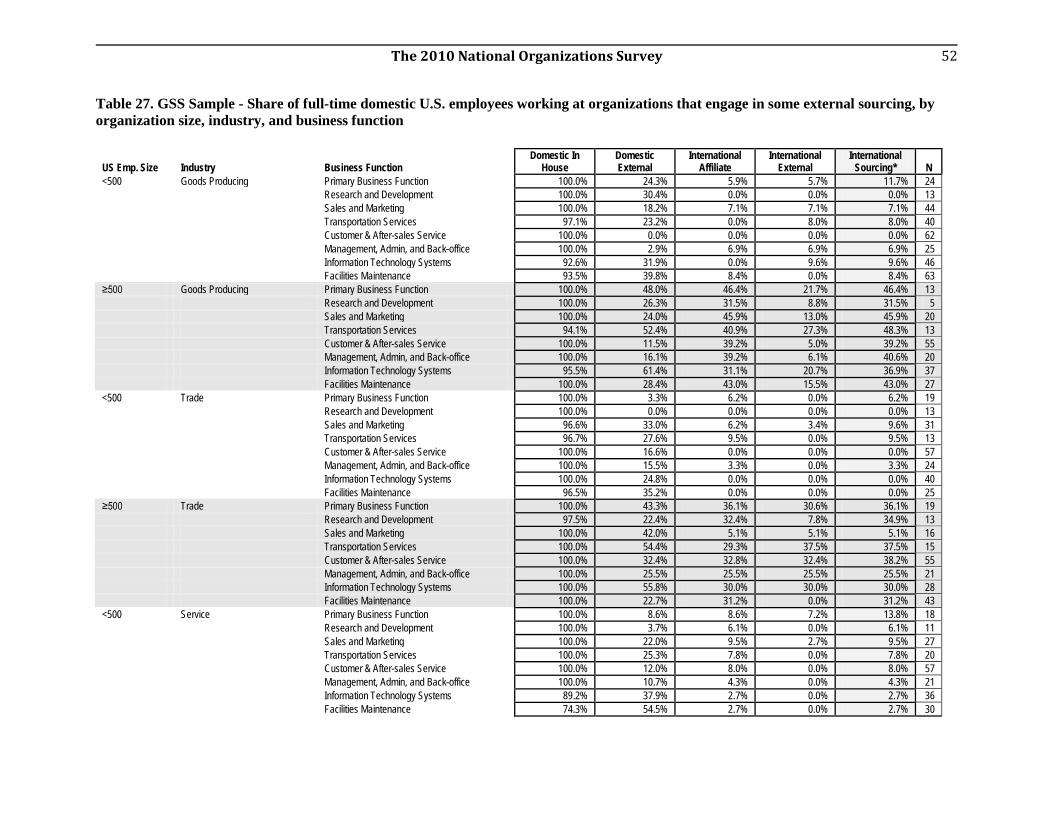
The 2010 National Organizations Survey
52
Table 27. GSS Sample - Share of full-time domestic U.S. employees working at organizations that engage in some external sourcing, by organization size, industry, and business function
US Emp. Size Industry Business Function Domestic In
House Domestic External
International Affiliate
International External
International Sourcing* N
<500 Goods Producing Primary Business Function 100.0% 24.3% 5.9% 5.7% 11.7% 24 Research and Development 100.0% 30.4% 0.0% 0.0% 0.0% 13 Sales and Marketing 100.0% 18.2% 7.1% 7.1% 7.1% 44 Transportation Services 97.1% 23.2% 0.0% 8.0% 8.0% 40 Customer & After-sales Service 100.0% 0.0% 0.0% 0.0% 0.0% 62 Management, Admin, and Back-office 100.0% 2.9% 6.9% 6.9% 6.9% 25 Information Technology Systems 92.6% 31.9% 0.0% 9.6% 9.6% 46 Facilities Maintenance 93.5% 39.8% 8.4% 0.0% 8.4% 63 ≥500 Goods Producing Primary Business Function 100.0% 48.0% 46.4% 21.7% 46.4% 13 Research and Development 100.0% 26.3% 31.5% 8.8% 31.5% 5 Sales and Marketing 100.0% 24.0% 45.9% 13.0% 45.9% 20 Transportation Services 94.1% 52.4% 40.9% 27.3% 48.3% 13 Customer & After-sales Service 100.0% 11.5% 39.2% 5.0% 39.2% 55 Management, Admin, and Back-office 100.0% 16.1% 39.2% 6.1% 40.6% 20 Information Technology Systems 95.5% 61.4% 31.1% 20.7% 36.9% 37 Facilities Maintenance 100.0% 28.4% 43.0% 15.5% 43.0% 27 <500 Trade Primary Business Function 100.0% 3.3% 6.2% 0.0% 6.2% 19 Research and Development 100.0% 0.0% 0.0% 0.0% 0.0% 13 Sales and Marketing 96.6% 33.0% 6.2% 3.4% 9.6% 31 Transportation Services 96.7% 27.6% 9.5% 0.0% 9.5% 13 Customer & After-sales Service 100.0% 16.6% 0.0% 0.0% 0.0% 57 Management, Admin, and Back-office 100.0% 15.5% 3.3% 0.0% 3.3% 24 Information Technology Systems 100.0% 24.8% 0.0% 0.0% 0.0% 40 Facilities Maintenance 96.5% 35.2% 0.0% 0.0% 0.0% 25 ≥500 Trade Primary Business Function 100.0% 43.3% 36.1% 30.6% 36.1% 19 Research and Development 97.5% 22.4% 32.4% 7.8% 34.9% 13 Sales and Marketing 100.0% 42.0% 5.1% 5.1% 5.1% 16 Transportation Services 100.0% 54.4% 29.3% 37.5% 37.5% 15 Customer & After-sales Service 100.0% 32.4% 32.8% 32.4% 38.2% 55 Management, Admin, and Back-office 100.0% 25.5% 25.5% 25.5% 25.5% 21 Information Technology Systems 100.0% 55.8% 30.0% 30.0% 30.0% 28 Facilities Maintenance 100.0% 22.7% 31.2% 0.0% 31.2% 43 <500 Service Primary Business Function 100.0% 8.6% 8.6% 7.2% 13.8% 18 Research and Development 100.0% 3.7% 6.1% 0.0% 6.1% 11 Sales and Marketing 100.0% 22.0% 9.5% 2.7% 9.5% 27 Transportation Services 100.0% 25.3% 7.8% 0.0% 7.8% 20 Customer & After-sales Service 100.0% 12.0% 8.0% 0.0% 8.0% 57 Management, Admin, and Back-office 100.0% 10.7% 4.3% 0.0% 4.3% 21 Information Technology Systems 89.2% 37.9% 2.7% 0.0% 2.7% 36 Facilities Maintenance 74.3% 54.5% 2.7% 0.0% 2.7% 30
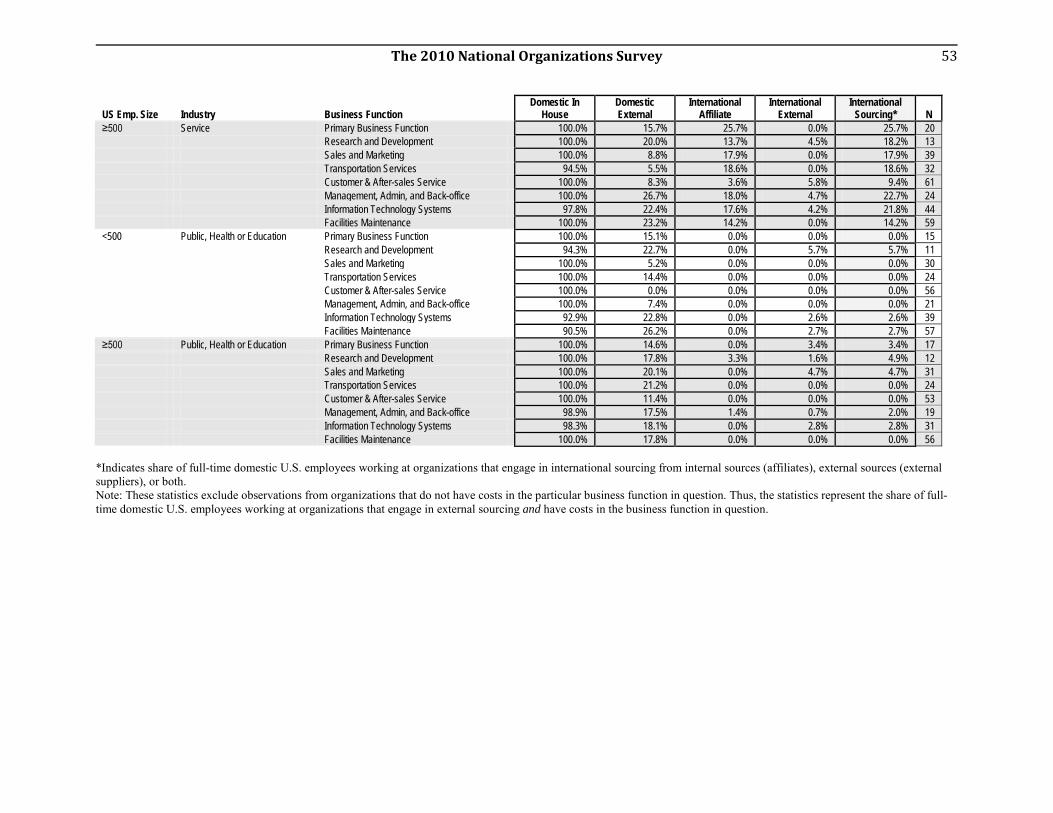
The 2010 National Organizations Survey
53
US Emp. Size Industry Business Function Domestic In
House Domestic External
International Affiliate
International External
International Sourcing* N
≥500 Service Primary Business Function 100.0% 15.7% 25.7% 0.0% 25.7% 20 Research and Development 100.0% 20.0% 13.7% 4.5% 18.2% 13 Sales and Marketing 100.0% 8.8% 17.9% 0.0% 17.9% 39 Transportation Services 94.5% 5.5% 18.6% 0.0% 18.6% 32 Customer & After-sales Service 100.0% 8.3% 3.6% 5.8% 9.4% 61 Management, Admin, and Back-office 100.0% 26.7% 18.0% 4.7% 22.7% 24 Information Technology Systems 97.8% 22.4% 17.6% 4.2% 21.8% 44 Facilities Maintenance 100.0% 23.2% 14.2% 0.0% 14.2% 59 <500 Public, Health or Education Primary Business Function 100.0% 15.1% 0.0% 0.0% 0.0% 15 Research and Development 94.3% 22.7% 0.0% 5.7% 5.7% 11 Sales and Marketing 100.0% 5.2% 0.0% 0.0% 0.0% 30 Transportation Services 100.0% 14.4% 0.0% 0.0% 0.0% 24 Customer & After-sales Service 100.0% 0.0% 0.0% 0.0% 0.0% 56 Management, Admin, and Back-office 100.0% 7.4% 0.0% 0.0% 0.0% 21 Information Technology Systems 92.9% 22.8% 0.0% 2.6% 2.6% 39 Facilities Maintenance 90.5% 26.2% 0.0% 2.7% 2.7% 57 ≥500 Public, Health or Education Primary Business Function 100.0% 14.6% 0.0% 3.4% 3.4% 17 Research and Development 100.0% 17.8% 3.3% 1.6% 4.9% 12 Sales and Marketing 100.0% 20.1% 0.0% 4.7% 4.7% 31 Transportation Services 100.0% 21.2% 0.0% 0.0% 0.0% 24 Customer & After-sales Service 100.0% 11.4% 0.0% 0.0% 0.0% 53 Management, Admin, and Back-office 98.9% 17.5% 1.4% 0.7% 2.0% 19 Information Technology Systems 98.3% 18.1% 0.0% 2.8% 2.8% 31 Facilities Maintenance 100.0% 17.8% 0.0% 0.0% 0.0% 56
*Indicates share of full-time domestic U.S. employees working at organizations that engage in international sourcing from internal sources (affiliates), external sources (external suppliers), or both. Note: These statistics exclude observations from organizations that do not have costs in the particular business function in question. Thus, the statistics represent the share of full-time domestic U.S. employees working at organizations that engage in external sourcing and have costs in the business function in question.

The 2010 National Organizations Survey
54
Table 28: Full Data Set - Distribution of International Sourcing Location Types for Organization of Typical Full-Time Domestic U.S. Employee, by Industry and Business Function
Industry Business Function Industrialized
Economies SD Emerging
Economies SD Developing Economies SD N
Goods-Producing Primary Business Function 69.3% 31.8% 15.7% 28.6% 16.7% 22.2% 32 Research and Development 83.3% 24.4% 7.9% 21.1% 13.3% 19.8% 25 Sales and Marketing 82.1% 27.9% 5.3% 7.6% 14.6% 24.3% 28 Transportation Services 77.9% 20.1% 9.2% 11.8% 14.3% 16.5% 28 Customer & After-sales Service 89.1% 14.9% 5.2% 7.9% 8.7% 10.8% 24 Management, Admin, and Back-office 78.2% 29.4% 10.9% 25.5% 11.5% 14.0% 30 Information Technology Systems 65.5% 38.5% 12.1% 26.5% 21.4% 28.4% 27 Facilities Maintenance 74.4% 30.5% 12.5% 27.1% 10.1% 13.0% 23 Non-Goods-Producing Primary Business Function 48.5% 42.1% 12.6% 21.2% 38.5% 35.7% 27
Research and Development 49.8% 36.5% 11.9% 9.7% 39.6% 32.4% 14 Sales and Marketing 54.0% 42.6% 17.1% 25.0% 31.1% 30.5% 23 Transportation Services 47.7% 34.2% 18.1% 16.2% 32.4% 23.6% 13 Customer & After-sales Service 33.4% 40.8% 15.6% 22.7% 37.8% 28.1% 14 Management, Admin, and Back-office 47.4% 42.2% 13.9% 29.4% 29.8% 35.2% 16 Information Technology Systems 23.4% 29.3% 13.9% 24.0% 53.7% 39.1% 19 Facilities Maintenance 75.6% 25.2% 12.5% 15.3% 25.2% 16.8% 6
Table 29: GSS Data Set - Distribution of International Sourcing Location Types for Organization of Typical Full-Time Domestic U.S. Employee, by Industry and Business Function
Industry Business Function Industrialized
Economies SD Emerging
Economies SD Developing Economies SD N
Goods-Producing Primary Business Function 67.6% 32.0% 16.8% 23.4% 13.9% 26.9% 16 Research and Development 78.8% 28.2% 12.0% 21.6% 4.8% 11.9% 11 Sales and Marketing 80.1% 26.8% 12.7% 26.4% 5.2% 7.5% 14 Transportation Services 76.5% 23.8% 13.0% 15.7% 9.1% 10.8% 14 Customer & After-sales Service 86.1% 16.9% 5.3% 7.4% 5.6% 8.2% 11 Management, Admin, and Back-office 77.6% 27.1% 7.8% 9.2% 14.0% 29.2% 14 Information Technology Systems 66.5% 34.3% 19.0% 31.1% 15.6% 31.4% 11 Facilities Maintenance 77.4% 28.1% 11.0% 15.0% 14.6% 29.7% 13 Non-Goods-Producing Primary Business Function 48.9% 39.9% 39.4% 40.4% 12.2% 24.7% 14
Research and Development 48.5% 37.8% 40.2% 36.4% 10.0% 7.0% 8 Sales and Marketing 51.8% 39.4% 29.8% 33.9% 16.2% 32.3% 10 Transportation Services 49.4% 32.5% 37.1% 25.5% 15.2% 14.9% 6 Customer & After-sales Service 46.7% 37.2% 40.7% 28.8% 25.9% 30.1% 6 Management, Admin, and Back-office 56.3% 38.4% 37.3% 39.7% 15.4% 34.9% 8 Information Technology Systems 32.4% 32.4% 55.1% 41.2% 21.5% 36.6% 7 Facilities Maintenance 62.3% 25.4% 23.1% 26.5% 1.4% 1.3% 2
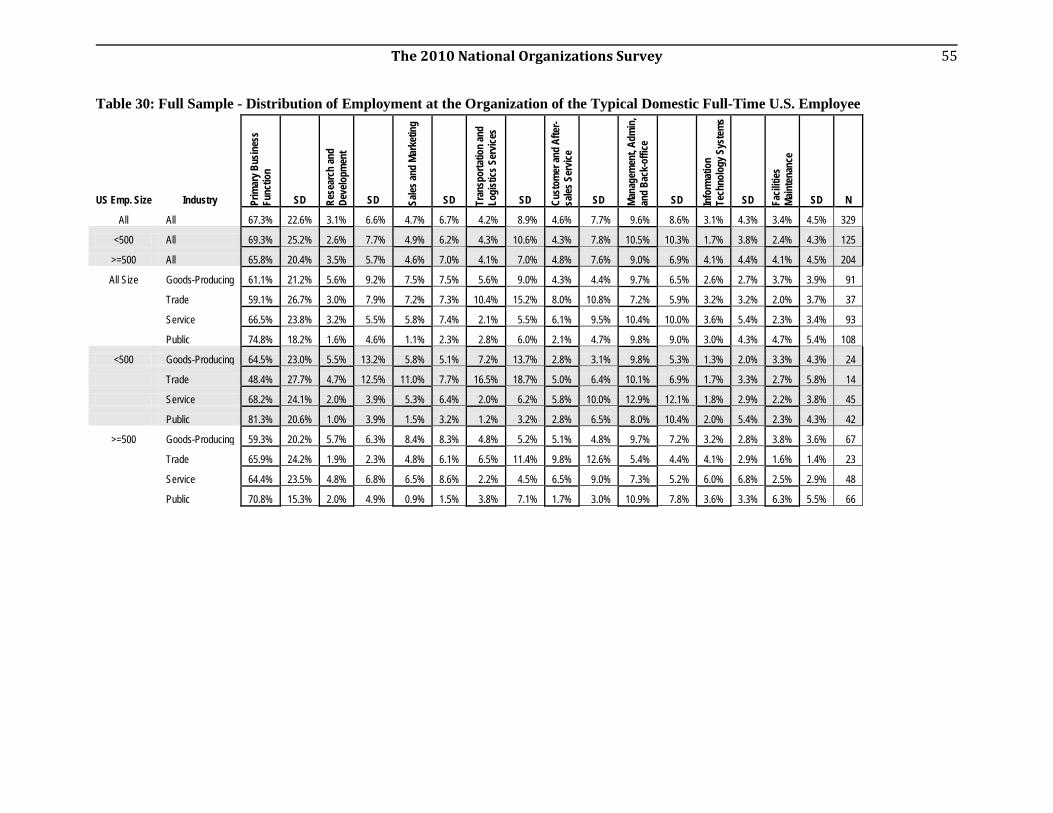
The 2010 National Organizations Survey
55
Table 30: Full Sample - Distribution of Employment at the Organization of the Typical Domestic Full-Time U.S. Employee
US Emp. Size Industry Prim
ary B
usin
ess
Func
tion
SD Rese
arch
and
Deve
lopm
ent
SD Sales
and
Mark
etin
g
SD Tran
spor
tatio
n an
d Lo
gist
ics S
ervic
es
SD Cust
omer
and
Afte
r-sa
les S
ervic
e
SD Mana
gem
ent,
Adm
in,
and
Back
-offi
ce
SD Info
rmat
ion
Tech
nolo
gy S
yste
ms
SD Facil
ities
Ma
inte
nanc
e
SD N
All All 67.3% 22.6% 3.1% 6.6% 4.7% 6.7% 4.2% 8.9% 4.6% 7.7% 9.6% 8.6% 3.1% 4.3% 3.4% 4.5% 329
<500 All 69.3% 25.2% 2.6% 7.7% 4.9% 6.2% 4.3% 10.6% 4.3% 7.8% 10.5% 10.3% 1.7% 3.8% 2.4% 4.3% 125
>=500 All 65.8% 20.4% 3.5% 5.7% 4.6% 7.0% 4.1% 7.0% 4.8% 7.6% 9.0% 6.9% 4.1% 4.4% 4.1% 4.5% 204
All Size Goods-Producing 61.1% 21.2% 5.6% 9.2% 7.5% 7.5% 5.6% 9.0% 4.3% 4.4% 9.7% 6.5% 2.6% 2.7% 3.7% 3.9% 91
Trade 59.1% 26.7% 3.0% 7.9% 7.2% 7.3% 10.4% 15.2% 8.0% 10.8% 7.2% 5.9% 3.2% 3.2% 2.0% 3.7% 37
Service 66.5% 23.8% 3.2% 5.5% 5.8% 7.4% 2.1% 5.5% 6.1% 9.5% 10.4% 10.0% 3.6% 5.4% 2.3% 3.4% 93
Public 74.8% 18.2% 1.6% 4.6% 1.1% 2.3% 2.8% 6.0% 2.1% 4.7% 9.8% 9.0% 3.0% 4.3% 4.7% 5.4% 108
<500 Goods-Producing 64.5% 23.0% 5.5% 13.2% 5.8% 5.1% 7.2% 13.7% 2.8% 3.1% 9.8% 5.3% 1.3% 2.0% 3.3% 4.3% 24
Trade 48.4% 27.7% 4.7% 12.5% 11.0% 7.7% 16.5% 18.7% 5.0% 6.4% 10.1% 6.9% 1.7% 3.3% 2.7% 5.8% 14
Service 68.2% 24.1% 2.0% 3.9% 5.3% 6.4% 2.0% 6.2% 5.8% 10.0% 12.9% 12.1% 1.8% 2.9% 2.2% 3.8% 45
Public 81.3% 20.6% 1.0% 3.9% 1.5% 3.2% 1.2% 3.2% 2.8% 6.5% 8.0% 10.4% 2.0% 5.4% 2.3% 4.3% 42
>=500 Goods-Producing 59.3% 20.2% 5.7% 6.3% 8.4% 8.3% 4.8% 5.2% 5.1% 4.8% 9.7% 7.2% 3.2% 2.8% 3.8% 3.6% 67
Trade 65.9% 24.2% 1.9% 2.3% 4.8% 6.1% 6.5% 11.4% 9.8% 12.6% 5.4% 4.4% 4.1% 2.9% 1.6% 1.4% 23
Service 64.4% 23.5% 4.8% 6.8% 6.5% 8.6% 2.2% 4.5% 6.5% 9.0% 7.3% 5.2% 6.0% 6.8% 2.5% 2.9% 48
Public 70.8% 15.3% 2.0% 4.9% 0.9% 1.5% 3.8% 7.1% 1.7% 3.0% 10.9% 7.8% 3.6% 3.3% 6.3% 5.5% 66
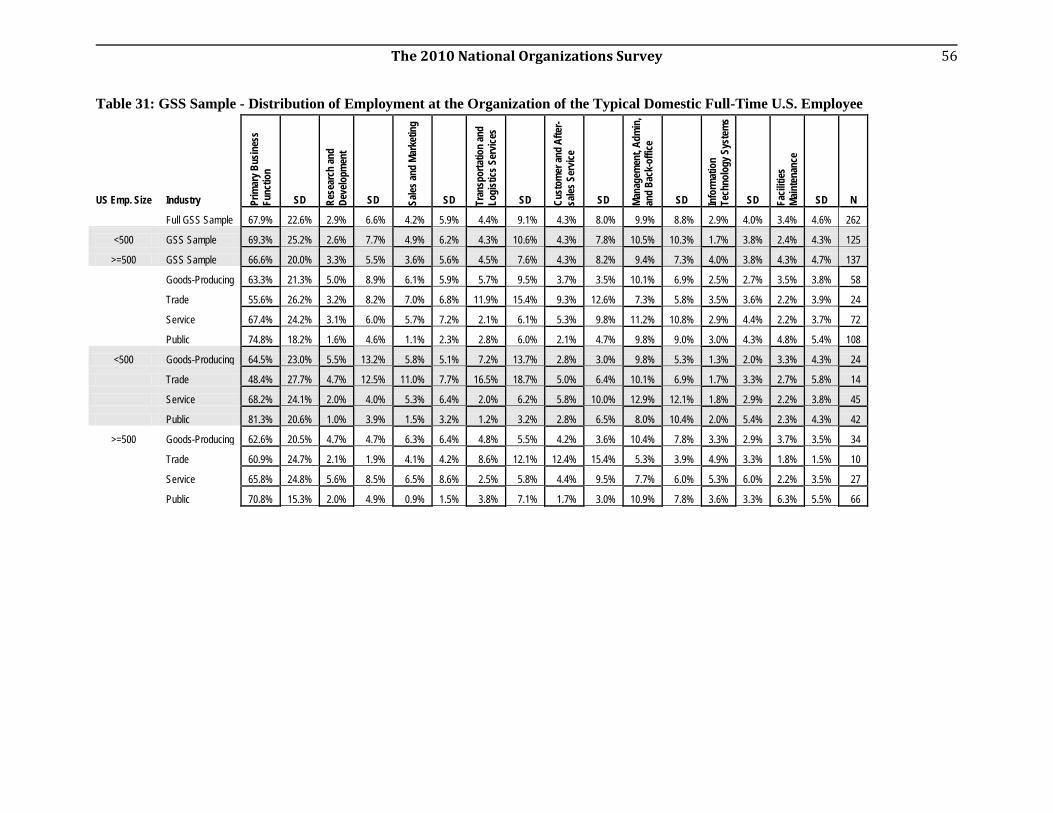
The 2010 National Organizations Survey
56
Table 31: GSS Sample - Distribution of Employment at the Organization of the Typical Domestic Full-Time U.S. Employee
US Emp. Size Industry Prim
ary B
usin
ess
Func
tion
SD Rese
arch
and
Deve
lopm
ent
SD Sales
and
Mark
etin
g
SD Tran
spor
tatio
n an
d Lo
gist
ics S
ervic
es
SD Cust
omer
and
Afte
r-sa
les S
ervic
e
SD Mana
gem
ent,
Adm
in,
and
Back
-offi
ce
SD Info
rmat
ion
Tech
nolo
gy S
yste
ms
SD Facil
ities
Ma
inte
nanc
e
SD N
Full GSS Sample 67.9% 22.6% 2.9% 6.6% 4.2% 5.9% 4.4% 9.1% 4.3% 8.0% 9.9% 8.8% 2.9% 4.0% 3.4% 4.6% 262
<500 GSS Sample 69.3% 25.2% 2.6% 7.7% 4.9% 6.2% 4.3% 10.6% 4.3% 7.8% 10.5% 10.3% 1.7% 3.8% 2.4% 4.3% 125
>=500 GSS Sample 66.6% 20.0% 3.3% 5.5% 3.6% 5.6% 4.5% 7.6% 4.3% 8.2% 9.4% 7.3% 4.0% 3.8% 4.3% 4.7% 137
Goods-Producing 63.3% 21.3% 5.0% 8.9% 6.1% 5.9% 5.7% 9.5% 3.7% 3.5% 10.1% 6.9% 2.5% 2.7% 3.5% 3.8% 58
Trade 55.6% 26.2% 3.2% 8.2% 7.0% 6.8% 11.9% 15.4% 9.3% 12.6% 7.3% 5.8% 3.5% 3.6% 2.2% 3.9% 24
Service 67.4% 24.2% 3.1% 6.0% 5.7% 7.2% 2.1% 6.1% 5.3% 9.8% 11.2% 10.8% 2.9% 4.4% 2.2% 3.7% 72
Public 74.8% 18.2% 1.6% 4.6% 1.1% 2.3% 2.8% 6.0% 2.1% 4.7% 9.8% 9.0% 3.0% 4.3% 4.8% 5.4% 108
<500 Goods-Producing 64.5% 23.0% 5.5% 13.2% 5.8% 5.1% 7.2% 13.7% 2.8% 3.0% 9.8% 5.3% 1.3% 2.0% 3.3% 4.3% 24
Trade 48.4% 27.7% 4.7% 12.5% 11.0% 7.7% 16.5% 18.7% 5.0% 6.4% 10.1% 6.9% 1.7% 3.3% 2.7% 5.8% 14
Service 68.2% 24.1% 2.0% 4.0% 5.3% 6.4% 2.0% 6.2% 5.8% 10.0% 12.9% 12.1% 1.8% 2.9% 2.2% 3.8% 45
Public 81.3% 20.6% 1.0% 3.9% 1.5% 3.2% 1.2% 3.2% 2.8% 6.5% 8.0% 10.4% 2.0% 5.4% 2.3% 4.3% 42
>=500 Goods-Producing 62.6% 20.5% 4.7% 4.7% 6.3% 6.4% 4.8% 5.5% 4.2% 3.6% 10.4% 7.8% 3.3% 2.9% 3.7% 3.5% 34
Trade 60.9% 24.7% 2.1% 1.9% 4.1% 4.2% 8.6% 12.1% 12.4% 15.4% 5.3% 3.9% 4.9% 3.3% 1.8% 1.5% 10
Service 65.8% 24.8% 5.6% 8.5% 6.5% 8.6% 2.5% 5.8% 4.4% 9.5% 7.7% 6.0% 5.3% 6.0% 2.2% 3.5% 27
Public 70.8% 15.3% 2.0% 4.9% 0.9% 1.5% 3.8% 7.1% 1.7% 3.0% 10.9% 7.8% 3.6% 3.3% 6.3% 5.5% 66
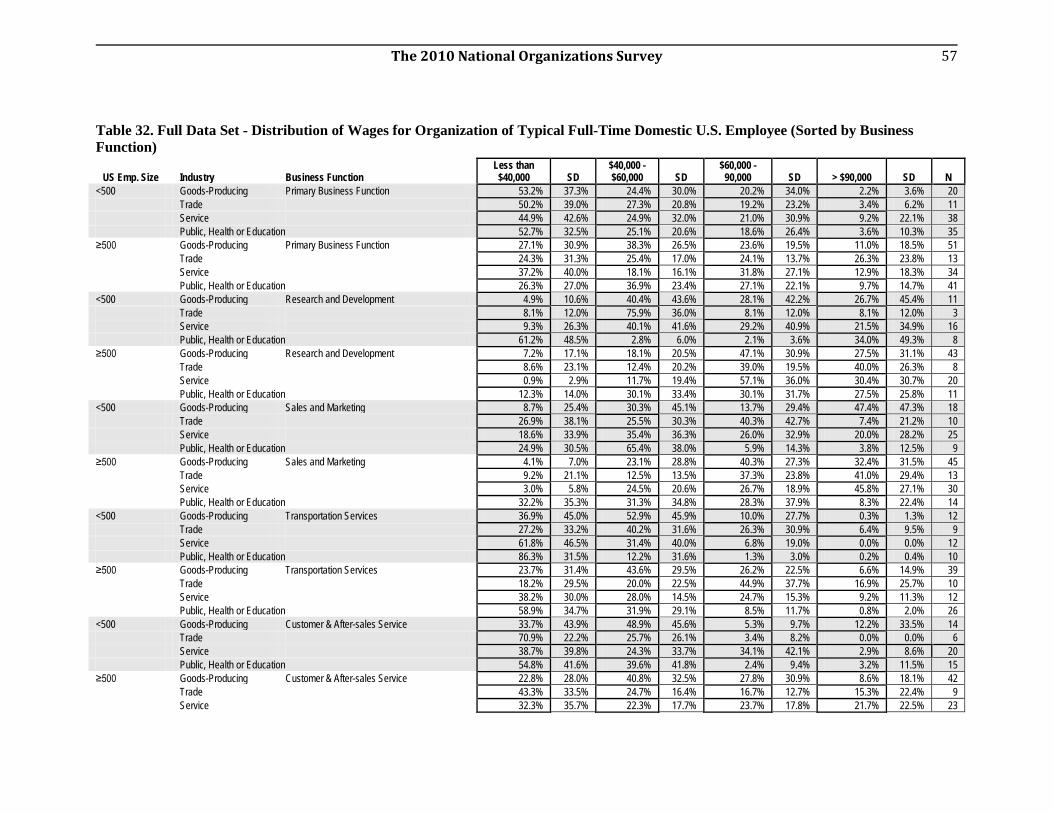
The 2010 National Organizations Survey
57
Table 32. Full Data Set - Distribution of Wages for Organization of Typical Full-Time Domestic U.S. Employee (Sorted by Business Function)
US Emp. Size Industry Business Function Less than $40,000 SD
$40,000 - $60,000 SD
$60,000 - 90,000 SD > $90,000 SD N
<500 Goods-Producing Primary Business Function 53.2% 37.3% 24.4% 30.0% 20.2% 34.0% 2.2% 3.6% 20 Trade 50.2% 39.0% 27.3% 20.8% 19.2% 23.2% 3.4% 6.2% 11 Service 44.9% 42.6% 24.9% 32.0% 21.0% 30.9% 9.2% 22.1% 38 Public, Health or Education 52.7% 32.5% 25.1% 20.6% 18.6% 26.4% 3.6% 10.3% 35 ≥500 Goods-Producing Primary Business Function 27.1% 30.9% 38.3% 26.5% 23.6% 19.5% 11.0% 18.5% 51 Trade 24.3% 31.3% 25.4% 17.0% 24.1% 13.7% 26.3% 23.8% 13 Service 37.2% 40.0% 18.1% 16.1% 31.8% 27.1% 12.9% 18.3% 34 Public, Health or Education 26.3% 27.0% 36.9% 23.4% 27.1% 22.1% 9.7% 14.7% 41 <500 Goods-Producing Research and Development 4.9% 10.6% 40.4% 43.6% 28.1% 42.2% 26.7% 45.4% 11 Trade 8.1% 12.0% 75.9% 36.0% 8.1% 12.0% 8.1% 12.0% 3 Service 9.3% 26.3% 40.1% 41.6% 29.2% 40.9% 21.5% 34.9% 16 Public, Health or Education 61.2% 48.5% 2.8% 6.0% 2.1% 3.6% 34.0% 49.3% 8 ≥500 Goods-Producing Research and Development 7.2% 17.1% 18.1% 20.5% 47.1% 30.9% 27.5% 31.1% 43 Trade 8.6% 23.1% 12.4% 20.2% 39.0% 19.5% 40.0% 26.3% 8 Service 0.9% 2.9% 11.7% 19.4% 57.1% 36.0% 30.4% 30.7% 20 Public, Health or Education 12.3% 14.0% 30.1% 33.4% 30.1% 31.7% 27.5% 25.8% 11 <500 Goods-Producing Sales and Marketing 8.7% 25.4% 30.3% 45.1% 13.7% 29.4% 47.4% 47.3% 18 Trade 26.9% 38.1% 25.5% 30.3% 40.3% 42.7% 7.4% 21.2% 10 Service 18.6% 33.9% 35.4% 36.3% 26.0% 32.9% 20.0% 28.2% 25 Public, Health or Education 24.9% 30.5% 65.4% 38.0% 5.9% 14.3% 3.8% 12.5% 9 ≥500 Goods-Producing Sales and Marketing 4.1% 7.0% 23.1% 28.8% 40.3% 27.3% 32.4% 31.5% 45 Trade 9.2% 21.1% 12.5% 13.5% 37.3% 23.8% 41.0% 29.4% 13 Service 3.0% 5.8% 24.5% 20.6% 26.7% 18.9% 45.8% 27.1% 30 Public, Health or Education 32.2% 35.3% 31.3% 34.8% 28.3% 37.9% 8.3% 22.4% 14 <500 Goods-Producing Transportation Services 36.9% 45.0% 52.9% 45.9% 10.0% 27.7% 0.3% 1.3% 12 Trade 27.2% 33.2% 40.2% 31.6% 26.3% 30.9% 6.4% 9.5% 9 Service 61.8% 46.5% 31.4% 40.0% 6.8% 19.0% 0.0% 0.0% 12 Public, Health or Education 86.3% 31.5% 12.2% 31.6% 1.3% 3.0% 0.2% 0.4% 10 ≥500 Goods-Producing Transportation Services 23.7% 31.4% 43.6% 29.5% 26.2% 22.5% 6.6% 14.9% 39 Trade 18.2% 29.5% 20.0% 22.5% 44.9% 37.7% 16.9% 25.7% 10 Service 38.2% 30.0% 28.0% 14.5% 24.7% 15.3% 9.2% 11.3% 12 Public, Health or Education 58.9% 34.7% 31.9% 29.1% 8.5% 11.7% 0.8% 2.0% 26 <500 Goods-Producing Customer & After-sales Service 33.7% 43.9% 48.9% 45.6% 5.3% 9.7% 12.2% 33.5% 14 Trade 70.9% 22.2% 25.7% 26.1% 3.4% 8.2% 0.0% 0.0% 6 Service 38.7% 39.8% 24.3% 33.7% 34.1% 42.1% 2.9% 8.6% 20 Public, Health or Education 54.8% 41.6% 39.6% 41.8% 2.4% 9.4% 3.2% 11.5% 15 ≥500 Goods-Producing Customer & After-sales Service 22.8% 28.0% 40.8% 32.5% 27.8% 30.9% 8.6% 18.1% 42 Trade 43.3% 33.5% 24.7% 16.4% 16.7% 12.7% 15.3% 22.4% 9 Service 32.3% 35.7% 22.3% 17.7% 23.7% 17.8% 21.7% 22.5% 23

The 2010 National Organizations Survey
58
US Emp. Size Industry Business Function Less than $40,000 SD
$40,000 - $60,000 SD
$60,000 - 90,000 SD > $90,000 SD N
Public, Health or Education 55.0% 38.8% 23.0% 22.6% 17.8% 32.3% 4.3% 12.7% 19 <500 Goods-Producing Management, Admin, and Back-office 18.6% 29.3% 44.2% 40.9% 14.0% 19.2% 23.2% 33.1% 19 Service 36.9% 36.3% 28.5% 23.6% 22.3% 19.4% 12.4% 21.8% 34 Trade 31.7% 26.9% 28.5% 18.7% 30.1% 24.0% 9.7% 17.0% 10 Public, Health or Education 35.3% 35.0% 27.6% 26.0% 30.5% 34.7% 6.6% 10.9% 27 ≥500 Goods-Producing Management, Admin, and Back-office 9.7% 11.1% 21.7% 16.6% 39.0% 22.3% 29.5% 28.2% 50 Trade 6.0% 8.0% 26.4% 20.5% 40.0% 22.3% 27.6% 17.7% 13 Service 10.9% 20.9% 24.0% 14.7% 35.4% 17.4% 29.7% 23.7% 31 Public, Health or Education 22.2% 25.1% 33.3% 25.6% 30.3% 26.3% 14.2% 18.3% 40 <500 Goods-Producing Information Technology Systems 0.0% 0.0% 30.0% 41.3% 48.6% 45.7% 21.4% 40.5% 11 Trade 22.7% 38.1% 19.4% 30.2% 57.9% 46.2% 0.0% 0.0% 7 Service 11.2% 29.2% 23.6% 36.4% 48.2% 42.1% 17.0% 35.0% 20 Public, Health or Education 23.4% 38.3% 40.1% 46.4% 25.6% 37.6% 10.9% 28.2% 15 ≥500 Goods-Producing Information Technology Systems 7.5% 12.9% 27.4% 26.1% 42.0% 28.2% 23.1% 31.2% 43 Trade 10.9% 20.6% 19.8% 21.0% 32.2% 15.5% 37.1% 22.4% 11 Service 9.5% 17.4% 17.9% 17.5% 43.9% 23.6% 28.7% 22.2% 25 Public, Health or Education 13.2% 2-.9% 49.1% 31.7% 30.7% 32.0% 7.0% 13.0% 41 <500 Goods-Producing Facilities Maintenance 37.9% 44.3% 35.7% 36.4% 26.4% 34.1% 0.0% 0.0% 10 Trade 18.3% 39.0% 49.5% 45.4% 32.2% 36.6% 0.0% 0.0% 3 Service 55.3% 43.5% 34.4% 41.7% 9.7% 27.5% 0.6% 2.4% 17 Public, Health or Education 77.3% 36.2% 12.6% 23.7% 6.9% 20.8% 3.1% 10.0% 21 ≥500 Goods-Producing Facilities Maintenance 25.7% 32.6% 45.2% 31.7% 25.5% 27.9% 3.7% 9.3% 39 Trade 16.0% 31.3% 26.6% 23.6% 39.7% 30.0% 17.7% 25.0% 10 Service 41.5% 22.1% 29.7% 14.9% 17.0% 8.9% 11.8% 12.2% 16 Public, Health or Education 50.2% 33.5% 35.8% 30.3% 11.1% 18.6% 2.9% 6.5% 39

The 2010 National Organizations Survey
59
Table 33. GSS Data Set - Distribution of Wages for Organization of Typical Full-Time Domestic U.S. Employee (Sorted by Business Function)
US Emp. Size Industry Business Function Less than $40,000 SD
$40,000 - $60,000 SD
$60,000 - 90,000 SD > $90,000 SD N
<500 Goods-Producing Primary Business Function 53.2% 37.3% 24.4% 30.0% 20.2% 34.0% 2.2% 3.6% 20 Trade 50.2% 39.0% 27.3% 20.8% 19.2% 23.2% 3.4% 6.2% 11 Service 44.9% 42.6% 24.9% 32.0% 21.0% 30.9% 9.2% 22.1% 38 Public, Health or Education 52.7% 32.5% 25.1% 20.6% 18.6% 26.4% 3.6% 10.3% 35 ≥500 Goods-Producing Primary Business Function 30.0% 33.2% 38.3% 26.9% 24.0% 21.5% 7.7% 12.7% 26 Trade 46.8% 40.7% 14.9% 7.7% 26.8% 23.3% 11.5% 10.6% 5 Service 39.4% 41.4% 15.8% 17.0% 30.4% 30.1% 14.5% 24.1% 17 Public, Health or Education 26.3% 27.0% 36.9% 23.4% 27.1% 22.1% 9.7% 14.7% 41 <500 Goods-Producing Research and Development 4.9% 10.6% 40.4% 43.6% 28.1% 42.2% 26.7% 45.4% 11 Trade 8.1% 12.0% 75.9% 36.0% 8.1% 12.0% 8.1% 12.0% 3 Service 9.3% 26.3% 40.1% 41.6% 29.2% 40.9% 21.5% 34.9% 16 Public, Health or Education 61.2% 48.5% 2.8% 6.0% 2.1% 3.6% 34.0% 49.3% 8 ≥500 Goods-Producing Research and Development 8.4% 18.6% 19.2% 21.9% 44.4% 31.6% 28.1% 32.3% 22 Trade 21.7% 39.4% 22.0% 16.5% 31.2% 20.1% 25.1% 33.5% 3 Service 0.0% 0.0% 11.5% 21.4% 56.6% 40.3% 31.9% 33.8% 12 Public, Health or Education 12.3% 14.0% 30.1% 33.4% 30.1% 31.7% 27.5% 25.8% 11 <500 Goods-Producing Sales and Marketing 8.7% 25.4% 30.3% 45.1% 13.7% 29.4% 47.4% 47.3% 18 Trade 26.9% 38.1% 25.5% 20.3% 40.3% 42.7% 7.4% 21.2% 10 Service 18.6% 33.9% 35.4% 36.3% 26.0% 32.9% 20.0% 28.2% 25 Public, Health or Education 24.9% 30.5% 65.4% 38.0% 5.9% 14.3% 3.8% 12.5% 9 ≥500 Goods-Producing Sales and Marketing 4.8% 7.6% 26.6% 31.1% 37.5% 25.6% 31.2% 31.2% 22 Trade 19.4% 32.3% 15.9% 14.4% 41.9% 30.4% 22.9% 27.7% 5 Service 0.6% 2.4% 20.1% 18.5% 24.1% 19.2% 55.2% 27.6% 14 Public, Health or Education 32.2% 35.3% 31.3% 34.8% 28.3% 37.9% 8.3% 22.4% 14 <500 Goods-Producing Transportation Services 36.9% 45.0% 52.9% 45.9% 10.0% 27.7% 0.3% 1.3% 12 Trade 27.2% 27.2% 40.2% 31.6% 26.3% 30.9% 6.4% 9.5% 9 Service 61.8% 46.5% 31.4% 40.0% 6.8% 19.0% 0.0% 0.0% 12 Public, Health or Education 86.3% 31.5% 12.2% 31.6% 1.3% 3.0% 0.2% 0.4% 10 ≥500 Goods-Producing Transportation Services 25.6% 33.4% 47.6% 30.1% 23.8% 23.5% 3.1% 8.3% 20 Trade 34.3% 38.2% 31.4% 29.8% 14.8% 12.0% 19.5% 28.7% 5 Service 34.3% 30.1% 29.7% 16.5% 25.5% 14.6% 10.4% 12.3% 6 Public, Health or Education 58.9% 34.7% 31.9% 29.1% 8.5% 11.7% 0.8% 2.0% 26 <500 Goods-Producing Customer & After-sales Service 33.7% 43.9% 48.9% 45.6% 5.3% 9.7% 12.2% 33.5% 14 Trade 70.9% 70.9% 25.7% 26.1% 3.4% 8.2% 0.0% 0.0% 6 Service 38.7% 39.8% 24.3% 33.7% 34.1% 42.1% 2.9% 8.6% 20 Public, Health or Education 54.8% 41.6% 39.6% 41.8% 2.4% 9.4% 3.2% 11.5% 15 ≥500 Goods-Producing Customer & After-sales Service 22.9% 28.8% 41.0% 33.2% 30.2% 34.0% 6.0% 12.9% 21 Trade 34.9% 31.4% 29.6% 11.9% 23.9% 15.7% 11.7% 8.8% 3 Service 35.9% 41.9% 17.9% 20.1% 26.1% 22.0% 20.2% 26.0% 9 Public, Health or Education 55.0% 38.8% 23.0% 22.6% 17.8% 32.3% 4.3% 12.7% 19 <500 Goods-Producing Mgmt, Admin, and Back-office 18.6% 29.3% 44.2% 40.9% 14.0% 19.2% 23.2% 33.1% 19

The 2010 National Organizations Survey
60
US Emp. Size Industry Business Function Less than $40,000 SD
$40,000 - $60,000 SD
$60,000 - 90,000 SD > $90,000 SD N
Service 36.9% 36.3% 28.5% 23.6% 22.3% 19.4% 12.4% 21.8% 34 Trade 31.7% 31.7% 28.5% 18.7% 30.1% 24.0% 9.7% 17.0% 10 Public, Health or Education 35.3% 35.0% 27.6% 26.0% 30.5% 34.7% 6.6% 10.9% 27 ≥500 Goods-Producing Mgmt, Admin, and Back-office 10.2% 11.7% 21.6% 16.8% 38.1% 23.4% 30.0% 28.9% 26 Trade 9.4% 8.6% 38.4% 25.5% 35.9% 25.8% 16.4% 6.6% 5 Service 12.3% 24.8% 24.3% 16.2% 34.3% 19.5% 29.1% 26.5% 16 Public, Health or Education 22.2% 25.1% 33.3% 25.6% 30.3% 26.3% 14.2% 18.3% 40 <500 Goods-Producing IT Services 0.0% 0.0% 30.0% 41.3% 48.6% 45.7% 21.4% 40.5% 11 Trade 22.7% 22.7% 19.4% 30.2% 57.9% 46.2% 0.0% 0.0% 7 Service 11.2% 29.2% 23.6% 36.4% 48.2% 42.1% 17.0% 35.0% 20 Public, Health or Education 23.4% 38.3% 40.1% 46.4% 25.6% 37.6% 10.9% 28.2% 15 ≥500 Goods-Producing IT Services 7.6% 13.8% 27.8% 27.6% 40.6% 30.0% 24.0% 33.3% 24 Trade 18.2% 32.0% 19.9% 33.5% 28.4% 20.2% 33.5% 30.7% 5 Service 11.1% 20.5% 16.3% 19.8% 44.6% 28.2% 28.0% 27.2% 14 Public, Health or Education 13.2% 20.9% 49.1% 31.7% 30.7% 32.0% 7.0% 13.0% 41 <500 Goods-Producing Facilities Maintenance 37.9% 44.3% 35.7% 36.4% 26.4% 34.1% 0.0% 0.0% 10 Trade 18.3% 18.3% 49.5% 45.4% 32.2% 36.6% 0.0% 0.0% 3 Service 55.3% 43.5% 34.4% 41.7% 9.7% 27.5% 0.6% 2.4% 17 Public, Health or Education 77.3% 36.2% 12.6% 23.7% 6.9% 20.8% 3.1% 10.0% 21 ≥500 Goods-Producing Facilities Maintenance 28.0% 33.8% 42.9% 34.1% 26.0% 30.8% 3.1% 10.7% 22 Trade 32.9% 46.7% 20.2% 23.4% 28.5% 21.2% 18.4% 29.4% 4 Service 51.0% 20.1% 30.8% 17.9% 14.0% 8.5% 4.2% 5.8% 10 Public, Health or Education 50.2% 33.5% 35.8% 30.3% 11.1% 18.6% 2.9% 6.5% 39

The 2010 National Organizations Survey
61
Table 34. Full Data Set - Share of Full-Time U.S. Domestic Employees at Organizations that Have Various Types of Retirement Benefits US Emp. Size Industry
Both Defined Benefit and Contribution
SD Defined Benefit SD Defined Contribution SD Other/Refused SD No Retirement
Benefits SD N
All Sizes All Industries 26.4% 44.2% 15.9% 36.6% 35.2% 47.8% 4.6% 20.9% 17.9% 38.4% 320 <500 14.3% 35.2% 12.9% 33.7% 40.4% 49.3% 7.6% 26.6% 24.8% 43.3% 125 ≥500 36.2% 48.2% 18.3% 38.7% 31.0% 46.4% 2.1% 14.3% 12.5% 33.1% 195 All Sizes Goods Producing Firms 26.2% 44.2% 0.0% 0.0% 62.2% 48.8% 1.0% 9.8% 10.7% 31.1% 88 Trade 32.1% 47.3% 7.2% 26.2% 22.3% 42.2% 5.8% 23.8% 32.6% 47.5% 36 Service 15.3% 36.1% 15.1% 36.0% 37.0% 48.6% 3.5% 18.5% 29.1% 45.7% 89 Public, Health or Edu. 33.9% 47.5% 28.9% 45.5% 22.8% 2.2% 7.0% 25.7% 7.4% 26.4% 107 <500 Goods Producing Firms 12.0% 33.2% 0.0% 0.0% 65.3% 48.6% 2.7% 16.6% 20.0% 40.9% 24 Trade 13.1% 35.0% 7.7% 27.7% 41.7% 51.2% 14.1% 36.1% 23.4% 43.9% 14 Service 12.7% 33.7% 5.5% 23.1% 40.1% 49.6% 2.0% 14.0% 39.7% 49.5% 45 Public, Health or Edu. 18.0% 38.9% 31.1% 46.8% 27.5% 45.2% 14.9% 36.0% 8.6% 28.3% 42 ≥500 Goods Producing Firms 33.8% 47.7% 0.0% 0.0% 60.6% 49.3% 0.0% 0.0% 5.6% 23.2% 64 Trade 45.4% 51.0% 6.9% 25.9% 8.6% 28.7% 0.0% 0.0% 39.0% 49.9% 22 Service 19.0% 39.7% 29.0% 45.9% 32.5% 47.4% 5.8% 23.7% 13.7% 34.7% 44 Public, Health or Edu. 44.0% 50.0% 27.5% 45.0% 19.8% 40.2% 2.0% 14.2% 6.7% 25.2% 65
Table 35. GSS Data Set - Share of Full-Time U.S. Domestic Employees at Organizations that Have Various Types of Retirement Benefits US Emp. Size Industry
Both Defined Benefit and Contribution
SD Defined Benefit SD Defined Contribution SD Other/Refused SD No Retirement
Benefits SD N
All Sizes All Industries 26.6% 44.3% 14.2% 35.0% 35.4% 47.9% 5.1% 21.9% 18.8% 39.1% 256 <500 14.3% 35.2% 12.9% 33.7% 40.4% 49.3% 7.6% 26.6% 24.8% 43.3% 125 ≥500 38.7% 48.9% 15.4% 36.2% 30.5% 46.2% 2.5% 15.8% 12.9% 33.6% 131 All Sizes Goods Producing Firms 21.4% 41.4% 0.0% 0.0% 65.4% 48.0% 1.1% 10.4% 12.2% 33.0% 57 Trade 29.7% 46.7% 3.8% 19.6% 26.2% 44.9% 7.0% 26.1% 33.3% 48.2% 23 Service 18.7% 39.3% 8.0% 27.2% 35.3% 48.1% 4.3% 20.4% 33.8% 47.6% 69 Public, Health or Edu. 33.9% 47.5% 28.9% 45.5% 22.8% 42.2% 7.0% 25.7% 7.4% 26.4% 107 <500 Goods Producing Firms 12.0% 33.2% 0.0% 0.0% 65.3% 48.6% 2.7% 16.6% 20.0% 40.9% 24 Trade 13.1% 35.0% 7.7% 27.6% 41.7% 51.17% 14.1% 36.1% 23.4% 43.9% 14 Service 12.7% 33.7% 5.5% 23.1% 40.1% 49.6% 2.0% 14.0% 39.7% 49.5% 45 Public, Health or Edu. 18.0% 38.9% 31.1% 46.8% 27.5% 45.2% 14.9% 36.0% 8.6% 28.3% 42 ≥500 Goods Producing Firms 27.4% 45.3% 0.0% 0.0% 65.5% 48.3% 0.0% 0.0% 7.0% 26.0% 33 Trade 46.2% 52.9% 0.0% 0.0% 10.7% 32.8% 0.0% 0.0% 43.1% 52.5% 9 Service 34.4% 48.5% 14.3% 35.7% 22.7% 42.8% 10.4% 31.2% 18.2% 39.4% 24 Public, Health or Edu. 44.0% 50.0% 27.5% 45.0% 19.8% 40.2% 2.0% 14.2% 6.7% 25.2% 65

The 2010 National Organizations Survey
62
Table 36. Full Data Set - Share of Full-Time Domestic U.S. Employees that Work at Organizations that Have International Revenues
US Emp. Size Industry Have Int. Revenues SD
No Int. Revenues SD Refused SD Don't Know SD N
All Sizes All Industry 41.0% 49.3% 55.2% 49.8% 1.0% 9.7% 2.9% 16.8% 237 <500 20.4% 40.5% 73.3% 44.5% 1.2% 10.9% 5.2% 22.2% 87 ≥500 56.7% 49.7% 41.4% 49.4% 0.8% 8.8% 1.2% 10.8% 150 All Sizes Goods-Producing 66.9% 47.3% 30.9% 46.5% 0.9% 9.7% 1.3% 11.4% 91 Trade 48.3% 50.6% 49.2% 50.6% 2.5% 15.8% 0.0% 0.0% 39 Service 29.7% 46.0% 63.7% 48.4% 0.4% 4.7% 6.1% 24.1% 77 Public 0.0% 0.0% 97.9% 14.6% 0.0% 0.0% 2.1% 14.6% 30 <500 Goods-Producing 39.3% 49.9% 60.7% 49.9% 0.0% 0.0% 0.0% 0.0% 24 Trade 16.3% 38.4% 76.9% 43.7% 6.7% 26.0% 0.0% 0.0% 14 Service 19.0% 39.9% 69.1% 46.9% 0.0% 0.0% 11.9% 32.9% 32 Public 0.0% 0.0% 100.0% 0.0% 0.0% 0.0% 0.0% 0.0% 17 ≥500 Goods-Producing 81.0% 39.5% 15.6% 36.5% 1.4% 11.9% 2.0% 14.0% 67 Trade 67.0% 48.0% 33.0% 48.0% 0.0% 0.0% 0.0% 0.0% 25 Service 41.1% 49.8% 58.0% 49.9% 0.9% 9.6% 0.0% 0.0% 45 Public 0.0% 0.0% 95.5% 21.5% 0.0% 0.0% 4.5% 21.5% 13
Table 37. GSS Data Set - Share of Full-Time Domestic U.S. Employees that Work at Organizations that Have International Revenues
US Emp. Size Industry Have Int. Revenues SD
No Int. Revenues SD Refused SD Don't Know SD N
All Sizes All Industry 36.5% 48.3% 59.5% 49.2% 0.6% 7.7% 3.4% 18.1% 168 <500 20.4% 40.5% 73.3% 44.5% 1.2% 10.9% 5.2% 22.2% 87 ≥500 52.9% 50.2% 45.6% 50.1% 0.0% 0.0% 1.6% 12.4% 81 All Sizes Goods-Producing 67.0% 47.4% 31.5% 46.9% 0.0% 0.0% 1.5% 12.2% 58 Trade 35.7% 48.9% 61.5% 49.7% 2.8% 16.9% 0.0% 0.0% 25 Service 24.9% 43.6% 67.3% 47.4% 0.0% 0.0% 7.8% 27.1% 55 Public 0.0% 0.0% 97.9% 14.6% 0.0% 0.0% 2.1% 14.6% 30 <500 Goods-Producing 39.3% 49.9% 60.7% 49.9% 0.0% 0.0% 0.0% 0.0% 24 Trade 16.3% 38.4% 76.9% 43.7% 6.7% 26.0% 0.0% 0.0% 14 Service 19.0% 39.9% 69.1% 46.9% 0.0% 0.0% 11.9% 32.9% 32 Public 0.0% 0.0% 100.0% 0.0% 0.0% 0.0% 0.0% 0.0% 17 ≥500 Goods-Producing 84.2% 37.0% 13.4% 34.5% 0.0% 0.0% 2.4% 15.5% 34 Trade 49.6% 52.4% 50.4% 52.4% 0.0% 0.0% 0.0% 0.0% 11 Service 36.3% 49.2% 63.7% 49.2% 0.0% 0.0% 0.0% 0.0% 23 Public 0.0% 0.0% 95.5% 21.5% 0.0% 0.0% 4.5% 21.5% 13

The 2010 National Organizations Survey
63
Table 38. Full Data Set - Share of Full-Time Domestic U.S. Employees Working at Organizations that Have a % of Employees Unionized
US Emp. Size Industry <25% SD 26-50% SD 51%-
71% SD 76%-100% SD None SD Don't
Know SD Refused SD N
All Sizes All Industries 17.0% 37.6% 5.9% 23.6% 7.0% 25.5% 15.2% 35.9% 53.7% 49.9% 0.7% 8.2% 0.7% 8.1% 333 <500 3.5% 18.3% 3.3% 18.0% 5.9% 23.7% 12.7% 33.4% 73.8% 44.1% 0.0% 0.0% 0.8% 9.0% 125 ≥500 26.9% 44.5% 7.8% 26.9% 7.8% 26.9% 17.0% 37.7% 38.8% 48.8% 1.2% 10.8% 0.5% 7.3% 208 All Sizes Goods-Producing 23.6% 42.7% 12.5% 33.3% 5.0% 22.0% 4.6% 21.0% 49.5% 50.3% 3.3% 17.9% 1.5% 12.2% 91 Trade 19.7% 40.3% 2.1% 14.5% 6.3% 24.5% 10.6% 31.2% 58.9% 49.9% 0.0% 0.0% 2.5% 15.8% 39 Service 15.3% 36.2% 0.7% 8.1% 3.5% 18.6% 4.4% 20.5% 76.2% 42.8% 0.0% 0.0% 0.0% 0.0% 94 Public, Health or Education 13.6% 34.4% 8.1% 27.4% 11.4% 31.9% 32.5% 47.0% 34.5% 47.8% 0.0% 0.0% 0.0% 0.0% 109 <500 Goods-Producing 0.0% 0.0% 0.0% 0.0% 4.6% 21.3% 11.2% 32.3% 84.2% 37.2% 0.0% 0.0% 0.0% 0.0% 24 Trade 14.4% 36.5% 3.4% 18.8% 0.0% 0.0% 0.0% 0.0% 75.4% 0.0% 0.0% 0.0% 6.7% 26.0% 14 Service 4.2% 20.4% 0.0% 0.0% 0.0% 0.0% 4.1% 20.0% 91.7% 27.9% 0.0% 0.0% 0.0% 0.0% 45 Public, Health or Education 0.0% 0.0% 9.3% 29.3% 16.5% 37.6% 29.4% 46.1% 44.8% 50.3% 0.0% 0.0% 0.0% 0.0% 42 ≥500 Goods-Producing 35.6% 48.3% 19.0% 39.5% 5.3% 22.5% 1.2% 10.9% 31.7% 46.9% 5.0% 21.9% 2.3% 15.0% 67 Trade 22.8% 42.8% 1.3% 11.7% 9.9% 30.5% 16.8% 38.1% 49.1% 51.0% 0.0% 0.0% 0.0% 0.0% 25 Service 29.2% 46.0% 1.5% 12.2% 8.0% 27.4% 4.7% 21.4% 56.5% 50.1% 0.0% 0.0% 0.0% 0.0% 49 Public, Health or Education 21.8% 41.6% 7.4% 26.3% 8.3% 27.8% 34.4% 47.8% 28.2% 45.3% 0.0% 0.0% 0.0% 0.0% 67
Table 39. GSS Data Set - Share of Full-Time Domestic U.S. Employees Working at Organizations that Have a % of Employees Unionized
US Emp. Size Industry <25% SD 26-50% SD 51%-
71% SD 76%-100% SD None SD Don't
Know SD Refused SD N
All Sizes All Industries 15.1% 35.9% 5.4% 22.7% 7.0% 25.5% 16.0% 36.7% 55.2% 49.8% 0.6% 7.9% 0.7% 8.3% 264 <500 3.5% 18.3% 3.3% 18.0% 5.9% 23.7% 12.7% 33.4% 73.8% 44.1% 0.0% 0.0% 0.8% 9.0% 125 ≥500 25.4% 43.7% 7.3% 26.1% 7.9% 27.1% 18.8% 39.2% 38.8% 48.9% 1.2% 10.8% 0.6% 7.7% 139 All Sizes Goods-Producing 20.6% 40.8% 10.5% 30.9% 5.7% 23.4% 4.3% 20.4% 54.2% 50.3% 3.1% 17.5% 1.6% 12.6% 58 Trade 18.1% 39.3% 1.4% 12.1% 0.0% 0.0% 7.4% 26.7% 70.3% 46.6% 0.0% 0.0% 2.8% 16.9% 25 Service 12.0% 32.8% 0.0% 0.0% 5.1% 22.2% 5.3% 22.6% 77.6% 42.0% 0.0% 0.0% 0.0% 0.0% 72 Public, Health or Education 13.6% 34.4% 8.1% 27.3% 11.4% 31.9% 32.5% 47.0% 34.5% 47.8% 0.0% 0.0% 0.0% 0.0% 109 <500 Goods-Producing 0.0% 0.0% 0.0% 0.0% 4.6% 21.3% 11.2% 32.3% 84.2% 37.2% 0.0% 0.0% 0.0% 0.0% 24 Trade 14.4% 36.5% 3.4% 18.8% 0.0% 0.0% 0.0% 0.0% 75.4% 44.7% 0.0% 0.0% 6.7% 26.0% 14 Service 4.2% 20.4% 0.0% 0.0% 0.0% 0.0% 4.1% 20.0% 91.7% 27.9% 0.0% 0.0% 0.0% 0.0% 45 Public, Health or Education 0.0% 0.0% 9.3% 29.3% 16.5% 37.6% 29.4% 46.1% 44.9% 50.3% 0.0% 0.0% 0.0% 0.0% 42 ≥500 Goods-Producing 33.3% 47.8% 17.0% 38.1% 6.5% 24.9% 0.0% 0.0% 35.6% 48.6% 5.1% 22.2% 2.6% 16.0% 34 Trade 20.7% 42.5% 0.0% 0.0% 0.0% 0.0% 12.7% 34.9% 66.6% 49.5% 0.0% 0.0% 0.0% 0.0% 11 Service 28.6% 46.1% 0.0% 0.0% 16.0% 37.3% 7.9% 27.5% 47.5% 50.9% 0.0% 0.0% 0.0% 0.0% 27 Public, Health or Education 21.8% 41.6% 7.4% 26.3% 8.3% 27.8% 34.4% 47.8% 28.2% 45.3% 0.0% 0.0% 0.0% 0.0% 67

The 2010 National Organizations Survey
64
References Berger, Suzanne and the MIT Industrial Performance Center (2005). How We Compete, New York:
Doubleday. Berger, Suzanne and the MIT Task Force on Production in the Innovation Economy. 2013. Making in
America: From Innovation to Market. Cambridge, MA, MIT Press. Brown, Clair, and Greg Linden. 2009. Chips and Change: How Crisis Reshapes the Semiconductor
Industry. Cambridge, MA: MIT Press. Chatterji, Aaron. 2103. “The Bad News for Local Job Markets.” Op-Ed, New York Times, October 24,
2013 Dossani, Rafiq, and Kenney, Martin. 2003. “Lift and Shift; Moving the back office to India” Work in
Progress (Sept.). Information Technologies and International Development, 1:2, pp. 21–37. Dossani, Rafiq, and Kenney, Martin. 2005. “Moving Services Offshore: A Case Study of an U.S. High-
Technology Firm.” Report was prepared for the European Union - U.S. Department of Labor seminar Offshoring of Services in ICT and Related Services.
Dunning, John. 2000. “The eclectic paradigm as an envelope for economic and business theories of MNE Activity.” International Business Review. 9: 163–190.
Engardio, Peter; Bernstein, Aaron; and Kripalani, Manjeet. 2003. “Is Your Job Next?” Business Week, February 3, pp. 50-60.
Ebenstein, Avraham; Harrison, Ann; McMillan, Margaret; and Phillips, Shannon, 2009. "Why are American Workers getting Poorer? Estimating the Impact of Trade and Offshoring Using the CPS.” National Bureau of Economic Research Working Paper 15107. http://www.nber.org/papers/w15107.pdf.
Gould, Elise. 2012. A Decade of Declines in Employer-sponsored Health Insurance Coverage. EPI Briefing Paper #337, Economic Policy Institute, Washington DC, February. See: http://www.epi.org/publication/bp337-employer-sponsored-health-insurance/
Graham, John M., with Steven Davis, Douglass Lippoldt, Catherine Mann, and Jack Triplett, 2007. “The Measure of a Nation: Quantifying Innovative Strength through Improved Service Sector Metrics.” National Bureau of Asian Research, Special Report No. 11, February
Harrison, Ann and McMillan, Margaret. 2011. “Offshoring Jobs? Multinationals and U.S. Manufacturing Employment.” The Review of Economics and Statistics, 93: 3, 857-875
Jensen, J. Bradford. 2011. Global Trade in Services: Fear, Facts, and Offshoring. Washington DC: Peterson Institute of International Economics, September 1.
Jensen, Bradford, and Lori Kletzer, 2006, “Tradable services: Understanding the scope and impact of services offshoring”, in Susan M. Collins and Lael Brainard, ed.: Brookings trade forum 2005, offshoring white-collar work. Brookings Institution, Washington DC.
Mann, C., and J. Kirkegaard,. 2006. Accelerating the Globalization of America: The Next Wave of Information Technology. Washington, DC: Institute for International Economics.
National Academy of Public Administration (NAPA). 2006. “Off-shoring: How Big Is It?” Report by a NAPA panel for the U.S. Congress and the Bureau of Economic Analysis. October. (Technical supplement published February 2007.)
Nielsen, Peter Bøegh (ed.) 2008. International Sourcing - Moving Business Functions Abroad, Statistics Denmark, www.dst.dk/publ/InterSourcing.
The 2010 National Organizations Survey
65
Nielsen, Peter Bøegh and Luppes, Martin. 2012. “Globalised enterprises: a European approach.” Presentation to the OECD-Eurostat workshop on TEC and GVCs. OECD headquarters (Paris), 25-26 October.
Porter, Michael. 1985. Competitive Advantage, New York: Free Press. Slaughter, Matthew and D'Andrea Tyson, Laura. 2012. “A Warning Sign from Global Companies.”
Harvard Business Review, March. Sturgeon, Timothy and Richard Florida. 2000. “Globalization and Jobs in the Motor Vehicle Industry.”
Report to the A.P. Sloan Foundation, posted as MIT IPC Working Paper 01-002 at http://web.mit.edu/ipc/www/publications.html.
Sturgeon, Timothy and Florida, Richard. 2004. “Globalization, deverticalization, and employment in the motor vehicle industry”, in M. Kenny with R. Florida (eds.): Locating Global Advantage: Industry Dynamics in a Globalizing Economy. Palo Alto, CA: Stanford University Press.
Sturgeon, Timothy J., with Frank Levy, Clair Brown, J. Bradford Jensen, and David Weil. 2006. “Why We Can't Measure the Economic Effects of Services Offshoring: The Data Gaps and How to Fill Them.” Final Report from the MIT Industrial Performance Center's Services Offshoring Working Group, September. MIT Industrial Performance Center working paper 06-006.
Sturgeon, Timothy. 2002. “Modular Production Networks. A New American Model of Industrial Organization,” Industrial and Corporate Change. 11(3):451-496.
Xiaohong Quan and Chesbrough, Henry. 2010. "Hierarchical Segmentation of R&D Process and Intellectual Property Protection: Evidence From Multinational R&D Laboratories in China." IEEE Transactions on Engineering Management; Feb, 57:1, 9-21. adolescence