irrigation developement in india
TRANSCRIPT

IRRIGATION DEVELOPEMENT IN INDIA
BY,R.VENKATESH

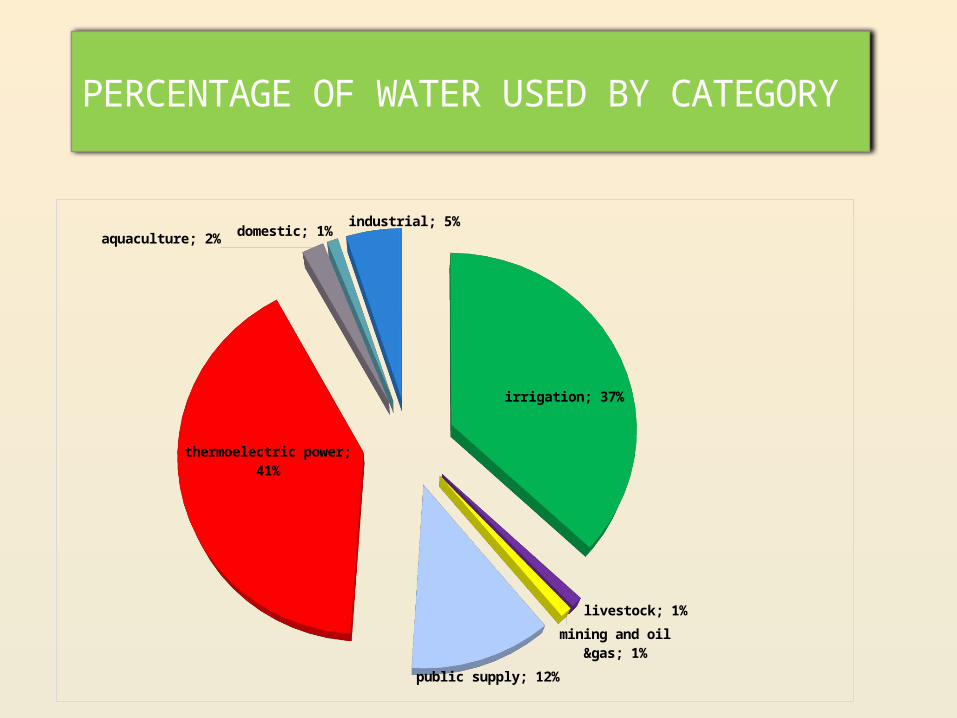
PERCENTAGE OF WATER USED BY CATEGORY
irrigation; 37%
livestock; 1%mining and oil
&gas; 1%public supply; 12%
thermoelectric power; 41%
aquaculture; 2% domestic; 1% industrial; 5%

LAND UTILIZATION PATTERN OF INDIA
Total geographical area : 328.72M haArea under forest : 70.007 M haCultivable area : 180.35 M haNet cultivated area : 141.10 M haNet Area sown : 139.932 M haArea under non : 100. 45 M haagricultural useAverage of Land Holding :80 % farmers have < 1.4 ha

RAINFALL
Average Annual Rainfall - 1170 mm
Maximum Average Annual Rainfall - 11000 mm(Cherrapunji)
Minimum Average Annual Rainfall - 100 mm(Western Rajasthan)

LAND UTILIZATION PATTERN IN TAMIL NADU
Total geographical area : 13.006 m ha
Area under forest : 2.125 m ha
Total cropped area : 5.140 m ha
Net area sown : 4.544m ha

IRRIGATION DEVELOPMENT
Potential Created as % of Ultimate Irrigation Potential
201057%
199243%
Chart Title

Source: Directorate of Economics & Statistics, Department of Agriculture & Cooperation, Ministry of Agriculture
India (in thousand hectares) 2009-10
Net sown area;
140021Net ir-rigated area; 63254
Rain-fed
area; 76767
Tamilnadu(in thousand hectares) 2009-10
Net Sown Area ; 4892
Net ir-rigated Area ; 2864
Rainfed area; 2028

Gap between gross cropped area and gross irrigated area has not reduced since the first Five Year Plan [Source: Economic Survey, February 27, 2015

1950-51 1990-91 2000-01 2009-10 2010-110
50
100
150
200
250
gross cropped areagross irrigated areaarea sown more than once
Are
a in
Mill
ion
ha

DEVELOPMENT OF IRRIGATION SYSTEM


IMPACTS

LAND USE CHANGES DURING LAST TWO DECADES (AREA IN MHA)
year Agricultural land Net sown area Non agril. uses
1980-81 185.15 140.29 19.59
1990-91 185.18 142.99 19.39
2000-01 183.45 141.34 23.75
2009-10 182.46 140.02 26.17

PER CAPITA AVAILABILITY
0
1000
2000
3000
4000
5000
6000
1951 1991 2001 2025 2050
Wat
er A
vaili
bilty
(Cub
ic m
eter
per
ca
pita
per
yea
r)
Water Stress Line
Water Scarcity Line

PER CAPITA AVAILABILITY
1951 1991 2010 2025 2050
36.1 84.63 115.7 133.3 158.1
3008
128.3
938814
687
population (crore) average water resourses (m3/person/year)

WATER USE – CHANGING TRENDS OF THE FUTURE
Present Scenario Likely Scenario for 2050
Use Percentage Use Percentage
Agriculture 83% Agriculture 68%
Industry 5% Industry 9%
Domestic 5% Domestic 7%
Others 7% Others 16%


REFERENCES
• Hydrology and water resources information system
for India
• Ministry of agriculture
• www.ibef.org
• Ministry of water resource, www.mowr.nic.in
• Agricultural statistics at a glance 2014
• Government of India

Save Water