irrigation ew zealand - bec.org.nz › __data › assets › pdf_file › 0010 › ... · new...
TRANSCRIPT

IrrIgatIonIn new Zealand
JULY 2012

IrrIgatIon In new Zealand
July 2012
IrrIgatIonIn new Zealand
JULY 2012
Level 8, 50 Manners StreetPO Box 11035, Wellington 6011
NEW ZEALAND
T: +64 4 894 1910F: +64 4 894 1911
www.rockpoint.co.nz “ConfidenCe in deCision Making”
�u
July 2012Subject to copyright
table of Contents
tab
le o
f C
on
ten
ts
Who is RoCkpoint?Rockpoint is a specialist financial advisory firm, headquartered in Wellington. Rockpoint brings together executive experience from New Zealand, Australia and North America and offers capability and competence in all corporate financial matters. Rockpoint’s key sectors of focus span infrastructure and resources, with expertise supported by direct industry experience and a history in these sectors. Research undertaken by Rockpoint enables it to obtain a unique understanding of a clients’ industry and businesses, and to add genuine strategic value to financial advice.
Rockpoint broadly undertakes two roles:Investment Banking: encompassing Mergers & Acquisitions, Project Financing (equity and debt) and Business Case Development. It can identify opportunities which fit strategic goals, undertake due diligence, establish a valuation, negotiate terms and complete the transaction.Corporate Advisory: covering a wide range of General Advisory including: industry research, feasibility studies, strategic reviews, financial modelling and valuation.
Why Would RoCkpoint WRite this RepoRt?New Zealand is currently investing heavily in infrastructure – roads, rail, schools, hospitals – and irrigation. Infrastructure investment gives the economy a boost during the construction phase, and also over the longer term through improved productivity. The Government is the prime funder of infrastructure, but its ability is limited by the sheer scale of investment and its appetite to fund through borrowing. While funding is available for irrigation schemes, raising the $3-5 billion budgeted for proposed schemes may be beyond the reach of Government and farmers alone.
Rockpoint offers assistance in the financial structuring of irrigation schemes, and can assist in securing project financing. To discuss opportunities further please call Chris Stone on Ph: 04 894 1910 or email: [email protected].
u
u
u
1. Introduction 1
2. Irrigation in New Zealand 22.1 History 22.2 Government Role 32.3 Environment 42.4 Land Use 62.5 Science and Monitoring 82.6 Improving Water Utilisation 102.7 Potential For Irrigation 11
3. Irrigation Infrastructure 133.1 Off-Farm Infrastructure 133.2 On-Farm Infrastructure 15
4. Economic Drivers 184.1 Business Case 184.2 Scheme Viability 184.3 Uptake Rates 194.4 Water Rights 204.5 MPI Report – Economic Value 224.6 NZIER Report – Economic Impact 244.7 Additional Financial Considerations 26
5. Irrigation Funding 285.1 Government Funding 285.2 Debt Funding 315.3 Equity Funding 32
6. Existing Schemes 33
7. Current Irrigation Developments 45
8. Disclaimer & Confidentiality 68

1u
July 2012Subject to copyright
The primary sector plays a dominant role in New Zealand’s economy, accounting for 75% of export earnings. The value of primary output varies according to production (farm output), the degree of value-add processing, and product pricing (commodities prices are typically set globally).
Farm outputs have steadily risen through improved plant and livestock genetics and better farming techniques. There are some areas of New Zealand however where the potential growth in production is limited by available water, namely New Zealand’s east coast. By supplementing natural rainfall with irrigation water, plant growth can be sustained through the dry summer months. Studies in Canterbury show that plant growth (measured as kg dry matter per hectare per year) on an irrigated farm can be twice that of an unirrigated farm. This enables both farm intensification and farm conversion to higher value land use such as dairying.
Both national and local governments have played a significant role in most existing irrigation schemes, especially the larger developments. The Government’s role, while focussed on off-farm infrastructure, has included design, construction, funding and operations. While nominal recovery was sought from water charges, Government returns have not been on commercial terms. A new funding model has been established, with Community Irrigation Fund (CIF) / Irrigation Acceleration Fund (IAF) grants assisting schemes through to the point of investment decision, and the proposed Crown Water Investment Company (CWIW) intended to provide bridging finance for construction on commercial terms.
Irrigation schemes currently cover some 650,000ha of land. At this time, proposed schemes covering a further 550,000ha are in various stages of consent. Some are enhancements of existing schemes while others overlap to varying degrees. These proposed schemes are on average significantly larger (25,000ha) than existing schemes (5,000ha).
Most of the proposed schemes are being sponsored by district and regional councils. This reflects three key factors:
Size: the scale of some schemes is beyond the funding capability farmer group.Water allocation: In most eastern catchments existing water allocations are approaching catchment limits, requiring a regional approach to allocation, and mechanisms to ensure efficient/best use of water.Funding: the capital cost of some proposed schemes cannot be recovered solely from irrigators thus requiring funding from the wider community to reflect the off-farm benefits such as employment opportunities.
This report provides an overview of irrigation in New Zealand. It is based on public information, and Rockpoint’s proprietary research. Rockpoint is a financial advisory firm which has experience in funding and managing infrastructure assets, and advises clients involved in irrigation projects.
u
u
u
1. IntroduCtIon
Intr
od
uC
tIo
n
2u
July 2012Subject to copyright
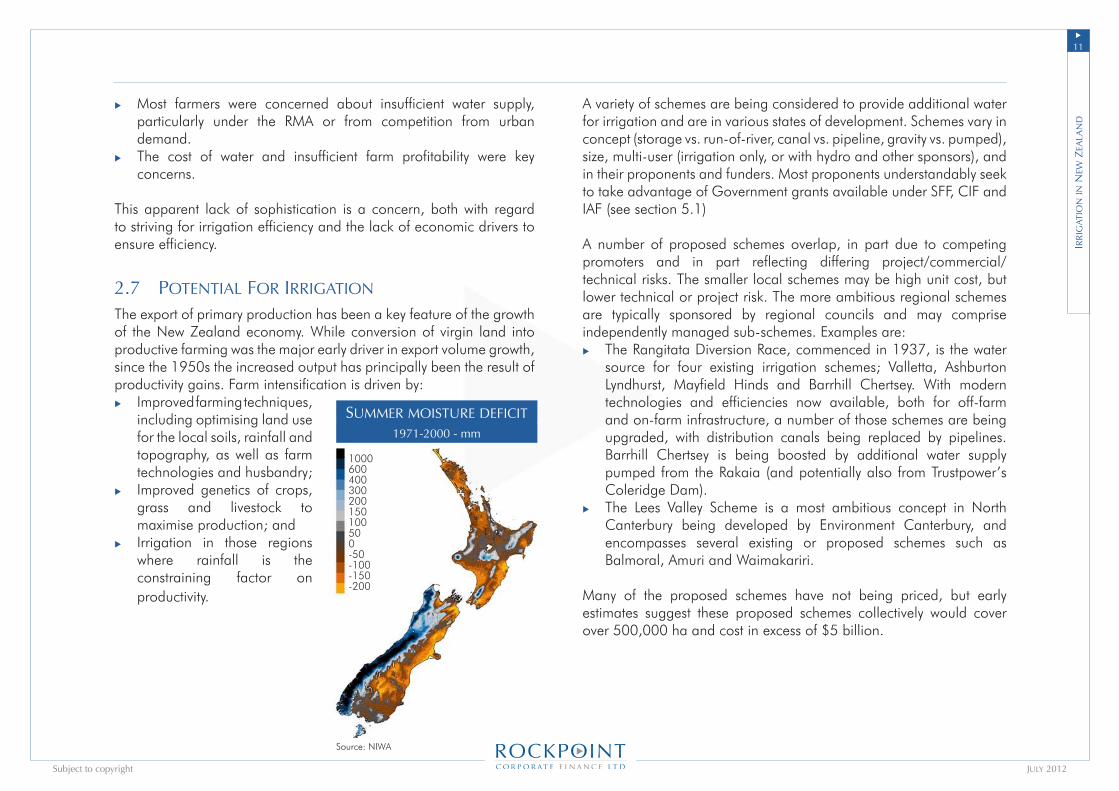
The natural supply of water to land is principally in the form of rainfall, but also ground water and flooding. Irrigation supplements that natural supply of water, and can materially improve farm yield by both boosting plant growth and providing certainty of water supply through the seasons (and in droughts).
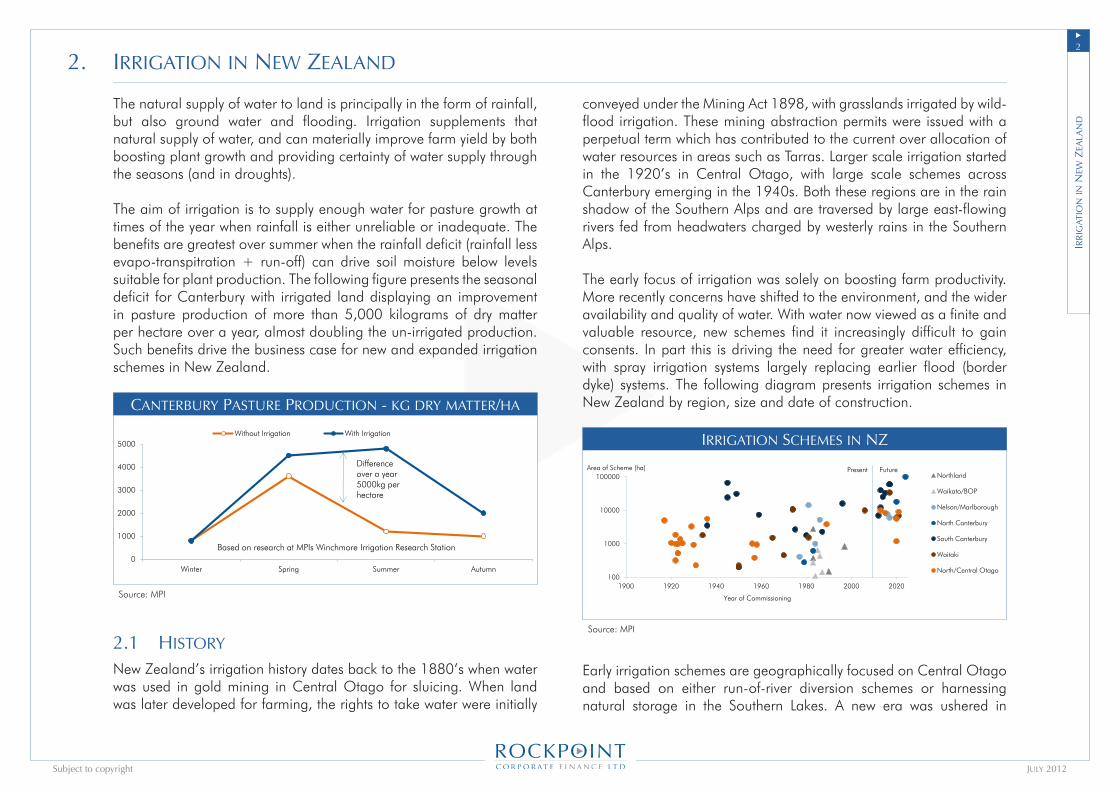
The aim of irrigation is to supply enough water for pasture growth at times of the year when rainfall is either unreliable or inadequate. The benefits are greatest over summer when the rainfall deficit (rainfall less evapo-transpitration + run-off) can drive soil moisture below levels suitable for plant production. The following figure presents the seasonal deficit for Canterbury with irrigated land displaying an improvement in pasture production of more than 5,000 kilograms of dry matter per hectare over a year, almost doubling the un-irrigated production. Such benefits drive the business case for new and expanded irrigation schemes in New Zealand.
Canterbury Pasture ProduCtIon - kg dry matter/ha
Source: MPI
0
1000
2000
3000
4000
5000
Winter Spring Summer Autumn
Canterbury Pasture Production kg dry matter per hectare
Without Irrigation With Irrigation
Source: MAF
Difference over a year 5000kg per hectare
Based on research at MPIs Winchmore Irrigation Research Station
2.1 hIstory
New Zealand’s irrigation history dates back to the 1880’s when water was used in gold mining in Central Otago for sluicing. When land was later developed for farming, the rights to take water were initially
conveyed under the Mining Act 1898, with grasslands irrigated by wild-flood irrigation. These mining abstraction permits were issued with a perpetual term which has contributed to the current over allocation of water resources in areas such as Tarras. Larger scale irrigation started in the 1920’s in Central Otago, with large scale schemes across Canterbury emerging in the 1940s. Both these regions are in the rain shadow of the Southern Alps and are traversed by large east-flowing rivers fed from headwaters charged by westerly rains in the Southern Alps.
The early focus of irrigation was solely on boosting farm productivity. More recently concerns have shifted to the environment, and the wider availability and quality of water. With water now viewed as a finite and valuable resource, new schemes find it increasingly difficult to gain consents. In part this is driving the need for greater water efficiency, with spray irrigation systems largely replacing earlier flood (border dyke) systems. The following diagram presents irrigation schemes in New Zealand by region, size and date of construction.
IrrIgatIon sChemes In nZ
Source: MPI
100
1000
10000
100000
1900 1920 1940 1960 1980 2000 2020
Area of Scheme (ha)
Year of Commissioning
Irrigation Schemes in NZ
Northland
Waikato/BOP
Nelson/Marlborough
North Canterbury
South Canterbury
Waitaki
North/Central Otago
Present Future
Early irrigation schemes are geographically focused on Central Otago and based on either run-of-river diversion schemes or harnessing natural storage in the Southern Lakes. A new era was ushered in
2. IrrIgatIon In new Zealand
Irr
Igat
Ion
In n
ew Z
eala
nd

�u
July 2012Subject to copyright
the 1950’s with New Zealand’s major hydro projects controlling (or creating) lakes. Notably these were along the Waitaki River, providing opportunity to support integrated irrigation schemes. Hydro generation and irrigation uses are typically complementary in storage schemes, with hydro (electricity) demand greatest in the winter, while irrigation demand is greatest in the summer.
The Central Otago and Waitaki irrigation schemes mostly utilise lake storage, with offtake restrictions imposed on the extent to which lakes can be drawn down. Most other schemes are run-of-river systems, with offtake limited by available natural river flow. For Otago and Canterbury schemes (both storage and run-of-river), water flows remain sufficiently strong to meet the majority of summer irrigation demand with rivers charged by orographic rain in the Southern Alps (which peaks in late spring-early summer) and the coinciding summer snowmelt.
2.2 government role
Central Government played a significant role in early schemes. During the 1930s depression public works programs provided much needed employment notably the Rangitata Diversion Race. Later the driver was a greater awareness of the value of irrigation, to mitigate severe droughts, and the wider benefits from improving farmland productivity. Recognising that the costs for larger schemes were too expensive and the investment horizons too long for individuals acting alone, the Government assumed development risk, ownership and operation of some irrigation schemes.
In principal the Government’s role was to act as a facilitator but seeking full commercial returns. However, while recovering operations and maintenance costs from water users, whole-of-life economic analysis played little part in the Government’s investment decisions. It
appears that, as with the major hydro schemes, the Ministry of Works and Development (1912-1987) was more preoccupied with sustaining its design and construction workforce.
The Public Works Act 1910 gave the Government the power to construct irrigation systems, including diversion structures, canals, storage dams and distribution channels. The Act provided that 100% of the off-farm constructions costs could be paid by the Government. Annual water charges paid by farmers were supposed to cover operation and maintenance (O&M) costs plus the interest costs associated with one-fourth of the capital. Contracts with farmers were to be non-adjustable agreements between individual irrigators and the Government, but this made no provision where capital costs exceeded budgets or any allowance for inflation (such that charges declined in real $ terms). The Government also showed a willingness to forgive revenue obligations when farm commodity prices were low.
The Government, via the Department of Agriculture, established the Winchmore Irrigation Research Station in 1946 to undertake research to improve the efficiency of irrigation, including automation, and evaluation of the importance of irrigation in contrasting farm systems. By the mid-1960s almost all of the flood irrigation and border dyke schemes in New Zealand used automatic systems. By 1970 the total area under “Government” irrigation schemes was about 100,000 hectares, while private schemes in Canterbury based on groundwater resources covered a further 100,000 hectares. Since the 1980s farmers themselves, rather than the Government, have led the drive for increased irrigation.
Prior to 1975, the Government did not fund on-farm distribution works. In 1975 it provided a 33% grant for on-farm works, increasing to 50% in 1978, and it funded all investigation and design costs until 1986. These Government subsidies to new irrigation schemes ended in 1987 with wider Government reforms.
Irr
Igat
Ion
In n
ew Z
eala
nd
�u
July 2012Subject to copyright
The Government moved to privatise the irrigation schemes after a critical 1987 Audit Office report highlighted problems inherent with Government ownership and management of irrigation schemes. These included:
Lack of financial and operational accountability on the part of the MWD; Water charges set too low to recover O&M and capital costs;Irrigators playing little role in the operational decisions that directly affected the magnitude of water charges they faced and benefits they received from the project; and Difficulty in determining wider national benefit from Government investment in irrigation.
The sale process of irrigation schemes highlighted the complexities of privatisation, such as the need for enabling legislation, the inclusion of water rights as scheme assets, determination of sale prices for the scheme assets (it is unclear whether this was on the basis of artificially low water rates, or at full commercial rates), and contingent liabilities, such as the Government’s willingness to protect the new owners from future claims (such as dam safety). Having considered a number of divestment options, the Government opted to sell the schemes, including all headworks, on a “commercial” basis, with the irrigators being given preference. Water rights were limited to 30 years, with preservation of water access rights maintained (whether ordinary, Government or mining rights).
Very few of the schemes yielded a high sale price to the Government, largely given the low net revenue generated by the schemes under Government ownership and management (notwithstanding the economic value to the farmers). Other factors were risks associated with assumed liabilities and the lack of competitive bidding given preferences assigned to the farmers.
u
u
u
u
2.3 envIronment
2.3.1 water resourCe
The challenges facing fresh water quality and availability were addressed by the Land and Water Forum’s report “A Fresh Start to Fresh Water” (2010). The Land and Water Forum is a range of groups with interest in water (electricity, agriculture, tourism, iwi, environmental) to develop a common direction for fresh water management.
Water is one of New Zealand’s major national advantages, sustaining life and our unique ecosystems and species. It is part of our heritage and identity, especially for iwi as taonga, a treasure. It is valued for pleasure and recreation, and offers major economic advantages. Multiple uses for water sometimes complement each other (such as recreational use of hydro dams), but more often they conflict (pollution arising from intensification of farming), requiring some consensus on priorities and desired outcomes. There is recognition that water management systems must be in the context of the regions and whole hydrological system.
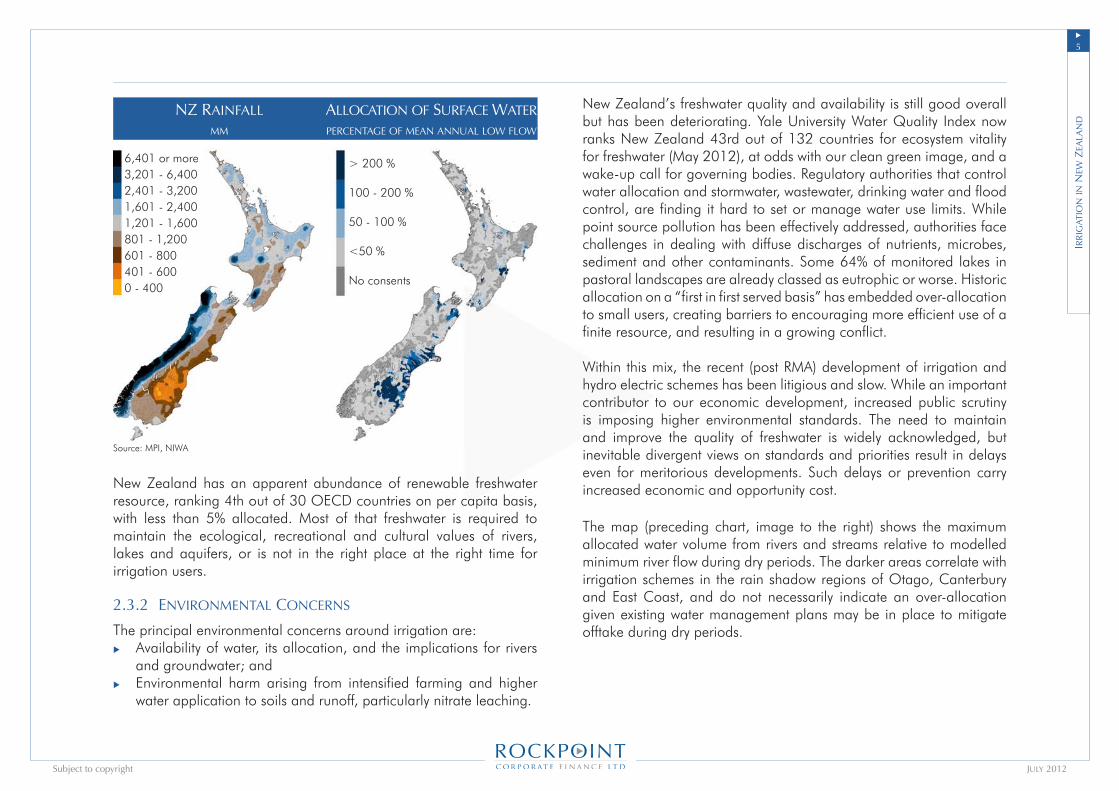
Rainfall in most of New Zealand averages from 0.6 to 1.6m per year, although the variation is wide (left chart, next page). The west coast, especially Fiordland, receives 2 to 10m of rain per year, as wet westerly’s encounter the Southern Alps. Areas in the east, lying in the rain shadow of the mountains along New Zealand’s spine, receive less rainfall, which includes regions such as Central Otago, coastal Canterbury and parts of the Hawkes Bay.
Irr
Igat
Ion
In n
ew Z
eala
nd
�u
July 2012Subject to copyright
nZ raInfall alloCatIon of surfaCe watermm PerCentage of mean annual low flow
Source: MPI, NIWA
New Zealand has an apparent abundance of renewable freshwater resource, ranking 4th out of 30 OECD countries on per capita basis, with less than 5% allocated. Most of that freshwater is required to maintain the ecological, recreational and cultural values of rivers, lakes and aquifers, or is not in the right place at the right time for irrigation users.
2.3.2 envIronmental ConCerns
The principal environmental concerns around irrigation are:Availability of water, its allocation, and the implications for rivers and groundwater; andEnvironmental harm arising from intensified farming and higher water application to soils and runoff, particularly nitrate leaching.
u
u
New Zealand’s freshwater quality and availability is still good overall but has been deteriorating. Yale University Water Quality Index now ranks New Zealand 43rd out of 132 countries for ecosystem vitality for freshwater (May 2012), at odds with our clean green image, and a wake-up call for governing bodies. Regulatory authorities that control water allocation and stormwater, wastewater, drinking water and flood control, are finding it hard to set or manage water use limits. While point source pollution has been effectively addressed, authorities face challenges in dealing with diffuse discharges of nutrients, microbes, sediment and other contaminants. Some 64% of monitored lakes in pastoral landscapes are already classed as eutrophic or worse. Historic allocation on a “first in first served basis” has embedded over-allocation to small users, creating barriers to encouraging more efficient use of a finite resource, and resulting in a growing conflict.
Within this mix, the recent (post RMA) development of irrigation and hydro electric schemes has been litigious and slow. While an important contributor to our economic development, increased public scrutiny is imposing higher environmental standards. The need to maintain and improve the quality of freshwater is widely acknowledged, but inevitable divergent views on standards and priorities result in delays even for meritorious developments. Such delays or prevention carry increased economic and opportunity cost.
The map (preceding chart, image to the right) shows the maximum allocated water volume from rivers and streams relative to modelled minimum river flow during dry periods. The darker areas correlate with irrigation schemes in the rain shadow regions of Otago, Canterbury and East Coast, and do not necessarily indicate an over-allocation given existing water management plans may be in place to mitigate offtake during dry periods.
Irr
Igat
Ion
In n
ew Z
eala
nd
6,401 or more3,201 - 6,4002,401 - 3,2001,601 - 2,4001,201 - 1,600801 - 1,200601 - 800401 - 6000 - 400
> 200 %
100 - 200 %
50 - 100 %
<50 %
No consents
�u
July 2012Subject to copyright
2.3.3 natIonal standards
The Land and Water Forum proposed the adoption of a national standards framework for New Zealand that requires wide engagement with communities, and maintains regional council’s role in the maintenance and enhancement of the quality of water. The national standards are seen as a means to develop more efficient and effective methods of allocating water permits and to manage demand, reduce contamination and maximise the value of water for the wider economy. Such an initiative requires establishing the water resource (spatially and seasonally), striking a balance between competing uses (ecological, environmental, recreational and economic), and devising an optimal allocation between existing users and future users.
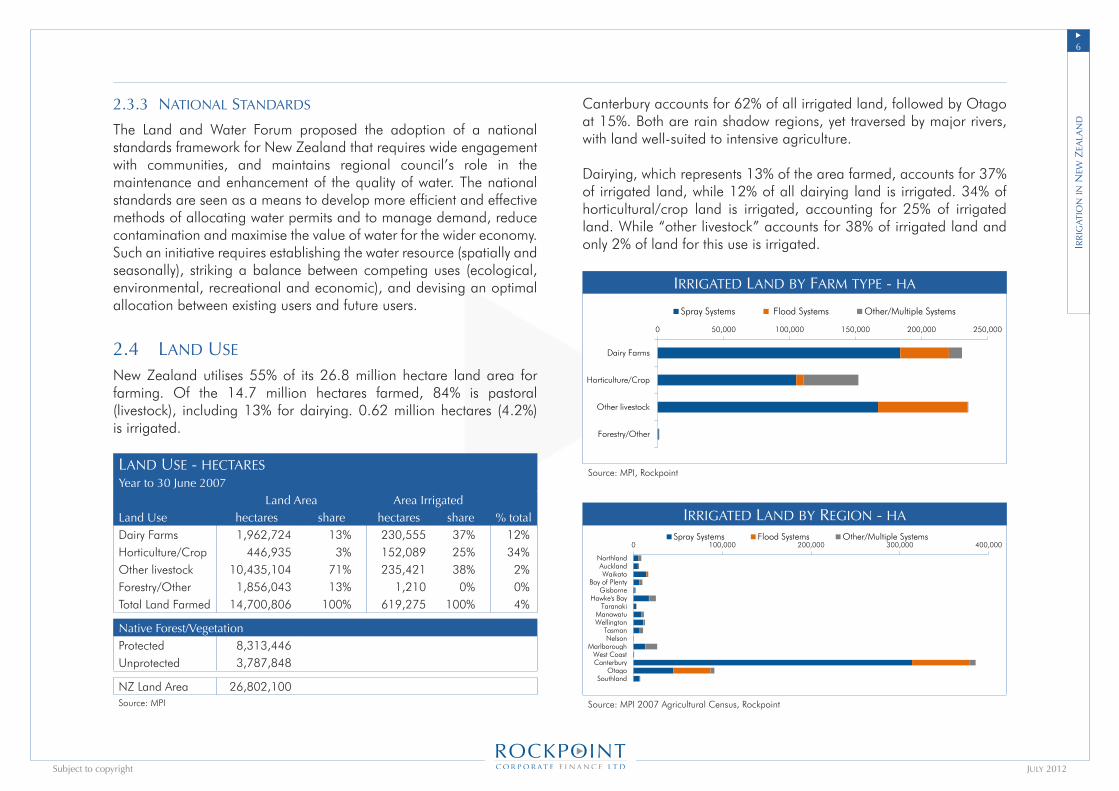
2.4 land use
New Zealand utilises 55% of its 26.8 million hectare land area for farming. Of the 14.7 million hectares farmed, 84% is pastoral (livestock), including 13% for dairying. 0.62 million hectares (4.2%) is irrigated.
land use - heCtaresYear to �0 June 2007
Land Area Area Irrigated Land Use hectares share hectares share % totalDairy Farms 1,962,724 13% 230,555 37% 12%Horticulture/Crop 446,935 3% 152,089 25% 34%Other livestock 10,435,104 71% 235,421 38% 2%Forestry/Other 1,856,043 13% 1,210 0% 0%Total Land Farmed 14,700,806 100% 619,275 100% 4%
Native Forest/Vegetation Protected 8,313,446Unprotected 3,787,848
NZ Land Area 26,802,100Source: MPI
Canterbury accounts for 62% of all irrigated land, followed by Otago at 15%. Both are rain shadow regions, yet traversed by major rivers, with land well-suited to intensive agriculture.
Dairying, which represents 13% of the area farmed, accounts for 37% of irrigated land, while 12% of all dairying land is irrigated. 34% of horticultural/crop land is irrigated, accounting for 25% of irrigated land. While “other livestock” accounts for 38% of irrigated land and only 2% of land for this use is irrigated.
IrrIgated land by farm tyPe - ha
Source: MPI, Rockpoint
0 50,000 100,000 150,000 200,000 250,000
Dairy Farms
Horticulture/Crop
Other livestock
Forestry/Other
Irrigated Land by Farm Type - hectares
Spray Systems Flood Systems Other/Multiple Systems
Source: MAF, Rockpoint
IrrIgated land by regIon - ha
Source: MPI 2007 Agricultural Census, Rockpoint
0 100,000 200,000 300,000 400,000
Northland Auckland Waikato
Bay of Plenty Gisborne
Hawke's Bay Taranaki
Manawatu Wellington
Tasman Nelson
Marlborough West Coast Canterbury
Otago Southland
Irrigated Land by Region - hectares
Spray Systems Flood Systems Other/Multiple Systems
Source: MAF 2007 Agriculture Census, Rockpoint
Irr
Igat
Ion
In n
ew Z
eala
nd

7u
July 2012Subject to copyright
IrrIgable land by regIon and tyPe - 000 heCtaresYear to �0 June 2007Region Land Area Irrigated Area share Flood Systems Spray Systems Micro Systems UnspecifiedNorthland 1394.1 8.7 1% .0 5.2 2.4 1.1Auckland 560.0 6.3 1% .0 4.9 .9 .6Waikato 2559.8 16.6 3% .9 14.0 .9 1.9Bay of Plenty 1244.7 10.0 2% .0 6.5 2.5 1.6Gisborne 835.1 2.3 0% .0 1.4 .8 .0Hawke’s Bay 1416.4 25.2 4% .4 17.3 6.9 1.7Taranaki 727.3 3.4 1% .3 2.8 .1 .0Manawatu 2221.5 11.7 2% .2 9.0 .4 2.6Wellington 812.4 12.9 2% .4 10.9 1.1 1.0Tasman 978.6 10.7 2% .0 6.2 4.1 .9Nelson 44.5 .3 0% .0 .3 .0 .0Marlborough 1248.4 26.7 4% .6 13.1 13.4 1.7West Coast 2333.6 .6 0% .0 .6 .0 .0Canterbury 4534.6 385.3 62% 64.4 313.7 5.7 13.2Otago 3199.0 91.1 15% 42.0 44.7 2.3 6.5Southland 3434.7 7.5 1% 1.0 6.3 .0 1.1Chatham Islands 96.6 - - - - -
27641.3 619.3 18% 74% 7% 6%Source: MPI
IrrIgable land by farm tyPe - 000 heCtaresYear to �0 June 2007Farm type Area Farmed Area Irrigated share Flood Systems Spray Systems Micro Systems UnspecifiedDairy 1962.7 230.6 37% 36.8 183.8 1.7 11.9Sheep 3275.7 83.1 13% 33.9 51.3 .9 5.7Other Livestock 7041.2 120.9 20% 31.1 87.3 1.6 6.3Grain and other crops 318.4 94.6 15% 7.0 84.5 .2 3.4Vegetables 89.4 32.6 5% .2 30.6 .6 1.7Grapes 56.7 27.2 4% .4 6.2 19.5 2.3Horticulture 100.7 29.0 5% .8 12.1 15.9 2.5Forestry 1856.0 1.2 0% .0 .9 .2 .1
14700.8 619.3 18% 74% 7% 5%Source: MPI
Irr
Igat
Ion
In n
ew Z
eala
nd
�u
July 2012Subject to copyright
Permeability is the ability of water (or other fluids) to flow through the soil. This depends upon the size of pore passages between grains, largley a factor of grain size.Friability – the strength bonds between solid material.
Soil water availability refers to the capacity of a soil to retain water that is available to the plants (that is, free and within the plant root zone), measured as % volume, or mm water per 100mm of soil profile.
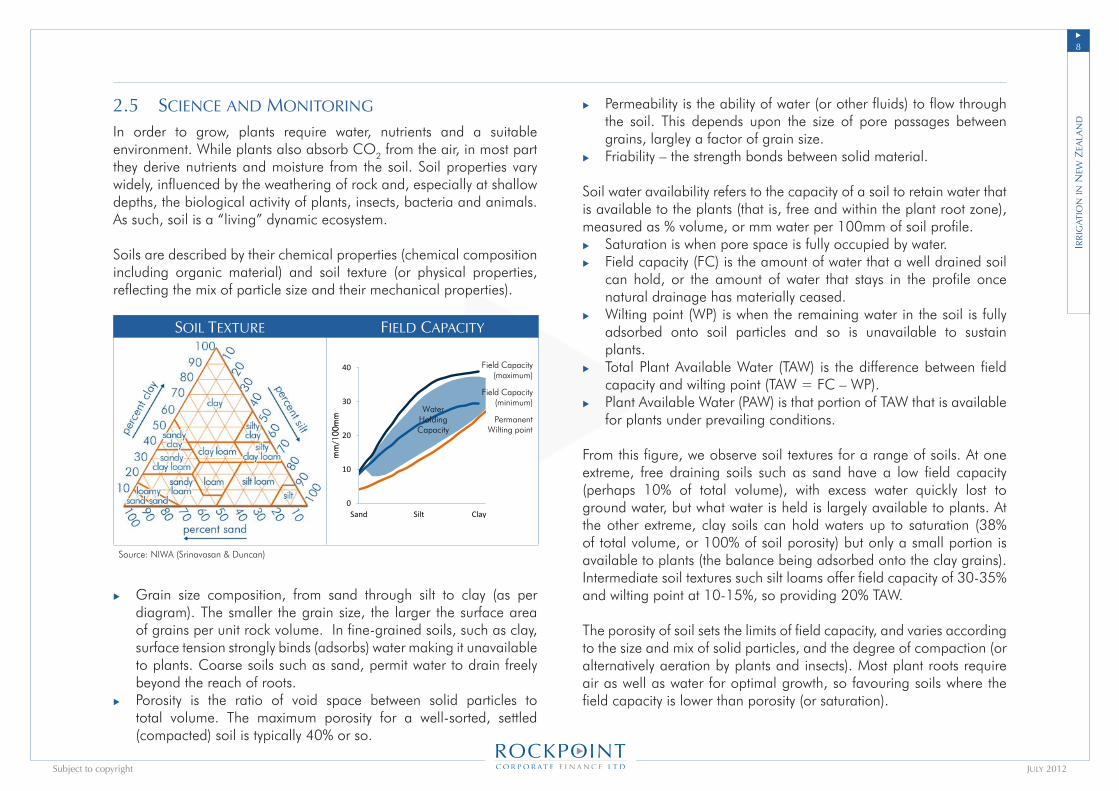
Saturation is when pore space is fully occupied by water. Field capacity (FC) is the amount of water that a well drained soil can hold, or the amount of water that stays in the profile once natural drainage has materially ceased. Wilting point (WP) is when the remaining water in the soil is fully adsorbed onto soil particles and so is unavailable to sustain plants.Total Plant Available Water (TAW) is the difference between field capacity and wilting point (TAW = FC – WP).Plant Available Water (PAW) is that portion of TAW that is available for plants under prevailing conditions.
From this figure, we observe soil textures for a range of soils. At one extreme, free draining soils such as sand have a low field capacity (perhaps 10% of total volume), with excess water quickly lost to ground water, but what water is held is largely available to plants. At the other extreme, clay soils can hold waters up to saturation (38% of total volume, or 100% of soil porosity) but only a small portion is available to plants (the balance being adsorbed onto the clay grains). Intermediate soil textures such silt loams offer field capacity of 30-35% and wilting point at 10-15%, so providing 20% TAW.
The porosity of soil sets the limits of field capacity, and varies according to the size and mix of solid particles, and the degree of compaction (or alternatively aeration by plants and insects). Most plant roots require air as well as water for optimal growth, so favouring soils where the field capacity is lower than porosity (or saturation).
u
u
u
u
u
u
u
2.5 sCIenCe and monItorIng
In order to grow, plants require water, nutrients and a suitable environment. While plants also absorb CO2 from the air, in most part they derive nutrients and moisture from the soil. Soil properties vary widely, influenced by the weathering of rock and, especially at shallow depths, the biological activity of plants, insects, bacteria and animals. As such, soil is a “living” dynamic ecosystem.
Soils are described by their chemical properties (chemical composition including organic material) and soil texture (or physical properties, reflecting the mix of particle size and their mechanical properties).
soIl texture fIeld CaPaCIty
Source: NIWA (Srinavasan & Duncan)
0
10
20
30
40
Sand Silt Clay
mm
/100
mm
Field Capacity (maximum)
Field Capacity (minimum)
Permanent Wilting point
Water Holding Capacity
Grain size composition, from sand through silt to clay (as per diagram). The smaller the grain size, the larger the surface area of grains per unit rock volume. In fine-grained soils, such as clay, surface tension strongly binds (adsorbs) water making it unavailable to plants. Coarse soils such as sand, permit water to drain freely beyond the reach of roots. Porosity is the ratio of void space between solid particles to total volume. The maximum porosity for a well-sorted, settled (compacted) soil is typically 40% or so.
u
u
Irr
Igat
Ion
In n
ew Z
eala
nd
�u
July 2012Subject to copyright
Soil moisture is charged by rainfall, and depleted by evaporation and plant transpiration (collectively plant evapo-transpiration, PET) and drainage. Moisture flows are typically measured in mm depth (of free water). Where rainfall exceeds PET, soil moisture rises until reaching field capacity, at which point excess water is lost to groundwater or runoff. Where PET exceeds rainfall, soil moisture drops. Irrigation is a means to supplement rainfall to offset high PET losses.
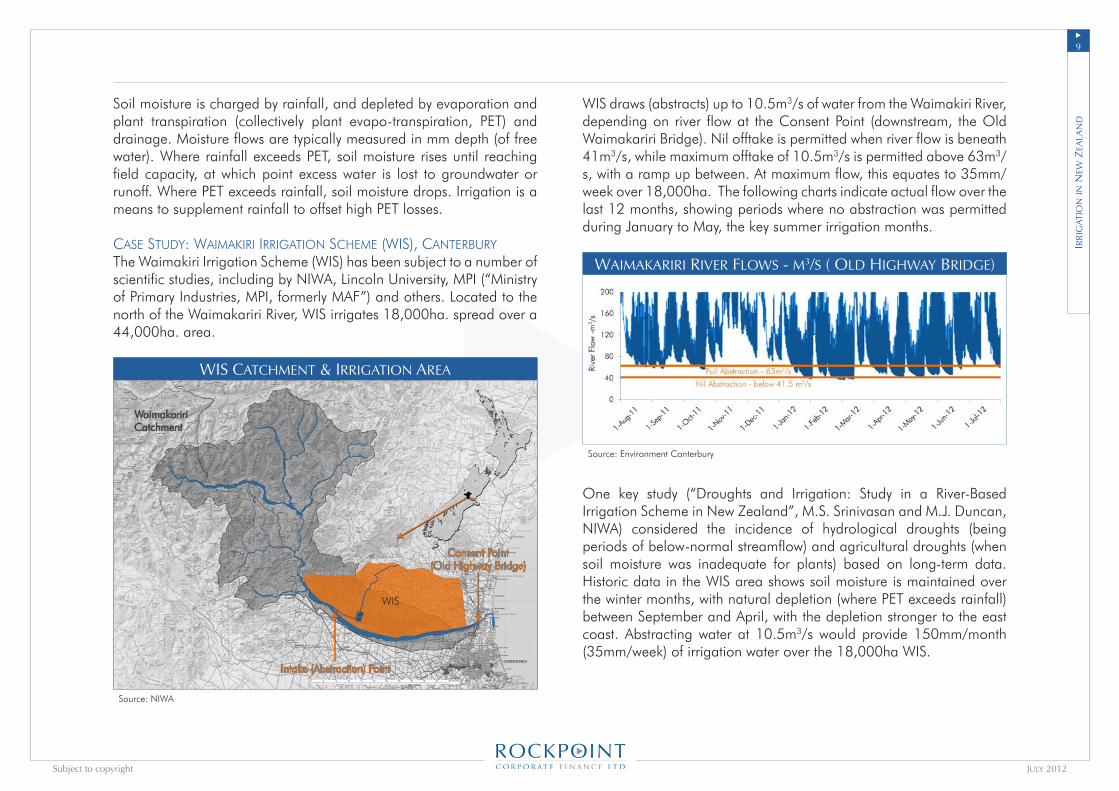
Case study: WaiMakiRi iRRigation sCheMe (Wis), CanteRbuRyThe Waimakiri Irrigation Scheme (WIS) has been subject to a number of scientific studies, including by NIWA, Lincoln University, MPI (“Ministry of Primary Industries, MPI, formerly MAF”) and others. Located to the north of the Waimakariri River, WIS irrigates 18,000ha. spread over a 44,000ha. area.
wIs CatChment & IrrIgatIon area
Source: NIWA
Consent Point(Old Highway Bridge)
Intake (Abstraction) Point
WaimakaririCatchment
WIS
WIS draws (abstracts) up to 10.5m3/s of water from the Waimakiri River, depending on river flow at the Consent Point (downstream, the Old Waimakariri Bridge). Nil offtake is permitted when river flow is beneath 41m3/s, while maximum offtake of 10.5m3/s is permitted above 63m3/s, with a ramp up between. At maximum flow, this equates to 35mm/week over 18,000ha. The following charts indicate actual flow over the last 12 months, showing periods where no abstraction was permitted during January to May, the key summer irrigation months.
waImakarIrI rIver flows - m3/s ( old hIghway brIdge)
Source: Environment Canterbury
One key study (“Droughts and Irrigation: Study in a River-Based Irrigation Scheme in New Zealand”, M.S. Srinivasan and M.J. Duncan, NIWA) considered the incidence of hydrological droughts (being periods of below-normal streamflow) and agricultural droughts (when soil moisture was inadequate for plants) based on long-term data. Historic data in the WIS area shows soil moisture is maintained over the winter months, with natural depletion (where PET exceeds rainfall) between September and April, with the depletion stronger to the east coast. Abstracting water at 10.5m3/s would provide 150mm/month (35mm/week) of irrigation water over the 18,000ha WIS.
Irr
Igat
Ion
In n
ew Z
eala
nd
10u
July 2012Subject to copyright
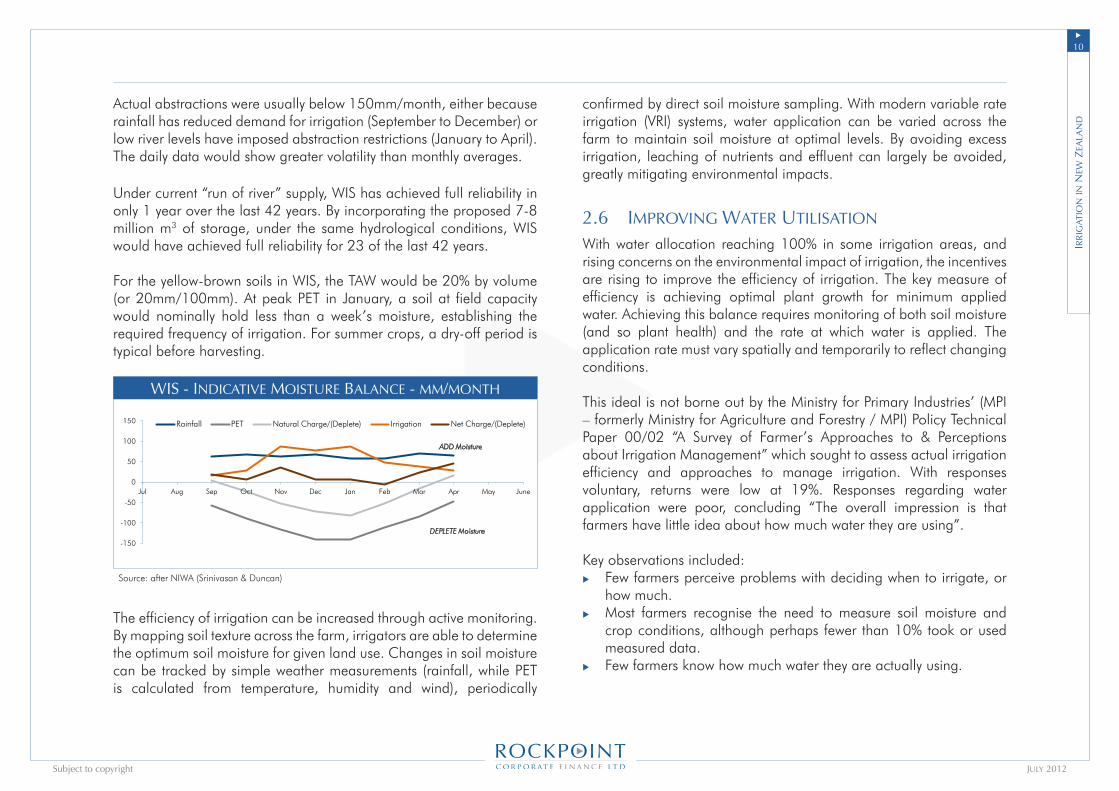
Actual abstractions were usually below 150mm/month, either because rainfall has reduced demand for irrigation (September to December) or low river levels have imposed abstraction restrictions (January to April). The daily data would show greater volatility than monthly averages.
Under current “run of river” supply, WIS has achieved full reliability in only 1 year over the last 42 years. By incorporating the proposed 7-8 million m3 of storage, under the same hydrological conditions, WIS would have achieved full reliability for 23 of the last 42 years.
For the yellow-brown soils in WIS, the TAW would be 20% by volume (or 20mm/100mm). At peak PET in January, a soil at field capacity would nominally hold less than a week’s moisture, establishing the required frequency of irrigation. For summer crops, a dry-off period is typical before harvesting.
wIs - IndICatIve moIsture balanCe - mm/month
Source: after NIWA (Srinivasan & Duncan)
-150
-100
-50
0
50
100
150
Jul Aug Sep Oct Nov Dec Jan Feb Mar Apr May June
WIS - Indicative Moisture Balance mm/month
Rainfall PET Natural Charge/(Deplete) Irrigation Net Charge/(Deplete)
Source: after NIWA (Srinivasan & Duncan)
ADD Moisture
DEPLETE Moisture
The efficiency of irrigation can be increased through active monitoring. By mapping soil texture across the farm, irrigators are able to determine the optimum soil moisture for given land use. Changes in soil moisture can be tracked by simple weather measurements (rainfall, while PET is calculated from temperature, humidity and wind), periodically
confirmed by direct soil moisture sampling. With modern variable rate irrigation (VRI) systems, water application can be varied across the farm to maintain soil moisture at optimal levels. By avoiding excess irrigation, leaching of nutrients and effluent can largely be avoided, greatly mitigating environmental impacts.
2.6 ImProvIng water utIlIsatIon
With water allocation reaching 100% in some irrigation areas, and rising concerns on the environmental impact of irrigation, the incentives are rising to improve the efficiency of irrigation. The key measure of efficiency is achieving optimal plant growth for minimum applied water. Achieving this balance requires monitoring of both soil moisture (and so plant health) and the rate at which water is applied. The application rate must vary spatially and temporarily to reflect changing conditions.
This ideal is not borne out by the Ministry for Primary Industries’ (MPI – formerly Ministry for Agriculture and Forestry / MPI) Policy Technical Paper 00/02 “A Survey of Farmer’s Approaches to & Perceptions about Irrigation Management” which sought to assess actual irrigation efficiency and approaches to manage irrigation. With responses voluntary, returns were low at 19%. Responses regarding water application were poor, concluding “The overall impression is that farmers have little idea about how much water they are using”.
Key observations included:Few farmers perceive problems with deciding when to irrigate, or how much.Most farmers recognise the need to measure soil moisture and crop conditions, although perhaps fewer than 10% took or used measured data.Few farmers know how much water they are actually using.
u
u
u
Irr
Igat
Ion
In n
ew Z
eala
nd
11u
July 2012Subject to copyright
Irr
Igat
Ion
In n
ew Z
eala
nd
Source: NIWA
summer moIsture defICIt1�71-2000 - mm
1000600400300200150100500-50-100-150-200
Most farmers were concerned about insufficient water supply, particularly under the RMA or from competition from urban demand.The cost of water and insufficient farm profitability were key concerns.
This apparent lack of sophistication is a concern, both with regard to striving for irrigation efficiency and the lack of economic drivers to ensure efficiency.
2.7 PotentIal for IrrIgatIon
The export of primary production has been a key feature of the growth of the New Zealand economy. While conversion of virgin land into productive farming was the major early driver in export volume growth, since the 1950s the increased output has principally been the result of productivity gains. Farm intensification is driven by:
Improved farming techniques, including optimising land use for the local soils, rainfall and topography, as well as farm technologies and husbandry;Improved genetics of crops, grass and livestock to maximise production; andIrrigation in those regions where rainfall is the constraining factor on productivity.
u
u
u
u
u
A variety of schemes are being considered to provide additional water for irrigation and are in various states of development. Schemes vary in concept (storage vs. run-of-river, canal vs. pipeline, gravity vs. pumped), size, multi-user (irrigation only, or with hydro and other sponsors), and in their proponents and funders. Most proponents understandably seek to take advantage of Government grants available under SFF, CIF and IAF (see section 5.1)
A number of proposed schemes overlap, in part due to competing promoters and in part reflecting differing project/commercial/technical risks. The smaller local schemes may be high unit cost, but lower technical or project risk. The more ambitious regional schemes are typically sponsored by regional councils and may comprise independently managed sub-schemes. Examples are:
The Rangitata Diversion Race, commenced in 1937, is the water source for four existing irrigation schemes; Valletta, Ashburton Lyndhurst, Mayfield Hinds and Barrhill Chertsey. With modern technologies and efficiencies now available, both for off-farm and on-farm infrastructure, a number of those schemes are being upgraded, with distribution canals being replaced by pipelines. Barrhill Chertsey is being boosted by additional water supply pumped from the Rakaia (and potentially also from Trustpower’s Coleridge Dam). The Lees Valley Scheme is a most ambitious concept in North Canterbury being developed by Environment Canterbury, and encompasses several existing or proposed schemes such as Balmoral, Amuri and Waimakariri.
Many of the proposed schemes have not being priced, but early estimates suggest these proposed schemes collectively would cover over 500,000 ha and cost in excess of $5 billion.
u
u
12u
July 2012Subject to copyright
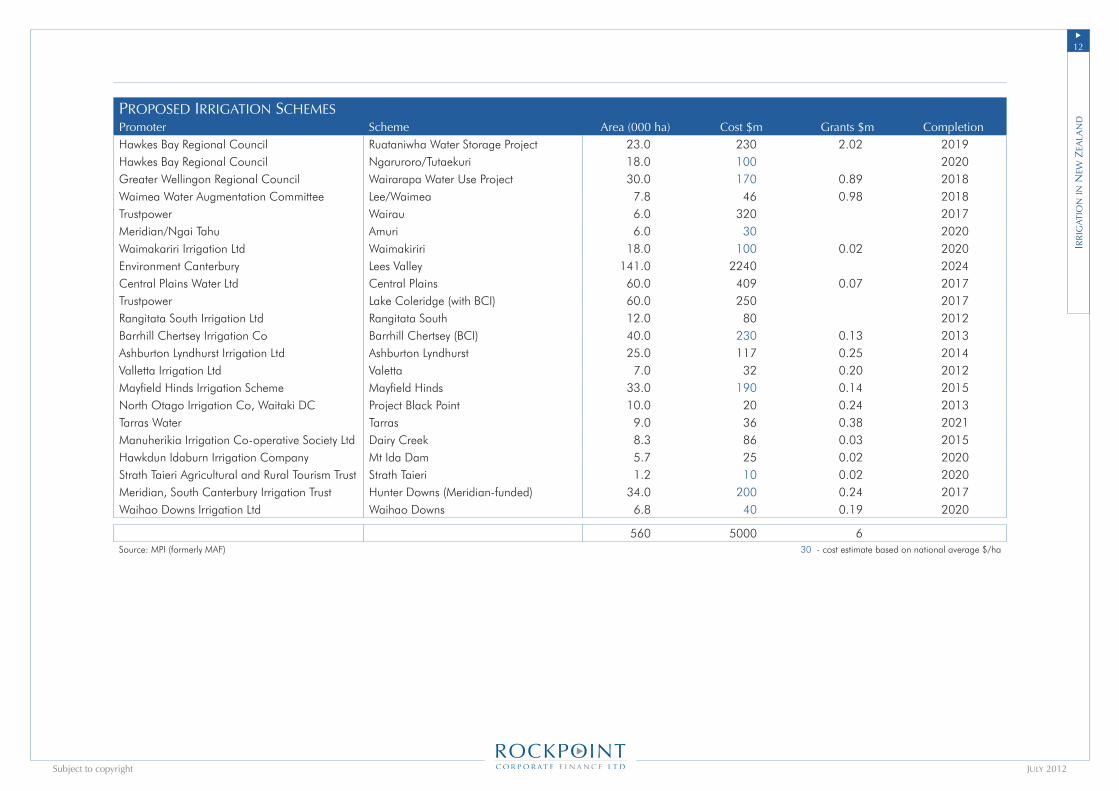
ProPosed IrrIgatIon sChemesPromoter Scheme Area (000 ha) Cost $m Grants $m CompletionHawkes Bay Regional Council Ruataniwha Water Storage Project 23.0 230 2.02 2019Hawkes Bay Regional Council Ngaruroro/Tutaekuri 18.0 100 2020Greater Wellingon Regional Council Wairarapa Water Use Project 30.0 170 0.89 2018Waimea Water Augmentation Committee Lee/Waimea 7.8 46 0.98 2018Trustpower Wairau 6.0 320 2017Meridian/Ngai Tahu Amuri 6.0 30 2020Waimakariri Irrigation Ltd Waimakiriri 18.0 100 0.02 2020Environment Canterbury Lees Valley 141.0 2240 2024Central Plains Water Ltd Central Plains 60.0 409 0.07 2017Trustpower Lake Coleridge (with BCI) 60.0 250 2017Rangitata South Irrigation Ltd Rangitata South 12.0 80 2012Barrhill Chertsey Irrigation Co Barrhill Chertsey (BCI) 40.0 230 0.13 2013Ashburton Lyndhurst Irrigation Ltd Ashburton Lyndhurst 25.0 117 0.25 2014Valletta Irrigation Ltd Valetta 7.0 32 0.20 2012Mayfield Hinds Irrigation Scheme Mayfield Hinds 33.0 190 0.14 2015North Otago Irrigation Co, Waitaki DC Project Black Point 10.0 20 0.24 2013Tarras Water Tarras 9.0 36 0.38 2021Manuherikia Irrigation Co-operative Society Ltd Dairy Creek 8.3 86 0.03 2015Hawkdun Idaburn Irrigation Company Mt Ida Dam 5.7 25 0.02 2020Strath Taieri Agricultural and Rural Tourism Trust Strath Taieri 1.2 10 0.02 2020Meridian, South Canterbury Irrigation Trust Hunter Downs (Meridian-funded) 34.0 200 0.24 2017Waihao Downs Irrigation Ltd Waihao Downs 6.8 40 0.19 2020
560 5000 6Source: MPI (formerly MAF) 30 - cost estimate based on national average $/ha
Irr
Igat
Ion
In n
ew Z
eala
nd

1�u
July 2012Subject to copyright
In terms of scale irrigation schemes vary from a single farm, up to regional schemes covering over 60,000 ha with even more ambitious schemes being contemplated. Single farm schemes are typically supplied by stream diversions or water wells, while investment in on-farm storage is becoming more prevalent to avert the effects of summer drought.
3.1 off-farm InfrastruCture
This report focuses on larger, multi-farm schemes which would comprise:
Off-farm infrastructure: which collects from source, stores, and distributes water to individual farms; andOn-farm infrastructure: including irrigation systems to distribute allocated water on the farm as well as storage facilities to hold water.
Irrigation companies or co-operatives usually own, operate, and maintain shared assets such as storage dams, off-take structures, canal, and control systems. Shareholdings are allocated on the basis of either the farmers’ (and other investors) share of investment, water off-take, or benefit.
Recently, variations of the traditional ownership and management structure have arisen. For example the operation of the Opuha dam and power station has been outsourced to TrustPower by the irrigation company. A number of proposed schemes are also integrating with hydroelectric generation developments. Under these arrangements electricity generators usually construct, own and operate the main dam and canal infrastructure principally for their benefit, but make provisions for minimum flows to the irrigation scheme. This allows irrigation scheme participants to realise significant cost savings from funding only the construction of distribution and off-farm infrastructure.
u
u
3.1.1 Command area
The off-farm Command Area is the land a scheme is nominally able to irrigate and is usually dictated by topographical catchments. Under gravity systems, this is the area with an elevation below that of the off-take structure. With pipelines and pumps, the command area can be extended (in terms of boundary and level of elevation) to wider distribution networks beyond the immediate below elevation catchment.
Other factors driving the command area are the available off-take volume times, defined as the time of peak demand, and the desired irrigation application rate (m3/ha) across farms in the scheme. Application levels differ by soil type, land use and natural rainfall.
3.1.2 storage
Irrigation’s role as a supplement to rainfall, especially during seasonal shortfalls, requires a method of storage. Storage provides security of supply in the crucial summer growing season.
Many irrigation schemes utilise natural lakes for storage. Control structures are built at the outfall to manage the diversion of water to the irrigation scheme while also maintaining flow from the lake’s natural outlet. Lakes and irrigation schemes are often able to be used to control flood events by withholding flow during heavy rainfall, to be released at a later time. Many schemes increase natural storage by boosting the height at the outflow. In the absence of natural storage, many modern (and proposed) schemes create artificial lakes, providing complementary potential for hydro generation. These are usually formed at natural river constriction points, such as gorges, allowing a relatively small dam to hold large volumes. Hydro lakes such as Benmore, Clyde, and those behind the Waikato dams are examples, while Lake Opua has been formed as part of an irrigation scheme. Smaller scale storage dams can also be developed on individual farms to provide insurance against summer droughts.
3. IrrIgatIon InfrastruCture
Irr
Igat
Ion
Infr
ast
ru
Ctu
re
1�u
July 2012Subject to copyright
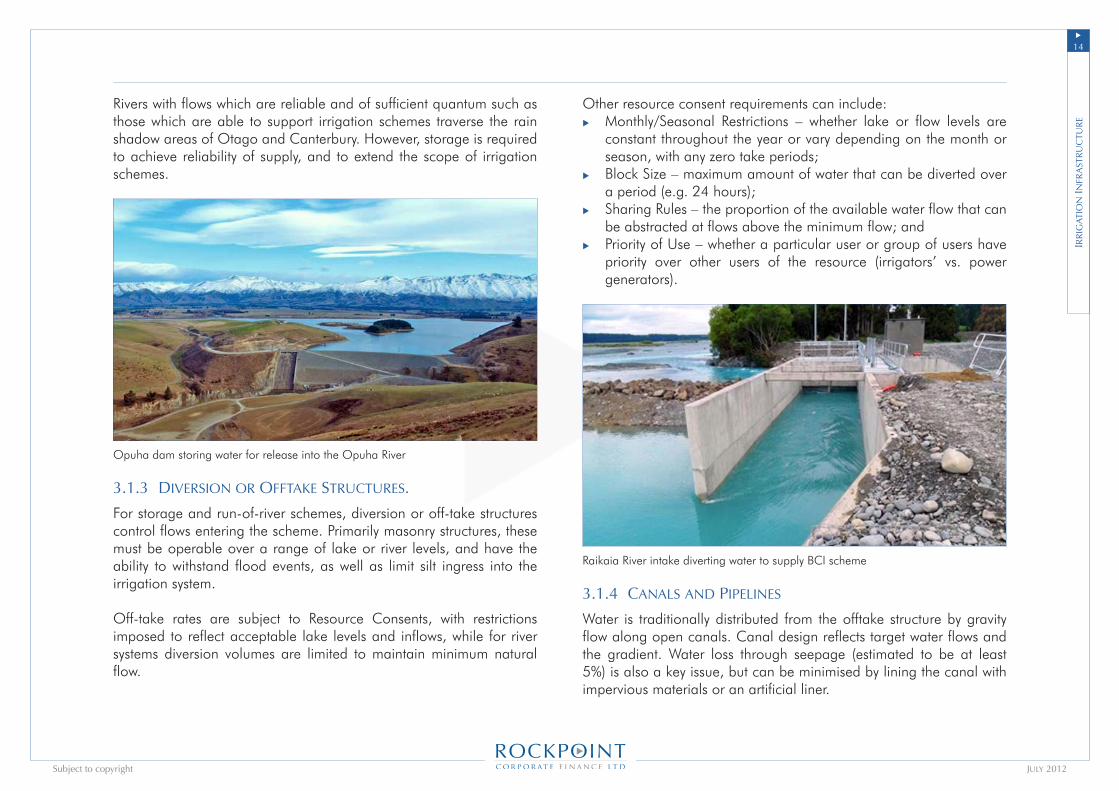
Rivers with flows which are reliable and of sufficient quantum such as those which are able to support irrigation schemes traverse the rain shadow areas of Otago and Canterbury. However, storage is required to achieve reliability of supply, and to extend the scope of irrigation schemes.
Opuha dam storing water for release into the Opuha River
3.1.3 dIversIon or offtake struCtures.
For storage and run-of-river schemes, diversion or off-take structures control flows entering the scheme. Primarily masonry structures, these must be operable over a range of lake or river levels, and have the ability to withstand flood events, as well as limit silt ingress into the irrigation system.
Off-take rates are subject to Resource Consents, with restrictions imposed to reflect acceptable lake levels and inflows, while for river systems diversion volumes are limited to maintain minimum natural flow.
Other resource consent requirements can include:Monthly/Seasonal Restrictions – whether lake or flow levels are constant throughout the year or vary depending on the month or season, with any zero take periods;Block Size – maximum amount of water that can be diverted over a period (e.g. 24 hours);Sharing Rules – the proportion of the available water flow that can be abstracted at flows above the minimum flow; andPriority of Use – whether a particular user or group of users have priority over other users of the resource (irrigators’ vs. power generators).
Raikaia River intake diverting water to supply BCI scheme
3.1.4 Canals and PIPelInes
Water is traditionally distributed from the offtake structure by gravity flow along open canals. Canal design reflects target water flows and the gradient. Water loss through seepage (estimated to be at least 5%) is also a key issue, but can be minimised by lining the canal with impervious materials or an artificial liner.
u
u
u
u Irr
Igat
Ion
Infr
ast
ru
Ctu
re

1�u
July 2012Subject to copyright
Laying an irrigation pipeline Irrigation Distribution Canal
While more expensive, pipelines are increasingly being utilised, given the following advantages:
Pumps can be installed to traverse higher ground or charge elevated storage reservoirs;Pressurised pipes can increase flow rates and eliminate the need for further on-farm pumping;Better water monitoring and control systems;Reduced seepage; andMinimal disruption to, and loss of utilisation of, land.
Both canals and pipelines deliver water to metered off-takes at each participant farm.
3.2 on-farm InfrastruCture
On-farm infrastructure is funded by individual farmers/properties/owners. Each participating farm receives water via metered offtakes, and is charged on the basis of a fixed daily fee and a rate based on volume taken or contracted. Farmers contract for volume and price for an agreed period.
u
u
u
u
u
Early irrigation systems distributed water on-farm using border-dykes systems, where land to be irrigated was re-contoured to guide and control periodic surface flooding. More recently spray irrigation systems have been employed, such as static (fixed) systems for horticulture, moveable sprinkler systems, and mobile systems such as centre-pivot and lateral move irrigators for crop and pastoral farming.
Modern irrigation schemes provide farmers with the opportunity to monitor and vary their off-take rates (within agreed limits), while innovations in on-farm systems increase the control farmers have over application, including real time management of flow rates and flow duration per irrigator, and even per discharge nozzle (termed variable rate irrigation, VRI). When combined with the monitoring of soil moisture, water application can be controlled to maximise farm output with minimum water utilisation. By avoiding waste, farmers are able to reduce costs, while also enabling the scale of the irrigation scheme to be maximised for given scheme offtake volumes.
Spray systems are now utilised on 74% of New Zealand’s irrigated land, with 18% of farms still utilising flood systems (being largely legacy systems) (MPI 2007).
3.2.1 flood systems
The earliest irrigation schemes in Central Otago used wild flooding, where water was diverted to freely flood paddocks. While initial costs were low, it used water inefficiently and resulted in bypass zones and areas which become sodden. These limitations were partially addressed with the border dyke system, where the land was contoured into parallel, typically 12 metre wide, shallow channels. Each farm would develop a dyke system to supply water to those paddocks to be flooded. A temporary dam is created at the outlet from the dykes and water periodically spilled into the ‘border’ by manually breaching the dyke (usually by removing a board). While improved with precision land levelling, water distribution remained uneven, and the efficiency of water low (<65%). The sequence of watering was historically manually controlled, although automatic systems were developed in the 1950s.
Irr
Igat
Ion
Infr
ast
ru
Ctu
re
1�u
July 2012Subject to copyright
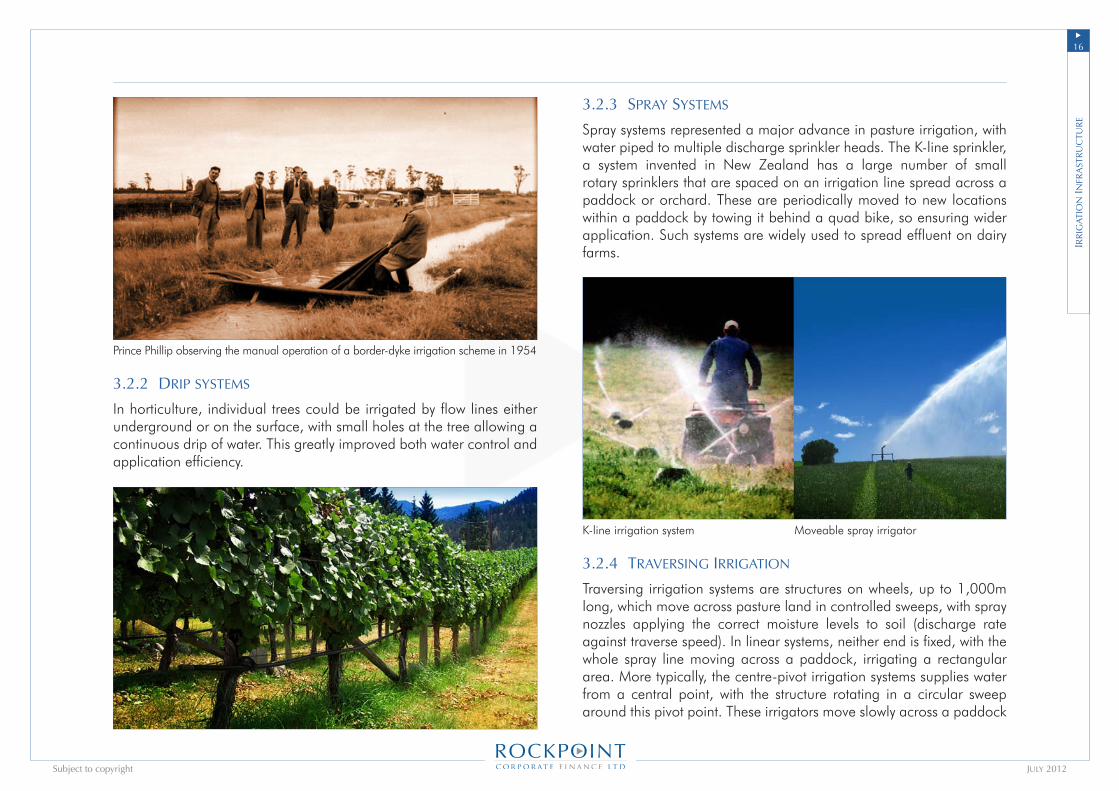
Prince Phillip observing the manual operation of a border-dyke irrigation scheme in 1954
3.2.2 drIP systems
In horticulture, individual trees could be irrigated by flow lines either underground or on the surface, with small holes at the tree allowing a continuous drip of water. This greatly improved both water control and application efficiency.
3.2.3 sPray systems
Spray systems represented a major advance in pasture irrigation, with water piped to multiple discharge sprinkler heads. The K-line sprinkler, a system invented in New Zealand has a large number of small rotary sprinklers that are spaced on an irrigation line spread across a paddock or orchard. These are periodically moved to new locations within a paddock by towing it behind a quad bike, so ensuring wider application. Such systems are widely used to spread effluent on dairy farms.
K-line irrigation system Moveable spray irrigator
3.2.4 traversIng IrrIgatIon
Traversing irrigation systems are structures on wheels, up to 1,000m long, which move across pasture land in controlled sweeps, with spray nozzles applying the correct moisture levels to soil (discharge rate against traverse speed). In linear systems, neither end is fixed, with the whole spray line moving across a paddock, irrigating a rectangular area. More typically, the centre-pivot irrigation systems supplies water from a central point, with the structure rotating in a circular sweep around this pivot point. These irrigators move slowly across a paddock
Irr
Igat
Ion
Infr
ast
ru
Ctu
re
17u
July 2012Subject to copyright
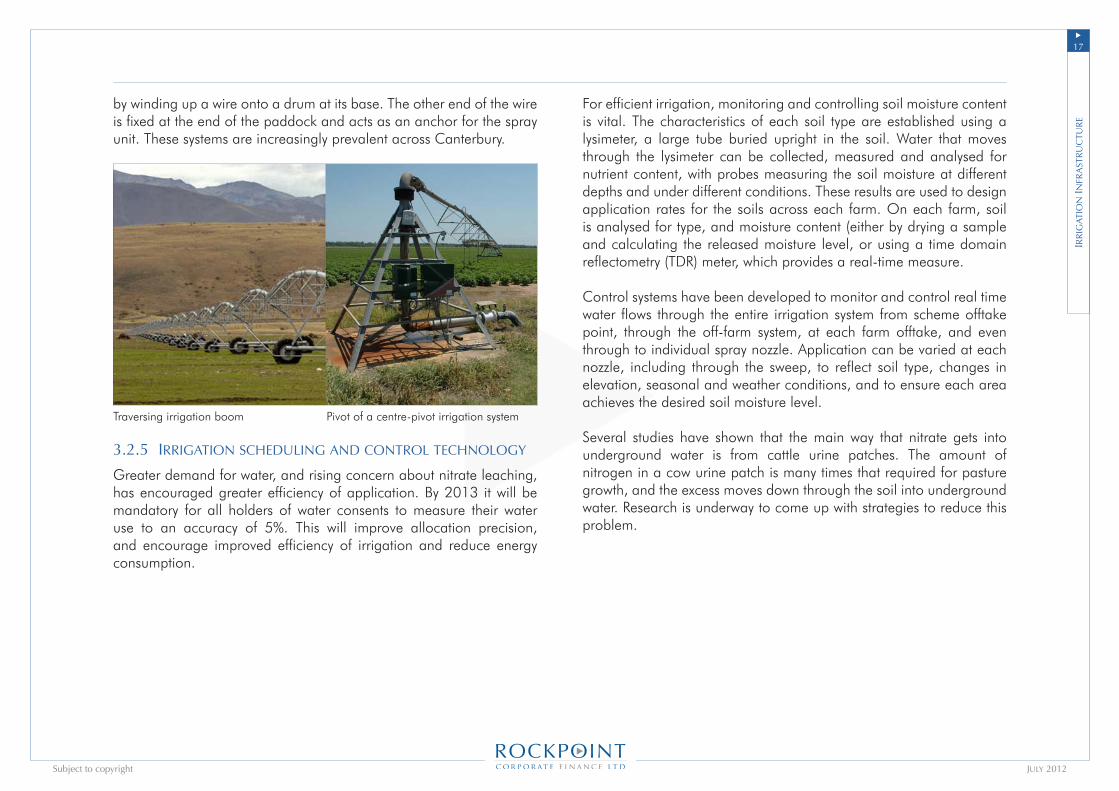
by winding up a wire onto a drum at its base. The other end of the wire is fixed at the end of the paddock and acts as an anchor for the spray unit. These systems are increasingly prevalent across Canterbury.
Traversing irrigation boom Pivot of a centre-pivot irrigation system
3.2.5 IrrIgatIon sChedulIng and Control teChnology
Greater demand for water, and rising concern about nitrate leaching, has encouraged greater efficiency of application. By 2013 it will be mandatory for all holders of water consents to measure their water use to an accuracy of 5%. This will improve allocation precision, and encourage improved efficiency of irrigation and reduce energy consumption.
For efficient irrigation, monitoring and controlling soil moisture content is vital. The characteristics of each soil type are established using a lysimeter, a large tube buried upright in the soil. Water that moves through the lysimeter can be collected, measured and analysed for nutrient content, with probes measuring the soil moisture at different depths and under different conditions. These results are used to design application rates for the soils across each farm. On each farm, soil is analysed for type, and moisture content (either by drying a sample and calculating the released moisture level, or using a time domain reflectometry (TDR) meter, which provides a real-time measure.
Control systems have been developed to monitor and control real time water flows through the entire irrigation system from scheme offtake point, through the off-farm system, at each farm offtake, and even through to individual spray nozzle. Application can be varied at each nozzle, including through the sweep, to reflect soil type, changes in elevation, seasonal and weather conditions, and to ensure each area achieves the desired soil moisture level.
Several studies have shown that the main way that nitrate gets into underground water is from cattle urine patches. The amount of nitrogen in a cow urine patch is many times that required for pasture growth, and the excess moves down through the soil into underground water. Research is underway to come up with strategies to reduce this problem.
Irr
Igat
Ion
Infr
ast
ru
Ctu
re
1�u
July 2012Subject to copyright
4. eConomIC drIvers
The presumption behind developing an irrigation scheme is that it will generate a positive return on funds invested. Traditionally these returns have been viewed in on-farm economic terms, although schemes are now also being assessed against off-farm, social and environmental considerations.
A feature of almost all medium and large irrigation schemes has been Government involvement as a financier of off-farm infrastructure and as facilitator. The Government’s current policies continue this, offering grants for work pre-investment decision, and proposals for bridging finance.
4.1 busIness Case
The business case process sets out the rationale for embarking on a project, balancing benefits and costs, opportunities and risks. For irrigation schemes this will be an iterative process given there is great flexibility in design concepts, scheme scale and outcome priorities. At the concept stage many options will be considered, with those options being narrowed as cost, engineering, regulatory, environmental and farmer support issues are addressed. The following table sets out typical elements of a business case as an illustration.
Expanding on the simple summary, we now explore issues associated with elements of irrigation schemes.
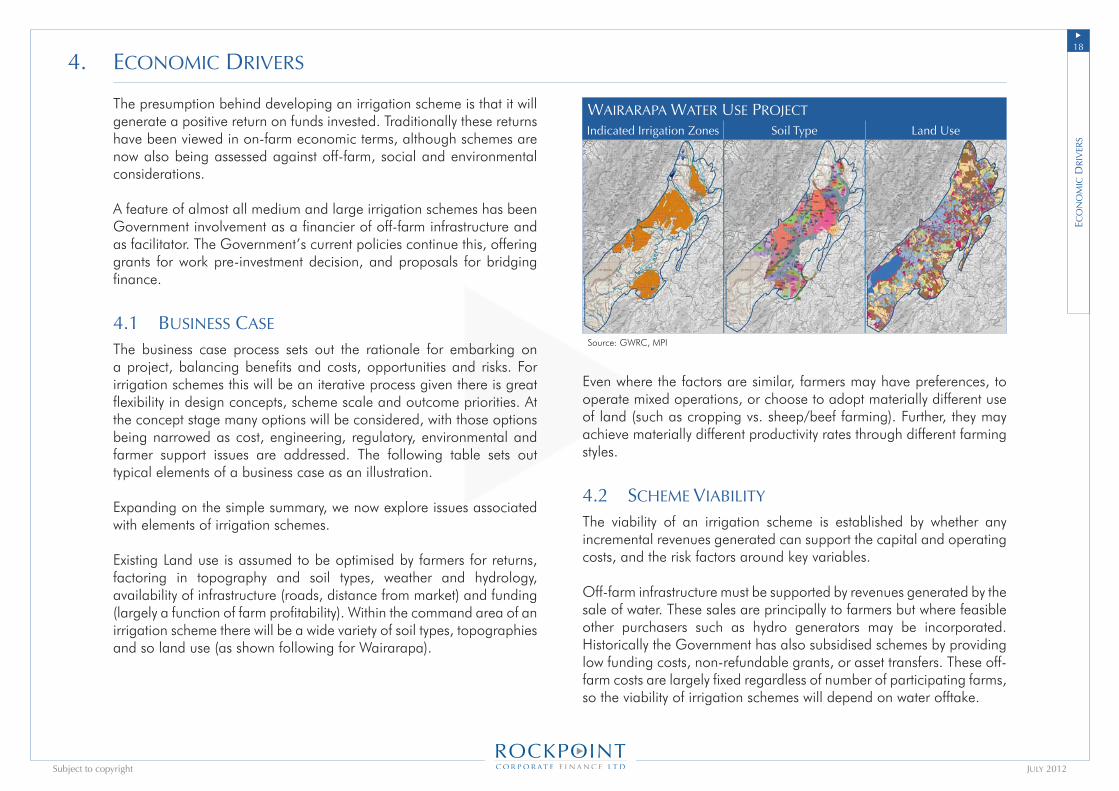
Existing Land use is assumed to be optimised by farmers for returns, factoring in topography and soil types, weather and hydrology, availability of infrastructure (roads, distance from market) and funding (largely a function of farm profitability). Within the command area of an irrigation scheme there will be a wide variety of soil types, topographies and so land use (as shown following for Wairarapa).
waIraraPa water use ProJeCtIndicated Irrigation Zones Soil Type Land Use
Source: GWRC, MPI
Even where the factors are similar, farmers may have preferences, to operate mixed operations, or choose to adopt materially different use of land (such as cropping vs. sheep/beef farming). Further, they may achieve materially different productivity rates through different farming styles.
4.2 sCheme vIabIlIty
The viability of an irrigation scheme is established by whether any incremental revenues generated can support the capital and operating costs, and the risk factors around key variables.
Off-farm infrastructure must be supported by revenues generated by the sale of water. These sales are principally to farmers but where feasible other purchasers such as hydro generators may be incorporated. Historically the Government has also subsidised schemes by providing low funding costs, non-refundable grants, or asset transfers. These off-farm costs are largely fixed regardless of number of participating farms, so the viability of irrigation schemes will depend on water offtake.
eCo
no
mIC
dr
Iver
s
1�u
July 2012Subject to copyright
On-farm, irrigation boosts same-use productivity or permits conversion to higher value land use. Soil type will determine suitability for growing various plant types (pasture, crops) and responsiveness to water (permeability, retention). Hydrology principally shows the rainfall distribution (annual, seasonal, variability), but also measures river and groundwater flow. Otago, Canterbury, Wairarapa, and Hawkes Bay are all in the rain shadow zone, and are traversed by large east-flowing rivers which can be harnessed by irrigation schemes.
The design of the irrigation scheme will reflect the required capability and outputs. Historically farmers have sought to minimise capital costs (design and construction), and consequently often incur high operating costs. A number of proposed schemes are redevelopments of existing schemes which are now seeking to enhance scheme capacity while also lowering operating costs.
New schemes now typically seek to minimise whole-of-life costs, bearing a higher construction cost to achieve an offsetting operating saving. This includes incorporation of electricity generators to offset scheme power requirements, and greater use of pipelines, which provide greater flexibility regarding the command area (accommodating varying gradients), reduced losses, and the ability to pressurise to better serve on-farm spray irrigation systems.
4.3 uPtake rates
The command area for large irrigation schemes can exceed 50,000 ha, encompassing several hundred farms. While topography or soil type may prevent participation of some farms, participation of each eligible farm is voluntary.
High farmer participation is required to ensure that fixed costs of off-farm infrastructure can be widely spread across eligible farms. The level of farmer support will rise with the demonstration that the net benefits exceed the costs of both off- and on-farm infrastructure. Support for irrigation schemes will vary based on the circumstances of individual farms including:
Physical characteristics: topography, soil and aspect farm typeFarm type: existing land use, potential land use under irrigationWater sources: existing irrigation schemes, aquifers, proposed schemesFarmer circumstances: ability, aspirations, financial situation
It is apparent that some proposed schemes cannot be supported by revenues from farmers alone. Supplementary revenues can be sought from complementary water users, most typically hydro stations. Indeed, the Waiau and Coleridge irrigation schemes are being developed by TrustPower, which seeks to include irrigation in its hydro electricity schemes to supplement returns and to gain community support. Further, the involvement of regional and district councils in several schemes reflects the need for the wider community to contribute to reflect the wider economic benefits (such as employment, farm and professional services).
The risk profile of schemes will change through the development process. Early investment in developing scheme concepts will be small, although the uncertainties regarding outcomes will be high. At this stage, individual farmer contributions are relatively low, so participation is expected to be high. Funding of schemes through to development decision (pre-investment) requires progressively larger investment, although can attract material support from Government grants (CIF, IAF).
u
u
u
u
eCo
no
mIC
dr
Iver
s
20u
July 2012Subject to copyright
Participation of farmers is most critical at the point of the investment decision, given this will establish the contractual relationship between farmers and the irrigation company. Those contracts will provide the irrigation company and its funders with the revenue certainty required to develop the scheme. Given the off-farm infrastructure costs are largely fixed, funding demand per farm falls as the number of participating farms increases. Below a certain level of support, the scheme will not be considered viable given the revenue demand will exceed the benefit for the supporting farmers, especially on a risk-weighted basis.
Farming, like all business, involves decision-making and risk-taking. While commitment to an irrigation project reduces the risk of water availability (although not entirely), it does introduce other risks (financial, operational). The decision to participate will weigh the benefits of upside risk (greatly enhanced farm returns) against those of downside risk (operating and funding costs). The risk weighting will reflect the benefit-cost of each scenario against the probability of occurrence, and will seek to ensure adverse events are survivable. The benchmark for evaluating participation would be the status quo (business as usual without irrigation).
Participating farmers subscribe for shares in the holding company (or co-operative) according to an agreed allocation mechanism, usually in proportion to their desired water allocation, but alternatively according to farm size or financial appetite. Subscriptions may also be received from approved non-farmer parties such as councils or hydro generators, although farmers have typically wished to maintain outright control. There are protections for early participants, such that entry costs will rise as the project advances to reasonably reflect the risks carried by early investors.
4.4 water rIghts
In addition to the premise that an irrigation development will only proceed if it brings benefits to the investors, there is the premise that a scheme will proceed only if water is available to meet farmers’ needs.
Water rights are conferred by the Crown to individuals (not to the land or title). Regional councils are empowered under the Resource Management Act (RMA) to grant water permits which allow the holder to take, use, dam or divert water subject to availability and defined conditions. Water rights can be administrative, statutory or contractual; can be quantitative or limited only by impact on others, and can be conditional on continued use.
Water permits do not constitute ownership and may be granted for up to 35 years (with a default period of 5 years). Permits do not appear to carry automatic rights of renewal, provide no guarantee of water availability, and do not prevent upstream consents being granted which may derogate from permitted grants.
Existing use of and rights to water are presumed to have precedence over new applications. Maori rights to use water are considered guaranteed under the Treaty of Waitangi, roughly equating to the common law doctrine of aboriginal title.
When considering an application for consent to abstract water, councils must take into account the environmental consequences of the decision. In the case of irrigation this includes the direct effect on the river of reduced flows, the impact on lake levels/surrounding land from natural/artificial storage schemes, as well as indirect effects such as environmetal effects (e.g. nitrate leaching) from farm intensification. In Canterbury, from 1995 to 2004, nitrate concentrations in groundwater had increased in 20% of sampled wells, although notably nitrate levels were lower from spray irrigation.
eCo
no
mIC
dr
Iver
s

21u
July 2012Subject to copyright
Environmental protection is now ensured under key legislation:Resource Management Act 1991 legislated for the sustainable management of natural and physical resources. The RMA also set a 2021 expiry date for perpetual water abstraction permits issued under the Mining Act 1898.The Water and Soil Conservation Act 1967 which enforced minimum flow constraints on certain rivers, fixed-term permits, and recording of water takes.Sustainable Water Programme of Action which sought a national policy statement on water allocation and national environmental standards.
In granting a water permit, the regional council has the capacity to impose offtake conditions to ensure the level and consistency of flow, the quality of the water (including temperature, clarity, bacteria levels, and other forms of pollution), and to support natural flora and fauna. The interdependence of combined social and environmental perspectives results in a “common property feature” of water.
Conditions imposed on water permits typically include maximum offtake rates. These may be further constrained by river flows (the need to preserve natural river flows, with nil offtake below minimum levels) and lake levels (to maintain within a defined range). There may also be maximum offtake quantities for a given period, and sharing regimes with other water permit holders.
Within the water available under permit to an irrigation scheme, water is allocated to individual farmers according to an agreed methodology. There is typically a direct link between water allocation and farmer shareholding in the scheme, and also in broad proportion to farm size (hectares). Allocation is scaled according to any restrictions on the scheme.
u
u
u
Shares can only be transferred according to the constitution, with eligibility to acquire typically dependent upon being a farmer with a requirement for water. A farmer’s right to water comes with an obligation to pay, usually via an annual fee comprising a fixed component, and a variable per unit volume component. This usually covers scheme management, operating and maintenance costs as well as debt financing costs. As scheme debt is paid down and the interest expense reduces, annual charges will typically fall over time (in real terms).
As the value of water rises, through greater demand, the incentives to optimise or limit use increase. NIWA has undertaken studies into improving the efficiency of water use by irrigating only when needed. This has been refined by forecasting rainfall and water availability up to 15 days ahead (such as reducing application in anticipation of rain) and also on the basis of long-term climate and soil data which provided a better spatial distribution of water needs. Achieving such high efficiency is dependent on mapping of soil types and through proper monitoring of soil moisture. Somewhat surprisingly, this is not well practiced among the farmers who typically irrigate according to their roster.
Water utilisation by farmers has improved over time. Early schemes used wild flooding, then controlled flooding (border dykes), which resulted in poor water use efficiency. Efficiency of use is highest when only water required for plants to achieve optimal growth is applied. This requirement varies spatially depending on topography, soil type and plant type, and temporally according to season, weather and hydrology. New spray systems allow for better control providing water only to the plant root zone. Excess application would be lost through surface run-off or below the root zone into groundwater, and increases the leaching of effluent and nitrates.
eCo
no
mIC
dr
Iver
s

22u
July 2012Subject to copyright
4.5 mPI rePort – eConomIC value
Several reports have been produced on the incremental productive and economic value arising from the irrigation of farmland. A key report by MPI titled “The Economic Value of Irrigation in New Zealand” was published in 2004 (based on FY 2003 data), which observed:
The net contribution of irrigation to GDP at the farm gate was estimated at $920 million in FY 2003. This represents 11% of national farm gate primary production GDP (ex-forestry). Irrigated land accounts for 475,700 ha, being 3.9% of total land farmed (ex-forestry).Incremental production represents $1.7 billion of exports (12% of total exports ex-forestry).Of this $1.7 billion, horticulture contributes $550 million, dairy farming $270 million. Canterbury has 287,000 ha (60%) of irrigated land, contributing $330 million, or $1,170/ha.Hawke’s Bay has 18,100 ha (3.8%), contributing on average $5,500/ha to GDP.Irrigated land employs 5,000 full time equivalents.The “likely” forward growth scenario predicts irrigated area to increase by 201,000 ha by 2013 (84,000 ha of private development and 117,000 ha of community schemes).The “possible” scenario predicts the irrigated area could increase by 470,000 ha by 2013.Farm gate GDP would increase by $330 million by 2013 annual ($1,640/ha) under the “likely” scenario and $660 million ($1,400/ha) under the “possible” scenario (assuming 2002/03 prices and production levels).
u
u
u
u
u
u
u
u
u
u
u
net ContrIbutIon of IrrIgatIonto farmgate gdP regIon
Irrigated Area Net Value of
irrigation Value per
irrigated hectare hectares $m p.a. $/ha p.a.
Northland 7,000 29 $4,110Auckland 7,900 54 $6,880Waikato 14,500 56 $3,840Bay of Plenty 11,400 39 $3,440Gisborne 5,600 25 $4,530Hawke’s Bay 18,100 99 $5,480Taranaki 2,900 6 $2,070Manawatu-Wanganui 8,000 21 $2,620Wellington 9,600 21 $2,270Tasman 10,000 47 $4,660Marlborough 20,200 86 $4,250Canterbury 287,200 335 $1,170Otago 68,900 87 $1,270Southland 4,100 13 $3,170
Totals 475,400 920 $1,930Source: MPI
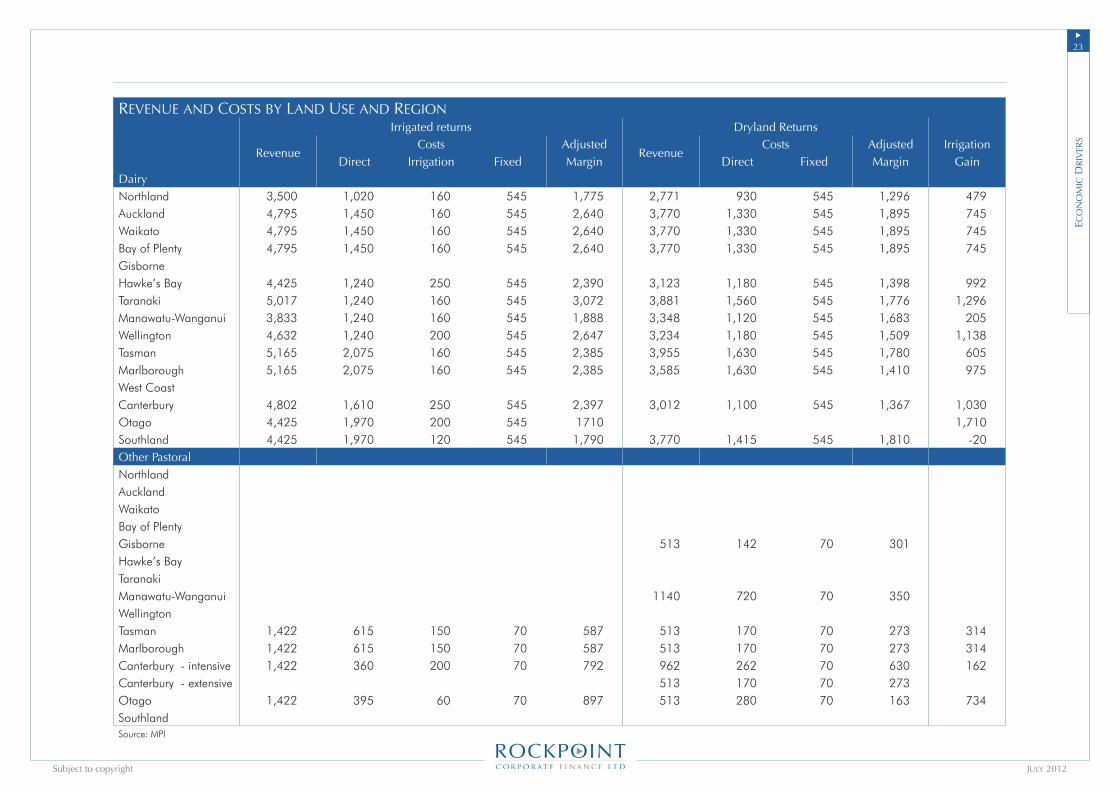
On the basis of annual income, the benefit of irrigation by region and land use is shown in the following table.
eCo
no
mIC
dr
Iver
s
2�u
July 2012Subject to copyright
revenue and Costs by land use and regIonIrrigated returns Dryland Returns
Revenue Costs Adjusted
Revenue Costs Adjusted Irrigation
Direct Irrigation Fixed Margin Direct Fixed Margin GainDairy Northland 3,500 1,020 160 545 1,775 2,771 930 545 1,296 479Auckland 4,795 1,450 160 545 2,640 3,770 1,330 545 1,895 745Waikato 4,795 1,450 160 545 2,640 3,770 1,330 545 1,895 745Bay of Plenty 4,795 1,450 160 545 2,640 3,770 1,330 545 1,895 745Gisborne Hawke’s Bay 4,425 1,240 250 545 2,390 3,123 1,180 545 1,398 992Taranaki 5,017 1,240 160 545 3,072 3,881 1,560 545 1,776 1,296Manawatu-Wanganui 3,833 1,240 160 545 1,888 3,348 1,120 545 1,683 205Wellington 4,632 1,240 200 545 2,647 3,234 1,180 545 1,509 1,138Tasman 5,165 2,075 160 545 2,385 3,955 1,630 545 1,780 605Marlborough 5,165 2,075 160 545 2,385 3,585 1,630 545 1,410 975West Coast Canterbury 4,802 1,610 250 545 2,397 3,012 1,100 545 1,367 1,030Otago 4,425 1,970 200 545 1710 1,710Southland 4,425 1,970 120 545 1,790 3,770 1,415 545 1,810 -20Other Pastoral Northland Auckland Waikato Bay of Plenty Gisborne 513 142 70 301Hawke’s Bay Taranaki Manawatu-Wanganui 1140 720 70 350Wellington Tasman 1,422 615 150 70 587 513 170 70 273 314Marlborough 1,422 615 150 70 587 513 170 70 273 314Canterbury - intensive 1,422 360 200 70 792 962 262 70 630 162Canterbury - extensive 513 170 70 273Otago 1,422 395 60 70 897 513 280 70 163 734Southland Source: MPI
eCo
no
mIC
dr
Iver
s
2�u
July 2012Subject to copyright
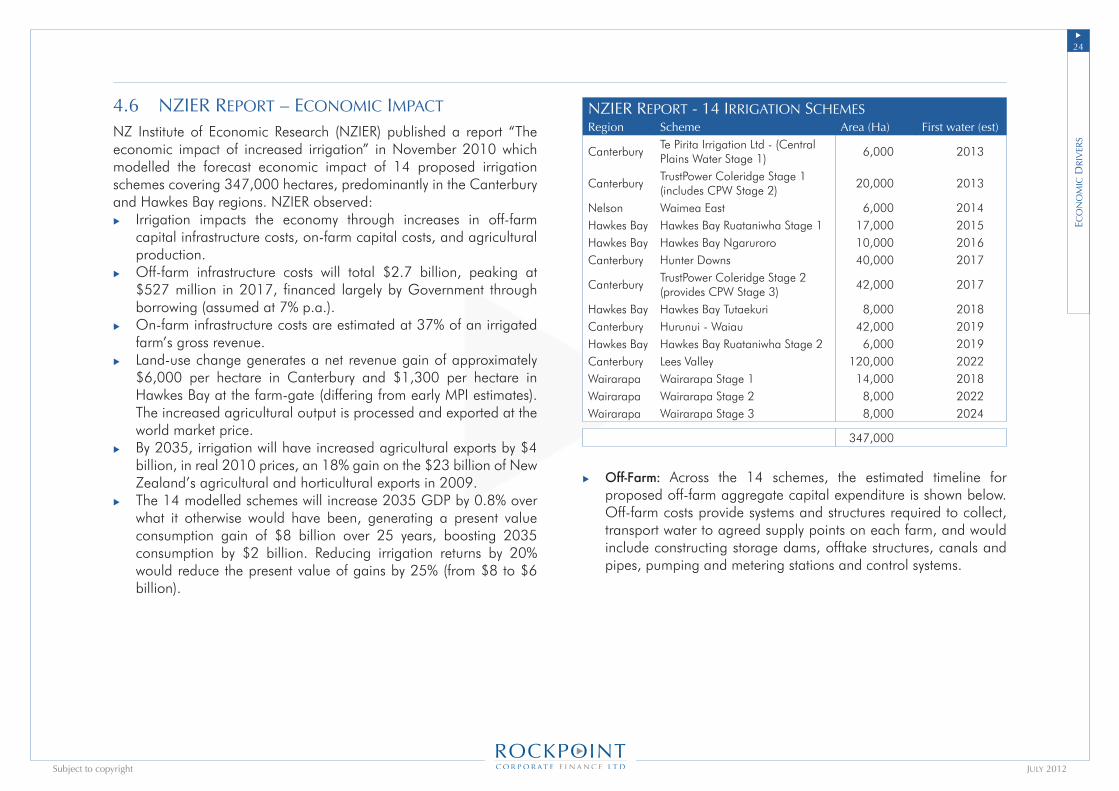
4.6 nZIer rePort – eConomIC ImPaCt
NZ Institute of Economic Research (NZIER) published a report “The economic impact of increased irrigation” in November 2010 which modelled the forecast economic impact of 14 proposed irrigation schemes covering 347,000 hectares, predominantly in the Canterbury and Hawkes Bay regions. NZIER observed:
Irrigation impacts the economy through increases in off-farm capital infrastructure costs, on-farm capital costs, and agricultural production.Off-farm infrastructure costs will total $2.7 billion, peaking at $527 million in 2017, financed largely by Government through borrowing (assumed at 7% p.a.).On-farm infrastructure costs are estimated at 37% of an irrigated farm’s gross revenue.Land-use change generates a net revenue gain of approximately $6,000 per hectare in Canterbury and $1,300 per hectare in Hawkes Bay at the farm-gate (differing from early MPI estimates). The increased agricultural output is processed and exported at the world market price. By 2035, irrigation will have increased agricultural exports by $4 billion, in real 2010 prices, an 18% gain on the $23 billion of New Zealand’s agricultural and horticultural exports in 2009.The 14 modelled schemes will increase 2035 GDP by 0.8% over what it otherwise would have been, generating a present value consumption gain of $8 billion over 25 years, boosting 2035 consumption by $2 billion. Reducing irrigation returns by 20% would reduce the present value of gains by 25% (from $8 to $6 billion).
u
u
u
u
u
u
nZIer rePort - 14 IrrIgatIon sChemes Region Scheme Area (Ha) First water (est)
CanterburyTe Pirita Irrigation Ltd - (Central Plains Water Stage 1)
6,000 2013
CanterburyTrustPower Coleridge Stage 1 (includes CPW Stage 2)
20,000 2013
Nelson Waimea East 6,000 2014Hawkes Bay Hawkes Bay Ruataniwha Stage 1 17,000 2015Hawkes Bay Hawkes Bay Ngaruroro 10,000 2016Canterbury Hunter Downs 40,000 2017
CanterburyTrustPower Coleridge Stage 2 (provides CPW Stage 3)
42,000 2017
Hawkes Bay Hawkes Bay Tutaekuri 8,000 2018Canterbury Hurunui - Waiau 42,000 2019Hawkes Bay Hawkes Bay Ruataniwha Stage 2 6,000 2019Canterbury Lees Valley 120,000 2022Wairarapa Wairarapa Stage 1 14,000 2018Wairarapa Wairarapa Stage 2 8,000 2022Wairarapa Wairarapa Stage 3 8,000 2024
347,000
Off-Farm: Across the 14 schemes, the estimated timeline for proposed off-farm aggregate capital expenditure is shown below. Off-farm costs provide systems and structures required to collect, transport water to agreed supply points on each farm, and would include constructing storage dams, offtake structures, canals and pipes, pumping and metering stations and control systems.
u
eCo
no
mIC
dr
Iver
s
2�u
July 2012Subject to copyright
off-farm InfrastruCture Costs - $ mIllIon
Source: NZIER Irrigation Report 2010
0 20 75 95
220
300
527
320
200 145
200 200 200 200
0 0 0 0 0 0 0 0 0 0 0 0
100
200
300
400
500
600
2010 2015 2020 2025 2030
Off-Farm Infrastructure Costs - $ million
Source: NZIER Irrigation Report 2010
Cumulative Expenditure $2.7 billion
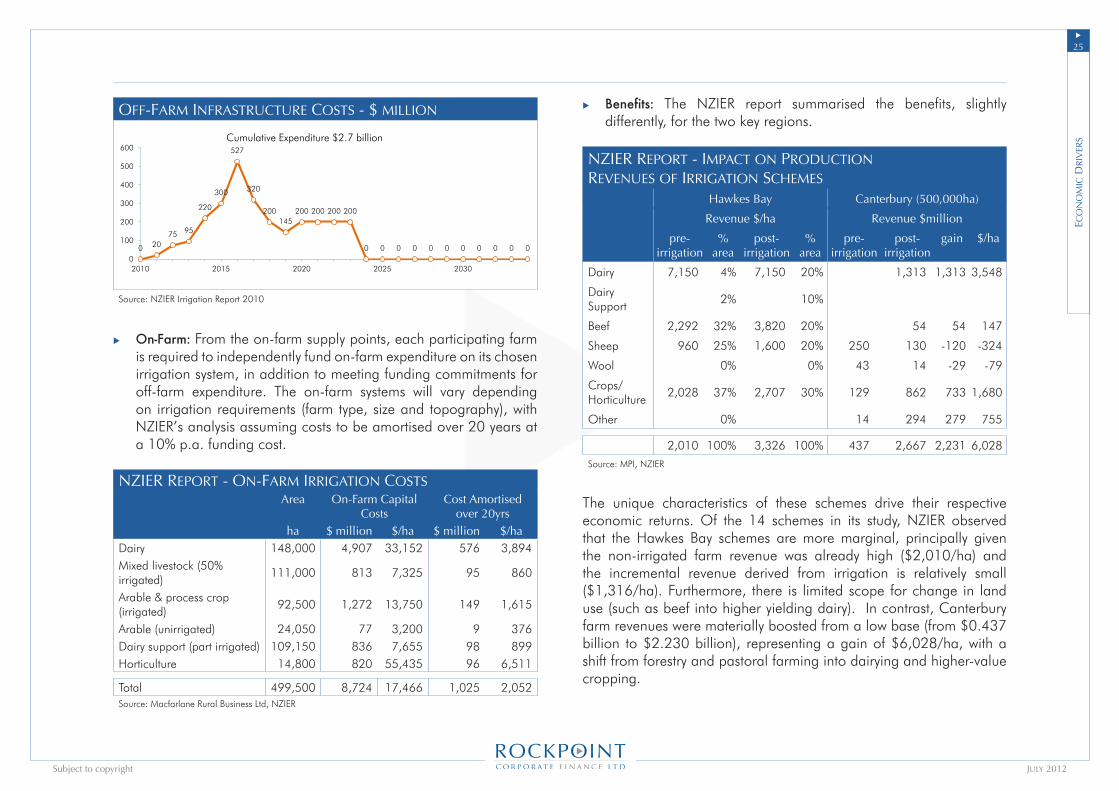
On-Farm: From the on-farm supply points, each participating farm is required to independently fund on-farm expenditure on its chosen irrigation system, in addition to meeting funding commitments for off-farm expenditure. The on-farm systems will vary depending on irrigation requirements (farm type, size and topography), with NZIER’s analysis assuming costs to be amortised over 20 years at a 10% p.a. funding cost.
nZIer rePort - on-farm IrrIgatIon CostsArea On-Farm Capital
CostsCost Amortised
over 20yrsha $ million $/ha $ million $/ha
Dairy 148,000 4,907 33,152 576 3,894Mixed livestock (50% irrigated)
111,000 813 7,325 95 860
Arable & process crop (irrigated)
92,500 1,272 13,750 149 1,615
Arable (unirrigated) 24,050 77 3,200 9 376Dairy support (part irrigated) 109,150 836 7,655 98 899Horticulture 14,800 820 55,435 96 6,511
Total 499,500 8,724 17,466 1,025 2,052Source: Macfarlane Rural Business Ltd, NZIER
u
Benefits: The NZIER report summarised the benefits, slightly differently, for the two key regions.
nZIer rePort - ImPaCt on ProduCtIonrevenues of IrrIgatIon sChemes
Hawkes Bay Canterbury (�00,000ha)
Revenue $/ha Revenue $million
pre-irrigation
% area
post-irrigation
% area
pre-irrigation
post-irrigation
gain $/ha
Dairy 7,150 4% 7,150 20% 1,313 1,313 3,548
Dairy Support
2% 10%
Beef 2,292 32% 3,820 20% 54 54 147
Sheep 960 25% 1,600 20% 250 130 -120 -324
Wool 0% 0% 43 14 -29 -79
Crops/Horticulture
2,028 37% 2,707 30% 129 862 733 1,680
Other 0% 14 294 279 755
2,010 100% 3,326 100% 437 2,667 2,231 6,028Source: MPI, NZIER
The unique characteristics of these schemes drive their respective economic returns. Of the 14 schemes in its study, NZIER observed that the Hawkes Bay schemes are more marginal, principally given the non-irrigated farm revenue was already high ($2,010/ha) and the incremental revenue derived from irrigation is relatively small ($1,316/ha). Furthermore, there is limited scope for change in land use (such as beef into higher yielding dairy). In contrast, Canterbury farm revenues were materially boosted from a low base (from $0.437 billion to $2.230 billion), representing a gain of $6,028/ha, with a shift from forestry and pastoral farming into dairying and higher-value cropping.
u
eCo
no
mIC
dr
Iver
s

2�u
July 2012Subject to copyright
The consultants NZIER cited, and the nature of their economic analysis, differed for the two regions, with neither providing breakdowns of off-farm and on-farm costs by project. Accordingly, while applying the average of costs across the 14 schemes to the regional revenue gain suggests the Hawkes Bay schemes are non economic, clearly those schemes are being promoted on the basis they are viable. Taking an average across all 14 schemes, the incremental revenue from irrigation exceeds amortised capital costs by approximately $2,200/ha.
nZIer rePort - IrrIgatIon eConomICsAmortised
$ million $ million $/ha
Revenue Gain 1,729 4,982
Off-Farm Capital Costs 2,702 255 735
On-Farm Capital Costs 8,724 1,025 2,052
Net Gain 2,196
4.6.1 wIder benefIts
Farmers are not the sole beneficiaries of the schemes, which provide a number of wider economic benefits:
Scheme construction, both off- and on-farm, employs resources and labour.Farm intensification drives increased farm productivity, often achieved through higher labour requirements and greater support from off-farm suppliers, including harvesting, processing and marketing. Indirect economic benefits include the wider multiplier effects arising from increased regional cash flows and employment, spinning off to professional services (legal, accounting), social services (health and schooling) and housing.
u
u
u
4.7 addItIonal fInanCIal ConsIderatIons
The NZIER report only considers the improvement in annual farm revenue based on greater productivity from irrigated land and partial conversion to higher value land use. A number of reports also indicate that additional indirect financial benefits accrue to irrigators through their land, shares and ability to transfer water rights.
4.7.1 land value aPPreCIatIon
A 2004 report by Crighton Anderson, commissioned by the RITSO society, investigated whether a value premium was attached to irrigated farm land within the wider Canterbury Region. Sales data was analysed for dry and irrigated land within the Canterbury Plains between 2000 and 2003 to determine average per hectare values. These are presented in the following table.
land value analysIs Dry land Irrigated Land
DistrictNumber of
TransactionsAverage
Value / haNumber of
TransactionsAverage
Value / haImplied Added
Value / ha
Hurunui 20 $6,383 18 $10,385 $4,002
Waimakariri 60 $6,388 16 $11,443 $5,055
Selwyn 33 $6,429 31 $12,186 $5,757
Ashburton 180 $6,485 62 $12,098 $5,614
Timaru 83 $5,598 24 $10,052 $4,454
Waimate 31 $5,557 27 $9,455 $3,898
Waitaki 27 $5,774 23 $12,006 $6,231
Total / Average 434 $6,182 201 $11,296 $5,114Source: NZIER
While initially unrealisable, a significant financial gain in the order of $3,900 – $6,200 per hectare accrues to the owners of irrigated land in the Canterbury Region. This premium for irrigated land is likely
eCo
no
mIC
dr
Iver
s
27u
July 2012Subject to copyright
attributable to stronger, more reliable future production and hence income stream. It can even exceed the direct revenue gains forecast by NZIER from farm conversion and greater production as a result of irrigation. The premium varies considerably across districts reflecting a number of farm and district specific factors such as rainfall levels and the need for irrigation.
The implied premium may also be higher than indicated in the report with the value of certain dry land properties possibly reflecting a partial premium where there is clear potential for irrigation in the near term. The maximum value for this premium would be the added value of irrigation per hectare less the cost of irrigation per hectare.
4.7.2 CaPItal gaIns on IrrIgatIon shares
The price for shares in an irrigation company will reflect the ongoing costs of the scheme and the value of water to irrigators. In the long-run this value will be determined by economic fundamentals incorporating the marginal cost, and marginal benefit of water to the irrigator.
Crighton Anderson investigated the trends in tradable irrigation shares finding that shares will initially trade at their offer price until the scheme is fully subscribed. The price would then trend towards the marginal cost of water, that is, the cost of the next cheapest water source (groundwater, alternate schemes). Share price appreciation would occur as the marginal cost of water rises, until equilibrium is reached whereby the marginal cost of water, equals the marginal benefit of water – the added value obtained from irrigation.
As schemes provide irrigators with a limited quantity of water per share, they will apply it to the areas where it will result in the highest level of value. Thus the conversion of farms into higher value land use such as dairying increases the marginal benefit of water (and the potential capital gains on irrigation shares) until water is allocated to its best use.
This is evident in the price history of schemes with a report on Water Transfer in Practice by Environmental Science and Research (ESR) finding that the value of shares in the Opuha Dam scheme increased substantially over time. Original investors in the South Canterbury Farmers Irrigation Society (SCFIS) were required to provide an initial deposit of $50, followed by a call of $200 for each share (1 share irrigates 4 hectares, $62.50/ha). By 2006 the scheme was fully subscribed and shares were trading at prices exceeding $4,000 ($1000/ha), highlighting the strong potential for significant capital gains on irrigation shares with embedded water rights.
4.7.3 water alloCatIon transfers
Irrigators may also be afforded the right to lease their water allocation to 3rd parties within the scheme’s catchment (provided physical feasibility) for a fixed term. This presents irrigation share holders with a small income supplement at times when they do not require water for irrigation themselves.
eCo
no
mIC
dr
Iver
s
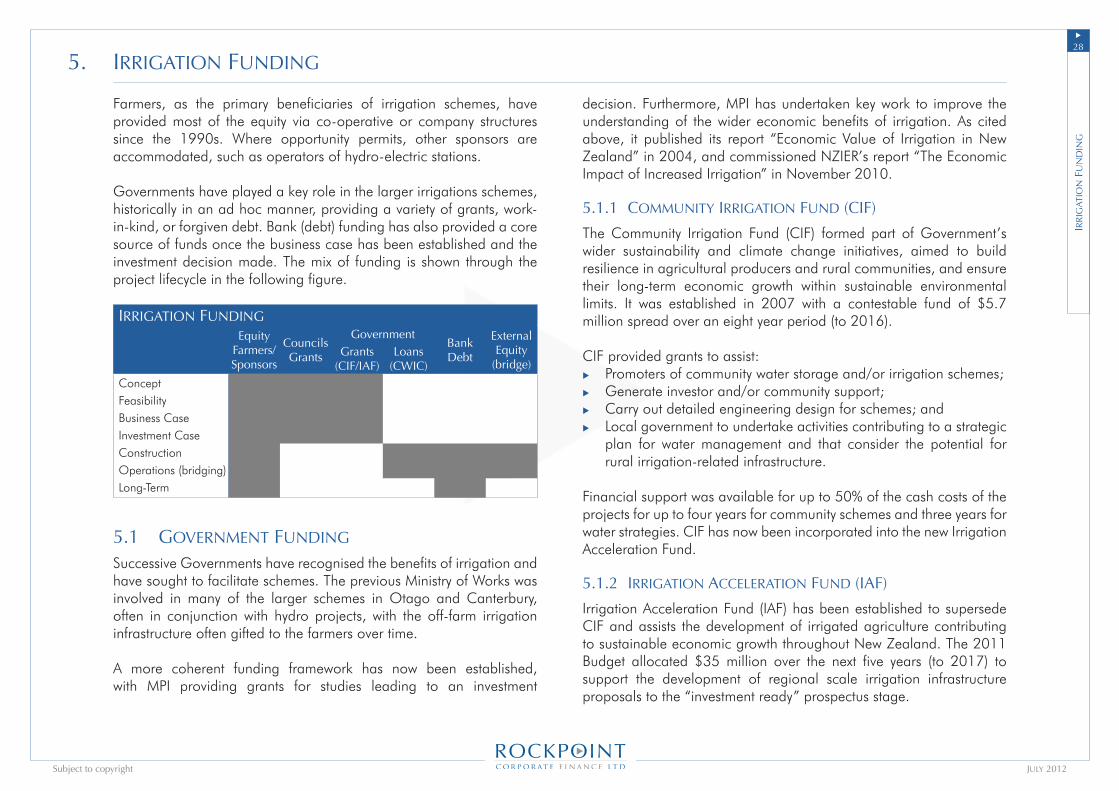
2�u
July 2012Subject to copyright
5. IrrIgatIon fundIng
Farmers, as the primary beneficiaries of irrigation schemes, have provided most of the equity via co-operative or company structures since the 1990s. Where opportunity permits, other sponsors are accommodated, such as operators of hydro-electric stations. Governments have played a key role in the larger irrigations schemes, historically in an ad hoc manner, providing a variety of grants, work-in-kind, or forgiven debt. Bank (debt) funding has also provided a core source of funds once the business case has been established and the investment decision made. The mix of funding is shown through the project lifecycle in the following figure.
IrrIgatIon fundIngEquity
Farmers/ Sponsors
Councils Grants
GovernmentBank Debt
External Equity
(bridge)Grants
(CIF/IAF)Loans
(CWIC)ConceptFeasibilityBusiness CaseInvestment CaseConstructionOperations (bridging)Long-Term
5.1 government fundIng
Successive Governments have recognised the benefits of irrigation and have sought to facilitate schemes. The previous Ministry of Works was involved in many of the larger schemes in Otago and Canterbury, often in conjunction with hydro projects, with the off-farm irrigation infrastructure often gifted to the farmers over time.
A more coherent funding framework has now been established, with MPI providing grants for studies leading to an investment
decision. Furthermore, MPI has undertaken key work to improve the understanding of the wider economic benefits of irrigation. As cited above, it published its report “Economic Value of Irrigation in New Zealand” in 2004, and commissioned NZIER’s report “The Economic Impact of Increased Irrigation” in November 2010.
5.1.1 CommunIty IrrIgatIon fund (CIf)
The Community Irrigation Fund (CIF) formed part of Government’s wider sustainability and climate change initiatives, aimed to build resilience in agricultural producers and rural communities, and ensure their long-term economic growth within sustainable environmental limits. It was established in 2007 with a contestable fund of $5.7 million spread over an eight year period (to 2016).
CIF provided grants to assist:Promoters of community water storage and/or irrigation schemes;Generate investor and/or community support;Carry out detailed engineering design for schemes; andLocal government to undertake activities contributing to a strategic plan for water management and that consider the potential for rural irrigation-related infrastructure.
Financial support was available for up to 50% of the cash costs of the projects for up to four years for community schemes and three years for water strategies. CIF has now been incorporated into the new Irrigation Acceleration Fund.
5.1.2 IrrIgatIon aCCeleratIon fund (Iaf)
Irrigation Acceleration Fund (IAF) has been established to supersede CIF and assists the development of irrigated agriculture contributing to sustainable economic growth throughout New Zealand. The 2011 Budget allocated $35 million over the next five years (to 2017) to support the development of regional scale irrigation infrastructure proposals to the “investment ready” prospectus stage.
u
u
u
u
Irr
Igat
Ion
fu
nd
Ing
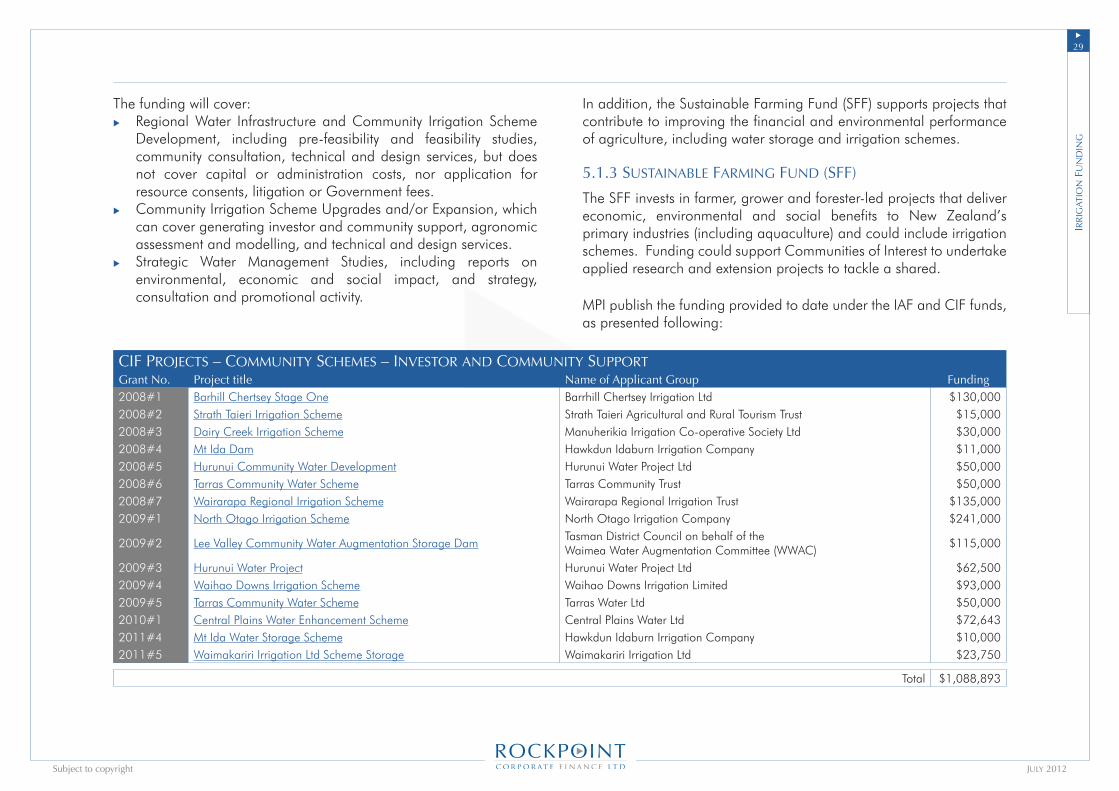
2�u
July 2012Subject to copyright
The funding will cover:Regional Water Infrastructure and Community Irrigation Scheme Development, including pre-feasibility and feasibility studies, community consultation, technical and design services, but does not cover capital or administration costs, nor application for resource consents, litigation or Government fees. Community Irrigation Scheme Upgrades and/or Expansion, which can cover generating investor and community support, agronomic assessment and modelling, and technical and design services.Strategic Water Management Studies, including reports on environmental, economic and social impact, and strategy, consultation and promotional activity.
u
u
u
In addition, the Sustainable Farming Fund (SFF) supports projects that contribute to improving the financial and environmental performance of agriculture, including water storage and irrigation schemes.
5.1.3 sustaInable farmIng fund (sff)
The SFF invests in farmer, grower and forester-led projects that deliver economic, environmental and social benefits to New Zealand’s primary industries (including aquaculture) and could include irrigation schemes. Funding could support Communities of Interest to undertake applied research and extension projects to tackle a shared.
MPI publish the funding provided to date under the IAF and CIF funds, as presented following:
CIf ProJeCts – CommunIty sChemes – Investor and CommunIty suPPortGrant No. Project title Name of Applicant Group Funding2008#1 Barhill Chertsey Stage One Barrhill Chertsey Irrigation Ltd $130,0002008#2 Strath Taieri Irrigation Scheme Strath Taieri Agricultural and Rural Tourism Trust $15,0002008#3 Dairy Creek Irrigation Scheme Manuherikia Irrigation Co-operative Society Ltd $30,0002008#4 Mt Ida Dam Hawkdun Idaburn Irrigation Company $11,0002008#5 Hurunui Community Water Development Hurunui Water Project Ltd $50,0002008#6 Tarras Community Water Scheme Tarras Community Trust $50,0002008#7 Wairarapa Regional Irrigation Scheme Wairarapa Regional Irrigation Trust $135,0002009#1 North Otago Irrigation Scheme North Otago Irrigation Company $241,000
2009#2 Lee Valley Community Water Augmentation Storage DamTasman District Council on behalf of theWaimea Water Augmentation Committee (WWAC)
$115,000
2009#3 Hurunui Water Project Hurunui Water Project Ltd $62,5002009#4 Waihao Downs Irrigation Scheme Waihao Downs Irrigation Limited $93,0002009#5 Tarras Community Water Scheme Tarras Water Ltd $50,0002010#1 Central Plains Water Enhancement Scheme Central Plains Water Ltd $72,6432011#4 Mt Ida Water Storage Scheme Hawkdun Idaburn Irrigation Company $10,0002011#5 Waimakariri Irrigation Ltd Scheme Storage Waimakariri Irrigation Ltd $23,750
Total $1,088,893
Irr
Igat
Ion
fu
nd
Ing
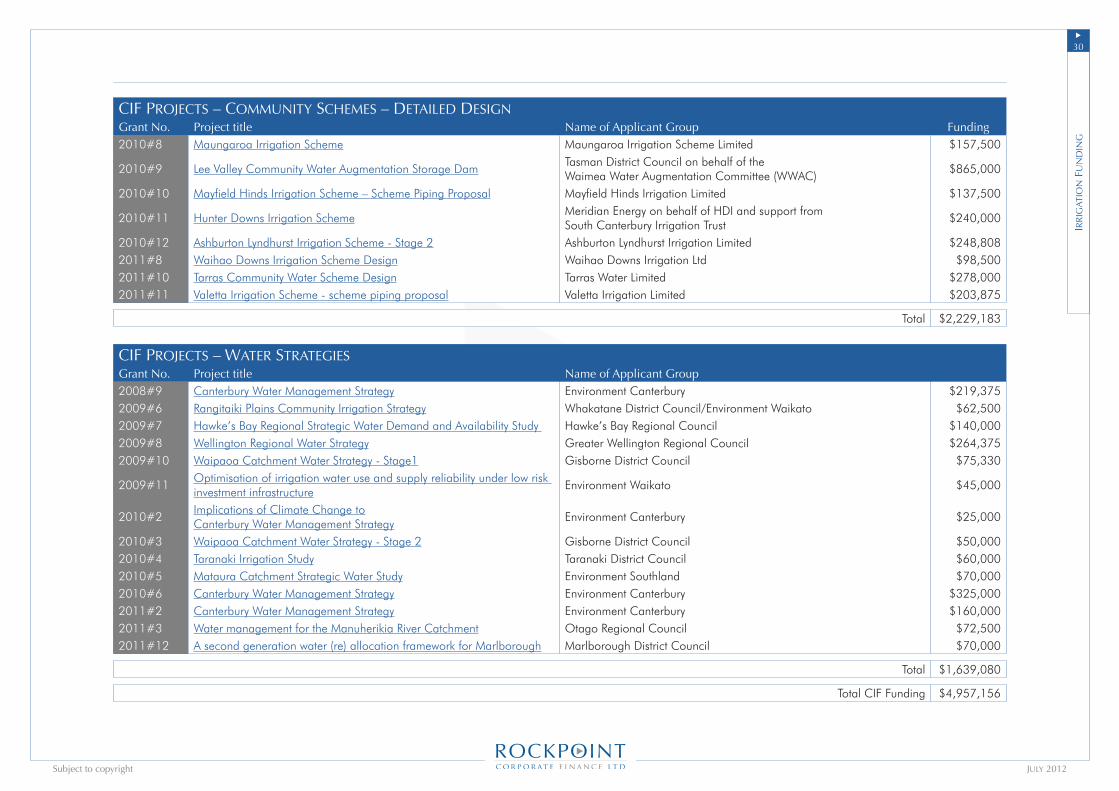
�0u
July 2012Subject to copyright
CIf ProJeCts – CommunIty sChemes – detaIled desIgnGrant No. Project title Name of Applicant Group Funding2010#8 Maungaroa Irrigation Scheme Maungaroa Irrigation Scheme Limited $157,500
2010#9 Lee Valley Community Water Augmentation Storage DamTasman District Council on behalf of theWaimea Water Augmentation Committee (WWAC)
$865,000
2010#10 Mayfield Hinds Irrigation Scheme – Scheme Piping Proposal Mayfield Hinds Irrigation Limited $137,500
2010#11 Hunter Downs Irrigation SchemeMeridian Energy on behalf of HDI and support fromSouth Canterbury Irrigation Trust
$240,000
2010#12 Ashburton Lyndhurst Irrigation Scheme - Stage 2 Ashburton Lyndhurst Irrigation Limited $248,8082011#8 Waihao Downs Irrigation Scheme Design Waihao Downs Irrigation Ltd $98,5002011#10 Tarras Community Water Scheme Design Tarras Water Limited $278,0002011#11 Valetta Irrigation Scheme - scheme piping proposal Valetta Irrigation Limited $203,875
Total $2,229,183
CIf ProJeCts – water strategIesGrant No. Project title Name of Applicant Group2008#9 Canterbury Water Management Strategy Environment Canterbury $219,3752009#6 Rangitaiki Plains Community Irrigation Strategy Whakatane District Council/Environment Waikato $62,5002009#7 Hawke’s Bay Regional Strategic Water Demand and Availability Study Hawke’s Bay Regional Council $140,0002009#8 Wellington Regional Water Strategy Greater Wellington Regional Council $264,3752009#10 Waipaoa Catchment Water Strategy - Stage1 Gisborne District Council $75,330
2009#11Optimisation of irrigation water use and supply reliability under low risk investment infrastructure
Environment Waikato $45,000
2010#2Implications of Climate Change toCanterbury Water Management Strategy
Environment Canterbury $25,000
2010#3 Waipaoa Catchment Water Strategy - Stage 2 Gisborne District Council $50,0002010#4 Taranaki Irrigation Study Taranaki District Council $60,0002010#5 Mataura Catchment Strategic Water Study Environment Southland $70,0002010#6 Canterbury Water Management Strategy Environment Canterbury $325,0002011#2 Canterbury Water Management Strategy Environment Canterbury $160,0002011#3 Water management for the Manuherikia River Catchment Otago Regional Council $72,5002011#12 A second generation water (re) allocation framework for Marlborough Marlborough District Council $70,000
Total $1,639,080
Total CIF Funding $4,957,156
Irr
Igat
Ion
fu
nd
Ing
31u
July 2012Subject to copyright
In a Pre-Budget announcement on 9th May 2012, the Government announced a package of measures recognising the strategic value of water to New Zealand’s economy and way of life, comprising:
‘Irrigation Acceleration Fund’ of $35m over five years to unlock the economic growth potential of our primary sectors by developing a more efficient and effective water infrastructure, such as storage and distribution. ‘A Fresh Start for Fresh Water Clean-Up Fund’ of $15m over two years to boost the restoration of waterways affected by historical pollution, increasing Government spending to $72.4m over four years for the clean-up of waterways. ‘A National Policy Statement’ (NPS) on freshwater management to set a consistent, nationwide regulatory framework for setting water quantity and quality limits to govern the allocation and use of freshwater.
5.1.4 Crown water Investment Company (CwIC)
In late 2011, the Government proposed an initiative to establish a Crown Water Investment Company (CWIC) to be funded up to $400 million from the Future Investment Fund (FIF), itself funded from proceeds of partial sale of state-owned assets. CWIC funding would be provided on commercial terms (repayable with interest) for bridging finance only.
u
u
u
5.2 Debt FunDIng
Irrigation schemes have historically relied heavily on debt funding. Within their prudent approval frameworks, banks have willingly lent following an investment decision, even providing high leverage to some projects. The banks protections are typically:
Low risk: Irrigation schemes, while sometimes large, are not typically complex. As such, the range of risks is readily apparent, including civil construction scope and costs, off-take agreements and extensive hydrology records. Revenue certainty: Scheme beneficiaries commit to contractual off-take agreements through which they buy an agreed quantity of water at an agreed price. The uncertainty for the irrigation company rests with hydrology, which may restrict water available for allocation, although even that variability is well understood.Secured: The lending will be secured against the enduring value of the irrigation scheme assets, and off-take agreements.
u
u
u
Irr
Igat
Ion
Fu
nD
Ing
�2u
July 2012Subject to copyright
5.3 equIty fundIng
Equity funding is required as risk capital for irrigation schemes in combination with debt funding and Government grants.
5.3.1 farmers
Farmers are the primary beneficiaries of irrigation schemes, and as a consequence have provided most of the equity via co-operative or company structures. It is noted that, in order to benefit from irrigation, individual farmers must develop on-farm infrastructure. This is funded through a mix of debt and equity.
Farmers have proven determined to maintain outright ownership of irrigation schemes, or to buy out other sponsors once the schemes are operating (e.g. Opuha). The resultant funding constraints drive many farmers to minimise scheme capital costs rather than seek to optimise the whole-of-life value. The consequence is that many existing schemes carry unnecessarily high operating costs, and do not maximise the value of water available, or may require expensive modification or retrofits.
5.3.2 Co-sPonsors
Early irrigation schemes in combination with hydro-electric generation (hydro) development benefited from Government sponsorship and far more ambitious schemes (storage, offtake volumes) than would otherwise have been considered by farmers in isolation. The Government was also an ideal scheme partner for farmers given it was mindful of the wider economic benefits arising from irrigation, and it vested its interest in many schemes without monetary consideration.
5.3.3 new fundIng oPtIons are emergIng
Farmers are understandably concerned by cost creep, with unforeseen costs arising from protracted design/consenting costs, inflation impacts, and specification creep. Rockpoint understands some construction contractors are willing to accept these risks, offering turnkey contract terms. In addition to providing a fixed delivery price, contractors can undertake final scheme design, consenting, construction and project financing. Rooney Group of South Canterbury is an example of an entity that has achieved considerable success with progressively larger projects in Canterbury and North Otago.
Irrigation schemes have long-term investment characteristics attractive to infrastructure investors, being well secured, low risk projects. Farmers’ natural conservatism, the level of Government support available, and commercial banks willingness to employ debt leverage on these schemes has not yet provided such opportunities. However specialist wholesale infrastructure investors such as ACC, PIP and/or Infratil may present an option to secure post-construction target funding for larger schemes and may also be considered acceptable to project sponsors.
Rockpoint is able to assist irrigation companies with both financial structuring options and securing funding.
Irr
Igat
Ion
fu
nd
Ing
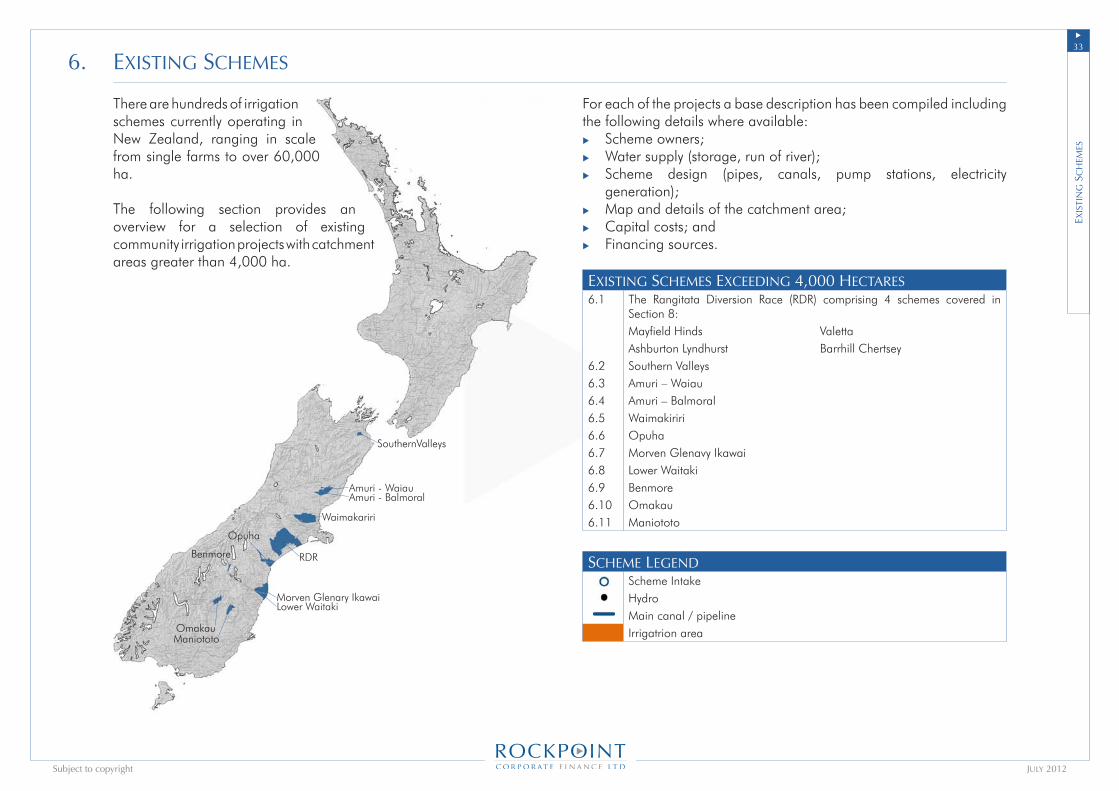
��u
July 2012Subject to copyright
SouthernValleys
Amuri - WaiauAmuri - Balmoral
Waimakariri
RDR
Opuha
Morven Glenary IkawaiLower Waitaki
Benmore
ManiototoOmakau
6. exIstIng sChemes
There are hundreds of irrigation schemes currently operating in New Zealand, ranging in scale from single farms to over 60,000 ha.
The following section provides an overview for a selection of existing community irrigation projects with catchment areas greater than 4,000 ha.
exIs
tIn
g s
Ch
emes
For each of the projects a base description has been compiled including the following details where available:
Scheme owners;Water supply (storage, run of river);Scheme design (pipes, canals, pump stations, electricity generation);Map and details of the catchment area;Capital costs; andFinancing sources.
exIstIng sChemes exCeedIng 4,000 heCtares6.1 The Rangitata Diversion Race (RDR) comprising 4 schemes covered in
Section 8:Mayfield Hinds ValettaAshburton Lyndhurst Barrhill Chertsey
6.2 Southern Valleys6.3 Amuri – Waiau6.4 Amuri – Balmoral6.5 Waimakiriri6.6 Opuha6.7 Morven Glenavy Ikawai6.8 Lower Waitaki6.9 Benmore6.10 Omakau6.11 Maniototo
sCheme legendScheme IntakeHydroMain canal / pipelineIrrigatrion area
u
u
u
u
u
u

��u
July 2012Subject to copyright
6.1 rangItata dIversIon raCe
Highbank28mw
Montalto1.8mw
Ultimate Command Area
Barhill Churtsey
Ashburton Lyndhurst
Valetta
Mayfield Hinds
The Canterbury Plains were recognised early for their agricultural potential, but for lack of summer rainfall. Irrigation was soon recognised as a solution, and the Rangitata Diversion Race (RDR) was conceived. The catalyst to commence the RDR was unemployment during the 1930s depression, with the Minister of Public Works, Bob Semple
proclaiming ”Water put to work”. The Government began constructing the 67km long RDR in 1937, completing it in 1944 at a cost of £2 million pounds. It draws up to 33.95 m3/sec from an intake and sand trap at Klondyke on the Rangitata River. Additionally, up to 7 m3/sec is available to be taken from the intersecting South Ashburton River when available. The canal incorporates check gates, spillways and siphons passing under rivers and streams, with upgrades and improvements undertaken periodically.
The RDR is an integrated irrigation-hydro scheme, discharging water into the irrigation schemes and ultimately via the 25.5MW Highbank hydro station into the Rakaia River. In 1982 the 1.8MW Montalto hydro station was added, located between the Mayfield Hinds and Valetta irrigation scheme intakes. Both stations are now owned by TrustPower. Water from the Rangitata River passes through the RDR serving three separate community irrigation schemes which draw up to 33.95 m3/sec irrigating 66,000 ha:
Mayfield Hinds - 32,000 - allocation 16.5 m3/sec.Valetta - 7,300 hectares - allocation 4.4 m3/sec.Ashburton Lyndhurst - 25,000 hectares - allocation 13.0 m3/sec.A fourth scheme (Barrhill Chertsey) also utilises the RDR system pumping 8.0 m3/sec of water from the Raikaia River back into the race to irrigate a 17,600 ha area.
Still New Zealand’s largest irrigation scheme, RDR is responsible for transforming a large part of mid-Canterbury into highly productive farmland. Irrigation has priority use of water over the irrigation season (September 10th to May 9th) while the power stations have precedence for the remainder of the year. These schemes are all subject to upgrade proposals covered under Section 8 of this report – Proposed Schemes.
www.rdrml.co.nz
u
u
u
u
exIs
tIn
g s
Ch
emes
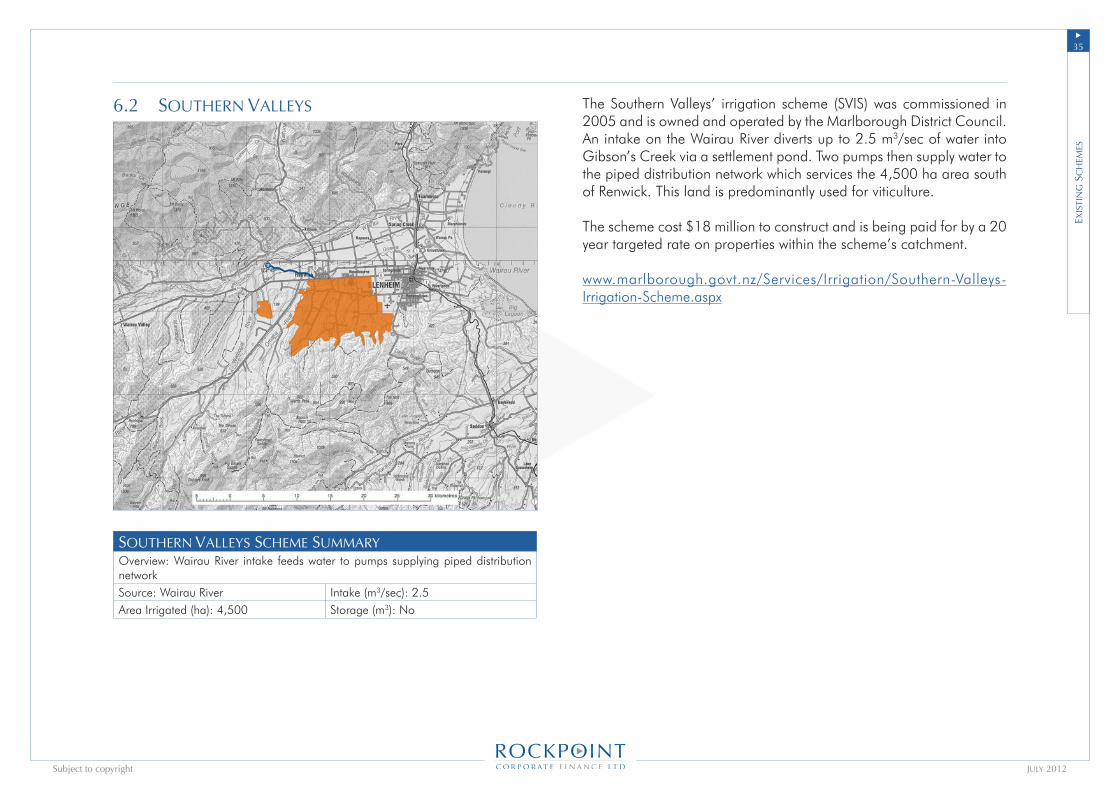
��u
July 2012Subject to copyright
6.2 southern valleys
southern valleys sCheme summaryOverview: Wairau River intake feeds water to pumps supplying piped distribution networkSource: Wairau River Intake (m3/sec): 2.5Area Irrigated (ha): 4,500 Storage (m3): No
The Southern Valleys’ irrigation scheme (SVIS) was commissioned in 2005 and is owned and operated by the Marlborough District Council. An intake on the Wairau River diverts up to 2.5 m3/sec of water into Gibson’s Creek via a settlement pond. Two pumps then supply water to the piped distribution network which services the 4,500 ha area south of Renwick. This land is predominantly used for viticulture.
The scheme cost $18 million to construct and is being paid for by a 20 year targeted rate on properties within the scheme’s catchment.
www.marlborough.govt.nz/Services/Irrigation/Southern-Valleys-Irrigation-Scheme.aspx
exIs
tIn
g s
Ch
emes
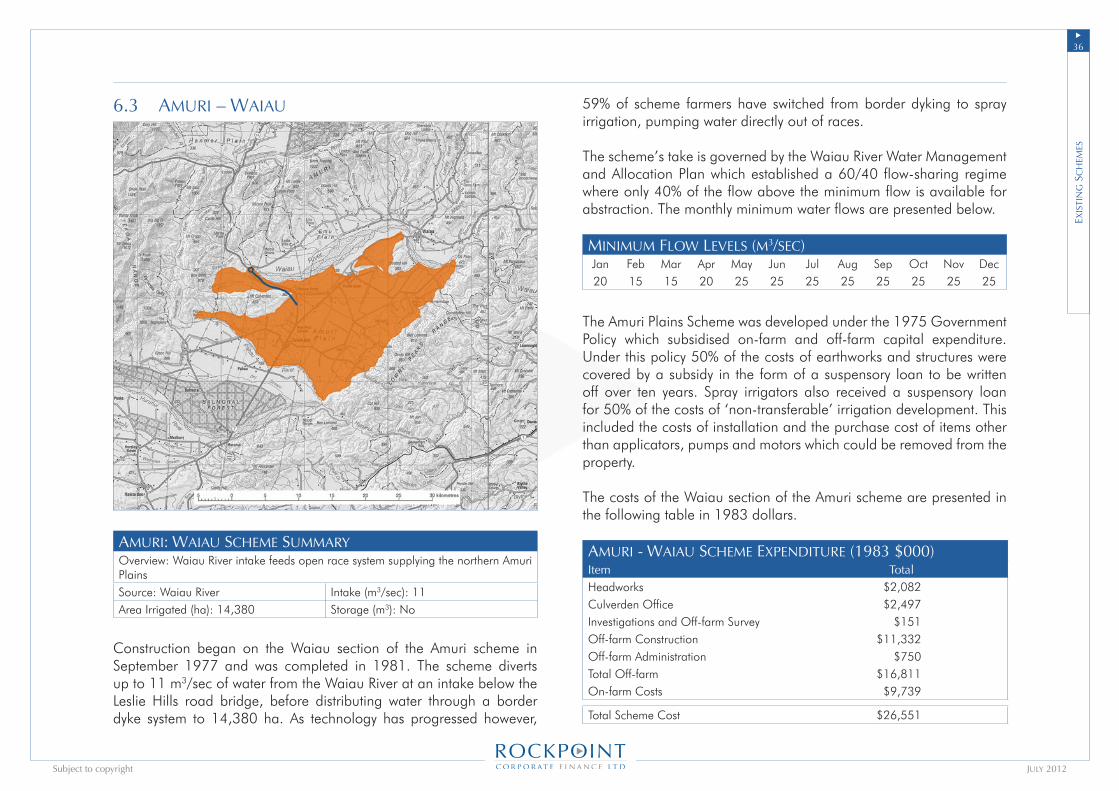
��u
July 2012Subject to copyright
6.3 amurI – waIau
amurI: waIau sCheme summaryOverview: Waiau River intake feeds open race system supplying the northern Amuri PlainsSource: Waiau River Intake (m3/sec): 11Area Irrigated (ha): 14,380 Storage (m3): No
Construction began on the Waiau section of the Amuri scheme in September 1977 and was completed in 1981. The scheme diverts up to 11 m3/sec of water from the Waiau River at an intake below the Leslie Hills road bridge, before distributing water through a border dyke system to 14,380 ha. As technology has progressed however,
59% of scheme farmers have switched from border dyking to spray irrigation, pumping water directly out of races.
The scheme’s take is governed by the Waiau River Water Management and Allocation Plan which established a 60/40 flow-sharing regime where only 40% of the flow above the minimum flow is available for abstraction. The monthly minimum water flows are presented below.
mInImum flow levels (m3/seC)Jan Feb Mar Apr May Jun Jul Aug Sep Oct Nov Dec20 15 15 20 25 25 25 25 25 25 25 25
The Amuri Plains Scheme was developed under the 1975 Government Policy which subsidised on-farm and off-farm capital expenditure. Under this policy 50% of the costs of earthworks and structures were covered by a subsidy in the form of a suspensory loan to be written off over ten years. Spray irrigators also received a suspensory loan for 50% of the costs of ‘non-transferable’ irrigation development. This included the costs of installation and the purchase cost of items other than applicators, pumps and motors which could be removed from the property.
The costs of the Waiau section of the Amuri scheme are presented in the following table in 1983 dollars.
amurI - waIau sCheme exPendIture (1983 $000)Item TotalHeadworks $2,082Culverden Office $2,497Investigations and Off-farm Survey $151Off-farm Construction $11,332Off-farm Administration $750Total Off-farm $16,811On-farm Costs $9,739
Total Scheme Cost $26,551
exIs
tIn
g s
Ch
emes
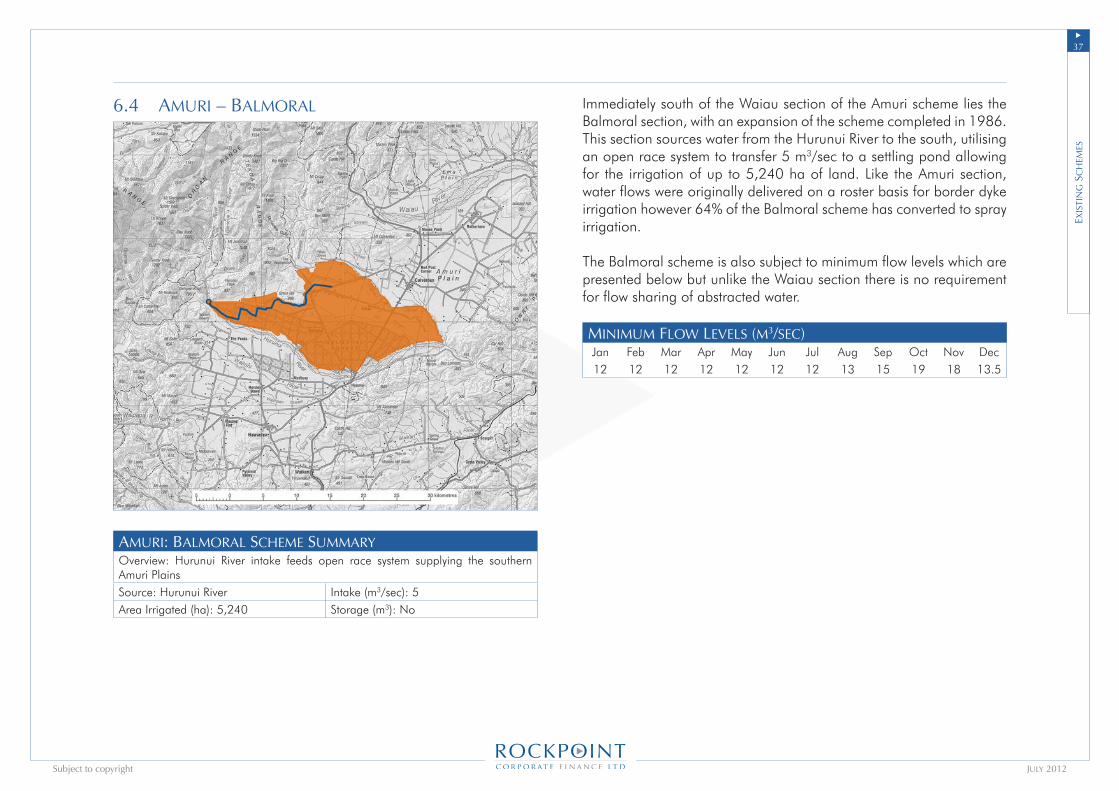
�7u
July 2012Subject to copyright
6.4 amurI – balmoral
amurI: balmoral sCheme summaryOverview: Hurunui River intake feeds open race system supplying the southern Amuri PlainsSource: Hurunui River Intake (m3/sec): 5Area Irrigated (ha): 5,240 Storage (m3): No
Immediately south of the Waiau section of the Amuri scheme lies the Balmoral section, with an expansion of the scheme completed in 1986. This section sources water from the Hurunui River to the south, utilising an open race system to transfer 5 m3/sec to a settling pond allowing for the irrigation of up to 5,240 ha of land. Like the Amuri section, water flows were originally delivered on a roster basis for border dyke irrigation however 64% of the Balmoral scheme has converted to spray irrigation.
The Balmoral scheme is also subject to minimum flow levels which are presented below but unlike the Waiau section there is no requirement for flow sharing of abstracted water.
mInImum flow levels (m3/seC)Jan Feb Mar Apr May Jun Jul Aug Sep Oct Nov Dec12 12 12 12 12 12 12 13 15 19 18 13.5
exIs
tIn
g s
Ch
emes
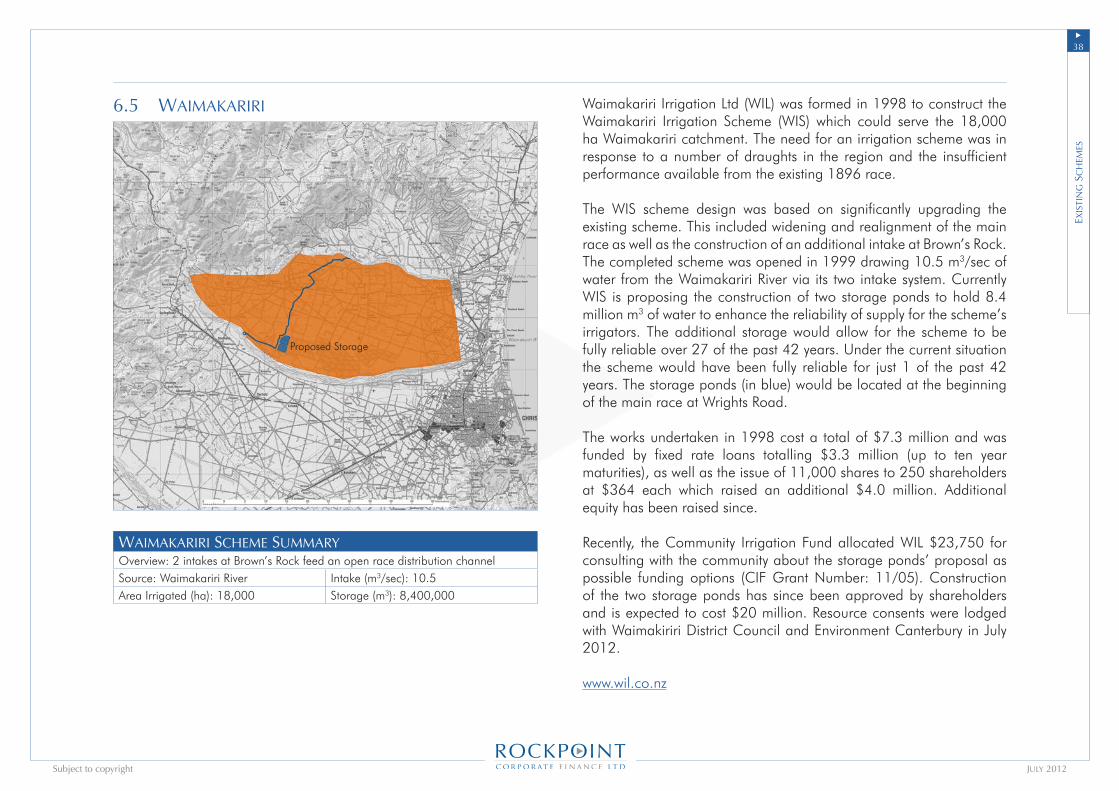
��u
July 2012Subject to copyright
6.5 waImakarIrI
Proposed Storage
waImakarIrI sCheme summary Overview: 2 intakes at Brown’s Rock feed an open race distribution channelSource: Waimakariri River Intake (m3/sec): 10.5Area Irrigated (ha): 18,000 Storage (m3): 8,400,000
Waimakariri Irrigation Ltd (WIL) was formed in 1998 to construct the Waimakariri Irrigation Scheme (WIS) which could serve the 18,000 ha Waimakariri catchment. The need for an irrigation scheme was in response to a number of draughts in the region and the insufficient performance available from the existing 1896 race.
The WIS scheme design was based on significantly upgrading the existing scheme. This included widening and realignment of the main race as well as the construction of an additional intake at Brown’s Rock. The completed scheme was opened in 1999 drawing 10.5 m3/sec of water from the Waimakariri River via its two intake system. Currently WIS is proposing the construction of two storage ponds to hold 8.4 million m3 of water to enhance the reliability of supply for the scheme’s irrigators. The additional storage would allow for the scheme to be fully reliable over 27 of the past 42 years. Under the current situation the scheme would have been fully reliable for just 1 of the past 42 years. The storage ponds (in blue) would be located at the beginning of the main race at Wrights Road.
The works undertaken in 1998 cost a total of $7.3 million and was funded by fixed rate loans totalling $3.3 million (up to ten year maturities), as well as the issue of 11,000 shares to 250 shareholders at $364 each which raised an additional $4.0 million. Additional equity has been raised since.
Recently, the Community Irrigation Fund allocated WIL $23,750 for consulting with the community about the storage ponds’ proposal as possible funding options (CIF Grant Number: 11/05). Construction of the two storage ponds has since been approved by shareholders and is expected to cost $20 million. Resource consents were lodged with Waimakiriri District Council and Environment Canterbury in July 2012.
www.wil.co.nz
exIs
tIn
g s
Ch
emes

��u
July 2012Subject to copyright
6.6 oPuha
Lake OpuhaOpuha - 7.5mw
oPuha sCheme summaryOverview: Storage lake scheme created through damming of the North & South Opuha RiversSource: Opuha Rivers Intake (m3/sec): N/AArea Irrigated (ha): 16,000 Storage (m3): 72,000,000
The Opuha Dam is situated at the confluence of the North and South Opuha Rivers and upon completion in 1999, created Lake Opuha. The storage lake is contained behind the 50m high earth dam and is capable of storing 72 million m3 of water. The dam is operated by TrustPower such that they can control the dam’s single hydro turbine capable of generating 7.0 MW of electricity. Water is released from the lake through the dam for electricity generation and during low river flow periods for irrigation.
An area of 16,000 ha is covered by the scheme.
Ownership of Opuha is now vested with Opuha Water Limited, with irrigators holding direct shareholdings in the Company itself. Funding for the $34 million scheme was provided 50% equity, 50% debt which included $775,000 loans from two original equity investors: Alpine Electricity and Timaru District Council.
Opuha Water has recently proposed the expansion of the scheme in a concept which would see water taken from Lake Tekapo via Burkes Pass and Ashwick Flats, to the Opuha Dam and on to new and existing irrigation schemes between Fairlie and Pareora. It would cost $185 million and irrigate an area covering 25,000 hectares.
www.opuhawater.co.nz/
exIs
tIn
g s
Ch
emes
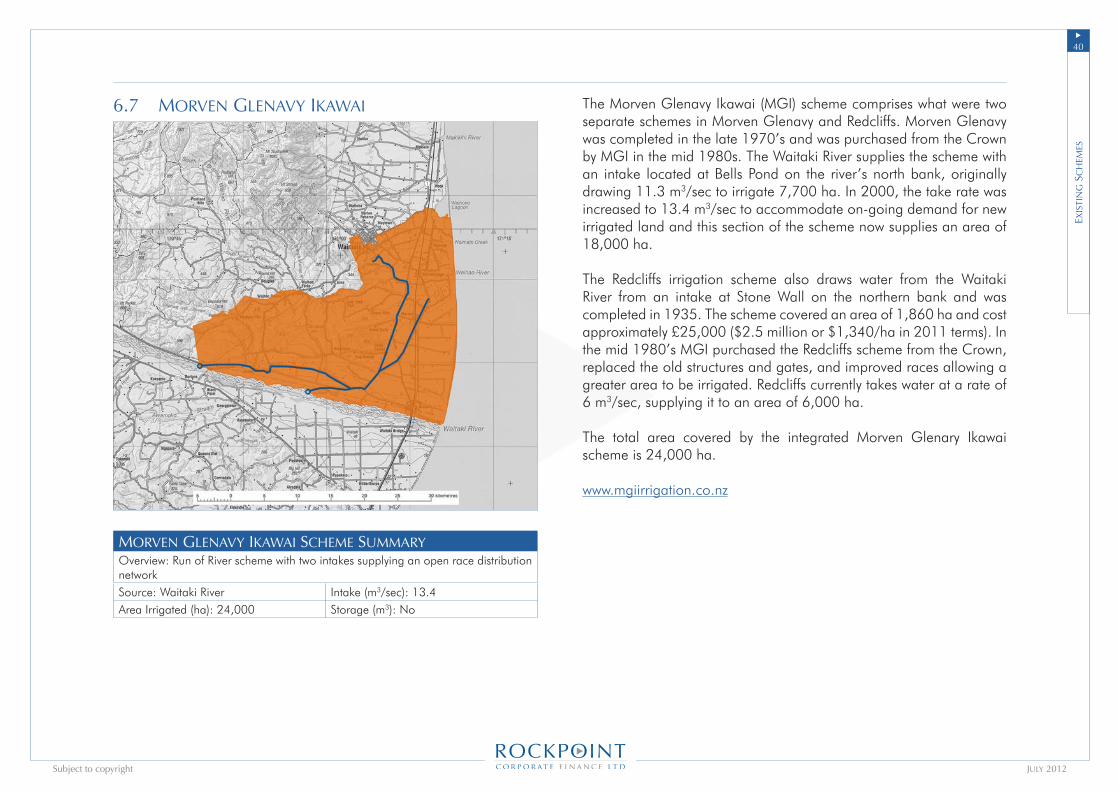
�0u
July 2012Subject to copyright
6.7 morven glenavy IkawaI
morven glenavy IkawaI sCheme summaryOverview: Run of River scheme with two intakes supplying an open race distribution networkSource: Waitaki River Intake (m3/sec): 13.4Area Irrigated (ha): 24,000 Storage (m3): No
The Morven Glenavy Ikawai (MGI) scheme comprises what were two separate schemes in Morven Glenavy and Redcliffs. Morven Glenavy was completed in the late 1970’s and was purchased from the Crown by MGI in the mid 1980s. The Waitaki River supplies the scheme with an intake located at Bells Pond on the river’s north bank, originally drawing 11.3 m3/sec to irrigate 7,700 ha. In 2000, the take rate was increased to 13.4 m3/sec to accommodate on-going demand for new irrigated land and this section of the scheme now supplies an area of 18,000 ha.
The Redcliffs irrigation scheme also draws water from the Waitaki River from an intake at Stone Wall on the northern bank and was completed in 1935. The scheme covered an area of 1,860 ha and cost approximately £25,000 ($2.5 million or $1,340/ha in 2011 terms). In the mid 1980’s MGI purchased the Redcliffs scheme from the Crown, replaced the old structures and gates, and improved races allowing a greater area to be irrigated. Redcliffs currently takes water at a rate of 6 m3/sec, supplying it to an area of 6,000 ha.
The total area covered by the integrated Morven Glenary Ikawai scheme is 24,000 ha. www.mgiirrigation.co.nz
exIs
tIn
g s
Ch
emes
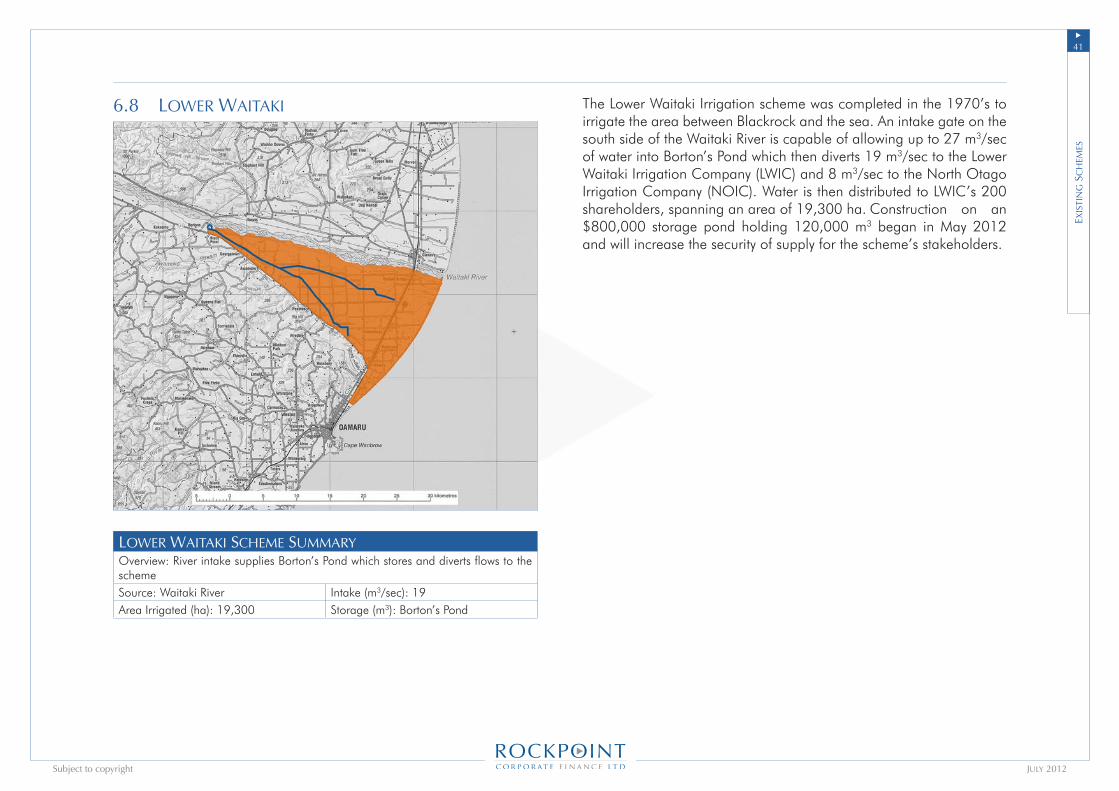
�1u
July 2012Subject to copyright
6.8 lower waItakI
lower waItakI sCheme summaryOverview: River intake supplies Borton’s Pond which stores and diverts flows to the schemeSource: Waitaki River Intake (m3/sec): 19Area Irrigated (ha): 19,300 Storage (m3): Borton’s Pond
The Lower Waitaki Irrigation scheme was completed in the 1970’s to irrigate the area between Blackrock and the sea. An intake gate on the south side of the Waitaki River is capable of allowing up to 27 m3/sec of water into Borton’s Pond which then diverts 19 m3/sec to the Lower Waitaki Irrigation Company (LWIC) and 8 m3/sec to the North Otago Irrigation Company (NOIC). Water is then distributed to LWIC’s 200 shareholders, spanning an area of 19,300 ha. Construction on an $800,000 storage pond holding 120,000 m3 began in May 2012 and will increase the security of supply for the scheme’s stakeholders.
exIs
tIn
g s
Ch
emes
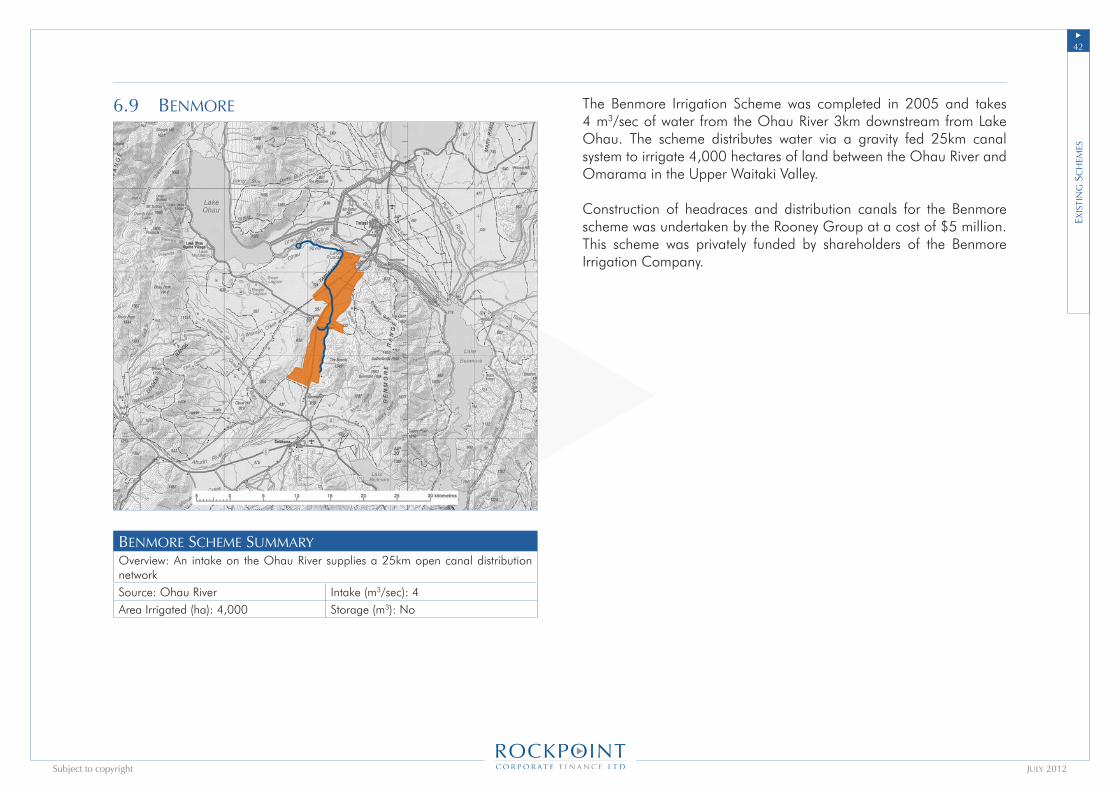
�2u
July 2012Subject to copyright
6.9 benmore
benmore sCheme summaryOverview: An intake on the Ohau River supplies a 25km open canal distribution networkSource: Ohau River Intake (m3/sec): 4Area Irrigated (ha): 4,000 Storage (m3): No
The Benmore Irrigation Scheme was completed in 2005 and takes 4 m3/sec of water from the Ohau River 3km downstream from Lake Ohau. The scheme distributes water via a gravity fed 25km canal system to irrigate 4,000 hectares of land between the Ohau River and Omarama in the Upper Waitaki Valley.
Construction of headraces and distribution canals for the Benmore scheme was undertaken by the Rooney Group at a cost of $5 million. This scheme was privately funded by shareholders of the Benmore Irrigation Company.
exIs
tIn
g s
Ch
emes
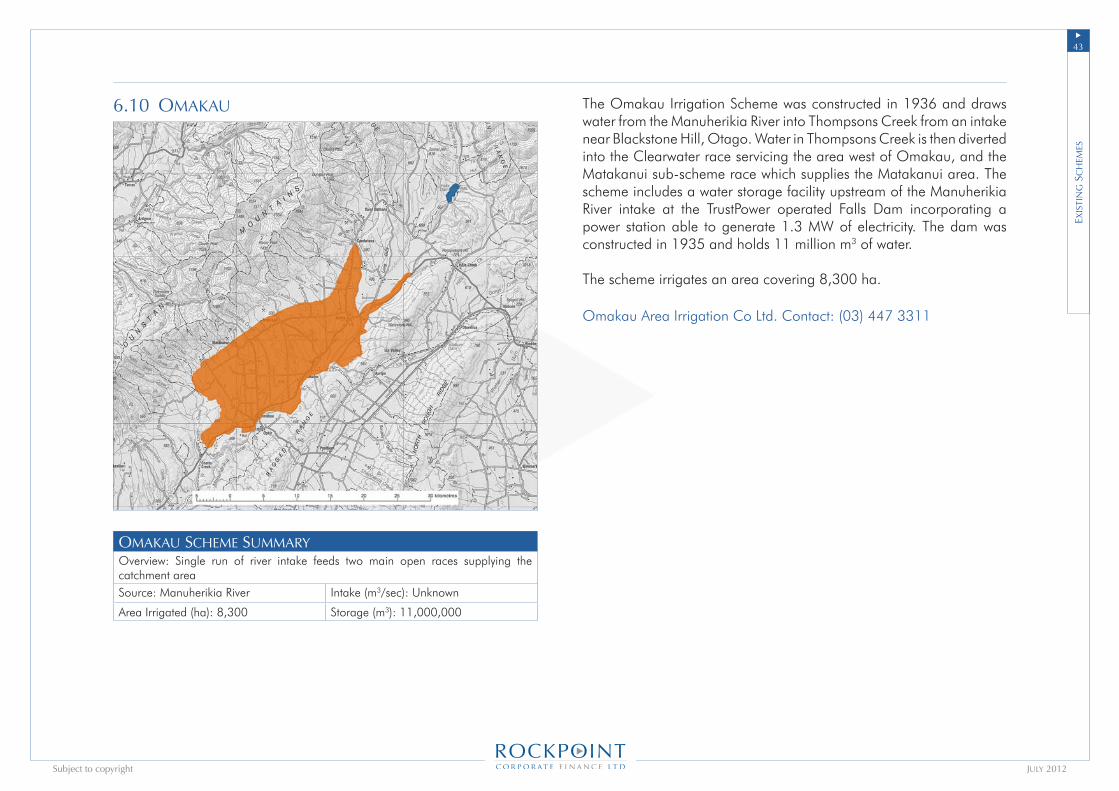
��u
July 2012Subject to copyright
6.10 omakau
omakau sCheme summaryOverview: Single run of river intake feeds two main open races supplying the catchment areaSource: Manuherikia River Intake (m3/sec): Unknown
Area Irrigated (ha): 8,300 Storage (m3): 11,000,000
The Omakau Irrigation Scheme was constructed in 1936 and draws water from the Manuherikia River into Thompsons Creek from an intake near Blackstone Hill, Otago. Water in Thompsons Creek is then diverted into the Clearwater race servicing the area west of Omakau, and the Matakanui sub-scheme race which supplies the Matakanui area. The scheme includes a water storage facility upstream of the Manuherikia River intake at the TrustPower operated Falls Dam incorporating a power station able to generate 1.3 MW of electricity. The dam was constructed in 1935 and holds 11 million m3 of water.
The scheme irrigates an area covering 8,300 ha.
Omakau Area Irrigation Co Ltd. Contact: (03) 447 3311
exIs
tIn
g s
Ch
emes
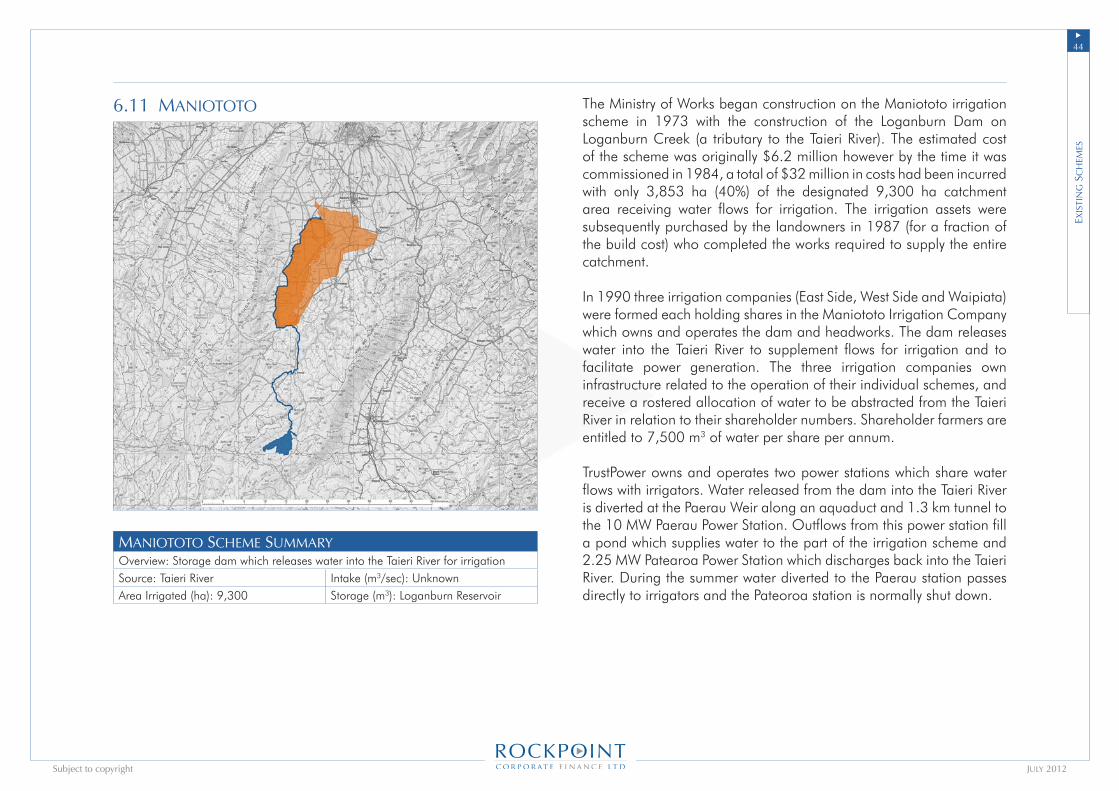
��u
July 2012Subject to copyright
6.11 manIototo
manIototo sCheme summaryOverview: Storage dam which releases water into the Taieri River for irrigationSource: Taieri River Intake (m3/sec): UnknownArea Irrigated (ha): 9,300 Storage (m3): Loganburn Reservoir
The Ministry of Works began construction on the Maniototo irrigation scheme in 1973 with the construction of the Loganburn Dam on Loganburn Creek (a tributary to the Taieri River). The estimated cost of the scheme was originally $6.2 million however by the time it was commissioned in 1984, a total of $32 million in costs had been incurred with only 3,853 ha (40%) of the designated 9,300 ha catchment area receiving water flows for irrigation. The irrigation assets were subsequently purchased by the landowners in 1987 (for a fraction of the build cost) who completed the works required to supply the entire catchment.
In 1990 three irrigation companies (East Side, West Side and Waipiata) were formed each holding shares in the Maniototo Irrigation Company which owns and operates the dam and headworks. The dam releases water into the Taieri River to supplement flows for irrigation and to facilitate power generation. The three irrigation companies own infrastructure related to the operation of their individual schemes, and receive a rostered allocation of water to be abstracted from the Taieri River in relation to their shareholder numbers. Shareholder farmers are entitled to 7,500 m3 of water per share per annum.
TrustPower owns and operates two power stations which share water flows with irrigators. Water released from the dam into the Taieri River is diverted at the Paerau Weir along an aquaduct and 1.3 km tunnel to the 10 MW Paerau Power Station. Outflows from this power station fill a pond which supplies water to the part of the irrigation scheme and 2.25 MW Patearoa Power Station which discharges back into the Taieri River. During the summer water diverted to the Paerau station passes directly to irrigators and the Pateoroa station is normally shut down.
exIs
tIn
g s
Ch
emes

��u
July 2012Subject to copyright
Ruataniwha
Wairarapa
SouthernValleysWairau
Lee ValleyWaimea
Amuri - WaiauAmuri - BalmoralHurinui
WaimakaririCentral Plains
Barhill ChurtseyAshburton LyndhurstValettaMayfield Hinds
RDR
Opuha
Rangitata SouthHunter Downs Waihao DownsMorven Glenary IkawaiLower WaitakiNorth OtagoStrath Taieri
Benmore
Tarras
Manuherikia
Mt Ida
ManiototoOmakau
7. Current IrrIgatIon develoPments
The following is an overview of some irrigation projects currently under development. The majority have received Government funding from the Sustainable Farming Fund (SFF), Community Irrigation Fund (CIF) prior to its amalgamation with the Irrigation Acceleration Fund (IAF), and the IAF itself.
Cu
rr
ent
Irr
Igat
Ion
dev
elo
Pmen
tsFor each of the projects a base description has been compiled including the following details where available:
Project sponsors;Water supply (storage, run of river);Scheme design (pipes, canals, pump stations, electricity generation);Map and details of the catchment area;Projected capital costs;Proposed funding sources;Government funding received; andProject’s current status and expected year of completion.
Index7.1 Rautaniwha7.2 Ngaruroro and Tutaekuri7.3 Maungaroa7.4 Wairarapa7.5 Lee Valley / Waimea East7.6 Wairau7.7 Amuri7.8 Hurunui7.9 Lees Valley7.10 Central Plains7.11 Lake Coleridge7.12 Barrhill Chertsey7.13 Ashburton Lyndhurst7.14 Valetta7.15 Mayfield Hinds7.16 Rangitata South7.17 Hunter Downs7.18 Waihao Downs7.19 North Otago7.20 Tarras7.21 Manuherikia – Dairy Creek7.22 Mount Ida Dam7.23 Strath Taieri
u
u
u
u
u
u
u
u
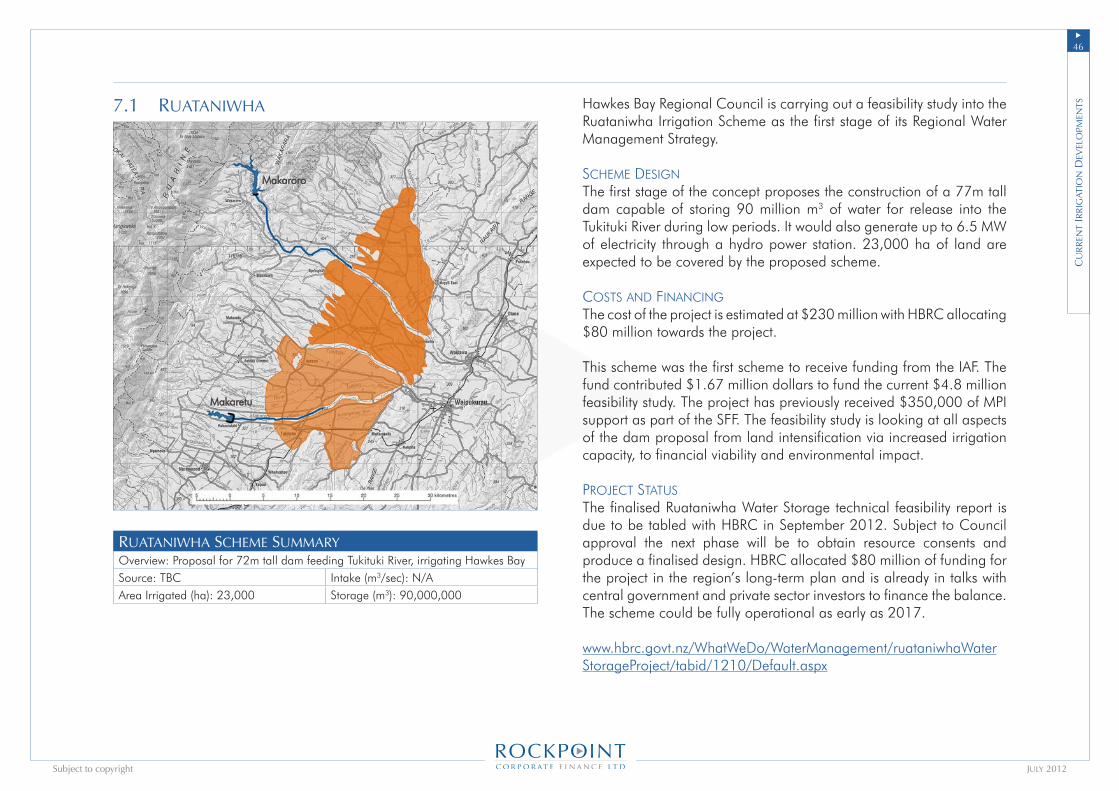
��u
July 2012Subject to copyright
7.1 ruatanIwha
Makaroro
Makaretu
ruatanIwha sCheme summaryOverview: Proposal for 72m tall dam feeding Tukituki River, irrigating Hawkes BaySource: TBC Intake (m3/sec): N/AArea Irrigated (ha): 23,000 Storage (m3): 90,000,000
Hawkes Bay Regional Council is carrying out a feasibility study into the Ruataniwha Irrigation Scheme as the first stage of its Regional Water Management Strategy.
sCheMe designThe first stage of the concept proposes the construction of a 77m tall dam capable of storing 90 million m3 of water for release into the Tukituki River during low periods. It would also generate up to 6.5 MW of electricity through a hydro power station. 23,000 ha of land are expected to be covered by the proposed scheme.
Costs and finanCingThe cost of the project is estimated at $230 million with HBRC allocating $80 million towards the project.
This scheme was the first scheme to receive funding from the IAF. The fund contributed $1.67 million dollars to fund the current $4.8 million feasibility study. The project has previously received $350,000 of MPI support as part of the SFF. The feasibility study is looking at all aspects of the dam proposal from land intensification via increased irrigation capacity, to financial viability and environmental impact.
pRojeCt statusThe finalised Ruataniwha Water Storage technical feasibility report is due to be tabled with HBRC in September 2012. Subject to Council approval the next phase will be to obtain resource consents and produce a finalised design. HBRC allocated $80 million of funding for the project in the region’s long-term plan and is already in talks with central government and private sector investors to finance the balance. The scheme could be fully operational as early as 2017.
www.hbrc.govt.nz/WhatWeDo/WaterManagement/ruataniwhaWaterStorageProject/tabid/1210/Default.aspx
Cu
rr
ent
Irr
Igat
Ion
dev
elo
Pmen
ts
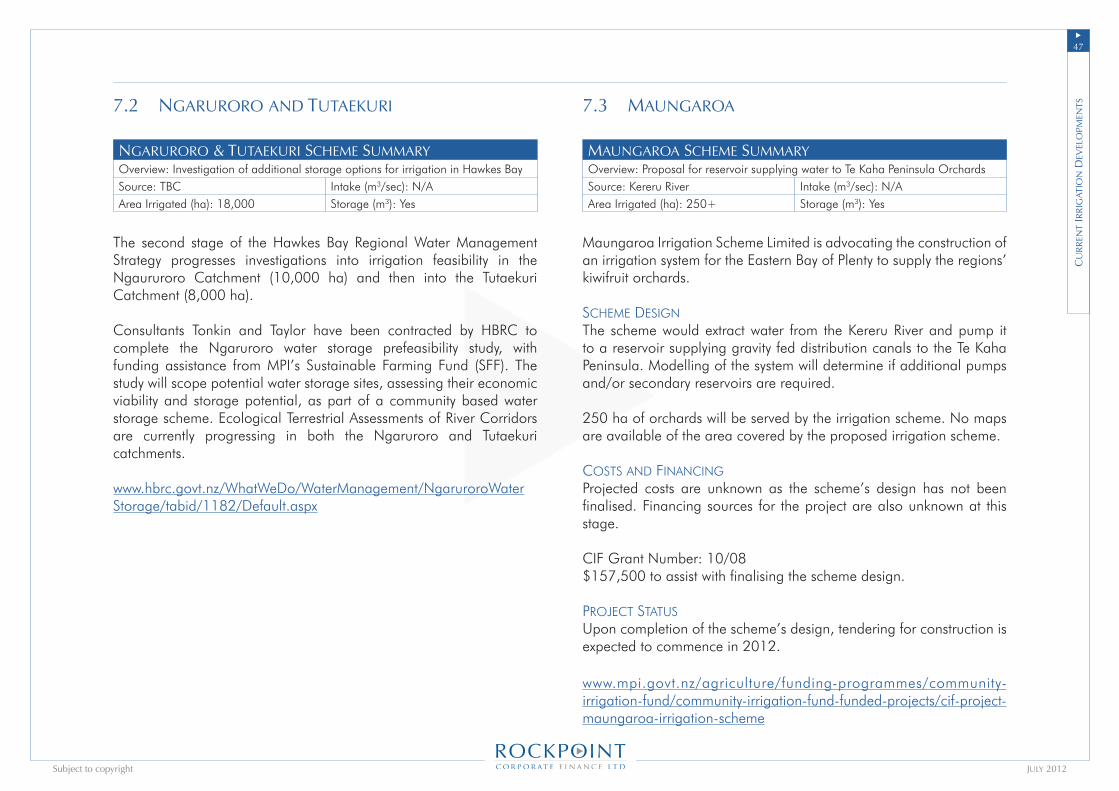
�7u
July 2012Subject to copyright
7.2 ngaruroro and tutaekurI
ngaruroro & tutaekurI sCheme summaryOverview: Investigation of additional storage options for irrigation in Hawkes Bay Source: TBC Intake (m3/sec): N/AArea Irrigated (ha): 18,000 Storage (m3): Yes
The second stage of the Hawkes Bay Regional Water Management Strategy progresses investigations into irrigation feasibility in the Ngaururoro Catchment (10,000 ha) and then into the Tutaekuri Catchment (8,000 ha).
Consultants Tonkin and Taylor have been contracted by HBRC to complete the Ngaruroro water storage prefeasibility study, with funding assistance from MPI’s Sustainable Farming Fund (SFF). The study will scope potential water storage sites, assessing their economic viability and storage potential, as part of a community based water storage scheme. Ecological Terrestrial Assessments of River Corridors are currently progressing in both the Ngaruroro and Tutaekuri catchments.
www.hbrc.govt.nz/WhatWeDo/WaterManagement/NgaruroroWaterStorage/tabid/1182/Default.aspx
7.3 maungaroa
maungaroa sCheme summaryOverview: Proposal for reservoir supplying water to Te Kaha Peninsula OrchardsSource: Kereru River Intake (m3/sec): N/AArea Irrigated (ha): 250+ Storage (m3): Yes
Maungaroa Irrigation Scheme Limited is advocating the construction of an irrigation system for the Eastern Bay of Plenty to supply the regions’ kiwifruit orchards.
sCheMe designThe scheme would extract water from the Kereru River and pump it to a reservoir supplying gravity fed distribution canals to the Te Kaha Peninsula. Modelling of the system will determine if additional pumps and/or secondary reservoirs are required.
250 ha of orchards will be served by the irrigation scheme. No maps are available of the area covered by the proposed irrigation scheme.
Costs and finanCingProjected costs are unknown as the scheme’s design has not been finalised. Financing sources for the project are also unknown at this stage.
CIF Grant Number: 10/08$157,500 to assist with finalising the scheme design.
pRojeCt statusUpon completion of the scheme’s design, tendering for construction is expected to commence in 2012.
www.mpi.govt.nz/agriculture/funding-programmes/community-irrigation-fund/community-irrigation-fund-funded-projects/cif-project-maungaroa-irrigation-scheme
Cu
rr
ent
Irr
Igat
Ion
dev
elo
Pmen
ts
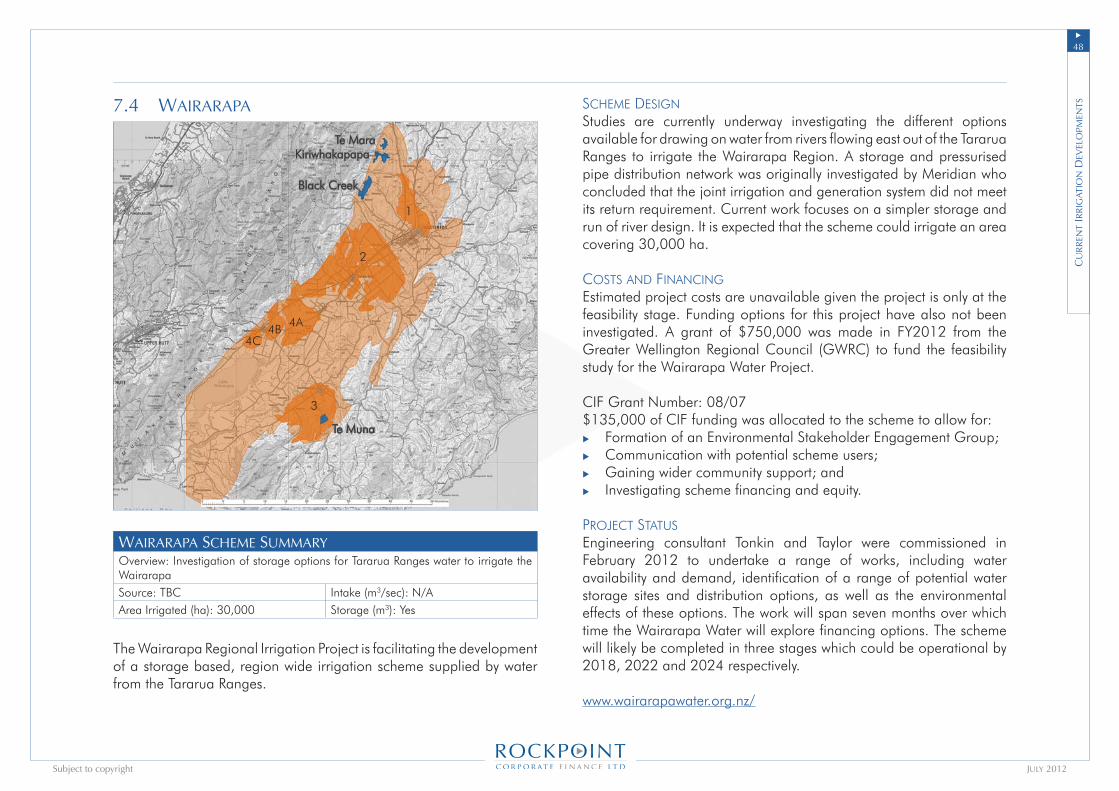
��u
July 2012Subject to copyright
7.4 waIraraPa
1
3
2
4A4B4C
Te MaraKiriwhakapapa
Black Creek
Te Muna
waIraraPa sCheme summaryOverview: Investigation of storage options for Tararua Ranges water to irrigate the WairarapaSource: TBC Intake (m3/sec): N/AArea Irrigated (ha): 30,000 Storage (m3): Yes
The Wairarapa Regional Irrigation Project is facilitating the development of a storage based, region wide irrigation scheme supplied by water from the Tararua Ranges.
sCheMe designStudies are currently underway investigating the different options available for drawing on water from rivers flowing east out of the Tararua Ranges to irrigate the Wairarapa Region. A storage and pressurised pipe distribution network was originally investigated by Meridian who concluded that the joint irrigation and generation system did not meet its return requirement. Current work focuses on a simpler storage and run of river design. It is expected that the scheme could irrigate an area covering 30,000 ha.
Costs and finanCingEstimated project costs are unavailable given the project is only at the feasibility stage. Funding options for this project have also not been investigated. A grant of $750,000 was made in FY2012 from the Greater Wellington Regional Council (GWRC) to fund the feasibility study for the Wairarapa Water Project.
CIF Grant Number: 08/07$135,000 of CIF funding was allocated to the scheme to allow for:
Formation of an Environmental Stakeholder Engagement Group;Communication with potential scheme users;Gaining wider community support; andInvestigating scheme financing and equity.
pRojeCt statusEngineering consultant Tonkin and Taylor were commissioned in February 2012 to undertake a range of works, including water availability and demand, identification of a range of potential water storage sites and distribution options, as well as the environmental effects of these options. The work will span seven months over which time the Wairarapa Water will explore financing options. The scheme will likely be completed in three stages which could be operational by 2018, 2022 and 2024 respectively.
www.wairarapawater.org.nz/
u
u
u
u
Cu
rr
ent
Irr
Igat
Ion
dev
elo
Pmen
ts

��u
July 2012Subject to copyright
7.5 lee valley / waImea east
Lee Valley
lee valley sCheme summaryOverview: Proposal for a 52m in river dam to supply the Waimea PlainsSource: Lee River Intake (m3/sec): N/AArea Irrigated (ha): 6,300 Storage (m3): 13,000,000
The Waimea Water Augmentation Committee (WWAC) (a partnership between Tasman District Council, Nelson City Council and businesses) has been investigating the construction of a dam in the Lee River for 9 years.
sCheMe designThe scheme proposes an in-river 52m dam with 13 million m3 water storage capacity, and includes a hydro power station generating 6.2 Gwh per year. Downstream flows would be enhanced, recharging the acquifers on the Waimea Plains. Water users abstract directly from the river or from recharged aquifers. An area of 3,800 ha will experience improved irrigation reliability with 2,500 ha of new irrigation provided by the scheme (total 6,300 ha). The dam will provide domestic water supply to Brightwater and Richmond. An additional 1,465 ha is provided for adjacent land and/or future water supply to Nelson City.
Costs and finanCingThe forecast project costs are $41.6 million for dam construction with an additional $4.5 million required to construct the hydro generation station although profits from the electricity generated would offset this cost over time. Irrigators are budgeted to pay up to $450/ha/yr over 25 years for capital costs and up to $65/ha/yr for operating costs. The project will operate as a community owned co-operative company.
CIF Grant Number: 09/02 and 10/09The initial funding received totalled $115,000. Secondary CIF funding of $865,000 was provided to allow for detailed design of the Lee Valley dam.
pRojeCt statusA feasibility study on the Lee Valley proposal was completed in early 2010. Design work is currently progressing on a site above Onslow Creek up the Lee Valley. The Tasman District Council has included the dam in its Long-term Plan but extended the project’s timeline following opposition to the high cost of the development. Additional time provided will allow the council to review the cost of the dam and to build community support. Construction is expected to take two years to complete however this is unlikely to begin before 2015.
www.tasman.govt.nz/tasman/projects/water-augmentation-projects/
Cu
rr
ent
Irr
Igat
Ion
dev
elo
Pmen
ts
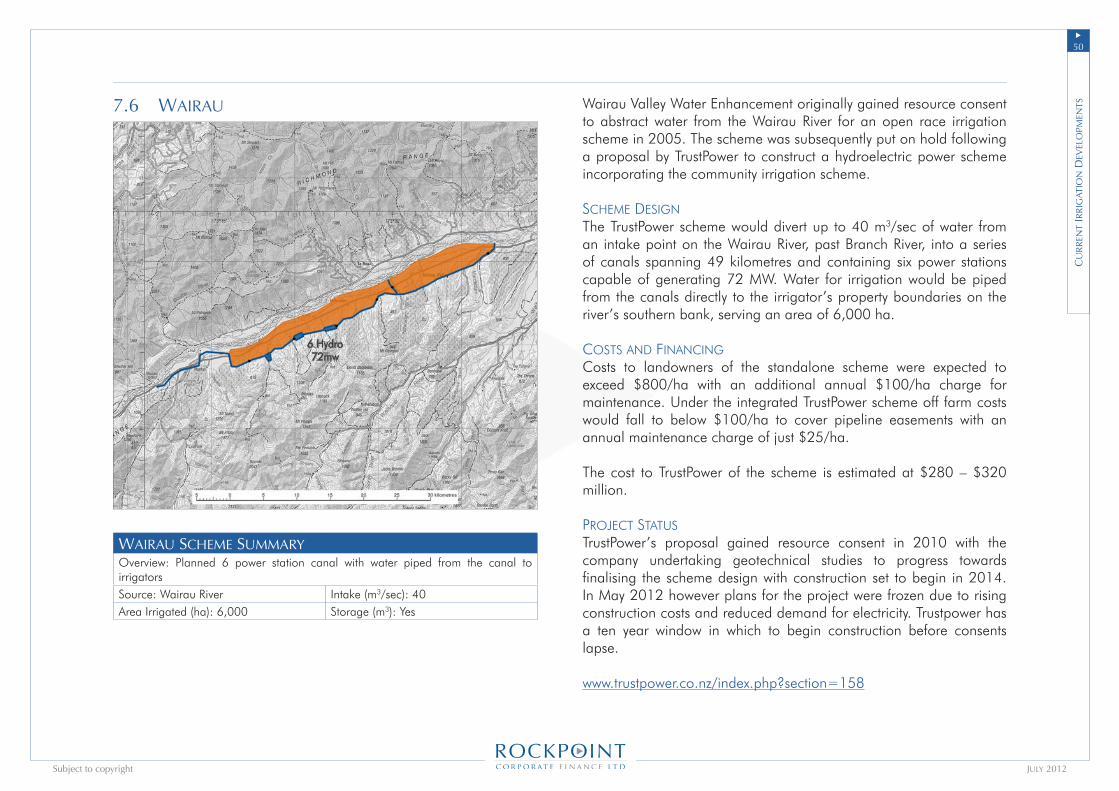
�0u
July 2012Subject to copyright
7.6 waIrau
6 Hydro72mw
waIrau sCheme summaryOverview: Planned 6 power station canal with water piped from the canal to irrigatorsSource: Wairau River Intake (m3/sec): 40Area Irrigated (ha): 6,000 Storage (m3): Yes
Wairau Valley Water Enhancement originally gained resource consent to abstract water from the Wairau River for an open race irrigation scheme in 2005. The scheme was subsequently put on hold following a proposal by TrustPower to construct a hydroelectric power scheme incorporating the community irrigation scheme.
sCheMe designThe TrustPower scheme would divert up to 40 m3/sec of water from an intake point on the Wairau River, past Branch River, into a series of canals spanning 49 kilometres and containing six power stations capable of generating 72 MW. Water for irrigation would be piped from the canals directly to the irrigator’s property boundaries on the river’s southern bank, serving an area of 6,000 ha.
Costs and finanCingCosts to landowners of the standalone scheme were expected to exceed $800/ha with an additional annual $100/ha charge for maintenance. Under the integrated TrustPower scheme off farm costs would fall to below $100/ha to cover pipeline easements with an annual maintenance charge of just $25/ha. The cost to TrustPower of the scheme is estimated at $280 – $320 million.
pRojeCt statusTrustPower’s proposal gained resource consent in 2010 with the company undertaking geotechnical studies to progress towards finalising the scheme design with construction set to begin in 2014. In May 2012 however plans for the project were frozen due to rising construction costs and reduced demand for electricity. Trustpower has a ten year window in which to begin construction before consents lapse.
www.trustpower.co.nz/index.php?section=158
Cu
rr
ent
Irr
Igat
Ion
dev
elo
Pmen
ts
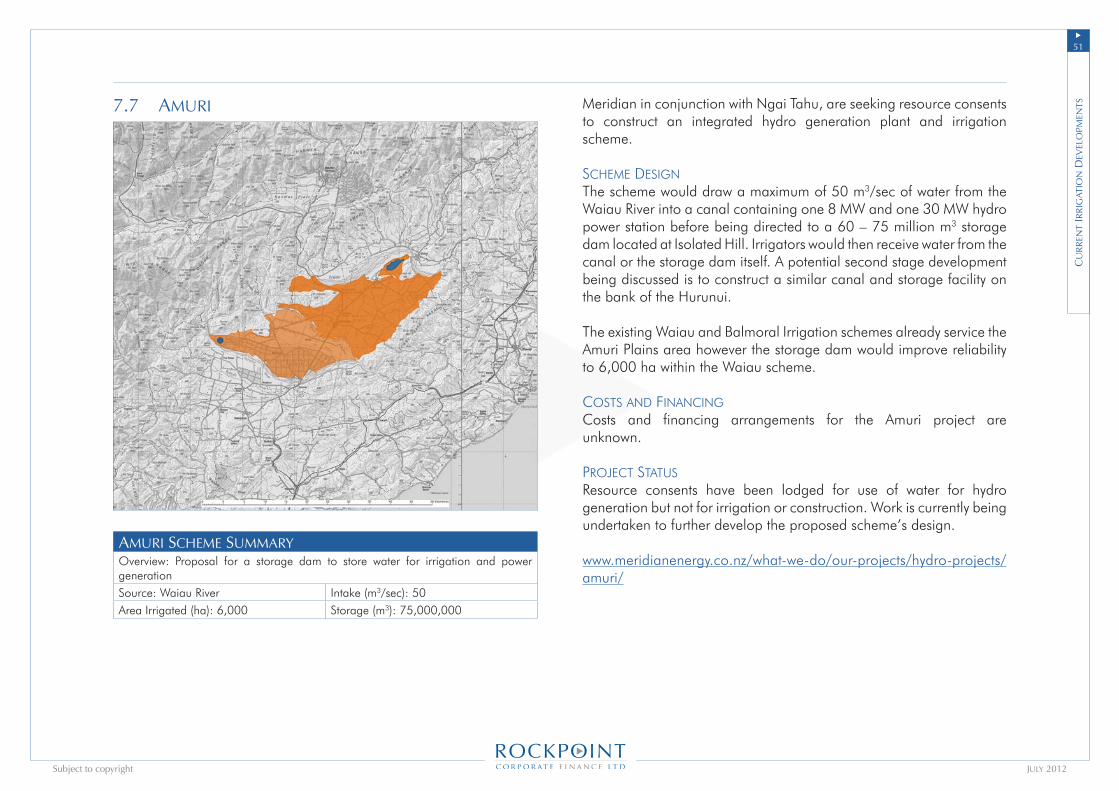
�1u
July 2012Subject to copyright
7.7 amurI
amurI sCheme summaryOverview: Proposal for a storage dam to store water for irrigation and power generation Source: Waiau River Intake (m3/sec): 50Area Irrigated (ha): 6,000 Storage (m3): 75,000,000
Meridian in conjunction with Ngai Tahu, are seeking resource consents to construct an integrated hydro generation plant and irrigation scheme.
sCheMe designThe scheme would draw a maximum of 50 m3/sec of water from the Waiau River into a canal containing one 8 MW and one 30 MW hydro power station before being directed to a 60 – 75 million m3 storage dam located at Isolated Hill. Irrigators would then receive water from the canal or the storage dam itself. A potential second stage development being discussed is to construct a similar canal and storage facility on the bank of the Hurunui.
The existing Waiau and Balmoral Irrigation schemes already service the Amuri Plains area however the storage dam would improve reliability to 6,000 ha within the Waiau scheme.
Costs and finanCingCosts and financing arrangements for the Amuri project are unknown.
pRojeCt statusResource consents have been lodged for use of water for hydro generation but not for irrigation or construction. Work is currently being undertaken to further develop the proposed scheme’s design.
www.meridianenergy.co.nz/what-we-do/our-projects/hydro-projects/amuri/
Cu
rr
ent
Irr
Igat
Ion
dev
elo
Pmen
ts
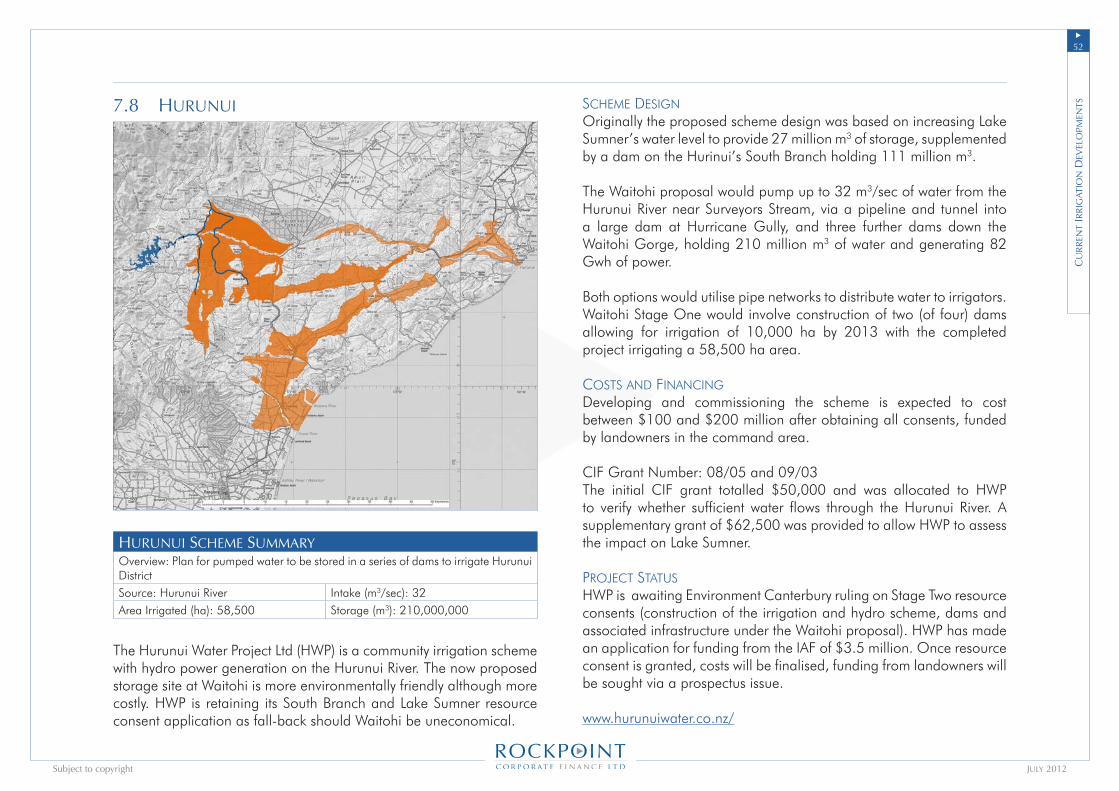
�2u
July 2012Subject to copyright
7.8 hurunuI
hurunuI sCheme summaryOverview: Plan for pumped water to be stored in a series of dams to irrigate Hurunui DistrictSource: Hurunui River Intake (m3/sec): 32Area Irrigated (ha): 58,500 Storage (m3): 210,000,000
The Hurunui Water Project Ltd (HWP) is a community irrigation scheme with hydro power generation on the Hurunui River. The now proposed storage site at Waitohi is more environmentally friendly although more costly. HWP is retaining its South Branch and Lake Sumner resource consent application as fall-back should Waitohi be uneconomical.
sCheMe designOriginally the proposed scheme design was based on increasing Lake Sumner’s water level to provide 27 million m3 of storage, supplemented by a dam on the Hurinui’s South Branch holding 111 million m3.
The Waitohi proposal would pump up to 32 m3/sec of water from the Hurunui River near Surveyors Stream, via a pipeline and tunnel into a large dam at Hurricane Gully, and three further dams down the Waitohi Gorge, holding 210 million m3 of water and generating 82 Gwh of power.
Both options would utilise pipe networks to distribute water to irrigators. Waitohi Stage One would involve construction of two (of four) dams allowing for irrigation of 10,000 ha by 2013 with the completed project irrigating a 58,500 ha area.
Costs and finanCingDeveloping and commissioning the scheme is expected to cost between $100 and $200 million after obtaining all consents, funded by landowners in the command area.
CIF Grant Number: 08/05 and 09/03The initial CIF grant totalled $50,000 and was allocated to HWP to verify whether sufficient water flows through the Hurunui River. A supplementary grant of $62,500 was provided to allow HWP to assess the impact on Lake Sumner.
pRojeCt statusHWP is awaiting Environment Canterbury ruling on Stage Two resource consents (construction of the irrigation and hydro scheme, dams and associated infrastructure under the Waitohi proposal). HWP has made an application for funding from the IAF of $3.5 million. Once resource consent is granted, costs will be finalised, funding from landowners will be sought via a prospectus issue.
www.hurunuiwater.co.nz/
Cu
rr
ent
Irr
Igat
Ion
dev
elo
Pmen
ts
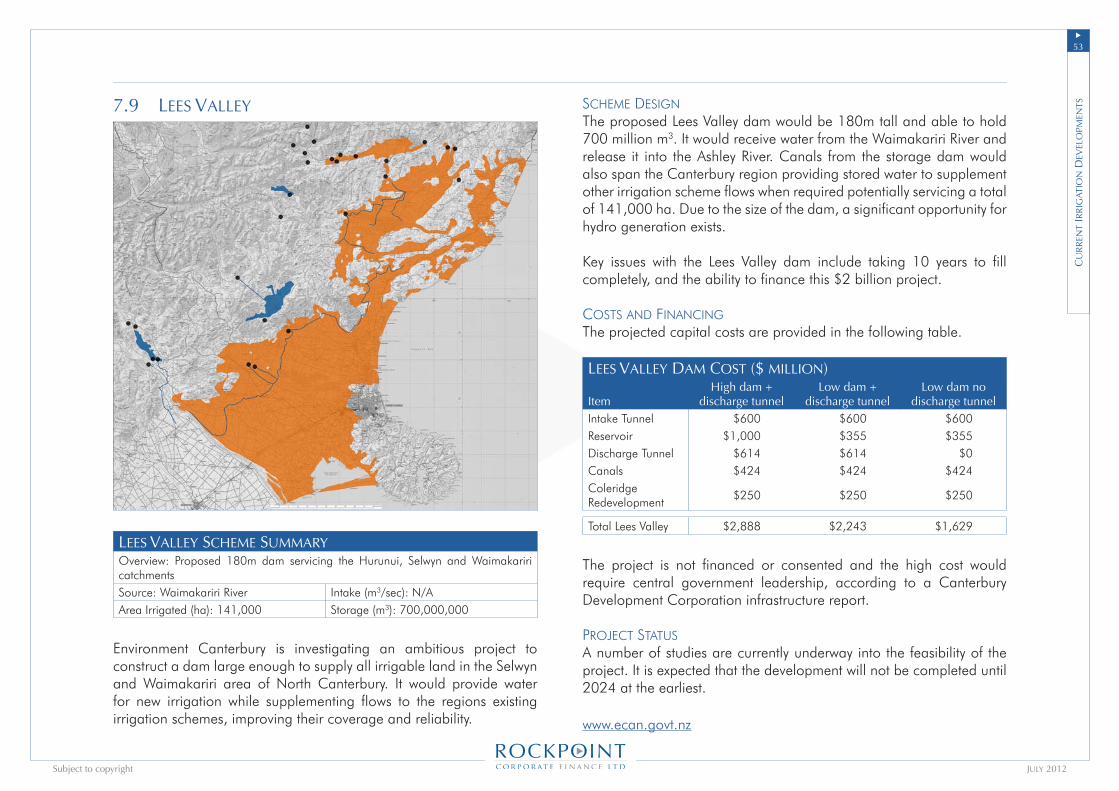
��u
July 2012Subject to copyright
7.9 lees valley
lees valley sCheme summaryOverview: Proposed 180m dam servicing the Hurunui, Selwyn and Waimakariri catchmentsSource: Waimakariri River Intake (m3/sec): N/AArea Irrigated (ha): 141,000 Storage (m3): 700,000,000
Environment Canterbury is investigating an ambitious project to construct a dam large enough to supply all irrigable land in the Selwyn and Waimakariri area of North Canterbury. It would provide water for new irrigation while supplementing flows to the regions existing irrigation schemes, improving their coverage and reliability.
sCheMe designThe proposed Lees Valley dam would be 180m tall and able to hold 700 million m3. It would receive water from the Waimakariri River and release it into the Ashley River. Canals from the storage dam would also span the Canterbury region providing stored water to supplement other irrigation scheme flows when required potentially servicing a total of 141,000 ha. Due to the size of the dam, a significant opportunity for hydro generation exists.
Key issues with the Lees Valley dam include taking 10 years to fill completely, and the ability to finance this $2 billion project.
Costs and finanCingThe projected capital costs are provided in the following table.
lees valley dam Cost ($ mIllIon)
ItemHigh dam +
discharge tunnelLow dam +
discharge tunnelLow dam no
discharge tunnelIntake Tunnel $600 $600 $600Reservoir $1,000 $355 $355Discharge Tunnel $614 $614 $0Canals $424 $424 $424Coleridge Redevelopment
$250 $250 $250
Total Lees Valley $2,888 $2,243 $1,629
The project is not financed or consented and the high cost would require central government leadership, according to a Canterbury Development Corporation infrastructure report.
pRojeCt statusA number of studies are currently underway into the feasibility of the project. It is expected that the development will not be completed until 2024 at the earliest.
www.ecan.govt.nz
Cu
rr
ent
Irr
Igat
Ion
dev
elo
Pmen
ts

��u
July 2012Subject to copyright
7.10 Central PlaIns
Central PlaIns sCheme summaryOverview: Plan to divert water from two rivers to supply a central storage pond for irrigationSource: Waimakariri and Raikaia Rivers Intake (m3/sec): 25, 40Area Irrigated (ha): 60,000 Storage (m3): 28,000,000
Central Plains Water (CPW) was formed by the Christchurch City and Selwyn District Councils to facilitate the development of water infrastructure to supply the Christchurch Region.
sCheMe designDual flow headrace canals will channel water from intakes on the Waimakariri (25 m3/sec) and Raikaia (40 m3/sec) Rivers. Since consent for a dam near Coalgate was denied, CWP is now in discussion with TrustPower to utilise the storage capacity of Lake Coleridge (see section 7.11). Ten outlet points along the headrace canal will channel water into a network of irrigation pipes or channels for distribution to farmers, irrigating 60,000 ha between the Waimakariri River, the Rakaia River, State Highway 1 and the Malvern foothills of the Southern Alps.
Costs and finanCingTwo infrastructure options are being considered. Open channel distribution of water is budgeted at $258 million while a more efficient piped distribution network would cost $409 million. Given the substantial nature of the project, off farm infrastructure will largely be funded by third party investment (including senior debt, mezzanine financing and equity), plus funding from Central Government (IAF and CWIC).
CIF Grant Number: 10/01CIF funding received to date totals $72,643 to undertake a funding study including the provision of funds by Central Government (similar to the broadband investment fund) and 100% debt financed scheme secured through the Selwyn District Council. CPW has applied for a further $5.6m from the Irrigation Acceleration Fund.
pRojeCt statusFinal consents for the scheme have been granted by the Environment Court. Sale and purchase negotiations for the main canal route can now begin alongside the design phase for stage one. Funding for design of the $105 million stage one development is close to being secured with Selwyn District Council likely to lend $5.1 million to CPW for this purpose. All stages of the scheme are forecast to be completed by 2017.
www.cpwl.co.nz/index.html
Cu
rr
ent
Irr
Igat
Ion
dev
elo
Pmen
ts

��u
July 2012Subject to copyright
7.11 lake ColerIdge
Lake Coleridge
Hydro 39mw
Hydro 70mw
lake ColerIdge sCheme summaryOverview: Proposed Lake Coleridge storage supplementing BCI and CPW schemesSource: Raikaia River Intake (m3/sec): UnknownArea Irrigated (ha): 60,000 Storage (m3): Lake Coleridge
TrustPower is proposing to manage water in Lake Coleridge traditionally used for hydro generation to also provide irrigation to 60,000 ha of land adjacent to the Raikaia River.
sCheMe designThe Lake Coleridge development would store water when existing flows diverted from the Rakaia River exceed the National Water Conservation Order (Rakaia River) 1988 (RWCO) monthly minimums. Release of stored water would occur on a shared basis; for every 1 m3/sec abstracted, 1 m3/sec must be left in the river (above minimum flows). Water would be discharged back into the Raikaia River or through an open canal system incorporating 5 hydro stations (70MW).
The scheme would work in combination with the existing Barrhill Chertsey (BCI) scheme with Trustpower’s Highbank station increasing pumped water backflows to the RDR to 16 m3/sec to allow for the BCI scheme to irrigate a greater area. It could also release up to 30 m3/sec into the headrace canal supplying the proposed Central Plains (CPW) scheme, to irrigate up to 60,000 ha with high reliability. Costs and finanCingThe proposed Coleridge Lake development is expected to cost approximately $250 million and is likely to be financed by TrustPower.
pRojeCt statusIn order for the development to proceed, an amendment is required to the RWCO to allow for the storage and use of stored water for abstraction from Lake Coleridge. An application was made to Environment Canterbury to amend the order in September 2011. A panel of external hearing commissioners will be appointed by Environment Canterbury to hear the application and any submissions. The panel will then make a recommendation to Environment Canterbury on the application. This development is expected to be completed by 2017 assuming no delays arise during the resource consent application process.
www.trustpower.co.nz/index.php?section=425
Cu
rr
ent
Irr
Igat
Ion
dev
elo
Pmen
ts
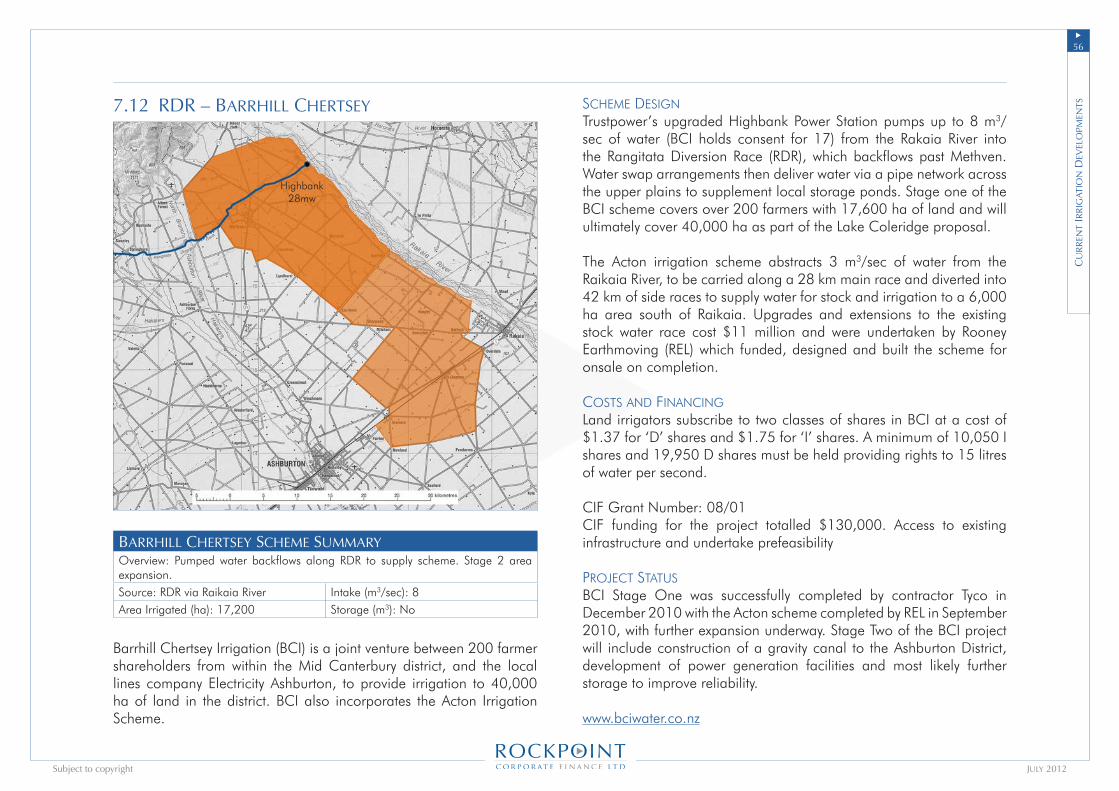
��u
July 2012Subject to copyright
7.12 rdr – barrhIll Chertsey
Highbank28mw
barrhIll Chertsey sCheme summaryOverview: Pumped water backflows along RDR to supply scheme. Stage 2 area expansion. Source: RDR via Raikaia River Intake (m3/sec): 8Area Irrigated (ha): 17,200 Storage (m3): No
Barrhill Chertsey Irrigation (BCI) is a joint venture between 200 farmer shareholders from within the Mid Canterbury district, and the local lines company Electricity Ashburton, to provide irrigation to 40,000 ha of land in the district. BCI also incorporates the Acton Irrigation Scheme.
sCheMe designTrustpower’s upgraded Highbank Power Station pumps up to 8 m3/sec of water (BCI holds consent for 17) from the Rakaia River into the Rangitata Diversion Race (RDR), which backflows past Methven. Water swap arrangements then deliver water via a pipe network across the upper plains to supplement local storage ponds. Stage one of the BCI scheme covers over 200 farmers with 17,600 ha of land and will ultimately cover 40,000 ha as part of the Lake Coleridge proposal.
The Acton irrigation scheme abstracts 3 m3/sec of water from the Raikaia River, to be carried along a 28 km main race and diverted into 42 km of side races to supply water for stock and irrigation to a 6,000 ha area south of Raikaia. Upgrades and extensions to the existing stock water race cost $11 million and were undertaken by Rooney Earthmoving (REL) which funded, designed and built the scheme for onsale on completion.
Costs and finanCingLand irrigators subscribe to two classes of shares in BCI at a cost of $1.37 for ‘D’ shares and $1.75 for ‘I’ shares. A minimum of 10,050 I shares and 19,950 D shares must be held providing rights to 15 litres of water per second.
CIF Grant Number: 08/01CIF funding for the project totalled $130,000. Access to existing infrastructure and undertake prefeasibility
pRojeCt statusBCI Stage One was successfully completed by contractor Tyco in December 2010 with the Acton scheme completed by REL in September 2010, with further expansion underway. Stage Two of the BCI project will include construction of a gravity canal to the Ashburton District, development of power generation facilities and most likely further storage to improve reliability.
www.bciwater.co.nz
Cu
rr
ent
Irr
Igat
Ion
dev
elo
Pmen
ts
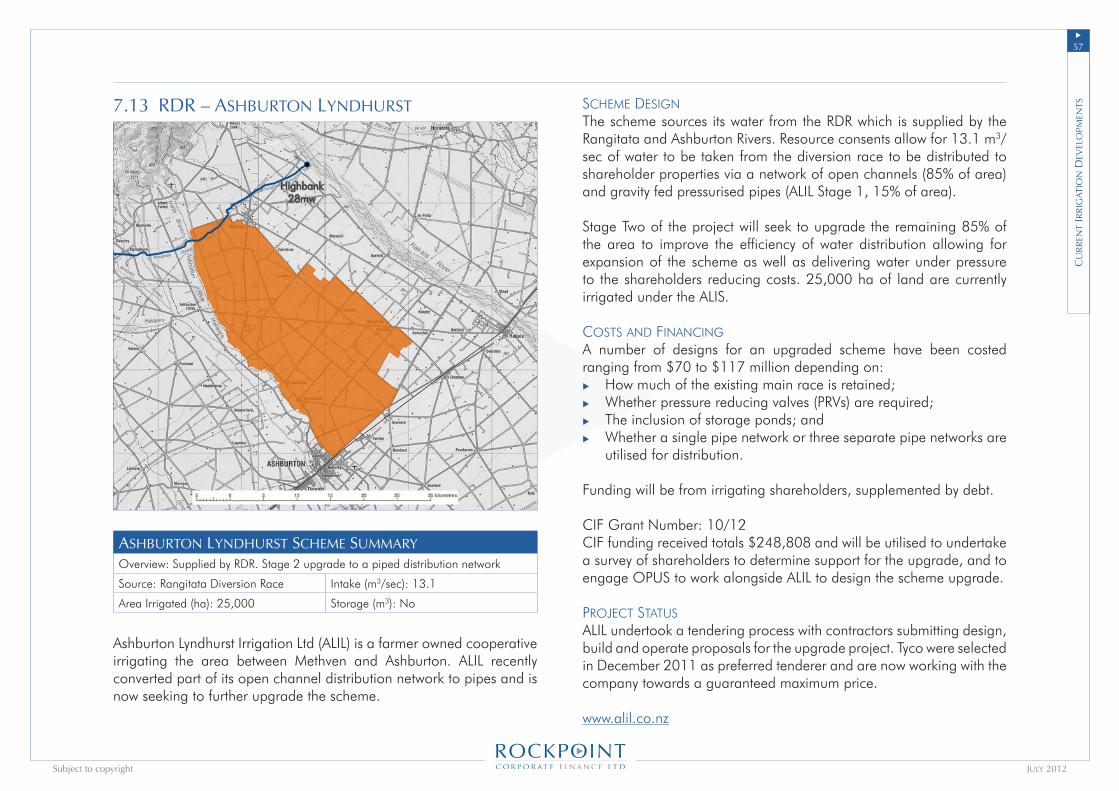
�7u
July 2012Subject to copyright
7.13 rdr – ashburton lyndhurst
Highbank28mw
ashburton lyndhurst sCheme summaryOverview: Supplied by RDR. Stage 2 upgrade to a piped distribution network
Source: Rangitata Diversion Race Intake (m3/sec): 13.1
Area Irrigated (ha): 25,000 Storage (m3): No
Ashburton Lyndhurst Irrigation Ltd (ALIL) is a farmer owned cooperative irrigating the area between Methven and Ashburton. ALIL recently converted part of its open channel distribution network to pipes and is now seeking to further upgrade the scheme.
sCheMe designThe scheme sources its water from the RDR which is supplied by the Rangitata and Ashburton Rivers. Resource consents allow for 13.1 m3/sec of water to be taken from the diversion race to be distributed to shareholder properties via a network of open channels (85% of area) and gravity fed pressurised pipes (ALIL Stage 1, 15% of area).
Stage Two of the project will seek to upgrade the remaining 85% of the area to improve the efficiency of water distribution allowing for expansion of the scheme as well as delivering water under pressure to the shareholders reducing costs. 25,000 ha of land are currently irrigated under the ALIS.
Costs and finanCingA number of designs for an upgraded scheme have been costed ranging from $70 to $117 million depending on:
How much of the existing main race is retained;Whether pressure reducing valves (PRVs) are required;The inclusion of storage ponds; andWhether a single pipe network or three separate pipe networks are utilised for distribution.
Funding will be from irrigating shareholders, supplemented by debt.
CIF Grant Number: 10/12CIF funding received totals $248,808 and will be utilised to undertake a survey of shareholders to determine support for the upgrade, and to engage OPUS to work alongside ALIL to design the scheme upgrade.
pRojeCt statusALIL undertook a tendering process with contractors submitting design, build and operate proposals for the upgrade project. Tyco were selected in December 2011 as preferred tenderer and are now working with the company towards a guaranteed maximum price.
www.alil.co.nz
u
u
u
u
Cu
rr
ent
Irr
Igat
Ion
dev
elo
Pmen
ts

��u
July 2012Subject to copyright
7.14 rdr – valetta
Montalto1.8mw
valetta sCheme summaryOverview: Supplied by RDR. Stage 2 upgrades to piped distribution, storage and generationSource: Rangitata Diversion Race Intake (m3/sec): 3.4Area Irrigated (ha): 7,000 Storage (m3): Yes
The Valetta Irrigation Scheme is a farmer owned cooperative supplied with water from the Rangitata Diversion Race.
sCheMe designUp to 3.4 m3/sec of water is taken from the RDR to supply the scheme’s open channel distribution network currently irrigating 7,000 ha. Investigations are underway to convert the scheme to a piped distribution network, with inclusion of a hydro power station where the main trunk feed pipeline discharges water into two storage ponds. These ponds would supply the pressurised distribution pipe network.
Costs and finanCingConversion of the open channel distribution network to a piped network is expected to cost $31.9 million. This upgrade would be funded using $17.9 million of bank debt with 124,465 additional shares being offered at $1 nominal value with a $119 premium. Additional equity raised will total $14.9 million generating an excess of $0.9 million over the project cost. Currently the scheme has 319,200 shares outstanding each with a nominal $1 value with every 100 shares entitling the holder to 1 litre of water per second.
CIF Grant Number: 11/11CIF funding received to date totals $203,875 and has been on developing a detailed design of the proposed upgrades.
pRojeCt statusUpgrades to the scheme are well progressed with all additional equity subscribed allowing for work to begin on the project. Bosch were formally contracted to undertake the works and have started producing the pipelines for the system. A contract has been entered into with CanPower (a Bosch related entity) which will pay costs related to piping of the scheme from the RDR to the start of the scheme as well as the construction of the storage ponds and hydro power station. In return it was granted the right to generate electricity for a 15 year period. Debt funding has also been agreed with Westpac and the civil works for the storage ponds are underway.
www.cselaw.co.nz/valetta-irrigation
Cu
rr
ent
Irr
Igat
Ion
dev
elo
Pmen
ts
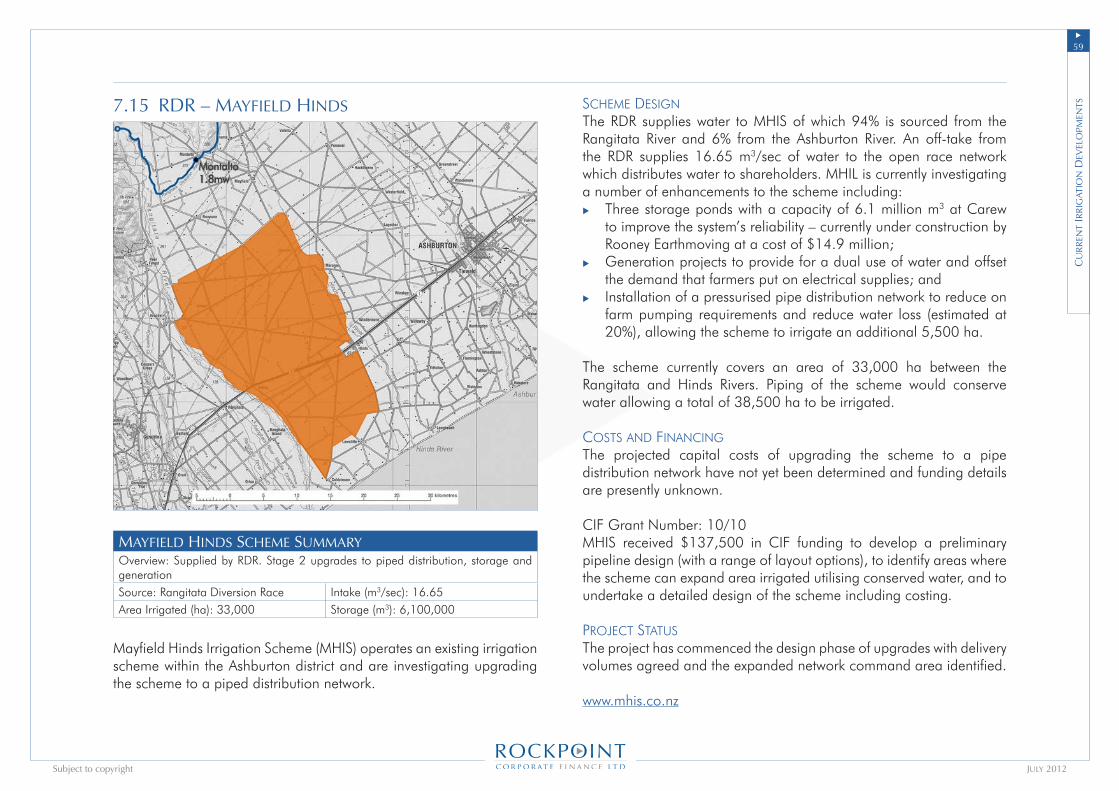
��u
July 2012Subject to copyright
7.15 rdr – mayfIeld hInds
Montalto1.8mw
mayfIeld hInds sCheme summaryOverview: Supplied by RDR. Stage 2 upgrades to piped distribution, storage and generationSource: Rangitata Diversion Race Intake (m3/sec): 16.65Area Irrigated (ha): 33,000 Storage (m3): 6,100,000
Mayfield Hinds Irrigation Scheme (MHIS) operates an existing irrigation scheme within the Ashburton district and are investigating upgrading the scheme to a piped distribution network.
sCheMe designThe RDR supplies water to MHIS of which 94% is sourced from the Rangitata River and 6% from the Ashburton River. An off-take from the RDR supplies 16.65 m3/sec of water to the open race network which distributes water to shareholders. MHIL is currently investigating a number of enhancements to the scheme including:
Three storage ponds with a capacity of 6.1 million m3 at Carew to improve the system’s reliability – currently under construction by Rooney Earthmoving at a cost of $14.9 million;Generation projects to provide for a dual use of water and offset the demand that farmers put on electrical supplies; andInstallation of a pressurised pipe distribution network to reduce on farm pumping requirements and reduce water loss (estimated at 20%), allowing the scheme to irrigate an additional 5,500 ha.
The scheme currently covers an area of 33,000 ha between the Rangitata and Hinds Rivers. Piping of the scheme would conserve water allowing a total of 38,500 ha to be irrigated.
Costs and finanCingThe projected capital costs of upgrading the scheme to a pipe distribution network have not yet been determined and funding details are presently unknown.
CIF Grant Number: 10/10MHIS received $137,500 in CIF funding to develop a preliminary pipeline design (with a range of layout options), to identify areas where the scheme can expand area irrigated utilising conserved water, and to undertake a detailed design of the scheme including costing.
pRojeCt statusThe project has commenced the design phase of upgrades with delivery volumes agreed and the expanded network command area identified.
www.mhis.co.nz
u
u
u
Cu
rr
ent
Irr
Igat
Ion
dev
elo
Pmen
ts

�0u
July 2012Subject to copyright
7.16 rangItata south
rangItata south sCheme summaryOverview: Seven storage ponds holding water for irrigationSource: Rangitata River Intake (m3/sec): 20Area Irrigated (ha): 12,000 Storage (m3): 16,500,000
Rangitata South Irrigation Ltd is a privately owned company seeking to irrigate 46 properties south of the Rangitata River.
sCheMe designThe scheme has gained resource consent to take up to 20 m3/sec of water from the Rangitata River when flows exceed 110 m3/sec. An intake canal will be located 1 km upstream of the Arundel Bridge which will traverse past Arundel to a series of seven storage ponds alongside the Rangitata River, holding 16.5 million m3 of water. Existing stock water races will be upgraded and new races constructed to distribute water to on-farm storage ponds holding 3 million m3 of additional storage (the equivalent of 250m3 per hectare or 25mm water depth).
An area of 12,000 ha between the Rangitata and Orari Rivers will be covered by the scheme.
Costs and finanCingConstruction of the irrigation scheme will cost $82 million and is privately funded by irrigator shareholders.
pRojeCt statusEarthworks for the scheme have been completed by Rooney Earthmoving with the next step towards completion the lining and armouring of the ponds. The project is expected to be complete by 2013.
Cu
rr
ent
Irr
Igat
Ion
dev
elo
Pmen
ts
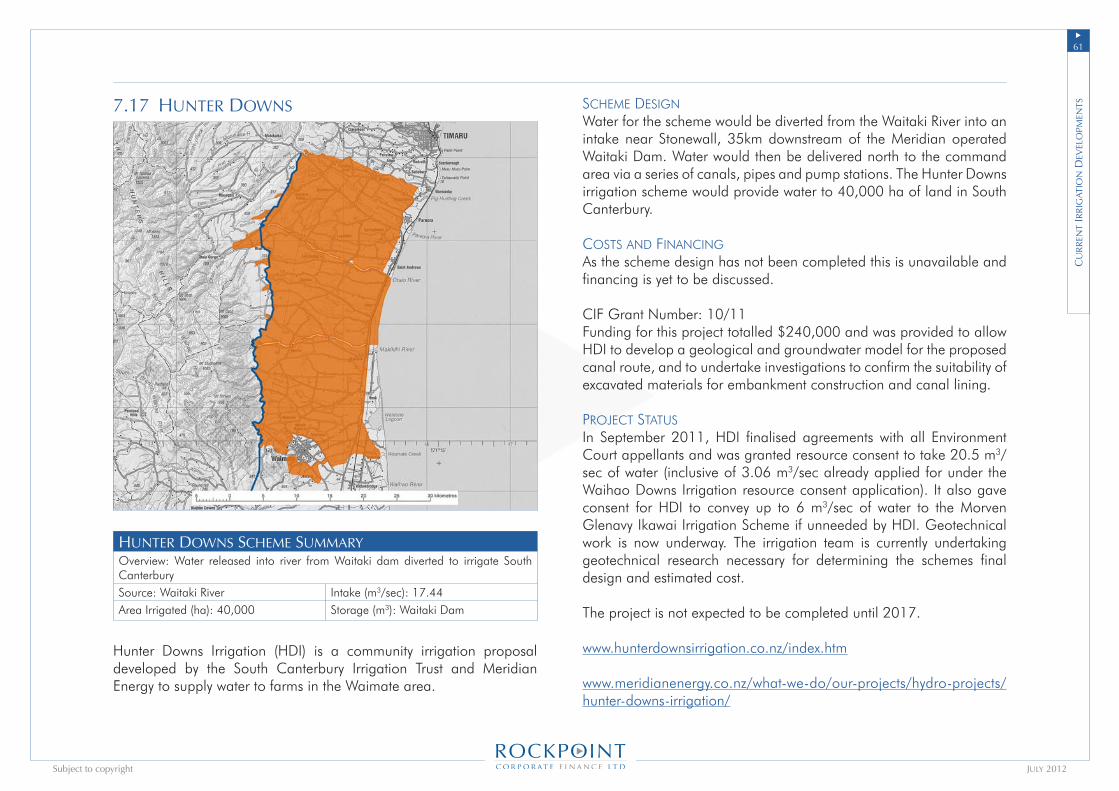
�1u
July 2012Subject to copyright
7.17 hunter downs
hunter downs sCheme summaryOverview: Water released into river from Waitaki dam diverted to irrigate South CanterburySource: Waitaki River Intake (m3/sec): 17.44Area Irrigated (ha): 40,000 Storage (m3): Waitaki Dam
Hunter Downs Irrigation (HDI) is a community irrigation proposal developed by the South Canterbury Irrigation Trust and Meridian Energy to supply water to farms in the Waimate area.
sCheMe designWater for the scheme would be diverted from the Waitaki River into an intake near Stonewall, 35km downstream of the Meridian operated Waitaki Dam. Water would then be delivered north to the command area via a series of canals, pipes and pump stations. The Hunter Downs irrigation scheme would provide water to 40,000 ha of land in South Canterbury.
Costs and finanCingAs the scheme design has not been completed this is unavailable and financing is yet to be discussed.
CIF Grant Number: 10/11Funding for this project totalled $240,000 and was provided to allow HDI to develop a geological and groundwater model for the proposed canal route, and to undertake investigations to confirm the suitability of excavated materials for embankment construction and canal lining.
pRojeCt statusIn September 2011, HDI finalised agreements with all Environment Court appellants and was granted resource consent to take 20.5 m3/sec of water (inclusive of 3.06 m3/sec already applied for under the Waihao Downs Irrigation resource consent application). It also gave consent for HDI to convey up to 6 m3/sec of water to the Morven Glenavy Ikawai Irrigation Scheme if unneeded by HDI. Geotechnical work is now underway. The irrigation team is currently undertaking geotechnical research necessary for determining the schemes final design and estimated cost.
The project is not expected to be completed until 2017.
www.hunterdownsirrigation.co.nz/index.htm
www.meridianenergy.co.nz/what-we-do/our-projects/hydro-projects/hunter-downs-irrigation/
Cu
rr
ent
Irr
Igat
Ion
dev
elo
Pmen
ts
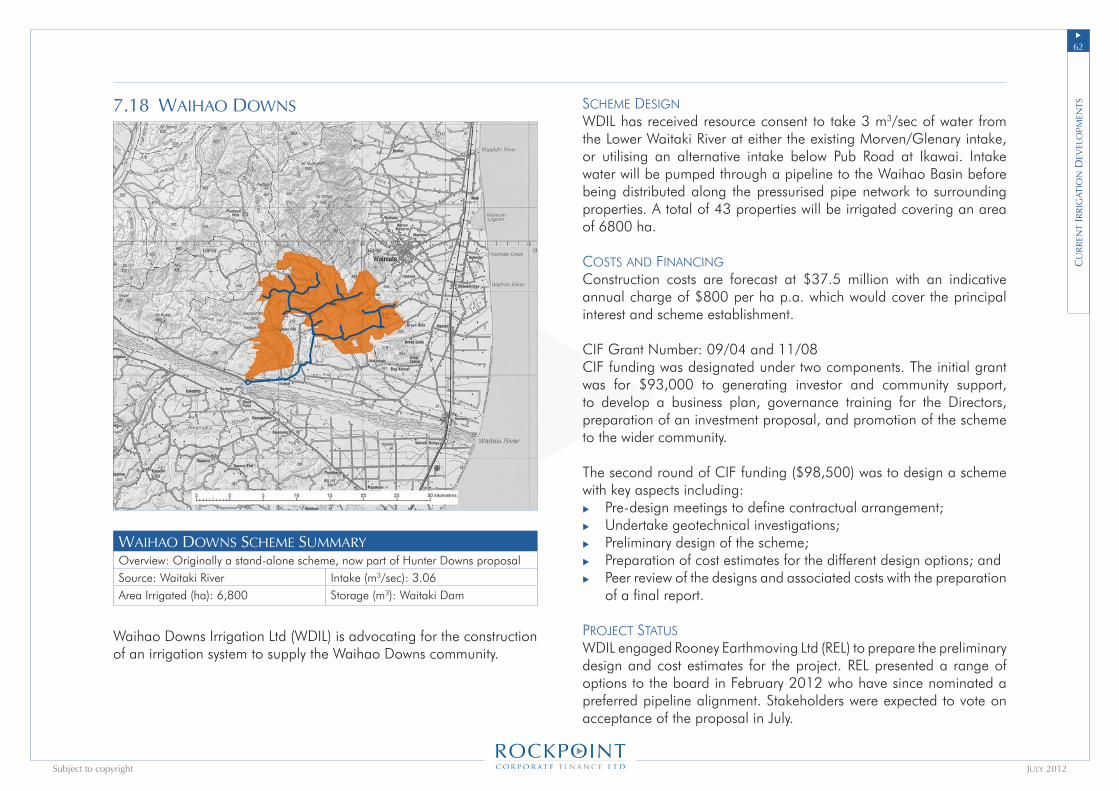
�2u
July 2012Subject to copyright
7.18 waIhao downs
waIhao downs sCheme summaryOverview: Originally a stand-alone scheme, now part of Hunter Downs proposalSource: Waitaki River Intake (m3/sec): 3.06Area Irrigated (ha): 6,800 Storage (m3): Waitaki Dam
Waihao Downs Irrigation Ltd (WDIL) is advocating for the construction of an irrigation system to supply the Waihao Downs community.
sCheMe designWDIL has received resource consent to take 3 m3/sec of water from the Lower Waitaki River at either the existing Morven/Glenary intake, or utilising an alternative intake below Pub Road at Ikawai. Intake water will be pumped through a pipeline to the Waihao Basin before being distributed along the pressurised pipe network to surrounding properties. A total of 43 properties will be irrigated covering an area of 6800 ha.
Costs and finanCingConstruction costs are forecast at $37.5 million with an indicative annual charge of $800 per ha p.a. which would cover the principal interest and scheme establishment.
CIF Grant Number: 09/04 and 11/08CIF funding was designated under two components. The initial grant was for $93,000 to generating investor and community support, to develop a business plan, governance training for the Directors, preparation of an investment proposal, and promotion of the scheme to the wider community.
The second round of CIF funding ($98,500) was to design a scheme with key aspects including:
Pre-design meetings to define contractual arrangement;Undertake geotechnical investigations;Preliminary design of the scheme;Preparation of cost estimates for the different design options; andPeer review of the designs and associated costs with the preparation of a final report.
pRojeCt statusWDIL engaged Rooney Earthmoving Ltd (REL) to prepare the preliminary design and cost estimates for the project. REL presented a range of options to the board in February 2012 who have since nominated a preferred pipeline alignment. Stakeholders were expected to vote on acceptance of the proposal in July.
u
u
u
u
u
Cu
rr
ent
Irr
Igat
Ion
dev
elo
Pmen
ts

��u
July 2012Subject to copyright
7.19 north otago
north otago sCheme summaryOverview: River intake supplies Borton’s Pond which stores and diverts flows to the schemeSource: Waitaki River Intake (m3/sec): 4Area Irrigated (ha): 10,000 Storage (m3): Borton’s Pond
In 2006 the Waitaki District Council partnered with the North Otago Irrigation Company (NOIC) to pre-invest $10 million in the over-build of the consented 10,000 ha Waitaki irrigation scheme to allow for a future second stage irrigation development.
sCheMe designNOIC has resource consent to take 8 m3/sec of water to irrigate shareholder farms in the North Otago region. The existing scheme pumps 4 m3/sec of water from the Waitaki River into Borton’s Pond, and then into the Head Pond before water is distributed via a gravity fed pipe network. While still under design, Stage Two will utilise the remaining 4 m3/sec to expand the irrigation scheme. This will require additional pump stations and an expansion of the system’s pipe network.
A further 10,000 ha will be irrigated upon completion of the project (total 20,000 ha).
Costs and finanCingAs the second stage design has not yet been completed, cost estimates are unavailable. Financing for stage two will be privately funded by those wishing to join the expanded scheme purchasing shares with embedded water rights.
CIF Grant Number: 09/01CIF funding received by NOIC totalled $241,000 which was allocated towards:
Investigating funding options for the further development of the scheme;Promotion of the use of irrigation in unirrigated areas; andThe development of a media strategy to promote the scheme.
pRojeCt statusThe project is currently focusing on the design of an 800 ha expansion into the Awamoko area. A business case is also being prepared for the Kakanui Valley area with work continuing on developing other expansion opportunities. No timeline is in place for the completion of stage two.
www.noic.co.nz/index.php
u
u
u
Cu
rr
ent
Irr
Igat
Ion
dev
elo
Pmen
ts
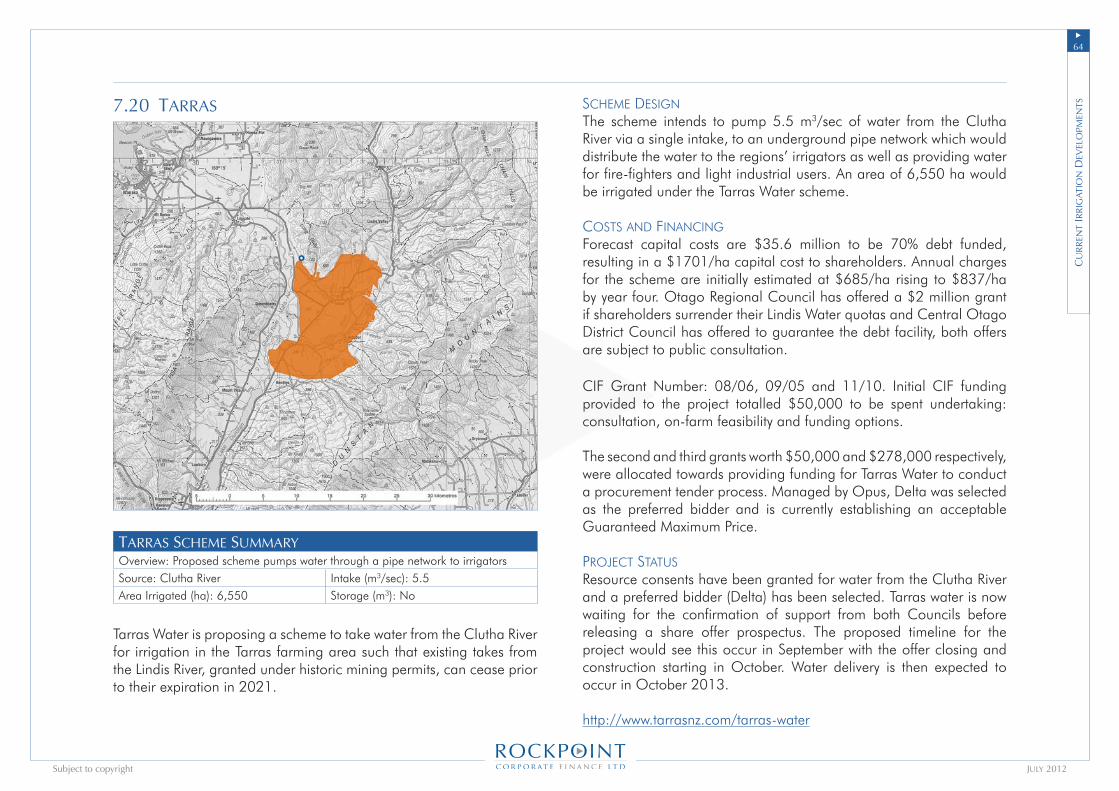
��u
July 2012Subject to copyright
7.20 tarras
tarras sCheme summaryOverview: Proposed scheme pumps water through a pipe network to irrigatorsSource: Clutha River Intake (m3/sec): 5.5Area Irrigated (ha): 6,550 Storage (m3): No
Tarras Water is proposing a scheme to take water from the Clutha River for irrigation in the Tarras farming area such that existing takes from the Lindis River, granted under historic mining permits, can cease prior to their expiration in 2021.
sCheMe designThe scheme intends to pump 5.5 m3/sec of water from the Clutha River via a single intake, to an underground pipe network which would distribute the water to the regions’ irrigators as well as providing water for fire-fighters and light industrial users. An area of 6,550 ha would be irrigated under the Tarras Water scheme.
Costs and finanCingForecast capital costs are $35.6 million to be 70% debt funded, resulting in a $1701/ha capital cost to shareholders. Annual charges for the scheme are initially estimated at $685/ha rising to $837/ha by year four. Otago Regional Council has offered a $2 million grant if shareholders surrender their Lindis Water quotas and Central Otago District Council has offered to guarantee the debt facility, both offers are subject to public consultation.
CIF Grant Number: 08/06, 09/05 and 11/10. Initial CIF funding provided to the project totalled $50,000 to be spent undertaking: consultation, on-farm feasibility and funding options.
The second and third grants worth $50,000 and $278,000 respectively, were allocated towards providing funding for Tarras Water to conduct a procurement tender process. Managed by Opus, Delta was selected as the preferred bidder and is currently establishing an acceptable Guaranteed Maximum Price.
pRojeCt statusResource consents have been granted for water from the Clutha River and a preferred bidder (Delta) has been selected. Tarras water is now waiting for the confirmation of support from both Councils before releasing a share offer prospectus. The proposed timeline for the project would see this occur in September with the offer closing and construction starting in October. Water delivery is then expected to occur in October 2013.
http://www.tarrasnz.com/tarras-water
Cu
rr
ent
Irr
Igat
Ion
dev
elo
Pmen
ts
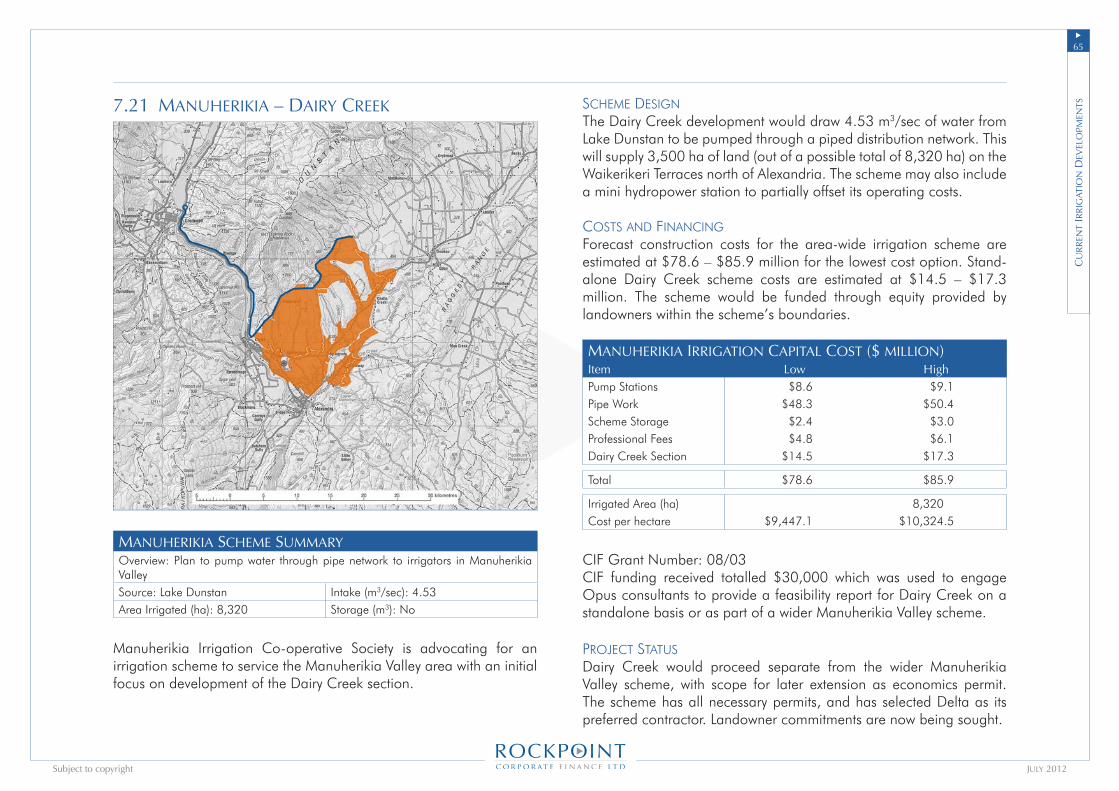
��u
July 2012Subject to copyright
7.21 manuherIkIa – daIry Creek
manuherIkIa sCheme summaryOverview: Plan to pump water through pipe network to irrigators in Manuherikia ValleySource: Lake Dunstan Intake (m3/sec): 4.53Area Irrigated (ha): 8,320 Storage (m3): No
Manuherikia Irrigation Co-operative Society is advocating for an irrigation scheme to service the Manuherikia Valley area with an initial focus on development of the Dairy Creek section.
sCheMe designThe Dairy Creek development would draw 4.53 m3/sec of water from Lake Dunstan to be pumped through a piped distribution network. This will supply 3,500 ha of land (out of a possible total of 8,320 ha) on the Waikerikeri Terraces north of Alexandria. The scheme may also include a mini hydropower station to partially offset its operating costs.
Costs and finanCingForecast construction costs for the area-wide irrigation scheme are estimated at $78.6 – $85.9 million for the lowest cost option. Stand-alone Dairy Creek scheme costs are estimated at $14.5 – $17.3 million. The scheme would be funded through equity provided by landowners within the scheme’s boundaries.
manuherIkIa IrrIgatIon CaPItal Cost ($ mIllIon)Item Low HighPump Stations $8.6 $9.1Pipe Work $48.3 $50.4Scheme Storage $2.4 $3.0Professional Fees $4.8 $6.1Dairy Creek Section $14.5 $17.3
Total $78.6 $85.9
Irrigated Area (ha) 8,320.0Cost per hectare $9,447.1 $10,324.5
CIF Grant Number: 08/03CIF funding received totalled $30,000 which was used to engage Opus consultants to provide a feasibility report for Dairy Creek on a standalone basis or as part of a wider Manuherikia Valley scheme.
pRojeCt statusDairy Creek would proceed separate from the wider Manuherikia Valley scheme, with scope for later extension as economics permit. The scheme has all necessary permits, and has selected Delta as its preferred contractor. Landowner commitments are now being sought.
Cu
rr
ent
Irr
Igat
Ion
dev
elo
Pmen
ts
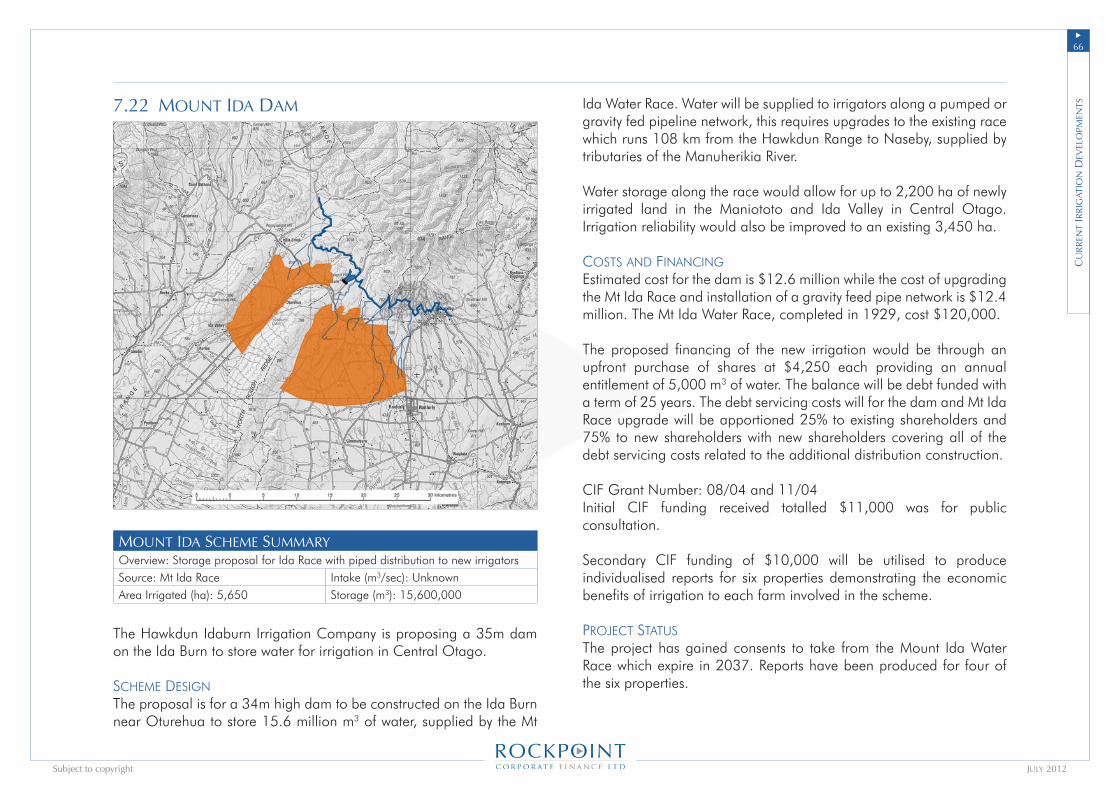
��u
July 2012Subject to copyright
7.22 mount Ida dam
mount Ida sCheme summaryOverview: Storage proposal for Ida Race with piped distribution to new irrigatorsSource: Mt Ida Race Intake (m3/sec): UnknownArea Irrigated (ha): 5,650 Storage (m3): 15,600,000
The Hawkdun Idaburn Irrigation Company is proposing a 35m dam on the Ida Burn to store water for irrigation in Central Otago.
sCheMe designThe proposal is for a 34m high dam to be constructed on the Ida Burn near Oturehua to store 15.6 million m3 of water, supplied by the Mt
Ida Water Race. Water will be supplied to irrigators along a pumped or gravity fed pipeline network, this requires upgrades to the existing race which runs 108 km from the Hawkdun Range to Naseby, supplied by tributaries of the Manuherikia River.
Water storage along the race would allow for up to 2,200 ha of newly irrigated land in the Maniototo and Ida Valley in Central Otago. Irrigation reliability would also be improved to an existing 3,450 ha.
Costs and finanCingEstimated cost for the dam is $12.6 million while the cost of upgrading the Mt Ida Race and installation of a gravity feed pipe network is $12.4 million. The Mt Ida Water Race, completed in 1929, cost $120,000.
The proposed financing of the new irrigation would be through an upfront purchase of shares at $4,250 each providing an annual entitlement of 5,000 m3 of water. The balance will be debt funded with a term of 25 years. The debt servicing costs will for the dam and Mt Ida Race upgrade will be apportioned 25% to existing shareholders and 75% to new shareholders with new shareholders covering all of the debt servicing costs related to the additional distribution construction.
CIF Grant Number: 08/04 and 11/04Initial CIF funding received totalled $11,000 was for public consultation.
Secondary CIF funding of $10,000 will be utilised to produce individualised reports for six properties demonstrating the economic benefits of irrigation to each farm involved in the scheme.
pRojeCt statusThe project has gained consents to take from the Mount Ida Water Race which expire in 2037. Reports have been produced for four of the six properties.
Cu
rr
ent
Irr
Igat
Ion
dev
elo
Pmen
ts
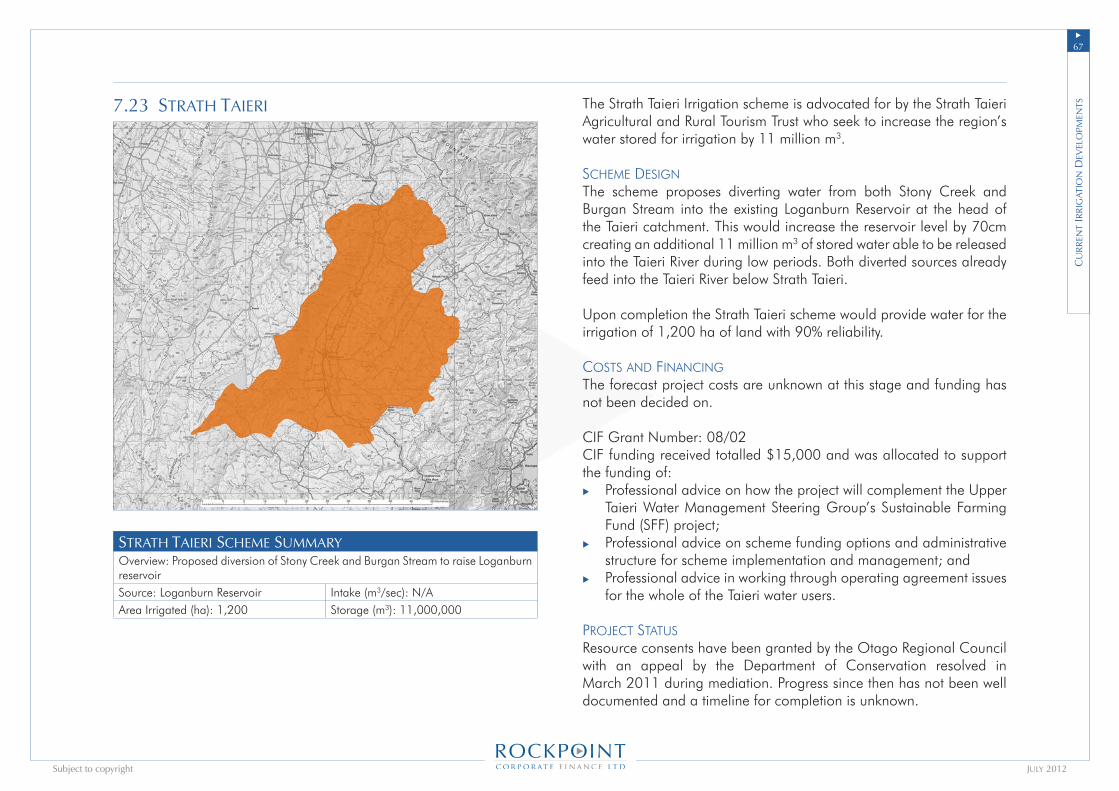
�7u
July 2012Subject to copyright
7.23 strath taIerI
strath taIerI sCheme summaryOverview: Proposed diversion of Stony Creek and Burgan Stream to raise Loganburn reservoirSource: Loganburn Reservoir Intake (m3/sec): N/AArea Irrigated (ha): 1,200 Storage (m3): 11,000,000
The Strath Taieri Irrigation scheme is advocated for by the Strath Taieri Agricultural and Rural Tourism Trust who seek to increase the region’s water stored for irrigation by 11 million m3.
sCheMe designThe scheme proposes diverting water from both Stony Creek and Burgan Stream into the existing Loganburn Reservoir at the head of the Taieri catchment. This would increase the reservoir level by 70cm creating an additional 11 million m3 of stored water able to be released into the Taieri River during low periods. Both diverted sources already feed into the Taieri River below Strath Taieri.
Upon completion the Strath Taieri scheme would provide water for the irrigation of 1,200 ha of land with 90% reliability.
Costs and finanCingThe forecast project costs are unknown at this stage and funding has not been decided on.
CIF Grant Number: 08/02CIF funding received totalled $15,000 and was allocated to support the funding of:
Professional advice on how the project will complement the Upper Taieri Water Management Steering Group’s Sustainable Farming Fund (SFF) project;Professional advice on scheme funding options and administrative structure for scheme implementation and management; andProfessional advice in working through operating agreement issues for the whole of the Taieri water users.
pRojeCt statusResource consents have been granted by the Otago Regional Council with an appeal by the Department of Conservation resolved in March 2011 during mediation. Progress since then has not been well documented and a timeline for completion is unknown.
u
u
u
Cu
rr
ent
Irr
Igat
Ion
dev
elo
Pmen
ts
��u
July 2012Subject to copyright
The Recipient, in accepting this report, expressly acknowledges the enduring copyright of Rockpoint Corporate Finance Ltd.
Information in this report has been obtained from sources believed to be reliable. Rockpoint Corporate Finance Ltd (“Rockpoint”) and/or its subsidiaries and affiliates do not warrant this report’s completeness or accuracy. Rockpoint, and its staff, accept no liability for direct or contingent losses resulting from any statements made in this report. Opinions and estimates constitute our collective judgement as of the date of this material and are subject to change without notice.
8. dIsClaImer & ConfIdentIalIty
dIs
Cla
Imer
& C
on
fId
entI
alI
ty