iru &odvv $ (ohydwhg 7hpshudwxuh 6huylfh · pdf filethe american society of mechanical...
TRANSCRIPT


DISCLAIMER This information was prepared as an account of work sponsored by an
agency of the U.S. Government. Neither the U.S. Government nor any agency thereof, nor any of their employees, makes any warranty, expressed or implied, or assumes any legal liability or responsibility for the accuracy, completeness, or usefulness, of any information, apparatus, product, or process disclosed, or represents that its use would not infringe privately owned rights. References herein to any specific commercial product, process, or service by trade name, trade mark, manufacturer, or otherwise, does not necessarily constitute or imply its endorsement, recommendation, or favoring by the U.S. Government or any agency thereof. The views and opinions of authors expressed herein do not necessarily state or reflect those of the U.S. Government or any agency thereof.

INL/EXT-15-36305
Draft ASME Boiler and Pressure Vessel Code Case for Use of Alloy 617 for Class A Elevated Temperature
Service Construction
J. K. Wright
August 2015
Idaho National Laboratory INL ART Program
Idaho Falls, Idaho 83415
http://www.inl.gov
Prepared for the U.S. Department of Energy Office of Nuclear Energy
Under DOE Idaho Operations Office Contract DE-AC07-05ID14517


vii
ABSTRACT
The American Society of Mechanical Engineers (ASME) Boiler and Pressure Vessel Code currently only allows five materials for use in construction of nuclear components for high temperature service. These are: 2.25Cr- 1Mo and V modified 9Cr-1Mo steels, Types 304 and 316 stainless steels and the high nickel Alloy 800H. Since 2005, the US high temperature gas-cooled reactor program has been characterizing elevated temperature mechanical properties of Alloy 617 as the leading candidate material for the intermediate heat exchanger. After analysis of these experimental results, along with historical data and additional results available through the Generation IV International Forum Very High Temperature Reactor Materials Program Management Board Materials Handbook, a draft ASME Code Case to allow nuclear construction with Alloy 617 has been developed.
This report contains the draft of a Section III, Division 5, Section HB, Subsection B, Code Case for Alloy 617 to qualify it for use in construction of nuclear components up to 1750°F (950°C) for service life up to 100,000 hours. The draft contained in Appendix 1, subject to editorial revision and approval by the ASME Special Task Group on Alloy 617 Code Qualification, will be submitted for approval by letter ballot by the appropriate ASME Committees. The technical justification supporting the Code Case is presented in Appendix 2 of this report. This background document is part of the information package that will be submitted with the Code Case for ballot.

viii

ix
ACKNOWLEDGEMENTS
The author gratefully acknowledges the contributions of Sam Sham at ORNL for planning, testing and analysis of the data that support the draft Code Case. The ASME Special Task Group on Alloy 617 Code Qualification made substantial contributions to defining the process for obtaining Code allowable stresses; active participants include, Michael Swindeman, Peter Carter, Tai Asayama, Jim Nestell, Mainak Sengupta, and Weiju Ren, and in particular the contributions of Bob Swindeman and Keith Morton. Bob Jetter developed the detailed template for the Code Case and made innumerable suggestions for how the authors should approach determination of many of the stress allowable values. His deep historical understanding of the high temperature design methods played a key role in guiding the special Task Group.
At INL, Laura Carroll directed the fatigue and creep-fatigue testing and analysis that were carried out in the laboratory by Joel Simpson, Randy Lloyd, Julian Benz and Tim Yoder. Mark Carroll, Todd Morris and Tammy Trowbridge conducted important microstructural analysis on deformation mechanisms that support the background to the Code Case. Tom Lillo was critical to creep testing and tertiary creep analysis. The authors are particularly grateful to Nancy Lybeck for her efficient, careful and responsive support of the statistical data analysis and archiving, and taking on the complex task of developing methods to generate hot tensile and isochronous stress strain curves. Finally, the leadership of Richard Wright has been critical to the success of the high temperature materials program and the development of an Alloy 617 ASME draft Code Case.

x

xi
CONTENTS
ABSTRACT ................................................................................................................................................ vii
ACKNOWLEDGEMENTS ......................................................................................................................... ix
ACRONYMS .............................................................................................................................................. xv
DRAFT ASME BOILER AND PRESSURE VESSEL CODE CASE FOR USE OF ALLOY 617 FOR CLASS A ELEVATED TEMPERATURE SERVICE CONSTRUCTION .............................. 1
APPENDIX 1 CASE N-XXX: USE OF ALLOY 617 (UNS N06617) FOR CLASS A ELEVATED TEMPERATURE SERVICE CONSTRUCTION SECTION III, DIVISION 5 .......... 3
PHYSICAL PROPERTIES TABLES .......................................................................................................... 5
THERMAL EXPANSION ................................................................................................................. 6
THERMAL CONDUCTIVITY AND THERMAL DIFFUSIVITY .................................................. 8
MODULUS OF ELASTICITY ........................................................................................................ 10
ARTICLE HBB-2000 MATERIAL............................................................................................................ 11
HBB-2100......................................................................................................................................... 11
HBB-2160 DETERIORATION OF MATERIAL IN SERVICE .................................... 11
ARTICLE HBB-3000 DESIGN.................................................................................................................. 12
HBB-3200 DESIGN BY ANALYSIS ......................................................................................... 12
HBB-3210 DESIGN CRITERIA .................................................................................... 12
HBB-3212 Basis for Determining Stress, Strain, and Deformation Quantities .. 12
HBB-3214 Stress Analysis ................................................................................. 12
HBB-3220 DESIGN RULES AND LIMITS FOR LOAD-CONTROLLED STRESSES IN STRUCTURES OTHER THAN BOLTS ........................................ 12
ARTICLE HBB-4000 FABRICATION AND INSTALLATION .............................................................. 15
HBB-4200......................................................................................................................................... 15
HB-4210 ...................................................................................................................... 15
HBB-4212 Effects of Forming and Bending Processes ...................................... 15
MANDATORY APPENDIX HBB-I-14 TABLES AND FIGURES ......................................................... 16
NONMANDATORY APPENDIX HBB-T RULES FOR STRAIN, DEFORMATION, AND FATIGUE LIMITS AT ELEVATED TEMPERATURES .............................................................. 27
HBB-T-1300 DEFORMATION AND STRAIN LIMITS FOR STRUCTURAL INTEGRITY .......................................................................................................................... 27
HBB-T-1320 SATISFACTION OF STRAIN LIMITS USING ELASTIC ANALYSIS ............................................................................................................... 27
HBB-T-1321 General Requirements ...................................................................... 27

xii
HBB-T-1323 Test No. A-2 ..................................................................................... 27
HBB-T-1324 Test No. A-3 ..................................................................................... 27
HBB-T-1330 SATISFACTION OF STRAIN LIMITS USING SIMPLIFIED INELASTIC ANALYSIS ......................................................................................... 27
HBB-T-1331 General Requirements ...................................................................... 27
HBB-T-1340 SATISFACTION OF STRAIN LIMITS USING ELASTIC-PERFECTLY PLASTIC ANALYSIS ...................................................................... 27
HBB-T-1341 General Requirements ...................................................................... 27
HBB-T-1342 Load Definition ................................................................................ 28
HBB-T-1343 Numerical Model.............................................................................. 28
HBB-T-1344 Requirements for Satisfaction of Strain Limits ................................ 28
HBB-T-1345 Weldments ........................................................................................ 30
HBB-T-1346 Ratcheting Analysis.......................................................................... 31
HBB-T-1400 CREEP‐FATIGUE EVALUATION .................................................................. 32
HBB-T-1410 GENERAL REQUIREMENTS .................................................................... 32
HBB-T-1411 Damage Equation ............................................................................. 32
HBB-T-1420 LIMITS USING INELASTIC ANALYSIS .................................................. 32
HBB-T-1430 LIMITS USING ELASTIC ANALYSIS ...................................................... 34
HBB-T-1431 General Requirements ...................................................................... 34
HBB-T-1435 Alternate Creep-Fatigue Evaluation ................................................. 34
HBB-T-1440 LIMITS USING ELASTIC-PERFECTLY PLASTIC ANALYSIS ............. 35
HBB-T-1441 General Requirements ...................................................................... 35
HBB-T-1442 Load Definition ................................................................................ 35
HBB-T-1443 Numerical Model.............................................................................. 36
HBB-T-1444 Calculation of Creep Damage .......................................................... 36
HBB-T-1445 Calculation of Fatigue Damage ........................................................ 36
HBB-T-1446 Weldments ........................................................................................ 37
HBB-T-1447 Shakedown Analysis ........................................................................ 38
HBB-T-1800 ISOCHRONOUS STRESS‐STRAIN RELATIONS ......................................... 40
HBB-T-1810 OBJECTIVE ................................................................................................. 40
HBB-T-1820 MATERIALS AND TEMPERATURE LIMITS .......................................... 40
APPENDIX 2 BACKGROUND FOR DRAFT CODE CASE: USE OF ALLOY 617 (UNS N06617) FOR CLASS A ELEVATED TEMPERATURE SERVICE CONSTRUCTION ............. 61
INTRODUCTION ...................................................................................................................................... 63

xiii
PHYSICAL PROPERTY TABLES............................................................................................................ 63
TE — THERMAL EXPANSION .................................................................................................... 63
TCD — THERMAL CONDUCTIVITY AND THERMAL DIFFUSIVITY .................................. 67
TM — MODULUS OF ELASTICITY ............................................................................................ 69
ARTICLE HBB-2000 MATERIAL............................................................................................................ 71
HBB-2100......................................................................................................................................... 71
HBB-2160 DETERIORATION OF MATERIAL IN SERVICE .................................... 71
ARTICLE HBB-3000 DESIGN.................................................................................................................. 72
HBB-3200 DESIGN BY ANALYSIS ......................................................................................... 72
HBB-3220 DESIGN RULES AND LIMITS FOR LOAD-CONTROLLED STRESSES IN STRUCTURES OTHER THAN BOLTS ........................................ 72
HBB-3225 Level D Service Limits .................................................................... 72
HBB-3225-1 Tensile Strength Values Su ............................................................... 72
HBB-3225-2 Tensile and Yield Strength Reduction Factor Due to Long Time Prior Elevated Temperature Service ............................................. 74
ARTICLE HBB-4000 FABRICATION AND INSTALLATION .............................................................. 77
HBB-4200......................................................................................................................................... 77
HB-4210 ...................................................................................................................... 77
HBB-4212 Effects of Forming and Bending Processes ...................................... 77
MANDATORY APPENDIX HBB-I-14 TABLES AND FIGURES ......................................................... 78
HBB-I-14.1 ....................................................................................................................................... 78
HBB-I-14.1(a) PERMISSIBLE BASE MATERIALS FOR STRUCTURES OTHER THAN BOLTING ..................................................................................................... 78
HBB-I-14.1(b) PERMISSIBLE WELD MATERIALS ......................................................... 78
HBB-I-14.2 So – MAXIMUM ALLOWABLE STRESS INTENSITY ....................................... 78
HBB-I-14.3 Smt – ALLOWABLE STRESS INTENSITY VALUES............................................ 78
HBB-I-14.4 St – ALLOWABLE STRESS INTENSITY VALUES ............................................. 80
HBB-I-14.5 Sy – YIELD STRENGTH VALUES ......................................................................... 86
HBB-I-14.6 Sr – MINIMUM STRESS-TO-RUPTURE ............................................................... 88
HBB-I-14.10 STRESS RUPTURE FACTORS FOR WELDED ALLOY 617 ......................... 89
HBB-I-14.11 PERMISSIBLE MATERIALS FOR BOLTING ................................................. 91
NONMANDATORY APPENDIX HBB-T RULES FOR STRAIN, DEFORMATION, AND FATIGUE LIMITS AT ELEVATED TEMPERATURES .............................................................. 92

xiv
HBB-T-1300 DEFORMATION AND STRAIN LIMITS FOR STRUCTURAL INTEGRITY .......................................................................................................................... 92
HBB-T-1320 SATISFACTION OF STRAIN LIMITS USING ELASTIC ANALYSIS ............................................................................................................... 92
HBB-T-1323 Test No. A-2 .................................................................................... 92
HBB-T-1400 CREEP‐FATIGUE EVALUATION .................................................................... 92
HBB-T-1420 LIMITS USING INELASTIC ANALYSIS .................................................. 92
HBB-T-1420-1 Design Fatigue Strain Range, ϵt , for Alloy 617 ............................... 92
HBB-T-1420-2 Creep-Fatigue Damage Envelope ..................................................... 98
HBB-T-1800 ISOCHRONOUS STRESS‐STRAIN RELATIONS ......................................... 103
HBB-T-1820 MATERIALS AND TEMPERATURE LIMITS ........................................ 107
REFERENCES ......................................................................................................................................... 109
APPENDIX 3 LETTER FROM AREVA REQUESTING CODE ACTION ON ALLOY 617 .............. 113

xv
ACRONYMS
ART Advanced Reactor Technologies
ASME American Society of Mechanical Engineers
BPV Boiler and Pressure Vessel
INL Idaho National Laboratory
VHTR Very High Temperature Reactor

xvi

1
DRAFT ASME BOILER AND PRESSURE VESSEL CODE CASE FOR USE OF ALLOY 617 FOR CLASS A ELEVATED TEMPERATURE
SERVICE CONSTRUCTION
Early in the US very high temperature reactor (VHTR) program several candidate nickel alloys were considered for use in construction of the intermediate heat exchanger. Based primarily on technical maturity, a downselection was made to focus on Alloy 617. After this downselection, the primary goal of the research and development program was to develop sufficient information on the high temperature properties of the material to qualify it for construction of high temperature nuclear components in the ASME Boiler and Pressure Vessel (BPV) Code.
Alloy 617 is a solid-solution strengthened material with nominal Ni-Cr-Co-Mo composition. The alloy was originally developed for aerospace applications such as burner can liners for turbine engines by Huntington Alloys. (Huntington Alloys is now Special Metals Division of Precision Castparts, Inc.). The ASME BPV Code allows use of Alloy 617 for construction of non-nuclear pressure vessels, and Alloy 617 is used in fossil fired power plants. It was the subject of substantial characterization activity in the US, German and Japanese high temperature gas reactor programs in the 1980s.
Section III, Division 1, Subsection NB of the ASME BPV Code was developed for construction of nuclear components in light water reactors and allows use of ferritic materials up to 700°F and austenitic alloys up to 800°F. Subsection NH of Section III Division 1 was written to allow higher temperature construction with a primary focus on sodium cooled reactors. Recently, a new Division 5 of Section III was published specifically for high temperature reactors (regardless of the primary working fluid) and incorporates both Subsections NB and NH.
There are only five alloys currently allowed for use in high temperature nuclear components: 2.25Cr-1 Mo and V modified 9Cr-1Mo steels, Types 304 and 316 stainless steels and the high nickel austenitic Alloy 800H. This very sparse set of allowed materials is in contrast with the collection of more than 150 materials that are allowed for use in non-nuclear pressure vessel construction. A draft Code Case to add Alloy 617 to the list of qualified alloys for use in high temperature nuclear design was submitted to ASME in the early 1990s but it was withdrawn prior to formal Code action.
A great deal of experimental characterization of high temperature mechanical properties is required for Code qualification. A new appendix to Section III Division 5 of the Code “Appendix HBB-Y Guidelines for Design Data Needs for New Materials” provides a roadmap for qualifying new materials. There are several additional requirements for qualification of materials for use in high temperature nuclear construction, compared to conventional pressure vessels. For non-nuclear pressure vessel construction, creep rupture data for 10,000 hours can be used to support qualification up to 100,000 hours of service. For high temperature nuclear construction, extrapolation of rupture life beyond the longest experimental rupture lives is restricted to a factor of 3 to 5. High temperature nuclear construction is also the only area of the Code which requires creep-fatigue characterization.
For Alloy 617, there are data from Huntington Alloys, and from the historical records and literature that resulted from previous US, German and Japanese gas cooled high temperature reactor programs. In addition, there has been a significant amount of characterization of contemporary heats of Alloy 617 since about 2005, as part of the US Advanced Reactor Technologies research and development program (formerly the Next Generation Nuclear Plant Program). Further data are also available from French and Korean programs as part of the Generation IV International Forum VHTR Materials Program Management Board.
A Code Case to qualify Alloy 617 for use in nuclear construction under Section III, Division 5 for components designed for use up to 800°F (427°C) has been submitted and is currently in the ASME ballot process. This report contains the draft of a Section III, Division 5, Section HB, Subsection B, Code Case

2
for Alloy 617 to qualify it for use in construction of nuclear components up to 1750°F (950°C) for service life up to 100,000 hours. The draft contained in Appendix 1, subject to editorial revision and approval by the ASME Special Task Group on Alloy 617 Code Qualification, will be submitted for approval by letter ballot by the appropriate Committees. Note that the Code considers values in customary units to be the governing quantities; values in SI units are provided in some cases for convenience. The technical justification supporting the Code Case is shown in Appendix 2 of this report. This background document is part of the information package that will be submitted with the Code Case for ballot. In general, the Code Committees will not take action on a new material without a request from a vendor stating the need to qualify the material. A letter from AREVA requesting Code action on Alloy 617 is attached to this report as Appendix 3.

3
APPENDIX 1
CASE N-XXX: USE OF ALLOY 617 (UNS N06617) FOR CLASS A ELEVATED TEMPERATURE SERVICE
CONSTRUCTION SECTION III, DIVISION 5

4

5
APPENDIX 1
CASE N-XXX: USE OF ALLOY 617 (UNS N06617) FOR CLASS A ELEVATED TEMPERATURE SERVICE
CONSTRUCTION SECTION III, DIVISION 5
Inquiry: May 52Ni-22Cr-13Co-9Mo, Alloy 617 (UNS N06617) be used at elevated temperatures in the construction of components conforming to the requirements of Section III, Division 5, Subsection HB, Subpart B “Elevated Temperature Service”?
Reply: It is the opinion of the Committee that 52Ni-22Cr-13Co-9Mo, Alloy 617 (UNS N06617) may be used in the construction of components conforming to the requirements of Section III, Division 5, Subsection HB, Subpart B “Elevated Temperature Service” providing the following requirements are met:
(a) The modifications and additions to the rules provided in Subsection HB, Subpart B defined in this Code Case shall be met.
(b) The service temperature shall be limited to 1,750°F and below. (c) Service time shall be limited to 100,000 hours. (d) All other applicable requirements of Section III, Division 5, Subsection HB, Subpart B shall be
met. (e) This Case number shall be listed on the Data Report Form for the component.
All requirements of Section III, Division 5, Subsection HB, Subpart B shall be met except when these requirements are modified by the corresponding numbered paragraphs of this Code Case or when new requirements are added with new numbered paragraphs of this Code Case. All general notes contained in Section III, Division 5 shall apply to the corresponding figures and tables in this Code Case.
Thermal expansion, thermal diffusivity, and thermal conductivity are not currently contained in Section II for Alloy 617 (UNS N06617). Values for these properties are shown in Tables TE and TCD of this Code Case. Elastic modulus values for Alloy 617 are currently included in Section II Part D (Table TM-4) for temperatures up to 1,500°F (850°C), but the temperature range must be increased to 1,800°F (1000°C). Elastic modulus values are shown in Table TM of this Code Case.
PHYSICAL PROPERTIES TABLES

6
THERMAL EXPANSION
Table TE Thermal Expansion for Alloy 617
Coefficients for N06617 Temperature, °F A B C
70 7.0 7.0 0.0 100 7.1 7.0 0.3 150 7.1 7.1 0.7 200 7.2 7.1 1.1 250 7.3 7.1 1.6
300 7.4 7.2 2.0 350 7.5 7.2 2.4 400 7.6 7.3 2.9 450 7.7 7.3 3.4 500 7.8 7.4 3.8
550 7.9 7.4 4.3 600 8.0 7.5 4.8 650 8.2 7.5 5.3 700 8.3 7.6 5.8 750 8.4 7.6 6.3
800 8.6 7.7 6.8 850 8.7 7.8 7.3 900 8.9 7.8 7.8 950 9.0 7.9 8.4
1,000 9.2 8.0 8.9
1,050 9.4 8.0 9.5 1,100 9.5 8.1 10.0 1,150 9.7 8.2 10.6 1,200 9.9 8.2 11.2 1,250 10.1 8.3 11.8
1,300 10.3 8.4 12.4 1,350 10.5 8.5 13.0 1,400 10.7 8.5 13.7 1,450 10.9 8.6 14.3 1,500 11.1 8.7 15.0
1,550 11.3 8.8 15.6 1,600 11.5 8.9 16.3 1,650 11.8 9.0 17.0 1,700 12.0 9.1 17.7 1,750 12.2 9.1 18.5 1,800 12.5 9.2 19.2
GENERAL NOTE: Coefficient A is the instantaneous coefficient of thermal expansion x 10-6 (in./in./°F). Coefficient B is the mean coefficient of thermal expansion x 10-6 (in./in./°F) in going from 70°F to indicated temperature. Coefficient C is the linear thermal expansion
(in./100 ft) in going from 70°F to indicated temperature.

7
Table TE (M) Thermal Expansion for Alloy 617
Coefficients for N06617 Temperature, °C A B C
20 12.6 12.6 0.0 50 12.8 12.7 0.4 75 12.9 12.7 0.7
100 13.0 12.8 1.0
125 13.2 12.9 1.4 150 13.3 12.9 1.7 175 13.5 13.0 2.0 200 13.6 13.1 2.4
225 13.8 13.2 2.7 250 14.0 13.2 3.0 275 14.2 13.3 3.4 300 14.4 13.4 3.8
325 14.6 13.5 4.1 350 14.8 13.6 4.5 375 15.0 13.7 4.9 400 15.2 13.8 5.2
425 15.4 13.9 5.6 450 15.7 14.0 6.0 475 15.9 14.1 6.4 500 16.2 14.2 6.8
525 16.4 14.3 7.2 550 16.7 14.4 7.6 575 17.0 14.5 8.0 600 17.2 14.6 8.5
625 17.5 14.7 8.9 650 17.8 14.8 9.3 675 18.1 15.0 9.8 700 18.4 15.1 10.3
725 18.8 15.2 10.7 750 19.1 15.3 11.2 775 19.4 15.5 11.7 800 19.8 15.6 12.2
825 20.1 15.7 12.7 850 20.5 15.9 13.2 875 20.8 16.0 13.7 900 21.2 16.1 14.2
925 21.6 16.3 14.7 950 21.9 16.4 15.3 975 22.3 16.6 15.8 1000 22.7 16.7 16.4
GENERAL NOTE: Coefficient A is the instantaneous coefficient of thermal expansion x 10-6 (mm/mm/°C). Coefficient B is the mean coefficient of thermal expansion x 10-6 (mm/mm/°C) in going from 20°C to indicated temperature. Coefficient C is the linear thermal expansion (mm/m) in going from 20°C to indicated temperature.

8
THERMAL CONDUCTIVITY AND THERMAL DIFFUSIVITY
Table TCD Nominal Coefficients of Thermal Conductivity (TC) and Thermal Diffusivity (TD)
for Alloy 617 N06617 Temp., °F TC TD
70 6.1 0.112 100 6.3 0.114 150 6.6 0.118 200 6.9 0.122 250 7.2 0.125
300 7.5 0.129 350 7.8 0.132 400 8.1 0.136 450 8.4 0.139 500 8.7 0.142
550 9.0 0.145 600 9.3 0.149 650 9.5 0.152 700 9.8 0.155 750 10.0 0.158
800 10.3 0.161 850 10.5 0.164 900 10.8 0.167 950 11.0 0.171
1,000 11.3 0.174
1,050 12.1 0.177 1,100 13.2 0.181 1,150 14.1 0.184 1,200 14.6 0.188 1,250 14.9 0.192
1,300 14.8 0.194 1,350 14.7 0.191 1,400 14.6 0.189 1,450 14.5 0.188 1,500 14.6 0.189
1,550 14.7 0.191 1,600 14.9 0.193 1,650 15.1 0.196 1,700 15.5 0.199 1,750 15.9 0.203 1,800 16.3 0.206
GENERAL NOTES: (a) TC is the thermal conductivity, Btu/(hr-ft-°F), and TD is the thermal diffusivity, ft2/hr: TD = TC[Btu hr∙ ft∙°F⁄ ]
density (lb ft3⁄ ) × [specific heat (Btu lb∙°F⁄ )]
(b) Values of thermal expansion and thermal diffusivity should be used with the understanding that there is an associated ±10% uncertainty. This uncertainty results from compositional variations and variables associated with original data acquisition and analysis.

9
Table TCD (M) Nominal Coefficients of Thermal Conductivity (TC) and Thermal Diffusivity (TD)
for Alloy 617 N06617 Temp., °C TC TD
20 10.5 2.88 50 11.1 2.99 75 11.6 3.08
100 12.1 3.17 125 12.6 3.25
150 13.0 3.33 175 13.5 3.41 200 14.0 3.49
225 14.4 3.57 250 14.9 3.64 275 15.3 3.71 300 15.8 3.79
325 16.2 3.86 350 16.6 3.93 375 17.0 4.01 400 17.4 4.08
425 17.8 4.15 450 18.2 4.22 475 18.6 4.30 500 18.9 4.37
525 19.3 4.45 550 19.6 4.53 575 21.7 4.60 600 23.3 4.69
625 24.5 4.77 650 25.3 4.85 675 25.7 4.94 700 25.7 5.03
725 25.4 4.94 750 25.3 4.89 775 25.2 4.86 800 25.2 4.87
825 25.3 4.90 850 25.5 4.94 875 25.8 5.00 900 26.2 5.07 925 26.7 5.14 950 27.4 5.22 975 28.1 5.29 1000 28.9 5.35
GENERAL NOTES: (a)TC is the thermal conductivity, W/(m⋅C), and TD is the thermal diffusivity, 10-6 m2/sec: TD = TC[W/(m⋅°C)]
density �kgm3� × �specific heat � J
kg⋅°C��
(b) Values of thermal expansion and thermal diffusivity should be used with the understanding that there is an associated ±10% uncertainty. This uncertainty results from compositional variations and variables associated with original data acquisition and analysis.

10
MODULUS OF ELASTICITY
Table TM Moduli of Elasticity E of Alloy 617 for Given Temperatures
Modulus of Elasticity E = Value Given × 106 psi, for Temperature, °F, of Material -325 -200 -100 70 200 300 400 500 600 700 800 900 1,000 1,100 1,200 1,300 1,400 1,500 1,600 1,700 1,800 N06617 - - - 29.2 28.4 28.0 27.7 27.4 27.2 27.0 26.0 25.5 24.9 24.3 23.8 23.2 22.5 21.8 21.0 20.2 19.3
Modulus of Elasticity E = Value Given × 103 MPa, for Temperature, °C, of Material -200 -125 -75 25 100 150 200 250 300 350 400 450 500 550 600 650 700 750 800 850 900 950 1000 N06617 - - - 201 196 193 191 189 187 184 181 178 174 171 167 164 160 156 152 146 141 136 130

11
ARTICLE HBB-2000 MATERIAL
HBB-2100
HBB-2160 DETERIORATION OF MATERIAL IN SERVICE
(d) Long-time, elevated temperature, service may result in the reduction of the subsequent yield and ultimate tensile strengths.
(3) When the yield and ultimate tensile strengths are reduced by the elevated temperature service, it is necessary to appropriately reduce the values of Smt and Sm. To reflect the effects of long-time elevated temperature service, the Smt values of Tables HBB-I-14.3A through HBB-I-14.3F shall be redefined as the lower of (-a) through (-g) below, and the values of Sm shall be defined as the lower of (-b) through (-g) below:
(-g) for Alloy 617, the product of the yield strength at temperature (Table HBB-I-14.5) and the yield strength reduction factor (Table HBB-3225-2).

12
ARTICLE HBB-3000 DESIGN
HBB-3200 DESIGN BY ANALYSIS
HBB-3210 DESIGN CRITERIA
HBB-3212 Basis for Determining Stress, Strain, and Deformation Quantities
(d) An additional material of this Subsection, Alloy 617, has several unique characteristics that should be recognized and reflected in multiaxial stress-strain relationships. These include the following:
(1) There is not a clear distinction between time-independent elastic-plastic behavior and time‐dependent creep behavior.
(2) Flow stresses are strongly strain-rate sensitive at elevated temperatures.
HBB-3214 Stress Analysis
HBB-3214.2 Inelastic Analysis. [Note: Add the following paragraph as a new last paragraph to HBB-3214.2]
For Alloy 617, decoupling of plastic and creep strains in the classical constitutive framework is generally a poor representation of the true material behavior. Unified constitutive equations, which do not distinguish between rate-dependent plasticity and time-dependent creep, represent the rate dependence and softening that occur, particularly at higher temperatures.
HBB-3220 DESIGN RULES AND LIMITS FOR LOAD-CONTROLLED STRESSES IN STRUCTURES OTHER THAN BOLTS
HBB-3225 Level D Service Limits
The following temperature-dependent tensile strength values (Su) for Alloy 617 are added to Table HBB-3225-1.
The following tensile and yield strength reduction factors due to long-time prior elevated temperature service for Alloy 617 are added to Table HBB-3225-2.

13
Table HBB-3225-1 Tensile Strength Values, Su
U.S. Customary Units, ksi
See Section II, Part D, Subpart 1, Table U
for Values up to 1,000°F For Metal
Temperature Not Exceeding, °F UNS N06617
1,050 85.3 1,100 83.3 1,150 80.7 1,200 77.6 1,250 74.0 1,300 69.9 1,350 65.2 1,400 60.1 1,450 54.6 1,500 48.7 1,550 42.6 1,600 36.5 1,650 30.4 1,700 24.6 1,750 19.4
SI Units, MPa
See Section II, Part D, Subpart 1, Table U
for Values up to 538°C For Metal Temperature
Not Exceeding, °C UNS N06617 550 595 575 584 600 570 625 554 650 534 675 512 700 487 725 459 750 428 775 394 800 359 825 322 850 284 875 246 900 208 925 172 950 139
GENERAL NOTES: (a) The tabulated values of tensile strength and yield strength are those which the Committee believes are suitable for use in design calculations required by this Subsection. At temperatures above room temperature, the values of tensile strength tend toward an average or expected value which may be as much as 10% above the tensile strength trend curve adjusted to the minimum specified room temperature tensile strength. At temperatures above room temperature, the yield strength values correspond to the yield strength trend curve adjusted to the minimum specified room temperature yield strength. Neither the tensile strength nor the yield strength values correspond exactly to either average or minimum as these terms are applied to a statistical treatment of a homogeneous set of data. (b) Neither the ASME Material Specifications nor the rules of this Subsection required elevated temperature testing for tensile or yield strengths of production material for use in Code components. It is not intended that results of such tests, if performed, be compared with these tabulated tensile and yield strength values for ASME Code acceptance/rejection purposes for materials. If some elevated temperature test results on production material appear lower than the tabulated values by a large amount (more than the typical variability of material and suggesting the possibility of some error), further investigation by retest or other means should be considered.
14
Table HBB-3225-2 Tensile and Yield Strength Reduction Factor Due to Long Time Prior Elevated
Temperature Service
Material Temp. °F (°C) YS Reduction
Factor TS Reduction
Factor 617 >800°F (425°C) 1.0 1.0

15
ARTICLE HBB-4000 FABRICATION AND INSTALLATION
HBB-4200
HB-4210
HBB-4212 Effects of Forming and Bending Processes
(a) Post fabrication heat treatment [in accordance with (b) below] of materials that have been formed during fabrication, shall be required for fabrication induced strains greater than 5%.
(b) When required, the post fabrication heat treatment shall be in accordance with the following:
(3) For Alloy 617, the post fabrication heat treatment shall consist of the heat treatment specified in the base material specification.

16
MANDATORY APPENDIX HBB-I-14 TABLES AND FIGURES
The following Tables and Figures have Alloy 617 data added as indicated.

17
Table HBB-I-14.1(a) Permissible Base Materials for Structures Other Than Bolting
Base Material Spec. No. Product Form Types, Grades or Classes Alloy 617 SB-166 Bar, rod UNS N06617 [Note (1)] SB-167 Smls. pipe & tube UNS N06617
SB-168 Plate, sheet, strip UNS N06617 SB-564 Forgings UNS N06617
NOTE: (1) The minimum material thickness shall be 0.125 inches.
Table HBB-I-14.1(b) Permissible Weld Materials
Base Material Spec. No. Class Alloy 617 SFA-5.14 ERNiCrCoMo-1

18
Table HBB-I-14.2 So — Maximum Allowable Stress Intensity, ksi (MPa), for Design Condition Calculations
U.S. Customary Units For Metal Temperature
Not Exceeding, °F N06617
700 --- 750 --- 800 21.5 850 21.3 900 21.2 950 21.0
1,000 1,050
20.9 20.9
1,100 20.8 1,150 20.7 1,200 18.1 1,250 14.5 1,300 11.2 1,350 8.7 1,400 6.6 1,450 5.1 1,500 3.9 1,550 3.0 1,600 2.3 1,650 1.8 1,700 1.4 1,750 1.1
SI Units For Metal Temperature
Not Exceeding, °C N06617
375 --- 400 --- 425 148 450 147 475 146 500 145 525 550
144 144
575 144 600 143 625 142 650 124 675 101 700 81 725 64 750 50 775 40 800 31 825 25 850 19 875 15 900 12 925 10 [Note (1)] 950 7.9 [Note (1)]
NOTE: (1) Interpolated from values given in Note G29 of
Section II, Part D, Subpart 1, Table 1B.

19
(figure is provisional, peaks must be removed)

20
Table HBB-I-14.3F Smt – Allowable Stress Intensity Values, ksi (MPa), Alloy 617
U.S. Customary Units
Temp., °F 1 hr 10 hr 30 hr 100 hr 300 hr 1,000 hr 3,000 hr 10,000 hr 30,000 hr 100,000 hr 800 21.5 21.5 21.5 21.5 21.5 21.5 21.5 21.5 21.5 21.5 850 21.3 21.3 21.3 21.3 21.3 21.3 21.3 21.3 21.3 21.3 900 21.2 21.2 21.2 21.2 21.2 21.2 21.2 21.2 21.2 21.2 950 21.1 21.1 21.1 21.1 21.1 21.1 21.1 21.1 21.1 21.1
1,000 21.0 21.0 21.0 21.0 21.0 21.0 21.0 21.0 21.0 21.0 1,050 21.0 21.0 21.0 21.0 21.0 21.0 21.0 21.0 21.0 21.0 1,100 21.0 21.0 21.0 21.0 21.0 21.0 21.0 21.0 21.0 20.1 1,150 21.0 21.0 21.0 21.0 21.0 21.0 21.0 21.0 18.9 15.9 1,200 21.0 21.0 21.0 21.0 21.0 21.0 21.0 17.6 14.8 12.2 1,250 21.0 21.0 21.0 21.0 21.0 19.9 16.6 13.6 11.4 9.3 1,300 21.0 21.0 21.0 21.0 19.1 15.6 12.9 10.5 8.7 7.1 1,350 21.0 21.0 21.0 18.2 15.0 12.2 10.0 8.1 6.7 5.4 1,400 21.0 21.0 17.9 14.4 11.8 9.5 7.8 6.3 5.1 4.1 1,450 20.0 17.4 14.2 11.4 9.3 7.4 6.0 4.8 4.0 3.2 1,500 17.9 13.9 11.3 9.0 7.3 5.8 4.7 3.7 3.0 2.4 1,550 15.6 11.1 8.9 7.1 5.7 4.5 3.6 2.9 2.3 1.8 1,600 13.4 8.8 7.1 5.6 4.5 3.5 2.8 2.2 1.8 1.4 1,650 11.1 7.1 5.6 4.4 3.5 2.8 2.2 1.7 1.4 1.1 1,700 9.0 5.6 4.5 3.5 2.8 2.2 1.7 1.3 1.1 0.8 1,750 7.1 4.5 3.6 2.7 2.2 1.7 1.3 1.0 0.8 0.6
SI Units Temp., °C 1 h 10 h 30 h 100 h 300 h 1,000 h 3,000 h 10,000 h 30,000 h 100,000 h
425 148 148 148 148 148 148 148 148 148 148 450 147 147 147 147 147 147 147 147 147 147 475 146 146 146 146 146 146 146 146 146 146 500 146 146 146 146 146 146 146 146 146 146 525 145 145 145 145 145 145 145 145 145 145 550 145 145 145 145 145 145 145 145 145 145 575 145 145 145 145 145 145 145 145 145 145 600 145 145 145 145 145 145 145 145 145 131 625 145 145 145 145 145 145 145 145 126 106 650 145 145 145 145 145 145 144 120 101 83 675 145 145 145 145 145 140 116 95 80 65 700 145 145 145 145 137 112 93 76 63 51 725 145 145 145 133 110 89 74 60 49 40 750 145 145 134 108 89 72 59 47 39 31 775 144 133 109 87 71 57 47 38 31 25 800 132 109 88 71 57 46 37 30 24 19 825 118 89 72 57 46 37 30 24 19 15 850 104 72 58 46 37 29 24 19 15 12 875 90 59 47 37 30 23 19 15 12 9.3 900 76 48 39 30 24 19 15 12 9.4 7.3 925 63 39 31 24 19 15 12 9.3 7.4 5.7 950 51 32 25 20 16 12 10 7.4 5.8 4.5
GENERAL NOTE: As described in HBB-2160(d), it may be necessary to adjust the values of Smt to account for the effects of long-time service at elevated temperature.

21
Figure HBB-I-14.4F St — Alloy 617

22
Table HBB-I-14.4F St – Allowable Stress Intensity Values, ksi (MPa), Alloy 617
U.S. Customary Units
Temp., °F 1 hr 10 hr 30 hr 100 hr 300 hr 1,000 hr 3,000 hr 10,000 hr 30,000 hr 100,000 hr 800 36.0 36.0 36.0 36.0 36.0 36.0 36.0 36.0 36.0 36.0 850 35.5 35.5 35.5 35.5 35.5 35.5 35.5 35.5 35.5 35.5 900 35.1 35.1 35.1 35.1 35.1 35.1 35.1 35.1 35.1 35.1 950 34.7 34.7 34.7 34.7 34.7 34.7 34.7 34.7 34.7 34.7
1,000 34.3 34.3 34.3 34.3 34.3 34.3 34.3 34.3 34.3 32.0 1,050 34.0 34.0 34.0 34.0 34.0 34.0 34.0 34.0 29.7 25.4 1,100 33.8 33.8 33.8 33.8 33.8 33.8 32.5 27.6 23.7 20.1 1,150 33.6 33.6 33.6 33.6 33.6 30.5 26.2 22.1 18.9 15.9 1,200 33.5 33.5 33.5 33.5 29.4 24.7 21.1 17.6 14.8 12.2 1,250 33.5 33.5 33.5 28.2 24.0 19.9 16.6 13.6 11.4 9.3 1,300 33.5 32.9 27.8 23.1 19.1 15.6 12.9 10.5 8.7 7.1 1,350 33.5 27.2 22.5 18.2 15.0 12.2 10.0 8.1 6.7 5.4 1,400 32.6 21.8 17.9 14.4 11.8 9.5 7.8 6.3 5.1 4.1 1,450 26.6 17.4 14.2 11.4 9.3 7.4 6.0 4.8 4.0 3.2 1,500 21.5 13.9 11.3 9.0 7.3 5.8 4.7 3.7 3.0 2.4 1,550 17.3 11.1 8.9 7.1 5.7 4.5 3.6 2.9 2.3 1.8 1,600 14.0 8.8 7.1 5.6 4.5 3.5 2.8 2.2 1.8 1.4 1,650 11.3 7.1 5.6 4.4 3.5 2.8 2.2 1.7 1.4 1.1 1,700 9.1 5.6 4.5 3.5 2.8 2.2 1.7 1.3 1.1 0.8 1,750 7.4 4.5 3.6 2.7 2.2 1.7 1.3 1.0 0.8 0.6
SI Units Temp., °C 1 h 10 h 30 h 100 h 300 h 1,000 h 3,000 h 10,000 h 30,000 h 100,000 h
425 245 245 245 245 245 245 245 245 245 245 450 245 245 245 245 245 245 245 245 245 245 475 242 242 242 242 242 242 242 242 242 242 500 240 240 240 240 240 240 240 240 240 240 525 238 238 238 238 238 238 238 238 238 238 550 235 235 235 235 235 235 235 235 233 199 575 234 234 234 234 234 234 234 220 190 162 600 233 233 233 233 233 233 213 180 155 131 625 232 232 232 232 232 204 175 148 126 106 650 231 231 231 231 201 169 144 120 101 83 675 231 231 231 197 167 140 116 95 80 65 700 231 231 198 164 137 112 93 76 63 51 725 231 197 165 133 110 89 74 60 49 40 750 231 163 134 108 89 72 59 47 39 31 775 202 133 109 87 71 57 47 38 31 25 800 167 109 88 71 57 46 37 30 24 19 825 138 89 72 57 46 37 30 24 19 15 850 114 72 58 46 37 29 24 19 15 12 875 94 59 47 37 30 23 19 15 12 9.3 900 77 48 39 30 24 19 15 12 9.4 7.3 925 64 39 31 24 19 15 12 9.3 7.4 5.7 950 53 32 25 20 16 12 9.5 7.4 5.8 4.5

23
Table HBB-I-14.5 Yield Strength Values, Sy, Versus Temperature
U.S. Customary Units Stresses, ksi Temp., °F UNS N06617
RT See Section II, Part D, Subpart 1, Table Y-1 for
Values up to 1,000°F :
1,000 1,050 23.3 1,100 23.3 1,150 23.3 1,200 23.3 1,250 23.3 1,300 23.3 1,350 23.3 1,400 23.3 1,450 23.0 1,500 22.2 1,550 21.1 1,600 19.9 1,650 18.5 1,700 16.9 1,750 15.1
SI Units Stresses, MPa Temp., °C UNS N06617
RT See Section II, Part D, Subpart 1, Table Y-1 for
Values up to 538°C :
525 550 161 575 161 600 161 625 161 650 161 675 161 700 161 725 161 750 161 775 161 800 156 825 151 850 144 875 136 900 127 925 117 950 106

25
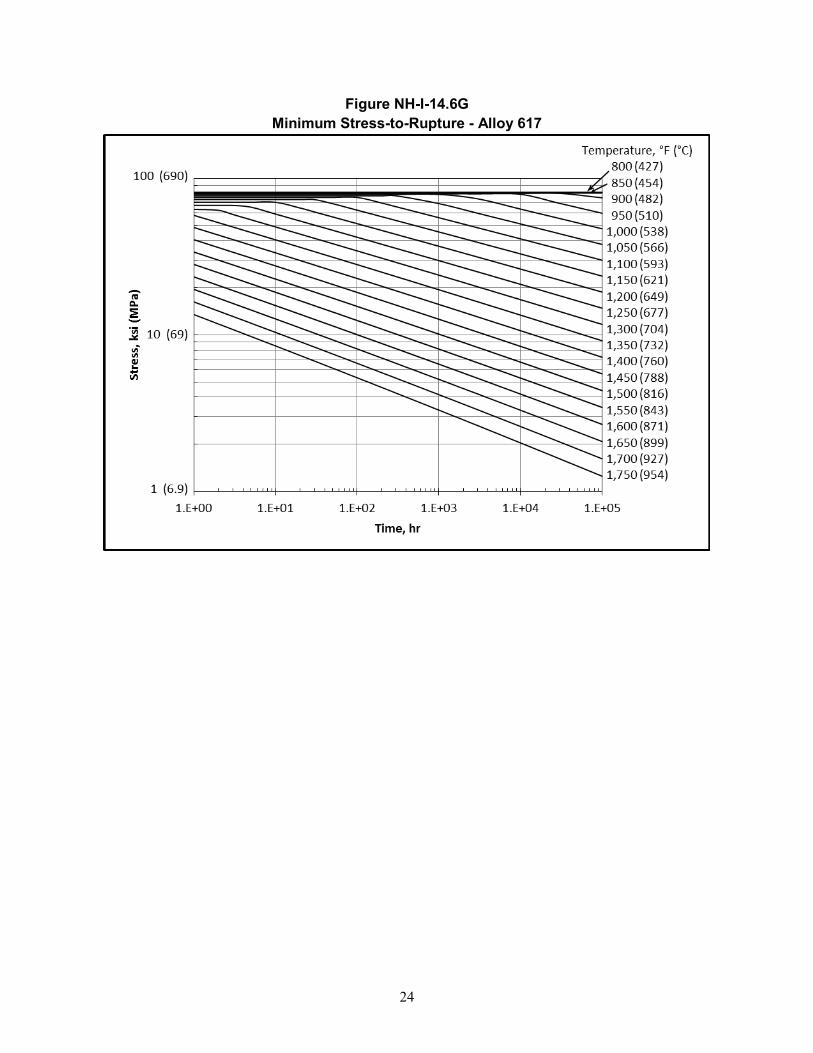
Table HBB-I-14.6G Expected Minimum Stress-to-Rupture Values, ksi (MPa), Alloy 617
U.S. Customary Units
Temp., °F 1 hr 10 hr 30 hr 100 hr 300 hr 1,000 hr 3,000 hr 10,000 hr 30,000 hr 100,000 hr 800 81.7 81.7 81.7 81.7 81.7 81.7 81.7 81.7 81.7 81.7 850 81.1 81.1 81.1 81.1 81.1 81.1 81.1 81.1 81.1 81.1 900 80.5 80.5 80.5 80.5 80.5 80.5 80.5 80.5 80.5 75.3 950 79.8 79.8 79.8 79.8 79.8 79.8 79.8 79.3 69.4 60.0
1,000 79.2 79.2 79.2 79.2 79.2 79.2 74.2 63.8 55.6 47.7 1,050 77.5 77.5 77.5 77.5 77.5 69.2 60.0 51.3 44.4 37.9 1,100 75.7 75.7 75.7 75.7 66.1 56.2 48.4 41.1 35.4 30.0 1,150 73.4 73.4 73.4 62.8 53.9 45.6 39.1 33.0 28.2 23.8 1,200 70.5 70.5 61.2 51.5 43.9 36.9 31.4 26.4 22.4 18.8 1,250 67.3 59.3 50.4 42.1 35.8 29.8 25.3 21.1 17.8 14.8 1,300 63.5 49.1 41.5 34.5 29.1 24.1 20.3 16.8 14.1 11.7 1,350 58.2 40.6 34.1 28.1 23.6 19.4 16.3 13.4 11.2 9.2 1,400 48.7 33.5 28.0 23.0 19.1 15.7 13.0 10.6 8.8 7.2 1,450 40.6 27.6 22.9 18.7 15.5 12.6 10.4 8.4 7.0 5.6 1,500 33.9 22.8 18.8 15.2 12.5 10.1 8.3 6.7 5.5 4.4 1,550 28.2 18.7 15.4 12.4 10.1 8.1 6.6 5.3 4.3 3.4 1,600 23.5 15.4 12.6 10.0 8.2 6.5 5.3 4.2 3.4 2.7 1,650 19.6 12.6 10.3 8.1 6.6 5.2 4.2 3.3 2.6 2.1 1,700 16.3 10.4 8.4 6.6 5.3 4.1 3.3 2.6 2.1 1.6 1,750 13.5 8.5 6.8 5.3 4.2 3.3 2.6 2.0 1.6 1.2
SI Units Temp., °C 1 h 10 h 30 h 100 h 300 h 1,000 h 3,000 h 10,000 h 30,000 h 100,000 h
425 564 564 564 564 564 564 564 564 564 564 450 560 560 560 560 560 560 560 560 560 560 475 555 555 555 555 555 555 555 555 555 551 500 552 552 552 552 552 552 552 552 519 449 525 548 548 548 548 548 548 548 486 425 366 550 541 541 541 541 541 536 466 400 347 297 575 531 531 531 531 521 445 385 328 284 241 600 518 518 518 503 434 369 317 269 231 196 625 504 504 498 421 361 305 261 220 188 159 650 485 485 419 352 300 252 215 180 153 128 675 465 413 352 294 250 208 177 147 125 104 700 443 349 295 245 207 172 145 120 101 84 725 417 294 247 205 172 142 119 98 82 67 750 358 247 207 170 142 117 97 80 66 54 775 305 208 173 142 118 96 80 65 54 43 800 259 175 145 118 97 79 65 53 43 35 825 220 147 121 98 80 65 53 43 35 28 850 186 123 101 81 66 53 43 35 28 22 875 158 103 84 67 55 43 35 28 23 18 900 134 87 70 56 45 36 29 23 18 14 925 113 72 58 46 37 29 23 18 14 11 950 96 61 48 38 30 24 19 15 12 9

26
Table HBB-I-14.10F-1 Stress Rupture Factors for Alloy 617 Welded with ERNiCrCoMo-1
U.S. Customary Units SI Units Temp., °F Ratio Temp., °C Ratio
800 1.0 425 1.0 850 1.0 450 1.0 900 1.0 475 1.0 950 1.0 500 1.0
1,000 1.0 525 1.0 1,050 1.0 550 1.0 1,100 1.0 575 1.0 1,150 1.0 600 1.0 1,200 1.0 625 1.0 1,250 1.0 650 1.0 1,300 1.0 675 1.0 1,350 1.0 700 1.0 1,400 1.0 725 1.0 1,450 1.0 750 1.0 1,500 0.8 775 1.0 1,550 0.8 800 1.0 1,600 0.8 825 0.8 1,650 0.8 850 0.8 1,700 0.8 875 0.8 1,750 0.8 900 0.8
925 0.8 950 0.8
Table HBB-I-14.11 Permissible Materials for Bolting
Not applicable for Alloy 617.

27
NONMANDATORY APPENDIX HBB-T RULES FOR STRAIN, DEFORMATION, AND FATIGUE LIMITS AT
ELEVATED TEMPERATURES
HBB-T-1300 DEFORMATION AND STRAIN LIMITS FOR STRUCTURAL INTEGRITY
HBB-T-1320 SATISFACTION OF STRAIN LIMITS USING ELASTIC ANALYSIS
HBB-T-1321 General Requirements
(e) Paragraph HBB-T-1321 is not applicable to Alloy 617 above 1200°F (650°C).
HBB-T-1323 Test No. A-2
The following data are added to Table HBB-T-1323 for Alloy 617.
Table HBB-T-1323 Temperatures at Which Sm = St at 105 hr
Material Temp., °F (°C) Alloy 617 1092 (589)
HBB-T-1324 Test No. A-3
The following data are added to Table HBB-T-1324 for Alloy 617.
Table HBB-T-1324 Values of the r and s Parameters
Material r s Alloy 617 1.0 1.5
HBB-T-1330 SATISFACTION OF STRAIN LIMITS USING SIMPLIFIED INELASTIC ANALYSIS
HBB-T-1331 General Requirements
(i) Paragraph HBB-T-1331is not applicable to Alloy 617 above 1200°F (650°C).
HBB-T-1340 SATISFACTION OF STRAIN LIMITS USING ELASTIC-PERFECTLY PLASTIC ANALYSIS
HBB-T-1341 General Requirements
The strain limits of HBB-T-1310 and HBB-T-1713 are considered satisfied if the requirements of this Subsubarticle are satisfied.
The design methodology employed for evaluation of strain limits is based on ratcheting analyses using a small strain theory elastic-perfectly plastic material model where the yield stress is adjusted based on a pseudo yield stress selected to bound accumulated inelastic strain. Guidance on ratcheting analysis is provided in HBB-T-1346. In this Code Case, the term “pseudo yield stress” refers to a temperature-dependent isochronous stress based on the total time duration of elevated temperature service and a target inelastic strain, not to exceed the yield strength of the material at temperature and is explicitly defined in HBB-T-1344.2.

28
(a) This design methodology is not applicable to skeletal structures, e.g. a constant diameter bar with uniform axial load throughout, nor to structures where geometrical non linearities exist, e.g. canopy or omega seals.
HBB-T-1342 Load Definition
Define all applicable loads and load cases per HBB-3113.2 Service Loadings.
HBB-T-1342.1 Composite Cycle Definition. For the purpose of performing an elastic-perfectly plastic ratcheting analysis, an overall cycle must be defined that includes all relevant features from the individual Level A, B and C Service Loadings identified in the Design Specification. Relevant features include, as a minimum, the time-dependent sequence of thermal, mechanical and pressure loading, including starting and ending conditions. Such an overall cycle is defined herein as a composite cycle subject to the following requirements.
(a) An individual cycle, as defined in the Design Specifications, cannot be further subdivided into individual cycles to satisfy these requirements.
(b) Except as described in paragraph (c) below, a single cycle from each Level A, B and C Service Loading cycle type shall be included in the composite cycle for evaluation of strain limits.
(c) Level C Service Loadings may be combined with the applicable Level A and B Service Loadings to define an additional composite cycle(s) to be evaluated separately from the composite cycle defined in paragraph HBB-T-1342.1. Multiple composite cycles that include Level C Service Loadings may be defined for separate evaluation. The total number of Level C Service Loading cycles shall not exceed 25.
HBB-T-1343 Numerical Model
Develop a numerical model of the component, including all relevant geometry characteristics. The model used for the analysis shall be selected to accurately represent the component geometry, boundary conditions, and applied loads. The model must also be accurate for small details, such as small holes, fillets, corner radii, and other stress risers. The local temperature history shall be determined from a thermal transient analysis based on the thermal boundary conditions determined from the loading conditions defined in HBB-T-1342.
HBB-T-1344 Requirements for Satisfaction of Strain Limits
Perform a ratcheting analysis for each of the composite cyclic histories defined in HBB-T-1342.1. Each of these cyclic histories must be shown to be free from ratcheting based on the pseudo yield stress, SxT, as defined in HBB-T-1344.2. In the following steps, inelastic strain for a particular stress, time and temperature is obtained by subtracting the elastic strain from the total strain as given by the isochronous stress strain curve at the same stress, time and temperature. Additional requirements for weldments are shown in HBB-T-1345.
HBB-1344.1 Step 1. Define tdesign as the total time duration of elevated temperature service for all Level A, B, and C Service Loadings when the temperature is above 800°F (425°C).
HBB-T-1344.2 Step 2. Select a target inelastic strain, x, where 0 < x < εavg and εavg is equal to 0.01 for base metal or 0.005 for weldments. Define a pseudo yield stress, SxT, at each location, using the temperature determined from the transient thermal analysis. This pseudo yield stress is equal to the lesser of the quantities defined below in (a) and (b).
(a) The yield strength, Sy, given in Table HBB-I-14.5 of this Code Case;
(b) The stress to cause x inelastic strain in time tdesign, as determined from the isochronous stress strain curves in HBB-T-1800 of this Code Case.

29
HBB-T-1344.3 Step 3. Perform a cyclic elastic-perfectly plastic analysis for each composite cycle defined in HBB-T-1342.1 above with temperature-dependent pseudo yield stress, SxT. If ratcheting does not occur, obtain the plastic strain distribution throughout the component. The plastic strain, εp, is evaluated according to
(1) where the plastic strain components, , , , , and , are those strains accumulated at the end of the composite cycle.
HBB-T-1344.4 Step 4. Assess acceptability in accordance with (a) and (b) below by using the plastic strains, εp, from Step 3. If the requirements of both (a) and (b) are satisfied, then the strain limits of HBB-T-1310 for base metal and HBB-T-1713 for weldments are also considered satisfied. This condition is illustrated in Figure HBB-T-1344(a).
(a) The requirement, x + εp ≤ εavg, must be satisfied at least at one point for all through-thickness locations. As defined in Step 2, εavg is equal to 0.01 for base metal or 0.005 for weldments. Failure of this requirement is illustrated in Figure HBB-T-1344(b).
(b) The requirement, x + εp ≤ εlocal, must be satisfied at all points. The local strain limit, εlocal, is equal to 0.05 for base metal and 0.025 for weldments. Failure of this requirement is illustrated in Figure HBB-T-1344(c).
(c) In order to proceed if either of the requirements of (a) or (b) above are not satisfied, return to Step 2 and select a smaller value of the target inelastic strain, x. If it is not possible to find a value of x that does not ratchet and also satisfies the requirements of Step 4, then the loading conditions of HBB-T-1342 applied to the component configuration defined in HBB-T-1343 do not meet the requirements of HBB-T-1340.
( ) ( ) ( ) ( ) ( ) ( )2 2 2 2 2 223 2 2 2p p p p p p
p x y z xy yz zxε ε ε ε ε ε ε = + + + + + pxε
pyε
pzε
pxyε p
yzε pzxε

30
Figure HBB-T-1344 Strain Limits Pass/Fail Criteria Illustrated
HBB-T-1345 Weldments
Implementation of the strain limits for weldments defined above in HBB-T-1344 requires additional consideration.
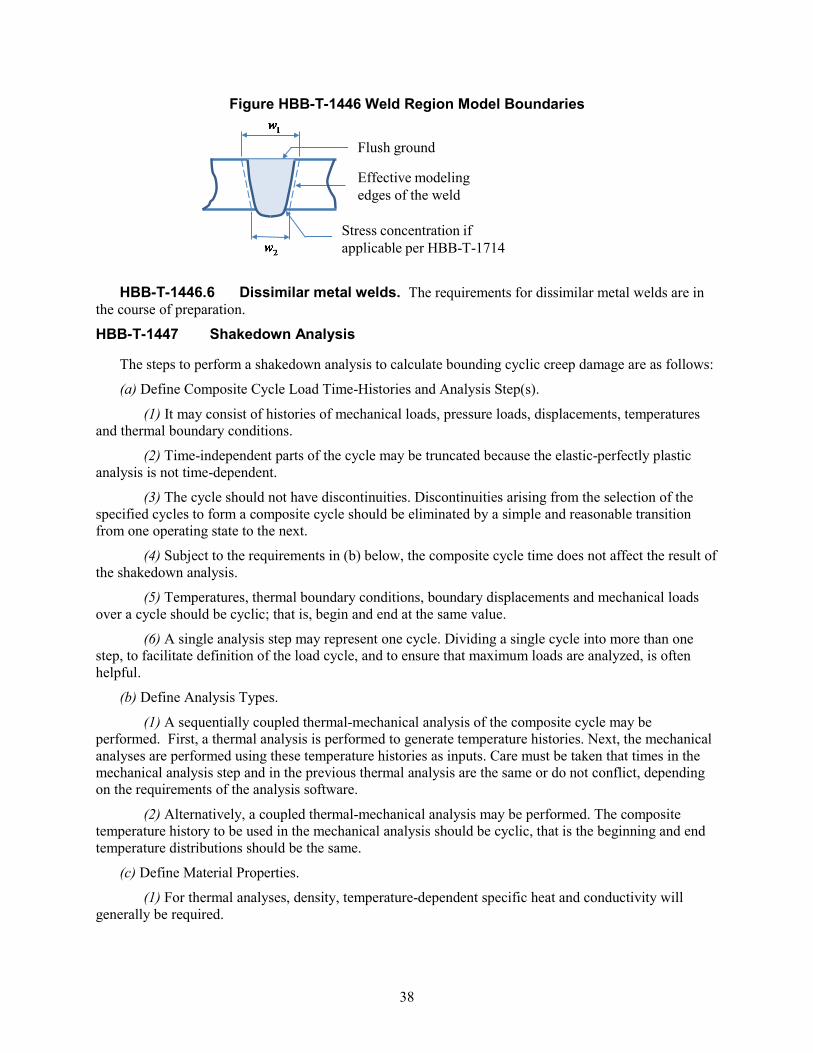
HBB-T-1345.1 Weld Region Model Boundaries. The weld shown in Figure HBB-T-1345 represents a general full-penetration butt weld in a shell. Other weld configurations are needed for construction of an elevated temperature component in accordance with Subsection HB, Subpart B. HBB-4200 refers to various NB-4000 paragraphs for weld configurations and requirements. These NB-4000 weld configurations are represented by the shaded region.
Figure HBB-T-1345 shows a full-penetration butt weld as an example. As shown, w1 and w2, as needed to define the weld region for use of this Case, are approximations consistent with the specified weld configuration and parameters. The specified weld region must include applicable stress concentrations in accordance with the requirements for analysis of geometry, HBB-T-1714.
Figure HBB-T-1345 Weld Region Model Boundaries
Pass
(a)
Fail
(b)
Fail
(c)
ave p localxε ε ε< + ≤p avex ε ε+ ≤ p localx ε ε+ >
Flush ground
Effective modelingedges of the weld
Stress concentrationif applicable per NH-T-1714
Stress concentration if applicable per HBB-T-1714
Effective modeling edges of the weld
Flush ground

31
HBB-T-1345.2. Geometry. The requirements for analysis of geometry of subparagraph HBB-T-1714 of Subsection HBB are applicable for satisfaction of the requirements of this Code Case.
HBB-T-1345.3. Physical Properties. The thermal/physical properties of weldments shall be assumed to be the same as the corresponding base metal for the base metal-weld combinations listed in Table HBB-I-14.10F-1.
HBB-T-1345.4 Dissimilar Metal Welds. Requirements for dissimilar metal welds are in the course of preparation.
HBB-T-1346 Ratcheting Analysis
The steps to perform a ratcheting analysis to demonstrate compliance with strain limits are as follows:
(a) Define Composite Cycle Load Time-Histories and Analysis Step(s).
(1) It may consist of histories of mechanical loads, pressure loads, displacements, temperatures and thermal boundary conditions.
(2) Time-independent parts of the cycle may be truncated because the elastic-perfectly plastic analysis is not time-dependent.
(3) The cycle should not have discontinuities. Discontinuities arising from the selection of the specified cycles to form a composite cycle should be eliminated by a simple and reasonable transition from one operating state to the next.
(4) Subject to the requirements in (b) below, the composite cycle time does not affect the result of the ratcheting analysis.
(5) Temperatures, thermal boundary conditions, boundary displacements and mechanical loads over a cycle should be cyclic; that is, begin and end at the same value.
(6) A single analysis step may represent one cycle. Dividing a single cycle into more than one step to facilitate definition of the load cycle, and to ensure that maximum loads are analyzed, is often helpful.
(b) Define Analysis Types.
(1) A sequentially coupled thermal-mechanical analysis of the composite cycle may be performed. First, a thermal analysis is performed to generate temperature histories. Next, the mechanical analyses are performed using these temperature histories as inputs. Care must be taken that times in the mechanical analysis step and in the previous thermal analysis are the same or do not conflict, depending on the requirements of the analysis software.
(2) Alternatively, a coupled thermal-mechanical analysis may be performed. The composite temperature history to be used in the mechanical analysis should be cyclic, that is the beginning and end temperature distributions should be the same.
(c) Define Material Properties.
(1) For the thermal analyses, density, and temperature-dependent specific heat and conductivity will generally be required.
(2) For the mechanical analyses, the temperature-dependent properties required are elastic modulus, Poisson’s ratio and mean expansion coefficient. Density may also be required.
(3) In addition, the mechanical analyses temperature-dependent yield stress will need to be adjusted based on the selected pseudo yield stress, SxT, defined in HBB-T-1344.2.
(d) Perform Analyses.

32
(1) Perform an elastic-perfectly plastic cyclic mechanical and thermal stress analysis using the temperature-dependent pseudo yield stress defined above. Enough cycles are required to demonstrate ratcheting or the absence of ratcheting.
(2) Care must be taken to ensure that the analysis deals with all the changes within a cycle. Elastic-plastic analysis routines increase increment size where possible, and may miss a detail in the loading. A conservative limit to maximum increment size can address this problem, as can division of the cycle into more than one step, as discussed in (a)(6) above.
(e) Detect Ratcheting.
(1) Ratcheting is defined as repeated non-cyclic deflections, that is between the beginning and end of a cycle, a repeated finite displacement change occurs somewhere in the structure.
(2) Detecting ratcheting is most easily done by plotting nodal deflections over time. Cyclic (repeated) behavior indicates non-ratcheting. History plots of equivalent plastic strains will also identify ratcheting.
HBB-T-1400 CREEP‐FATIGUE EVALUATION
HBB-T-1410 GENERAL REQUIREMENTS
HBB-T-1411 Damage Equation
The following Alloy 617 data are added to Table HBB-T-1411-1.
Table HBB-T-1411-1 Kꞌ
Material Elastic Analysis Inelastic Analysis Alloy 617 0.9 0.67
HBB-T-1420 LIMITS USING INELASTIC ANALYSIS
(b) The fatigue damage term of Equation HBB-T-1411(10) is evaluated by entering a design fatigue curve at the strain range ϵt . The strain range ϵt is defined as ϵt = Δϵmax ; where Δϵmax is the value calculated in either HBB-T-1413 or HBB-T-1414. The appropriate design fatigue curve for Alloy 617 is Figure HBB-T-1420-1F and corresponds to the maximum metal temperature experienced during the cycle.
(c) The total damage, D, shall not exceed the creep-fatigue damage envelope in Figure HBB-T-1420-2 of this Code Case.

33
Figure HBB-T-1420-1F Design Fatigue Strain Range, ϵt , for Alloy 617
Strain Range, εt, in./in. at Temperature
Number of Cycles, Nd [Note (1)]
U.S. Customary Units
800°F 1,300°F 1,600°F 1,750°F 1.E+01 0.05007 0.01663 0.01445 0.01382 2.E+01 0.03621 0.01130 0.00934 0.00876 4.E+01 0.02681 0.00804 0.00628 0.00574 1.E+02 0.01846 0.00552 0.00400 0.00352 2.E+02 0.01421 0.00439 0.00302 0.00258 4.E+02 0.01123 0.00363 0.00240 0.00199 1.E+03 0.00842 0.00296 0.00190 0.00154 2.E+03 0.00686 0.00260 0.00166 0.00132 4.E+03 0.00570 0.00232 0.00148 0.00118 1.E+04 0.00453 0.00203 0.00131 0.00104 2.E+04 0.00396 0.00185 0.00121 0.00096 4.E+04 0.00340 0.00169 0.00112 0.00089 1.E+05 0.00289 0.00150 0.00103 0.00082 2.E+05 0.00254 0.00138 0.00096 0.00077 4.E+05 0.00194 0.00127 0.00090 0.00073 1.E+06 0.00146 0.00113 0.00083 0.00068
Strain Range, εt, m/m at Temperature
Number of Cycles, Nd [Note (1)]
SI Units
425°C 704°C 871°C 950°C 1.E+01 0.05007 0.01663 0.01445 0.01382 2.E+01 0.03621 0.01130 0.00934 0.00876 4.E+01 0.02681 0.00804 0.00628 0.00574 1.E+02 0.01846 0.00552 0.00400 0.00352 2.E+02 0.01421 0.00439 0.00302 0.00258 4.E+02 0.01123 0.00363 0.00240 0.00199 1.E+03 0.00842 0.00296 0.00190 0.00154 2.E+03 0.00686 0.00260 0.00166 0.00132 4.E+03 0.00570 0.00232 0.00148 0.00118 1.E+04 0.00453 0.00203 0.00131 0.00104 2.E+04 0.00396 0.00185 0.00121 0.00096 4.E+04 0.00340 0.00169 0.00112 0.00089
1.E-04
1.E-03
1.E-02
1.E-01
1.E+01 1.E+02 1.E+03 1.E+04 1.E+05 1.E+06
Stra
in R
ange
, ϵt i
n./i
n. (m
/m)
Number of Allowable Cycles, Nd
Cyclic Strain Rate: 4 × 10⁻³ in./in./sec (m/m/s)
800°F (425°C)
1300°F (704°C) 1600°F (871°C)
1750°F (954°C)

34
1.E+05 0.00289 0.00150 0.00103 0.00082 2.E+05 0.00254 0.00138 0.00096 0.00077 4.E+05 0.00194 0.00127 0.00090 0.00073 1.E+06 0.00146 0.00113 0.00083 0.00068
NOTE: (1) Cyclic strain rate: 4 × 10⁻³ in./in./sec (1 × 10⁻³ m/m/s)
Figure HBB-T-1420-2 Creep-Fatigue Damage Envelope
HBB-T-1430 LIMITS USING ELASTIC ANALYSIS
HBB-T-1431 General Requirements
(e) Paragraph HBB-T-1431 is not applicable to Alloy 617 above 1200°F (650°C).
HBB-T-1435 Alternate Creep-Fatigue Evaluation
(a) The reference to Section III Appendices, Mandatory Appendix I is replaced by Figure HBB-T-1420-1F, where Sa is one-half the product of ϵt and Young’s Modulus, E, at the metal temperature of the cycle for the point under consideration.

35
HBB-T-1440 LIMITS USING ELASTIC-PERFECTLY PLASTIC ANALYSIS
HBB-T-1441 General Requirements
Fatigue and cyclic creep damage may be evaluated using elastic-perfectly plastic material models instead of the procedures of HBB-T-1420, HBB-T-1430 and HBB-T-1715, when performed in accordance with the requirements of this Subsubarticle.
The design methodology employed for evaluation of creep damage is based on elastic shakedown analyses using an elastic-perfectly plastic material model, small strain theory and a pseudo yield stress selected to bound creep damage. In this Subsubarticle, “shakedown” refers to the achievement of cyclic elastic behavior throughout the part, based on real or pseudo yield stress. In this Code Case, the term “pseudo yield stress” refers to a temperature-dependent minimum stress-to-rupture value based on a selected trial time duration, not to exceed the yield strength of the material at temperature and is explicitly defined in HBB-T-1444.2. Guidance on shakedown analysis is provided in HBB-T-1447.
HBB-T-1441.1. Allowable Damage Accumulation. The combination of Levels A, B, and C Service Loadings shall be evaluated for accumulated creep and fatigue damage, including hold time and strain rate effects. For a design to be acceptable, the creep and fatigue damage at each point in the component shall satisfy the following relation:
(2) where
D = total creep-fatigue damage as limited by Figure HBB-T-1420-2 of this code case
Dc = creep damage as determined in paragraph HBB-T-1444, below
Df = fatigue damage as determined in paragraph HBB-T-1445, below
HBB-T-1442 Load Definition
Define all applicable loads and load cases per HBB-3113.2 Service Loadings.
HBB-T-1442.1 Composite Cycle Definition. For the purpose of performing an elastic-perfectly plastic shakedown analysis, an overall cycle must be defined that includes all relevant features from the individual Level A, B and C Service Loadings identified in the Design Specification. Relevant features include, as a minimum, the time-dependent sequence of thermal, mechanical and pressure loading, including starting and ending conditions. Such an overall cycle is defined herein as a composite cycle subject to the following requirements.
(a) An individual cycle as defined in the Design Specifications cannot be further subdivided into individual cycles to satisfy these requirements.
(b) Except as described in (c) below, a single cycle from each Level A, B and C Service Loading cycle type shall be included in the composite cycle for evaluation of creep-fatigue.
(c) Level C Service Loadings may be combined with the applicable Level A and B Service Loadings to define a composite cycle(s) to be evaluated separately from the composite cycle defined in (b) above. Multiple composite cycles that include Level C Service Loadings may be defined for separate evaluation. The total number of Level C Service Loading cycles shall not exceed 25.
c fD D D+ ≤

36
HBB-T-1443 Numerical Model
Develop a numerical model of the component, including all relevant geometry characteristics. The model used for the analysis shall be selected to accurately represent the component geometry, boundary conditions, and applied loads. The model must also be accurate for small details, such as small holes, fillets, corner radii, and other stress risers. The local temperature history shall be determined from a thermal transient analysis based on the thermal boundary conditions determined from the loading conditions defined in paragraph HBB-T-1442.
HBB-T-1444 Calculation of Creep Damage
Perform a shakedown analysis for each of the composite cyclic histories defined in HBB-T-1442.1. Each of these cyclic histories must be shown to shakedown based on the pseudo yield stress, STdꞌ, as defined in HBB-T-1444.2. Additional requirements for welds are found in HBB-T-1446.
HBB-T-1444.1 Step 1. Define tdesign as the total time duration of elevated temperature service for all Level A, B, and C Service Loadings when the temperature is above 800°F (425°C).
HBB-T-1444.2 Step 2. Select a trial time duration, Tdꞌ, in order to define a pseudo yield stress, STdꞌ, at each location, using the temperature determined from the transient thermal analysis. This pseudo yield stress is equal to the lesser of the quantities defined below in (a) and (b) below.
(a) The yield strength Sy given in Table HBB-I-14.5 of this Code Case;
(b) Sr, where Sr is the minimum stress to rupture in time, Tdꞌ, from Figure HBB-I-14.6G multiplied by the factor, Kꞌ, from Table HBB-T-1411-1 of this Code Case, using the tabulated values for Elastic Analysis.
HBB-T-1444.3 Step 3. Perform a cyclic elastic-perfectly plastic analysis for each composite cycle defined in HBB-T-1442 above with temperature-dependent pseudo yield stress, STdꞌ. The assessment temperature shall be taken as the local instantaneous temperature at every location in the numerical model of the component. If shakedown occurs, that is, cycles with eventual elastic behavior everywhere, proceed to HBB-T-1444.4.
HBB-T-1444.4 Step 4. The maximum creep damage over the structure for the composite cycle under consideration is:
(3)
The above value of Dc is used to evaluate total damage in Equation (2). If the pseudo yield stress in HBB-T-1444.2 Step 2 is governed by the yield strength as defined in HBB-T-1444.2(a), then the trial time duration for use in Equation (2) is given by the time at which the minimum stress to rupture is equal to the yield strength; Sr = Sy. Linear extrapolation of Sr values corresponding to the two longest tabulated times can be used to obtained the trial time duration, when necessary.
(a) Steps 2, 3 and 4 may be repeated to revise the value of Dc by selecting alternative values of the trial time duration, Tdꞌ. Longer values of Tdꞌ will reduce the calculated creep damage. However, these longer values will lead to lower values of the pseudo yield stress, STdꞌ, which will make shakedown more difficult to achieve. If it is not possible to achieve shakedown, then the loading conditions of HBB-T-1442 applied to the component configuration defined in HBB-T-1443 do not meet the requirements of HBB-T-1440.
HBB-T-1445 Calculation of Fatigue Damage
The fatigue damage summation, Df, in Equation (2) is determined in accordance with Steps 1 through 3 below. Additional requirements for welds are found in HBB-T-1446.
designc
d
tD
T=
′

37
HBB-T-1445.1 Step 1. Determine all of the total (elastic plus plastic) strain components for the composite cycle at each point of interest from the shakedown analysis performed in Step 3 of HBB-T-1444.3 above.
HBB-T-1445.2 Step 2. Calculate the equivalent strain range in accordance with HBB-T-1413, or HBB-T-1414 when applicable, with Poisson’s ratio ν* = 0.3.
HBB-T-1445.3 Step 3. Determine the fatigue damage for each composite cycle from the expression:
(4)
where
nj = number of applied repetitions of cycle type, j
(Nd)j = number of design allowable cycles for cycle type, j, determined from Figure HBB-T-1420-1F, corresponding to the maximum metal temperature occurring during the cycle.
The value of Df used to evaluate total damage in Equation (2) is the maximum value at any location in the numerical model.
HBB-T-1446 Weldments
Implementation of the evaluation of creep-fatigue damage in HBB-T-1444 and HBB-T-1445 above for weldments requires additional consideration.
HBB-T-1446.1 Pseudo Yield Stress. In the weld region, the pseudo yield stress value, STdꞌ, defined by Tdꞌ in HBB-1444.2 is reduced further by multiplying the value of Sr for the base metal by the applicable weld strength reduction factor from Table HBB-I-14.10F-1.
HBB-T-1446.2 Allowable Cycles. The number of allowable cycles, (Nd)j, in the weld region is one-half the number of allowable cycles from Figure HBB-T-1420-1F for base metal.
HBB-T-1446.3 Geometry. The requirements for analysis of geometry of HBB-T-1714, are applicable for satisfaction of the requirements of this Code Case.
HBB-T-1446.4 Physical Properties. The thermal/physical properties of weldments shall be assumed to be the same as the corresponding base metal for the base metal-weld combinations listed in Table HBB-I-14.10F-1.
HBB-T-1446.5 Weld Region Model Boundaries. The weld shown in Figure HBB-T-1446 represents a general full-penetration butt weld in a shell. Other weld configurations are needed for construction of an elevated temperature component in accordance with Subsection HB, Subpart B. HBB-4200 refers to various NB-4000 paragraphs for weld configurations and requirements. These NB-4000 weld configurations are represented by the shaded region.
Figure HBB-T-1446 shows a full-penetration butt weld as an example. As shown, w1 and w2, as needed to define the weld region for use of this Code Case, are approximations consistent with the specified weld configuration and parameters. The specified weld region must include applicable stress concentrations in accordance with the requirements for analysis of geometry, HBB-T-1714.
( )
jf
j d j
nD
N= ∑
38
Figure HBB-T-1446 Weld Region Model Boundaries
HBB-T-1446.6 Dissimilar metal welds. The requirements for dissimilar metal welds are in the course of preparation.
HBB-T-1447 Shakedown Analysis
The steps to perform a shakedown analysis to calculate bounding cyclic creep damage are as follows:
(a) Define Composite Cycle Load Time-Histories and Analysis Step(s).
(1) It may consist of histories of mechanical loads, pressure loads, displacements, temperatures and thermal boundary conditions.
(2) Time-independent parts of the cycle may be truncated because the elastic-perfectly plastic analysis is not time-dependent.
(3) The cycle should not have discontinuities. Discontinuities arising from the selection of the specified cycles to form a composite cycle should be eliminated by a simple and reasonable transition from one operating state to the next.
(4) Subject to the requirements in (b) below, the composite cycle time does not affect the result of the shakedown analysis.
(5) Temperatures, thermal boundary conditions, boundary displacements and mechanical loads over a cycle should be cyclic; that is, begin and end at the same value.
(6) A single analysis step may represent one cycle. Dividing a single cycle into more than one step, to facilitate definition of the load cycle, and to ensure that maximum loads are analyzed, is often helpful.
(b) Define Analysis Types.
(1) A sequentially coupled thermal-mechanical analysis of the composite cycle may be performed. First, a thermal analysis is performed to generate temperature histories. Next, the mechanical analyses are performed using these temperature histories as inputs. Care must be taken that times in the mechanical analysis step and in the previous thermal analysis are the same or do not conflict, depending on the requirements of the analysis software.
(2) Alternatively, a coupled thermal-mechanical analysis may be performed. The composite temperature history to be used in the mechanical analysis should be cyclic, that is the beginning and end temperature distributions should be the same.
(c) Define Material Properties.
(1) For thermal analyses, density, temperature-dependent specific heat and conductivity will generally be required.
Flush ground
Effective modelingedges of the weld
Stress concentrationif applicable per NH-T-1714
Stress concentration if applicable per HBB-T-1714
Effective modeling edges of the weld
Flush ground

39
(2) For the mechanical analyses, the temperature-dependent properties required are elastic modulus, Poisson’s ratio and mean expansion coefficient. Density may also be required.
(d) Perform Analyses.
(1) Perform an elastic-perfectly plastic cyclic mechanical and thermal stress analysis using the temperature-dependent pseudo yield property defined above. Enough cycles are required to demonstrate shakedown or otherwise.
(2) Care must be taken to ensure that the analysis deals with all the changes within a cycle. Elastic-plastic analysis routines increase increment size where possible, and may miss a detail in the loading. A conservative limit to maximum increment size can address this problem, as can division of the cycle into more than one step, as discussed in (a)(6) above.
(e) Shakedown.
(1) Shakedown is defined in this Code Case as eventual elastic behavior everywhere in the model. Failure to achieve shakedown may be identified by plotting history plots of equivalent plastic strain.

40
HBB-T-1800 ISOCHRONOUS STRESS‐STRAIN RELATIONS
HBB-T-1810 OBJECTIVE
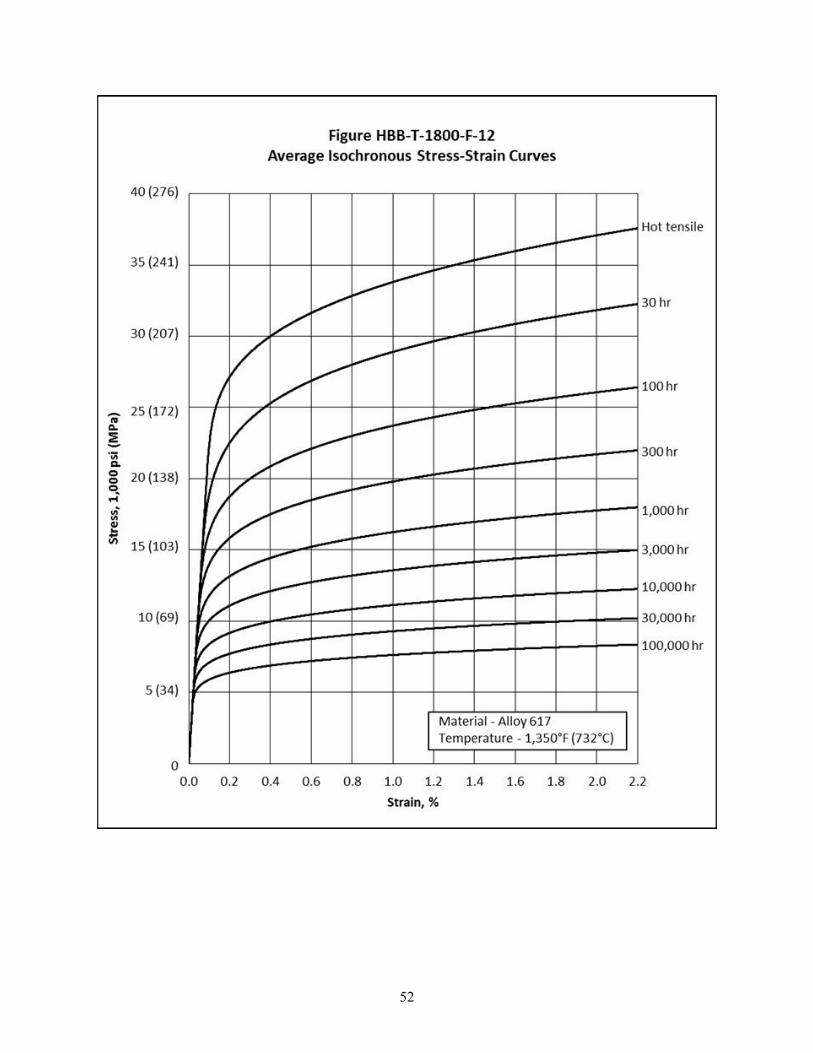
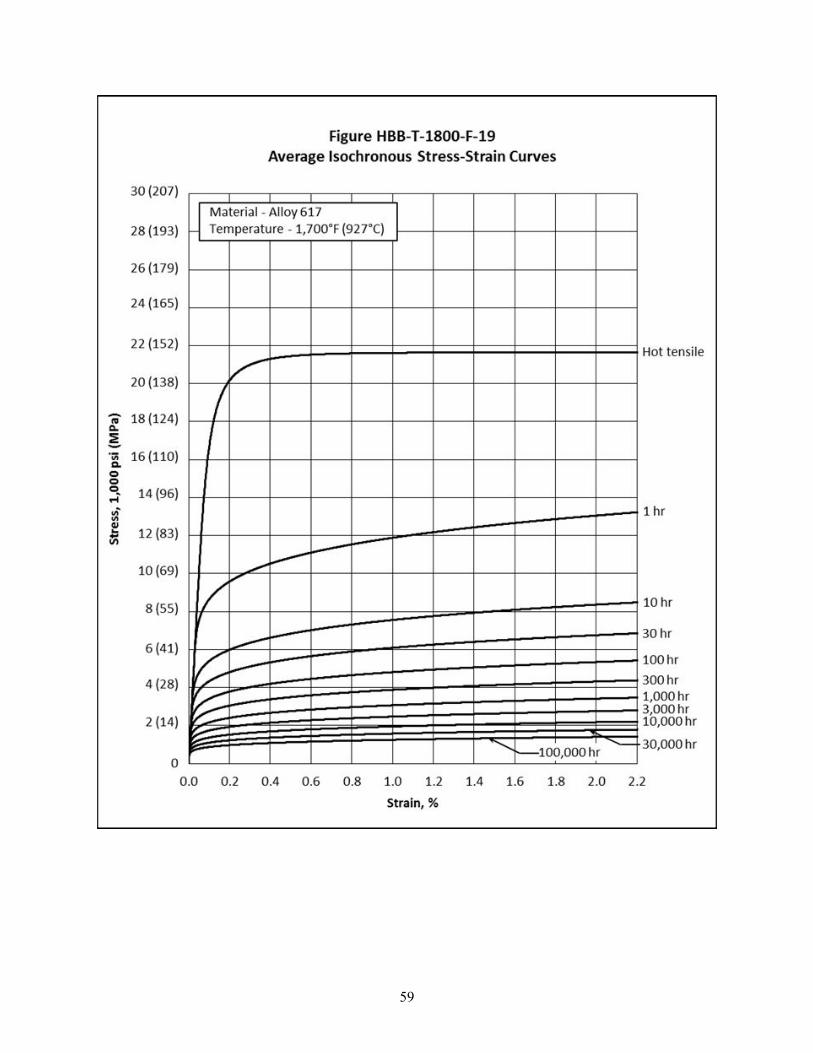
Figures HBB-T-1800-F-1 through HBB-T-1800-F-20 of this Code Case provide graphs giving isochronous stress-strain curves, each graph being for Alloy 617 at a specific temperature. The graphs are intended to provide the designer with information regarding the total strain caused by stress under elevated temperature conditions, assuming average material properties.
HBB-T-1820 MATERIALS AND TEMPERATURE LIMITS
Data for Alloy 617 is added to Table HBB-T-1820-1 as indicated below.
Table HBB-T-1820-1 Material Maximum
Temp., °F (°C) Temperature
Increment, °F (°C) F Alloy 617 1,750 (950) 50 (28)

41


43

44

45

46

47

48

49

50

51
52

53

54

55

56

57

58
59

60

61
APPENDIX 2
BACKGROUND FOR DRAFT CODE CASE: USE OF ALLOY 617 (UNS N06617) FOR CLASS A ELEVATED
TEMPERATURE SERVICE CONSTRUCTION

62

63
APPENDIX 2
BACKGROUND FOR DRAFT CODE CASE: USE OF ALLOY 617 (UNS N06617) FOR CLASS A ELEVATED
TEMPERATURE SERVICE CONSTRUCTION INTRODUCTION
The ASME Task Group on Alloy 617 Qualification is requesting an ASME Boiler and Pressure Vessel, Section III, Division 5 Code Case for Alloy 617 (UNS N06617) 52Ni-22Cr-13Co-9Mo to allow construction of components conforming to the requirements of Section III, Division 5, Subsection HB, Subpart B “Elevated Temperature Service” for service when Service Loading temperatures exceed the temperature limits established in Subsection HA, Subpart A.
Labeling in this document follows that of corresponding labeled paragraphs of the Alloy 617 Code Case. Labeling also follows that of Section III, Division 5, Subsection HB, Subpart B “Elevated Temperature Service” except where additional or new requirements have resulted in new numbered paragraphs of the Code Case. Values for mechanical and physical properties have been determined for Alloy 617 and are detailed in this technical justification, following the numbering of Section II, Part D.
PHYSICAL PROPERTY TABLES
TE — THERMAL EXPANSION
Thermal expansion of four heats of Alloy 617 was measured using a Netzsch dilatometer over the temperature range 20 to 1000°C.1 Measured Δl/l0 values are shown in Figure 1. It can be seen in the figure that the values are similar for the four materials (three Alloy 617 plates and one sample from a GTAW weld made with Alloy 617 wire), and the data are well represented by a third-order polynomial fit. The polynomial expression for Δl/l0 in SI units was used to calculate the corresponding Δl/l0 values in customary units.
The equations for thermal expansion in customary and SI units are: ∆𝑙𝑙𝑙𝑙0
= 3.97430782830011𝐸𝐸 − 10 𝑇𝑇3 + 7.77368917626926𝐸𝐸 − 07 𝑇𝑇2 + 0.0082967491323776 𝑇𝑇 + −0.567898459832691 in./(100 ft) and ∆𝑙𝑙𝑙𝑙0
= 1.93151𝐸𝐸 − 09𝑇𝑇3 + 2.20191𝐸𝐸 − 06 𝑇𝑇2 + 0.012521582𝑇𝑇 + −0.251327866 mm/m

64
Figure 1. Change in length/initial length (mm/m) for four heats of Alloy 617 modeled with a third-order polynomial fit.
Comparable data are not available in the literature for Alloy 617 for comparison. There are values
currently in ASME Code Section II, Part D Table TE-4 for similar nickel-based solid-solution alloys. In Figure 2 the measured Δl/l0 values1 are compared to values from Table TE-4 for Haynes 230 and Hastelloy X. It can be seen that the values are comparable.
Figure 2. Alloy 617 Δl/l0 behavior calculated from the polynomial fit to experimental data compared to Code values for similar Ni-based solid-solution alloys.
Mean Coefficient of Thermal Expansion (CTE) values from 20°C (70°F) were calculated from the
Δl/l0 polynomial fit. There are two older sets of comparable mean CTE values: vendor datasheets that appear to have been determined by Huntington Alloys (now Special Metals Corporation (SMC))2 during development of the alloy, and the draft ASME Alloy 617 Code Case submitted in 1992, although the origin of the data in that draft Code Case is not clear. A comparison of measured values1 and historical values is shown in Figure 3. For this comparison, only values for customary units are shown, since it is

65
believed that the original experiments were carried out using customary units and the method for subsequent conversion to SI units is not specified.
Figure 3. Mean CTE (linear expansion from 70°F to temperature of interest) for experiments compared to values from vendor datasheet and from 1992 draft Alloy 617 Code Case.
A comparison to ASME Code Section II, Part D Table TE-4 values for the nickel-based solid
solutions Haynes 230 and Hastelloy X is shown in Figure 4. There is reasonable agreement between these alloys and Alloy 617.

66
Figure 4. Mean CTE (linear expansion from 20°C to temperature of interest) for current experiments compared to Code values for two similar Ni-based solid-solution alloys from Section II, Part D Table TE-4.
The instantaneous CTE was calculated using the derivative of the polynomial fit to the Δl/l0 data from
20–1000°C (70–1800°F). Independent measurements for this alloy have not been found in the literature. Figure 5 shows instantaneous CTE for experiments using the fit to data shown in Figure 1compared to ASME Code Section II, Part D Table TE-4 values for two similar Ni-based solid-solution alloys in SI units. As was shown above for mean CTE values, the agreement is quite good.
Figure 5. Instantaneous CTE for current experiments using fit to data shown in Figure 1 compared to Code values for two similar Ni-based solid-solution alloys.

67
TCD — THERMAL CONDUCTIVITY AND THERMAL DIFFUSIVITY
Thermal diffusivity was measured for the same four Alloy 617 heats noted in Section TE, from 20 to 1000°C using a Netzsch laser flash system.1 The experimental values are shown in Figure 6. A two-piece third-order polynomial fit is used to describe the experimental data due to the deviation from monotonic behavior in the region of 750°C. This local maximum appears to be the result of Ni-Cr clustering.1 The polynomial fit to the diffusivity data in SI units was used to calculate the values in customary units. The equations describing the thermal diffusivity in customary and SI units are given by:
𝐷𝐷𝐷𝐷𝐷𝐷𝐷𝐷𝐷𝐷𝐷𝐷𝐷𝐷𝐷𝐷𝐷𝐷𝐷𝐷𝐷𝐷 ∗ 10^6
= �1.58𝐸𝐸 − 11𝑇𝑇3 + −3.28872𝐸𝐸 − 08 𝑇𝑇2 + 8.4945𝐸𝐸 − 05𝑇𝑇 + 0.10597 𝑇𝑇 ≤ 1292°F
−3.16947𝐸𝐸 − 10𝑇𝑇3 + 1.61693𝐸𝐸 − 06𝑇𝑇2 + −0.002685705 𝑇𝑇 + 1.649358103 𝑇𝑇 > 1292°F
Diffusivity units are ft2/hr
𝐷𝐷𝐷𝐷𝐷𝐷𝐷𝐷𝐷𝐷𝐷𝐷𝐷𝐷𝐷𝐷𝐷𝐷𝐷𝐷𝐷𝐷 ∗ 10^6
= �2.38191𝐸𝐸 − 09𝑇𝑇3 +−2.62275𝐸𝐸 − 06𝑇𝑇2 + 0.003850314𝑇𝑇 + 2.804066484 𝑇𝑇 ≤ 700°C
−4.77014𝐸𝐸 − 08𝑇𝑇3 + 0.000132652𝑇𝑇2 + −0.119993352𝑇𝑇 + 40.38858886 𝑇𝑇 > 700°C
Diffusivity units are m2/s
Figure 6. Thermal diffusivity for four heats of Alloy 617 showing two-piece cubic fit.
The heat capacity of the four Alloy 617 heats was measured using a Netzsch calorimeter, and the
temperature corrected density can be calculated from the ASME Code Section II, Part D Table PRD density and the thermal expansion data shown above. The thermal conductivity is the product of the diffusivity, temperature corrected density, and heat capacity. Like thermal diffusivity, fitting the thermal conductivity required a three piece second-order polynomial. Values calculated for Alloy 617 by this means are shown in Figure 7 in SI units along with data from the SMC vendor datasheet2 for comparison. The vendor datasheet notes thermal conductivity is calculated from electrical resistivity. It is not clear if the difference in calculation method is the sole reason why the vendor data do not include the perturbation from monotonic behavior in the region of 750°C. The equations for thermal conductivity in customary and SI units are:
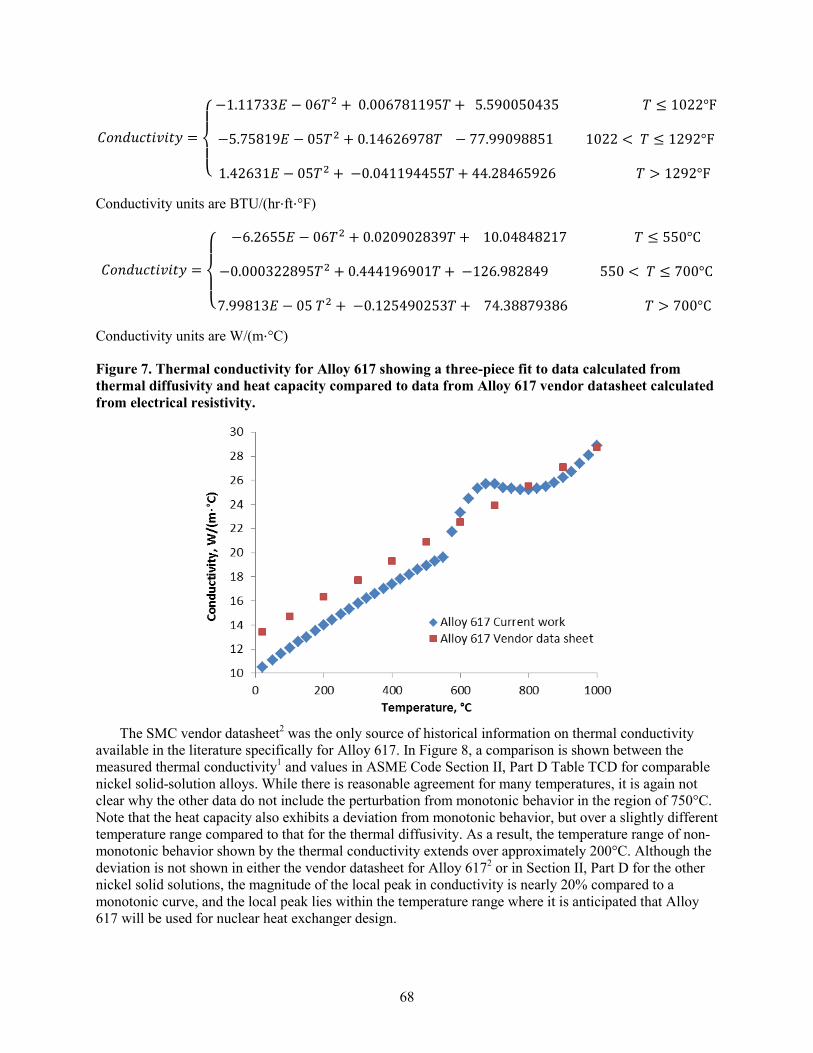
68
𝐶𝐶𝐶𝐶𝐶𝐶𝐶𝐶𝐷𝐷𝐶𝐶𝐷𝐷𝐷𝐷𝐷𝐷𝐷𝐷𝐷𝐷𝐷𝐷 =
⎩⎪⎨
⎪⎧ −1.11733𝐸𝐸 − 06𝑇𝑇2 + 0.006781195𝑇𝑇 + 5.590050435 𝑇𝑇 ≤ 1022°F
−5.75819𝐸𝐸 − 05𝑇𝑇2 + 0.14626978𝑇𝑇 − 77.99098851 1022 < 𝑇𝑇 ≤ 1292°F
1.42631𝐸𝐸 − 05𝑇𝑇2 + −0.041194455𝑇𝑇 + 44.28465926 𝑇𝑇 > 1292°F
Conductivity units are BTU/(hr⋅ft⋅°F)
𝐶𝐶𝐶𝐶𝐶𝐶𝐶𝐶𝐷𝐷𝐶𝐶𝐷𝐷𝐷𝐷𝐷𝐷𝐷𝐷𝐷𝐷𝐷𝐷 =
⎩⎪⎨
⎪⎧ −6.2655𝐸𝐸 − 06𝑇𝑇2 + 0.020902839𝑇𝑇 + 10.04848217 𝑇𝑇 ≤ 550°C
−0.000322895𝑇𝑇2 + 0.444196901𝑇𝑇 + −126.982849 550 < 𝑇𝑇 ≤ 700°C
7.99813𝐸𝐸 − 05 𝑇𝑇2 + −0.125490253𝑇𝑇 + 74.38879386 𝑇𝑇 > 700°C
Conductivity units are W/(m⋅°C)
Figure 7. Thermal conductivity for Alloy 617 showing a three-piece fit to data calculated from thermal diffusivity and heat capacity compared to data from Alloy 617 vendor datasheet calculated from electrical resistivity.
The SMC vendor datasheet2 was the only source of historical information on thermal conductivity
available in the literature specifically for Alloy 617. In Figure 8, a comparison is shown between the measured thermal conductivity1 and values in ASME Code Section II, Part D Table TCD for comparable nickel solid-solution alloys. While there is reasonable agreement for many temperatures, it is again not clear why the other data do not include the perturbation from monotonic behavior in the region of 750°C. Note that the heat capacity also exhibits a deviation from monotonic behavior, but over a slightly different temperature range compared to that for the thermal diffusivity. As a result, the temperature range of non-monotonic behavior shown by the thermal conductivity extends over approximately 200°C. Although the deviation is not shown in either the vendor datasheet for Alloy 6172 or in Section II, Part D for the other nickel solid solutions, the magnitude of the local peak in conductivity is nearly 20% compared to a monotonic curve, and the local peak lies within the temperature range where it is anticipated that Alloy 617 will be used for nuclear heat exchanger design.

69
Figure 8. Thermal conductivity of Alloy 617 compared to values from Section II, Part D, Table TCD for Haynes 230 and Hastelloy X.
TM — MODULUS OF ELASTICITY
Extension of Elastic Modulus Values from Section II, Part D to Higher Temperature Elastic modulus values for Alloy 617 are currently included in Section II, Part D of the ASME Code
(Table TM-4 and TM-4M) for temperatures up to 1500°F (850°C). The temperature range for elastic modulus values must be increased to 1800°F (1000°C) to allow use of this alloy in Section III, Division 5 for design in high temperature gas-cooled nuclear reactors. The basis for increasing the temperature range of elastic modulus values is twofold. The elastic modulus values currently in Table TM-4 were extrapolated to 1000°C using a third-order polynomial fit to the tabulated values. The results of recent experiments3 on two heats of Alloy 617 carried out to determine the dynamic elastic modulus as a function of temperature using the resonant frequency in the flexural mode of vibration were used to validate this extrapolation. Measurements were carried out as a function of temperature up to 1000°C on one heat in plate product form and one heat in rod product form.
The experimental results and extrapolation using the third-order polynomial fit are shown in Figure 9. Note that there are some gaps in the experimental data due to higher order modes of flexural resonant frequency observed at some temperatures; however, the data are nearly continuous in the higher temperature range that is of most interest in supporting the extrapolation. It can be seen from Figure 9 that the experimental results and the extrapolation of Table TM-4 values are in close agreement.

70
Figure 9. Elastic modulus as a function of temperature (°C) comparing resonant frequency experiments, Code values, and a third-order polynomial fit of the Code values.
The three orange points in the figure represent the proposed numerical values of elastic modulus for
temperatures of 900, 950 and 1000°C, calculated from the polynomial fit. Elastic modulus values in customary Fahrenheit temperature units have also been calculated from this third-order polynomial fit. Proposed values are shown in Table TM of this Code Case for the entire temperature range from ambient to 1800°F and 1000°C. Note that the values used up to 1500°C (850°C) are unchanged from current ASME Code Section II, Part D Table TM-4 (TM-4M) values.

71
ARTICLE HBB-2000 MATERIAL
HBB-2100
HBB-2160 DETERIORATION OF MATERIAL IN SERVICE
The language with respect to the currently allowed Code materials has been carried over into this section of the Code Case. Note that the proposed aging factor for Alloy 617 is 1.0.

72
ARTICLE HBB-3000 DESIGN
HBB-3200 DESIGN BY ANALYSIS
HBB-3220 DESIGN RULES AND LIMITS FOR LOAD-CONTROLLED STRESSES IN STRUCTURES OTHER THAN BOLTS
HBB-3225 Level D Service Limits
HBB-3225-1 Tensile Strength Values Su
The New Material Data Analysis (NDMA) Excel spreadsheet for time-independent material properties4 was used to analyze tensile data for T > 525°C. The elevated temperature data are a compilation from older sources (Huntington, ORNL) and newer sources (INL, CEA). At T ≤ 525°C the current ASME Code values from Section II, Part D, Table U were used as input. A fifth-order polynomial was fit to the combination of Code values for T ≤ 525°C and tensile data for T > 525°C.
Tensile strength values from the curve fit are only used above 525°C.
Tensile strength values (Su) from Section II, Part D, Table U for Alloy 617 have been used up to 1000°F (525°C), rather than the curve fit.
Proposed values are shown in Figure 10.

73
Figure 10. Su for Alloy 617 in customary and SI units.

74
HBB-3225-2 Tensile and Yield Strength Reduction Factor Due to Long Time Prior Elevated Temperature Service
ASME Code Section III, Division 5, Subsection HB, Subpart B Table HBB-3225-2 lists tensile and yield strength factors due to long time prior elevated temperature service. Although “long time” is not defined, a reduction factor is required for service at and above a given temperature for the three austenitic materials permitted in Subsection HB, Subpart B.
Room temperature tensile properties for alloy 617 aged at temperatures up to 800°C show that the yield and ultimate tensile strengths actually increase slightly after aging in the range of 100 to 10,000 hours. Data from Ren and Swindeman5 for 593, 649, 704, and 760°C are shown in. Figure 11 These data are confirmed by recent INL data3 for plate aged at 650 and 750°C for up to 32,000 hours, and at 800°C for 100 and 1000 hours (also plotted in Figure 11. All data show a slight increase in yield and ultimate tensile strength upon aging.
Figure 11. Room temperature tensile strength as a function of aging time for aging temperatures up to 800°C.
Tensile properties for Alloy 617 aged at a range of temperatures up to 871°C for times up to 20,000
hours are shown in Figure 12 (Huntington6 and ORNL7 data, reproduced from Ren and Swindeman5). The peak associated with aging at intermediate temperatures is evident in the figure. For aging at 871°C there may be a small decrease in yield and tensile properties.

75
Figure 12. Room temperature tensile strength as a function of aging temperature for aging times ≥10,000 hours.
Figure 13. Room temperature tensile properties as a function of aging temperature after aging for 1000 hours.
Above the 871°C temperature where long time data are available, room temperature tensile properties after aging for 1000 hours are presented in Figure 13. Data from the current Alloy 617 research program,3 as well as from the literature,5,6,7 are included. Tensile properties were also measured after aging for 100 hours.3 For both aging times, the ratio of aged to solution annealed properties is approximately 1. The constant value up to 1000°C and the T-T-T diagram for this material8 both indicate that it is highly unlikely that a new aging phenomenon is operative at this temperature compared to those at lower temperature.

76
Based on the discussion and data shown in this section, it is proposed that the Table NH-3225-2 values for Alloy 617 be listed as 1.0 for yield strength reduction factor and tensile reduction factor for temperatures ≥800°C (1475°F) up to and including 950°C (1750°F).

77
ARTICLE HBB-4000 FABRICATION AND INSTALLATION
HBB-4200
HB-4210
HBB-4212 Effects of Forming and Bending Processes
For qualified materials in ASME Code Section III, Division 5, Subsection HB, Subpart B, a post-fabrication heat treatment is not required for materials that have experienced strains of less than 5%. Allowable temperature limits have been determined for short-time exposure of material cold worked more than 5 and less than 20% for which heat treatment is not required. These limits are given in Figure NBB-4212-1. For exposure greater than these time/temperature limits, the allowed materials are required to be heat treated to the solution annealing conditions specified in the appropriate standard for solution annealed material.
Cold work alters the creep rupture behavior of Alloy 617 for strains as low as 5%. Specific changes to the creep and rupture behavior depend on the amount of cold work and the creep temperature; in general the time and strain to rupture are reduced. Limiting the fabrication strain in components which are given a post-fabrication solution treatment to less than 5%, as required for Alloy 800H in the current Section III, Division 5, Subsection HB, Subpart B rules is recommended by the Special Task Group on Alloy 617 Code Qualification.
For fabrication strains between 5 and 20%, a post-fabrication solution heat treatment of 1150°C for 20 minutes/25 mm of thickness or 10 minutes, whichever is greater, is currently required in ASME Code Section VIII, Division 1. This requirement is also adopted for this Code Case.
It is recommended that components that will see service between 500 and 780°C be given a heat treatment of three hours at 980°C to eliminate relaxation cracking. This recommendation applies regardless of whether the material is in a welded or solution annealed condition, and is consistent with recommendations in datasheets for the major vendors of this alloy.

78
MANDATORY APPENDIX HBB-I-14 TABLES AND FIGURES
HBB-I-14.1
HBB-I-14.1(a) PERMISSIBLE BASE MATERIALS FOR STRUCTURES OTHER THAN BOLTING
All of the specifications that are allowed represent wrought and solution annealed material. The properties that have been used in developing this Code Case are representative of this material condition. The solution treatment required by these specifications results in a large grain size (typically greater than 150µm), that contributes to the creep resistance of the alloy. The minimum thickness specified in the note to Table HBB-I-14.1(a) was agreed upon by the Special Task Group Alloy 617 Code Qualification to ensure that a sufficient number of grains were contained through the thickness of the material and as a consequence that material selected for construction is well represented by the bulk properties used in developing allowable stresses for this Code Case.
HBB-I-14.1(b) PERMISSIBLE WELD MATERIALS
Only one filler material, ERNiCrCoMo-1, is allowed in ASME Code Section IX for gas tungsten arc welding Alloy 617, as called out in specification SFA-5.14.
HBB-I-14.2 So – MAXIMUM ALLOWABLE STRESS INTENSITY
So values correspond to the S values given in ASME Code Section II, Part D, Subpart 1, Table 1B. The SI version of Table 1B only includes values up to 900°C, but additional values are given in Note G29 that were used to interpolate the values for 925 and 950°C.
HBB-I-14.3 Smt – ALLOWABLE STRESS INTENSITY VALUES
Smt, the allowable limit of general primary membrane stress intensity is the lower of two stress intensity values, Sm (time-independent) and St (time-dependent).
Sm is the lowest of the stress intensity values at a given temperature among the time-independent strength quantities that are defined in ASME Code Section II, Part D, Table 2-100(a). In Section III, Division 5, Subsection HB, Subpart B, Sm values are extended to elevated temperatures using the same criteria. Values of Sm for Alloy 617 do not appear in Table 2B of Section II, Part D. Below the maximum temperature of 800°F (427°C) for Section III, Division 5, Subsection HB, Subpart A, the yield criteria govern. Therefore, Sm is the same as S and So for this temperature range. Above 800°F (427°C), Sm is calculated according to Table 2-100(a), and is governed by 0.9SYRY up to 1400°F (750°C), and by 1.1/3 STRT at higher temperatures. Sm and S are plotted as a function of temperature in Figure 14. An abbreviated table of Smt values is shown in Table 1. Yellow is used in Table 1 to illustrate which time/temperature combinations are governed by the time-dependent allowable (St); white cells are governed by the time-independent allowable (Sm).
St is presented in detail in Section HBB-I-14.4.

79
Figure 14. Sm for Alloy 617 in customary and SI units.

80
Table 1. Sampling of allowable stress intensity values, Smt, in SI, showing time-dependent (St) values in yellow.
Stress (MPa) Time (h)→ 1 10 30 100 300 1000 3000 10000 30000 100000
Temperature (°C) ↓
Smt 425 148 148 148 148 148 148 148 148 148 148 450 147 147 147 147 147 147 147 147 147 147 500 146 146 146 146 146 146 146 146 146 146 550 145 145 145 145 145 145 145 145 145 145 600 145 145 145 145 145 145 145 145 145 131 650 145 145 145 145 145 145 144 120 101 83 700 145 145 145 145 137 112 93 76 63 51 750 145 145 134 108 89 72 59 47 39 31 800 132 109 88 71 57 46 37 30 24 19 850 104 72 58 46 37 29 24 19 15 12 900 76 48 39 30 24 19 15 12 9.4 7.3 950 51 32 25 20 16 12 10 7.4 5.8 4.5
HBB-I-14.4 St – ALLOWABLE STRESS INTENSITY VALUES
St is defined as the lesser of three quantities: 100% of the average stress required to obtain a total (elastic, plastic, primary and secondary creep) strain of 1%, 67% of the minimum stress to cause rupture, and 80% of the minimum stress to cause the initiation of tertiary creep. In order to determine St, each of the three criteria must be calculated for the matrix of times and temperatures. This is achieved by using the Larson-Miller plots to all acceptable creep data, combined with information from the hot tensile curves.
Creep data have been assembled from three general sources: testing of modern heats of Alloy 617 plate in current high-temperature reactor programs, historical data from previous high-temperature reactor programs, and data generated by Huntington Alloys (now SMC), the original producer of Inconel 617. The data set has been limited to specimens that were tested in air with known chemistry, and represents multiple product forms and heats.9
The most common method for comparing creep-rupture tests performed at various temperatures and stress levels is by plotting stress against the Larson-Miller parameter (LMP):
LMP = T (C + log tR) (1) where T is absolute temperature, C is the Larson-Miller constant and tR is time to rupture.10 A stress function is formulated using a second-order polynomial in log stress:
LMP = a0 + a1 log S + a2 (log S)2 (2) For the purposes of the regression analysis, the stress function is rewritten so that log tR is the
dependent variable and T and log S are the independent variables:
log tR = �𝑎𝑎0 + 𝑎𝑎1 log 𝑆𝑆 + 𝑎𝑎2 (log 𝑆𝑆)2
𝑇𝑇� − 𝐶𝐶 (3)
Using a least squares fitting method, the optimum values for C, a0, a1 and a2 are determined. A “lot-centering” procedure developed by Sjodahl11 was employed that calculates the lot constant (Clot) for each heat of material, along with the Larson-Miller constant, C, which is the average of the lot constants. A spreadsheet developed for ASME for the analysis of time-dependent materials properties12 was used to generate the L-M plots.

81
Time to 1% Strain A Larson-Miller plot was created using time to 1% creep strain (Figure 15).9 Time to 1% creep strain
was not reported for all creep-rupture tests, but was available for many of the INL interrupted creep tests, resulting in a data set of 208 specimens. Regression analysis for a linear fit produced a correlation coefficient R2 = 0.9272 and C = 19.64 in Equation (1) and a0 = 35,663 and a1 = −6388.5 in Equation (2). A linear fit was used rather than a higher order polynomial to prevent the calculated LMP line from curving up, thus ensuring that extrapolation to long time/higher temperature is conservative.
Figure 15. Larson-Miller plot with a linear fit for time to 1% creep strain for Alloy 617
The stress at 1% creep strain is determined from the Larson-Miller plots; however, the stress at 1% plastic + elastic strain must be obtained from the hot tensile curves.9 The average hot tensile curves are plotted along with isochronous stress-strain curves in Section NBB-T-1800 of this Code Case. Previously the minimum hot tensile curves were used to determine these plastic stress values. However, the average hot tensile curves have been recently used for Type 316 stainless steel after discussion within the ASME Subgroup on Elevated Temperature Design.13 Table 2 gives stress at 1% plastic strain from the average hot tensile curves, used as the upper limit for St. Note that the value in the range of 650–750°C is held constant at 231 MPa, although the values from the hot tensile curves increase slightly in this temperature range because of the anomalous yield behavior of Alloy 617 (increasing yield strength in this temperature range with increasing temperature due to formation of the γꞌ phase). The total stress at a strain of 1% will be the minimum of the elastic/plastic stress from Table 2 and the creep stress from the 1% Larson-Miller plot for a given temperature.

82
Table 2. Stress at 1% plastic strain as a function of temperature obtained from the average hot tensile curves.
Temperature (°C)
Stress 1% (MPa)
425 245.3 450 244.6 475 242.2 500 239.8 525 237.6 550 235.4 575 233.9 600 232.5 625 231.8 650 231.0 675 231.0 700 231.0 725 231.0 750 231.0 775 229.1 800 224.6 825 211.7 850 198.8 875 180.3 900 161.9 925 149.8 950 137.7
Time to Onset of Tertiary Creep A Larson-Miller plot was also created using time to tertiary strain.9 This value also was not reported
for all creep-rupture tests. The historical creep data (Huntington, ORNL, GE) is available in tabular form, and creep curves (strain as a function of time) are not available. In many cases creep strain was not measured continuously during the test as is typically done today. Tests were periodically suspended, the specimen removed from the load frame and measured to determine strain, and the test resumed. In these cases creep curves may not have had the resolution to determine onset of tertiary strain.
The recommended method of determining the onset of tertiary creep involves determining the minimum creep rate, shown as the solid black line in Figure 16 , drawing a parallel line offset by 0.2% strain, and finding the intersection of the offset line (dashed in Figure 16) with the creep curve (red), labeled as B. This method is used for tests where a creep curve is available, and is reported in a few cases for historical data. In other cases, the deviation from linearity, labeled as A, is reported, and in others it is not clear if the value reported represents A or B. Furthermore, in some cases creep curves for Alloy 617 do not follow the classical shape shown in Figure 16. They may have either an inflection point rather than a linear secondary creep portion, have two linear portions, or have no discernable primary or secondary creep.

83
Figure 16. Typical creep curve showing the three stages of creep, minimum creep rate, and 0.2% offset to onset of tertiary creep.
For this data set, the offset value (B in Figure 16) was used where possible, and if a tabulated value was reported, it was included even if it was not offset (A in Figure 16) or unknown, as A values are more conservative. If the curve had an inflection point or short linear portion, a value could generally be determined, but for curves where the onset of tertiary creep was ambiguous, the curve was not included in the data set. This data set contained 208 specimens (although not necessarily the same specimens as the 1% strain data set). Regression analysis for a linear fit (Figure 17) produced a correlation coefficient R2 = 0.9695 and C = 18.15 in Equation (1) and a0 = 33,545 and a1 = −5674.3 in Equation (2). The linear fit for tertiary stress results in a better fit and higher stress values for larger Larson-Miller parameters, but lower stress values for intermediate Larson-Miller parameters.
In order to determine the time-to-tertiary criterion, the LMP is calculated for each time and temperature increment. However, the minimum stress is needed rather than the average. This is accomplished by creating a line that is displaced 1.65 standard error of estimate (SEE) in log time from the average stress-to-rupture curve (shown on Figure 17). In order to accomplish this, Equation (1) must be replaced by:
LMP = T (C + log tR + 1.65 SEE) (4) SEE is included in the output of the spreadsheet used to calculate and plot the Larson-Miller
relationships.12 Finally, Equation (2) is used to solve for stress, S; 80% of S is used for the tertiary creep criterion (also shown on Figure 17).
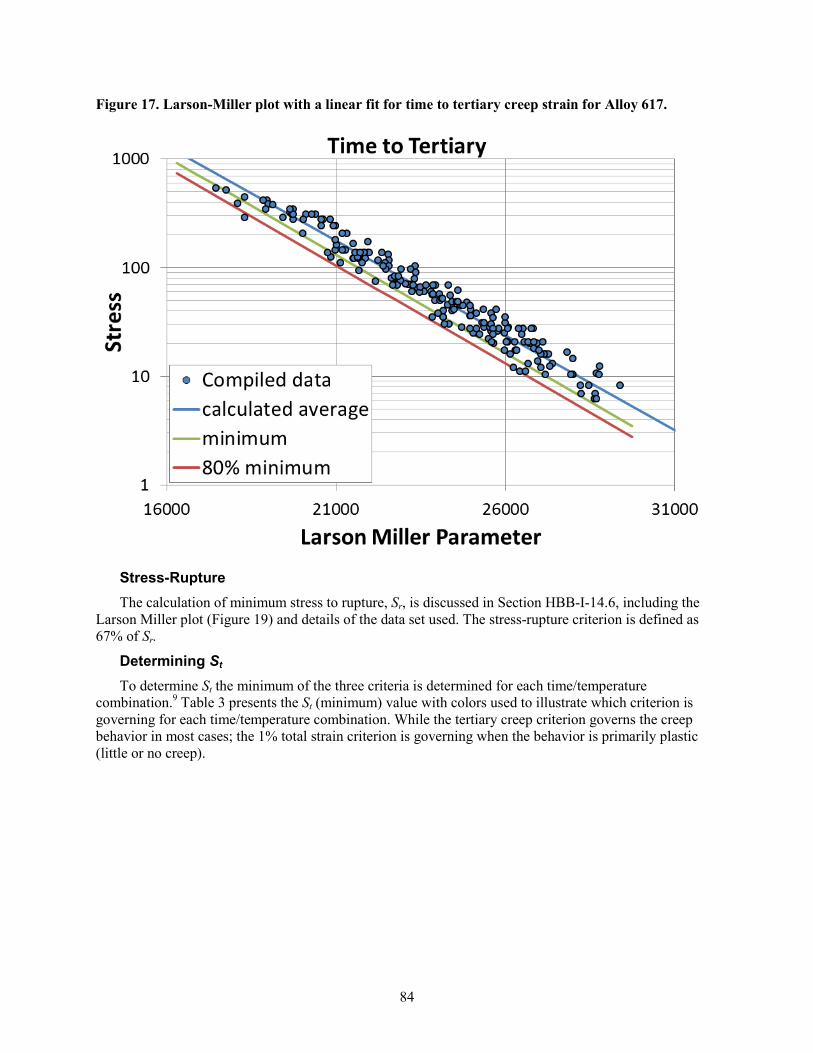
84
Figure 17. Larson-Miller plot with a linear fit for time to tertiary creep strain for Alloy 617.
Stress-Rupture The calculation of minimum stress to rupture, Sr, is discussed in Section HBB-I-14.6, including the
Larson Miller plot (Figure 19) and details of the data set used. The stress-rupture criterion is defined as 67% of Sr.
Determining St To determine St the minimum of the three criteria is determined for each time/temperature
combination.9 Table 3 presents the St (minimum) value with colors used to illustrate which criterion is governing for each time/temperature combination. While the tertiary creep criterion governs the creep behavior in most cases; the 1% total strain criterion is governing when the behavior is primarily plastic (little or no creep).

85
Table 3. Minimum value used to determine St, with colors used to illustrate which criterion is governing for each time/temperature combination.
1% Strain Tertiary Creep Rupture
Stress (MPa)
Time (h)→ 1 3 10 30 100 300 1000 3000 10000 30000 100000 Temperature (C) ↓ Minimum, All Criteria
425 245 245 245 245 245 245 245 245 245 245 245 450 245 245 245 245 245 245 245 245 245 245 245 475 242 242 242 242 242 242 242 242 242 242 242 500 240 240 240 240 240 240 240 240 240 240 240 525 238 238 238 238 238 238 238 238 238 238 238 550 235 235 235 235 235 235 235 235 235 233 199 575 234 234 234 234 234 234 234 234 220 190 162 600 233 233 233 233 233 233 233 213 180 155 131 625 232 232 232 232 232 232 204 175 148 126 106 650 231 231 231 231 231 201 169 144 120 101 83 675 231 231 231 231 197 167 140 116 95 80 65 700 231 231 231 198 164 137 112 93 76 63 51 725 231 231 197 165 133 110 89 74 60 49 40 750 231 201 163 134 108 89 72 59 47 39 31 775 202 166 133 109 87 71 57 47 38 31 25 800 167 136 109 88 71 57 46 37 30 24 19 825 138 112 89 72 57 46 37 30 24 19 15 850 114 92 72 58 46 37 29 24 19 15 12 875 94 75 59 47 37 30 23 19 15 12 9.3 900 77 62 48 39 30 24 19 15 12 9.4 7.3 925 64 51 39 31 24 19 15 12 9.3 7.4 5.7 950 53 42 32 25 20 16 12 9.5 7.4 5.8 4.5
The strain to 1% and rupture criteria are used to limit the overall deformation of a component and
actual failure, respectively. ASME adopted the tertiary creep criterion after it was observed experimentally that internally-pressurized tubes of austenitic stainless steel leaked due to creep damage at times less than those predicted using analysis based on uniaxial rupture data. In the absence of extensive experimental tube failure data over a range of relevant temperatures, this criterion was developed based on the logic that the onset of tertiary creep during uniaxial testing of austenitic stainless steels is associated with extensive creep induced cavitation. Eliminating tertiary creep, and the associated cavitation, was presumed to represent a conservative indirect limit to minimize the potential for premature failure of tubes under multi-axial loading. For many temperatures and stresses, Alloy 617 exhibits extensive tertiary creep prior to rupture, without evidence of measurable cavitation. This has raised questions regarding the validity of the tertiary creep criterion for the St value for Alloy 617 as well as some other alloys that exhibit similar creep behavior. St would be increased over a wide range of time and temperatures by eliminating the tertiary creep criterion.

86
HBB-I-14.5 Sy – YIELD STRENGTH VALUES
The NDMA Excel spreadsheet for time-independent material properties4 was used to analyze yield strength data for T > 525°C. The elevated temperature data are a compilation from older sources (Huntington, ORNL) and newer sources (INL, CEA). At T ≤ 525°C the ASME Code values from Section II, Part D, Table Y-1 were used as input. A fifth-order polynomial was fit to the combination of Code values for T ≤ 525°C and tensile data for T > 525°C.
Yield strength values from the curve fit are only used above 525°C.
Yield strength values (Sy) from Section II, Part D, Table Y-1 for Alloy 617 have been used up to 1000°F (525°C), rather than the curve fit.
Proposed values are shown in Figure 18.

87
Figure 18. Sy for Alloy 617 in customary and SI units
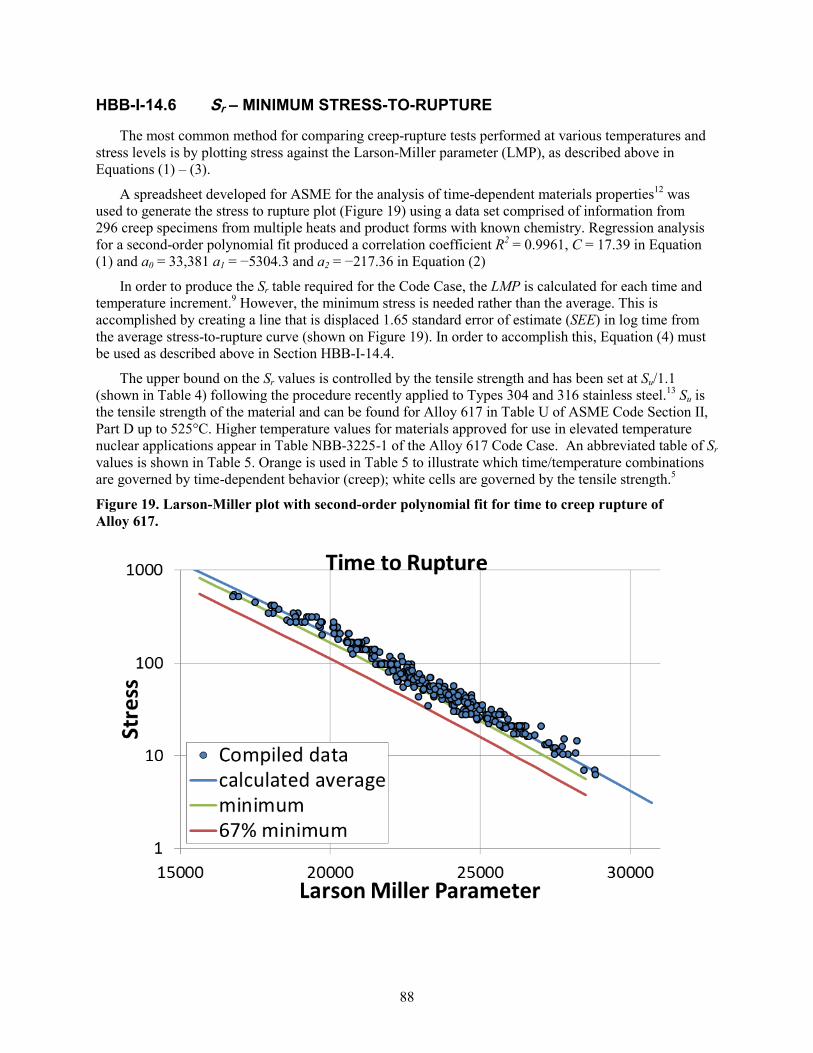
88
HBB-I-14.6 Sr – MINIMUM STRESS-TO-RUPTURE
The most common method for comparing creep-rupture tests performed at various temperatures and stress levels is by plotting stress against the Larson-Miller parameter (LMP), as described above in Equations (1) – (3).
A spreadsheet developed for ASME for the analysis of time-dependent materials properties12 was used to generate the stress to rupture plot (Figure 19) using a data set comprised of information from 296 creep specimens from multiple heats and product forms with known chemistry. Regression analysis for a second-order polynomial fit produced a correlation coefficient R2 = 0.9961, C = 17.39 in Equation (1) and a0 = 33,381 a1 = −5304.3 and a2 = −217.36 in Equation (2)
In order to produce the Sr table required for the Code Case, the LMP is calculated for each time and temperature increment.9 However, the minimum stress is needed rather than the average. This is accomplished by creating a line that is displaced 1.65 standard error of estimate (SEE) in log time from the average stress-to-rupture curve (shown on Figure 19). In order to accomplish this, Equation (4) must be used as described above in Section HBB-I-14.4.
The upper bound on the Sr values is controlled by the tensile strength and has been set at Su/1.1 (shown in Table 4) following the procedure recently applied to Types 304 and 316 stainless steel.13 Su is the tensile strength of the material and can be found for Alloy 617 in Table U of ASME Code Section II, Part D up to 525°C. Higher temperature values for materials approved for use in elevated temperature nuclear applications appear in Table NBB-3225-1 of the Alloy 617 Code Case. An abbreviated table of Sr values is shown in Table 5. Orange is used in Table 5 to illustrate which time/temperature combinations are governed by time-dependent behavior (creep); white cells are governed by the tensile strength.5
Figure 19. Larson-Miller plot with second-order polynomial fit for time to creep rupture of Alloy 617.

89
Table 4. Tensile strength proposed for Alloy 617 as a function of temperature.
T (°C) Su (MPa)
Su/1.1 (MPa)
425 620 563.6 450 616 560.0 475 611 555.5 500 607 551.8 525 603 548.2 550 595 540.9 575 584 530.9 600 570 518.2 625 554 503.6 650 534 485.5 675 512 465.5 700 487 442.7 725 459 417.3 750 428 389.1 775 394 358.2 800 359 326.4 825 322 292.7 850 284 258.2 875 286 260.0 900 208 189.1 925 172 156.4 950 139 126.4
Table 5. Sr, Sampling of minimum stress-to-rupture values, in SI units, showing time-dependent values in orange.
Stress (MPa) Time (h)→ 1 10 30 100 300 1000 3000 10000 30000 100000
Temperature (°C) ↓
Minimum Sr 450 560 560 560 560 560 560 560 560 560 560 500 552 552 552 552 552 552 552 552 519 449 550 541 541 541 541 541 536 466 400 347 297 600 518 518 518 503 434 369 317 269 231 196 650 485 485 419 352 300 252 215 180 153 128 700 443 349 295 245 207 172 145 120 101 84 750 358 247 207 170 142 117 97 80 66 54 800 259 175 145 118 97 79 65 53 43 35 850 186 123 101 81 66 53 43 35 28 22 900 134 87 70 56 45 36 29 23 18 14 950 96 61 48 38 30 24 19 15 12 9
HBB-I-14.10 STRESS RUPTURE FACTORS FOR WELDED ALLOY 617
The weldment stress reduction factor is defined as: SRF = Stressweld/Stressbase, and the stress of the base metal is determined from the Larson–Miller relation from Section HBB-I-14.6. Experimentally determined values for SRF are shown in Figure 20.14
Data denoted as ANL15 and INL3 are from the same gas tungsten arc welded (GTAW) plate, French data are from contemporary studies of GTAW welded plate16 and the Huntington/SMC data are from an older Huntington Alloys report represented in the SMC vendor datasheet.2 VDM data are for Alloy 617B and have been digitized from a vendor datasheet for GTAW weldments.17

90
Figure 20. Weldment stress reduction factors from experiments on GTAW weldments.
A separate analysis of reduction factors for welds of CCA617 (also known as 617B) has been prepared for ASME Code Section I by the Electric Power Research Institute (EPRI).18 Those data are shown in Figure 21 and include GTAW welding as well as other processes. It can be seen in Figure 21 that for GTAW welds, a reduction factor of 1.0 has been proposed for Section I up to 850°C.
Figure 21. Weldment stress reduction factors for Alloy 617 welded by several processes, compiled by EPRI.

91
The Special Task Group for Alloy 617 Code Qualification considered the data in both Figure 20 and Figure 21 and concluded that a factor of 1 adequately described the experimentally determined behavior for GTAW weldments up to 850°C. At a temperature of 850° and above, the Task Group concluded that a factor of 0.85 was a more conservative representation of the experimental data.
HBB-I-14.11 PERMISSIBLE MATERIALS FOR BOLTING
No bolting is permitted for Alloy 617.

92
NONMANDATORY APPENDIX HBB-T RULES FOR STRAIN, DEFORMATION, AND FATIGUE LIMITS AT
ELEVATED TEMPERATURES
HBB-T-1300 DEFORMATION AND STRAIN LIMITS FOR STRUCTURAL INTEGRITY
HBB-T-1320 SATISFACTION OF STRAIN LIMITS USING ELASTIC ANALYSIS
HBB-T-1323 Test No. A-2
The temperature at which Sm = St at 100,000 hours is shown in Figure 22.
Figure 22. Temperature at which Sm = St at 100,000 h.
HBB-T-1400 CREEP‐FATIGUE EVALUATION
HBB-T-1420 LIMITS USING INELASTIC ANALYSIS
HBB-T-1420-1 Design Fatigue Strain Range, ϵt , for Alloy 617
Fatigue Design Curves Developed by Yukawa Elevated temperature design fatigue curves were presented in a paper by Yukawa, 1991.19 Yukawa
compiled fatigue data from numerous sources, including Oak Ridge National Laboratory, General Atomics, General Electric, German and Japanese sources.20, 21, 22, 23, 24, 25 Fatigue tests were conducted in air, axially loaded, and generally conformed to ASTM E466 and E606. Most testing was done at a nominal rate of 4E-03/s. Data obtained from bending or on thin sheet were excluded from this data set.
Fatigue data were analyzed using the generalized equation from ASTM E606
Δεt = A(Nf)a + B(Nf)b (5)

93
where Δεt is the total strain range, the first term is inelastic strain and the second is elastic strain Nf is the number of cycles to failure, and A, a, B, b, are fitting parameters. Not all fatigue data used by Yukawa could be separated into its elastic and inelastic components. Where the stress range was reported, the elastic and inelastic strains were calculated as:
Δεe = Δσ/E (6) Δεi = Δεt – Δεe (7) where E is the elastic modulus, Δεe is the elastic strain range, and Δεi is the inelastic strain range.
The E used was not reported, but by dividing the reported stress ranges by the elastic strain ranges it appears that temperature dependent values of E were used that are consistent with values reported in the SMC datasheet,2 as shown in Figure 23.
Figure 23. Analysis of elastic modulus values used byYukawa.
Inelastic strain range data were plotted as a function of Nf and found not dependent on temperature. Similarly, elastic strain range was plotted as a function of Nf, however the data were found to cluster into three temperature dependent groups of 1000–1300°F (538–704°C), >1300–1600°F (>704–871°C), and >1600–1800°F (>871–982°C).
Manson’s method26 was used to adjust for the Poisson’s ratio between the elastic and plastic conditions.” The elastic portion (2nd term) of Equation (5) is reduced by 2/3(1+ν). Yukawa used ν = 0.3, although the ASME Code value from Section II, Part D, Table PRD is 0.31.
Typically the fatigue design curve is obtained by dividing the stress by a factor of 2 and the cyclic life by a factor of 20. Yukawa takes a modified approach developed by Manjoine and Johnson27 which uses
εd = mpεp + meεe (8) mp = 20a me = ½ where εd is the design allowable total strain range, εp and εe are the plastic and elastic strain ranges, and mp and me are the plastic and elastic reduction factors corresponding to the 20 and 2 factors used in the Code procedure. The exponent a is the same as in Equation (5), -0.76 in this case, yielding mp = 0.1026.

94
Making the appropriate substitutions and dividing by 100 to obtain strain (rather than % strain), the final equation takes the form
εt = (0.1026 A(Nd)a + ½⋅2/3 (1+0.3) B(Nd)b)/100 (9) where εt has replaced εd to represent the design fatigue strain range notation used in the N-47 Code Case and Nd is the number of allowable cycles. This equation produces the curves presented by Yukawa.19
Incorporation of Recent Fatigue Data Fully–reversed strain–controlled low cycle fatigue tests were completed by Wright et al. at INL28 at
total strain ranges from 0.3% – 3.0% at 850°C and 0.3%–2% at 950°C. For most specimens the strain rate was 10-3 /s; however, limited testing at strain rates 10-4 and 10-5 /s was also performed for the higher strain ranges at 950°C. Low cycle fatigue (LCF) testing was conducted in accordance with ASTM Standard E606. Further details of the material and testing are available in the literature.28 The recent fatigue data are in good agreement with the Yukawa data at a similar strain rate and temperatures, as shown in Figure 24.

95
Figure 24. Comparison of recent fatigue data generated at 850 and 950°C28 to previous data compiled by Yukawa.19
The analysis methods used by Yukawa,19 as discussed above, were applied. A modulus value of 146 GPa from Section II, Part D, Table TM-4 was used to calculate elastic and inelastic strains of the INL 850°C data. A value of 136 GPa from Table TM in the Alloy 617 Code Case and described in Section TM, above, was used to calculate the strains of the 950°C data.
Both the inelastic and elastic strain as a function of Nf for the 750–871°C temperature range are similar, producing a Design Fatigue curve that is virtually indistinguishable from the original developed by Yukawa, as seen by comparing the red solid and dashed lines in Figure 25.

96
However, the elastic strain as a function of Nf for temperatures above 871°C varies greatly. The highest temperature Yukawa data set had only six points where elastic and inelastic strain components were differentiated; the elastic strains for the INL 950°C tests are small and the data have significant scatter. The combined data set for the temperature range of 927–1000°C, the design fatigue curve generated is lower than the original Yukawa for intermediate cycle lives, as shown by the dashed green line in Figure 25.
Nevertheless, when all available fatigue data are plotted with the original proposed design fatigue curves, the design curves fall below all total strain range data (Figure 26), indicating the proposed design curves are sufficiently conservative.
Figure 25. The original Design Fatigue curves from Yukawa and proposed in the draft Code Case compared with curves generated from the combined Yukawa-INL dataset.
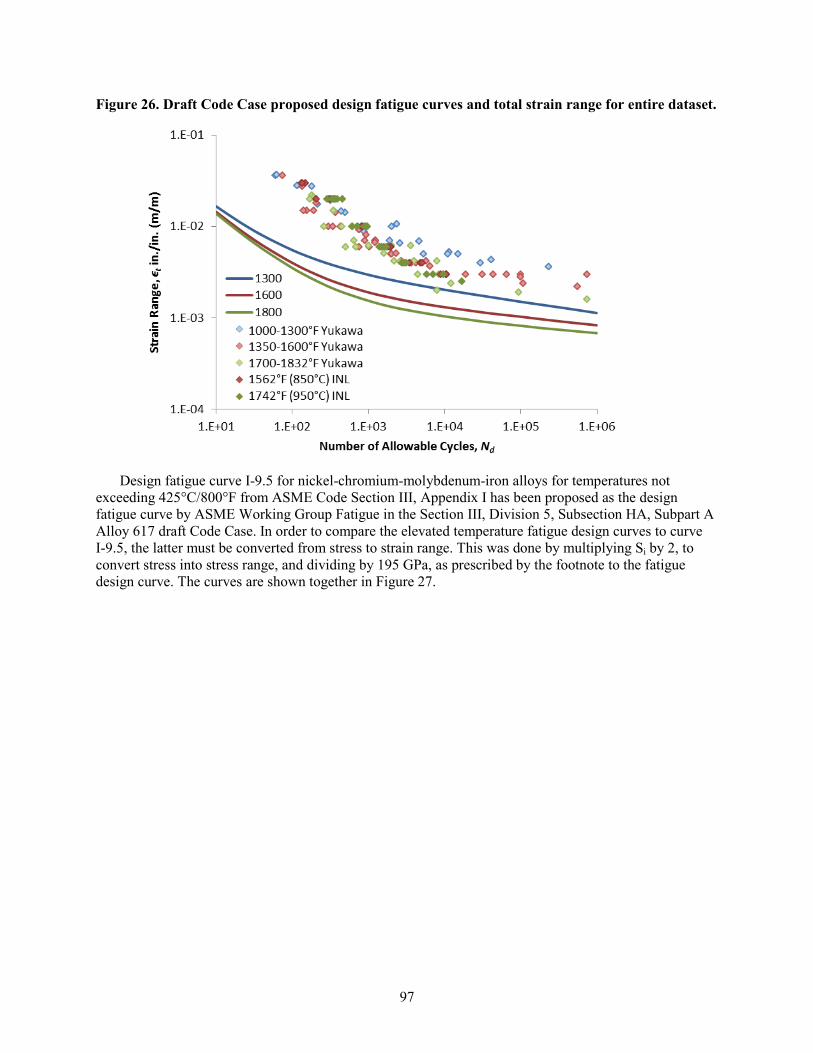
97
Figure 26. Draft Code Case proposed design fatigue curves and total strain range for entire dataset.
Design fatigue curve I-9.5 for nickel-chromium-molybdenum-iron alloys for temperatures not exceeding 425°C/800°F from ASME Code Section III, Appendix I has been proposed as the design fatigue curve by ASME Working Group Fatigue in the Section III, Division 5, Subsection HA, Subpart A Alloy 617 draft Code Case. In order to compare the elevated temperature fatigue design curves to curve I-9.5, the latter must be converted from stress to strain range. This was done by multiplying Si by 2, to convert stress into stress range, and dividing by 195 GPa, as prescribed by the footnote to the fatigue design curve. The curves are shown together in Figure 27.

98
Figure 27. Comparison of elevated temperature design curves to Division 5 (temperatures not exceeding 425°C or 800°F) proposed design curve I-9.5 for Alloy 617.
HBB-T-1420-2 Creep-Fatigue Damage Envelope
In the ASME Code, creep-fatigue life is evaluated by a linear summation of fractions of cyclic damage and creep damage. The creep-fatigue criterion is given by:
Creep DamageCyclic Damage
j kd dj k
n t DN T
D+ ≤
∑ ∑
(10)
where n and Nd are the number of cycles of type j and the allowable number of cycles of the same cycle type, respectively; and Δt and Td are the actual time at stress level k and the allowable time at that stress level, respectively; D is the allowable combined damage fraction. Since the creep damage term is evaluated as a ratio of the actual time versus the allowable time, it is generally referred to as time-fraction. The cyclic- and creep-damage terms on the left hand side of Equation (10) are evaluated in an uncoupled manner, and the interaction of creep and fatigue is accounted for empirically by the D term on the right side of the equation. This can be represented graphically by the creep-fatigue interaction diagram, which is shown for the ASME Division 5 materials in Figure 28.
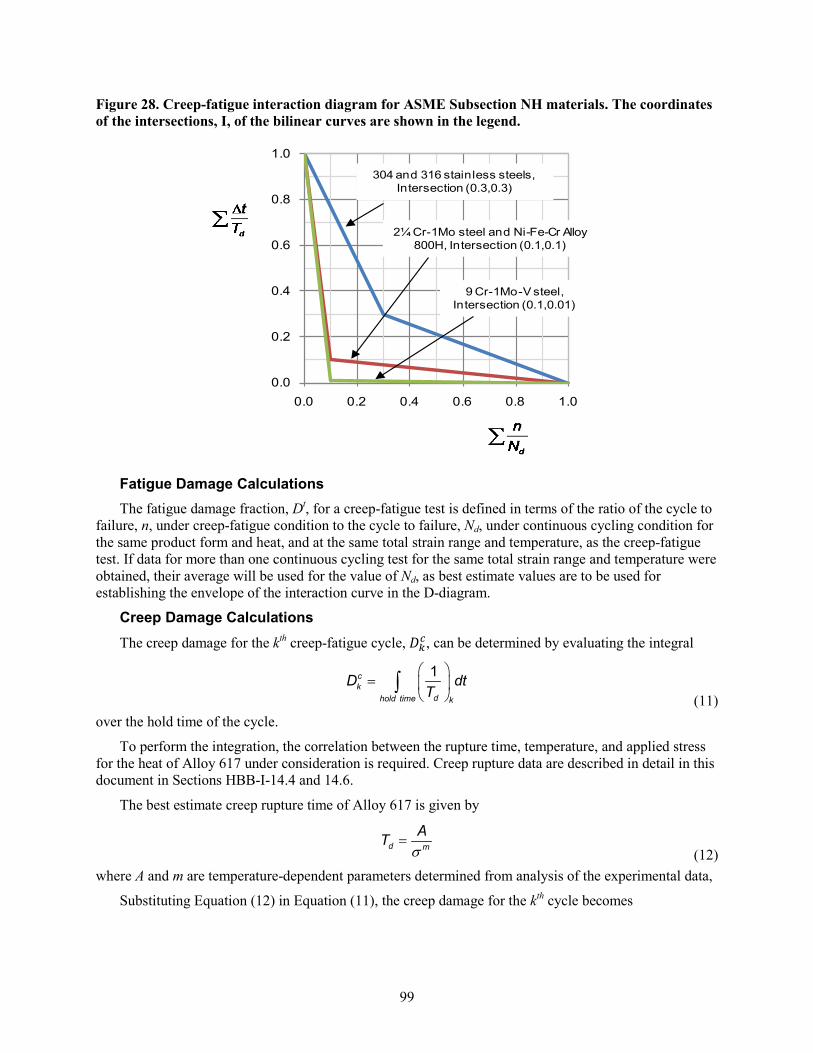
99
Figure 28. Creep-fatigue interaction diagram for ASME Subsection NH materials. The coordinates of the intersections, I, of the bilinear curves are shown in the legend.
Fatigue Damage Calculations The fatigue damage fraction, Dt, for a creep-fatigue test is defined in terms of the ratio of the cycle to
failure, n, under creep-fatigue condition to the cycle to failure, Nd, under continuous cycling condition for the same product form and heat, and at the same total strain range and temperature, as the creep-fatigue test. If data for more than one continuous cycling test for the same total strain range and temperature were obtained, their average will be used for the value of Nd, as best estimate values are to be used for establishing the envelope of the interaction curve in the D-diagram.
Creep Damage Calculations The creep damage for the kth creep-fatigue cycle, 𝐷𝐷𝑘𝑘𝑐𝑐, can be determined by evaluating the integral
=
∫
1ck
dhold time k
D dtT (11)
over the hold time of the cycle.
To perform the integration, the correlation between the rupture time, temperature, and applied stress for the heat of Alloy 617 under consideration is required. Creep rupture data are described in detail in this document in Sections HBB-I-14.4 and 14.6.
The best estimate creep rupture time of Alloy 617 is given by
σ=d m
AT (12)
where A and m are temperature-dependent parameters determined from analysis of the experimental data,
Substituting Equation (12) in Equation (11), the creep damage for the kth cycle becomes
0.0
0.2
0.4
0.6
0.8
1.0
0.0 0.2 0.4 0.6 0.8 1.0
304 and 316 stainless steels, Intersection (0.3,0.3)
2¼ Cr-1Mo steel and Ni-Fe-Cr Alloy 800H, Intersection (0.1,0.1)
9 Cr-1Mo-V steel, Intersection (0.1,0.01)

100
.m
ck
hold time k
D dtAσ
=
∫ (13)
The total creep damage accumulated during a creep-fatigue test can then be determined by summing the creep damages calculated for all the cycles per Equation (13). This would require information on the stress history during the hold time for all the cycles. However, such data are generally not available. An approximation commonly made in calculating the total creep damage is to evaluate the creep damage for one cycle at mid-life, and then multiply this value by the total number of cycles to failure in the creep-fatigue test.
The stress relaxation data during a strain hold period can be fitted to a power-law trend curve using the following functional form
( )σ = + 1
0 0bb t t (14)
where b0, b1, and t0 are treated as fitting parameters, σ is in units of MPa and t and t0 are in units of seconds.
Substituting all the relevant information into Equation (13), the creep damage for the kth cycle is given by
( ) ( )
011 1
0
1 10 00 0
1
, 1
hT tm mmbmb mbc
k hx t
b bD x dx C T t t CA A mb
++ +
=
= = + − ≡ +∫ (15)
where Th is the stress relaxation period in seconds for the kth cycle. Typical stress relaxation curves for Alloy 617 at 950°C are shown as a function of hold time in Figure 29. To establish the D-diagram, the total creep damage calculated based on the best estimate creep rupture correlation is used.
Figure 29. Stress relaxation curves for Alloy 617 at 950°C.

101
Experimental Determination of Cycles to Failure as a Function of Hold Time Fully-reversed, strain-controlled, continuous-cycle fatigue and tensile-hold creep-fatigue testing was
conducted on Alloy 617 at 850°C and 950°C in air at strain ranges of 0.3% and 1.0% (and at 0.6% at 950°C only) to ASTM E 606-12. Cyclic testing was conducted on servo-hydraulic test machines in axial strain-control mode utilizing either radio-frequency induction heating or a three-zone radiant furnace to heat the specimens. Continuous-cycle fatigue testing followed a triangular waveform, while creep-fatigue testing followed a trapezoidal waveform with hold times of 180 up to 9000 seconds imposed at the maximum tensile strain. In all cases, a strain-controlled ramp rate of 10-3/s was employed. For the continuous-cycle fatigue and tensile-hold creep-fatigue, the number of cycles to failure, Nf, was defined as a 20% decrease in the ratio of the peak tensile stress to the peak compressive stress from the point, Ni, at which this ratio initially deviates from a constant trend. Cycle to failure data are shown for testing at 850 and 950°C in Figure 31 and Figure 30, respectively.3 Data determined in the experiments described above are denoted as coming from the Advanced Reactor Technologies (ART) program; additional data from the literature under similar conditions are plotted in the figures as well.29, 30
Figure 30. Cycles to failure as a function of tensile hold time for testing at 950°C in the experiments described here (denoted as ART) and from testing reported in the literature under similar conditions.
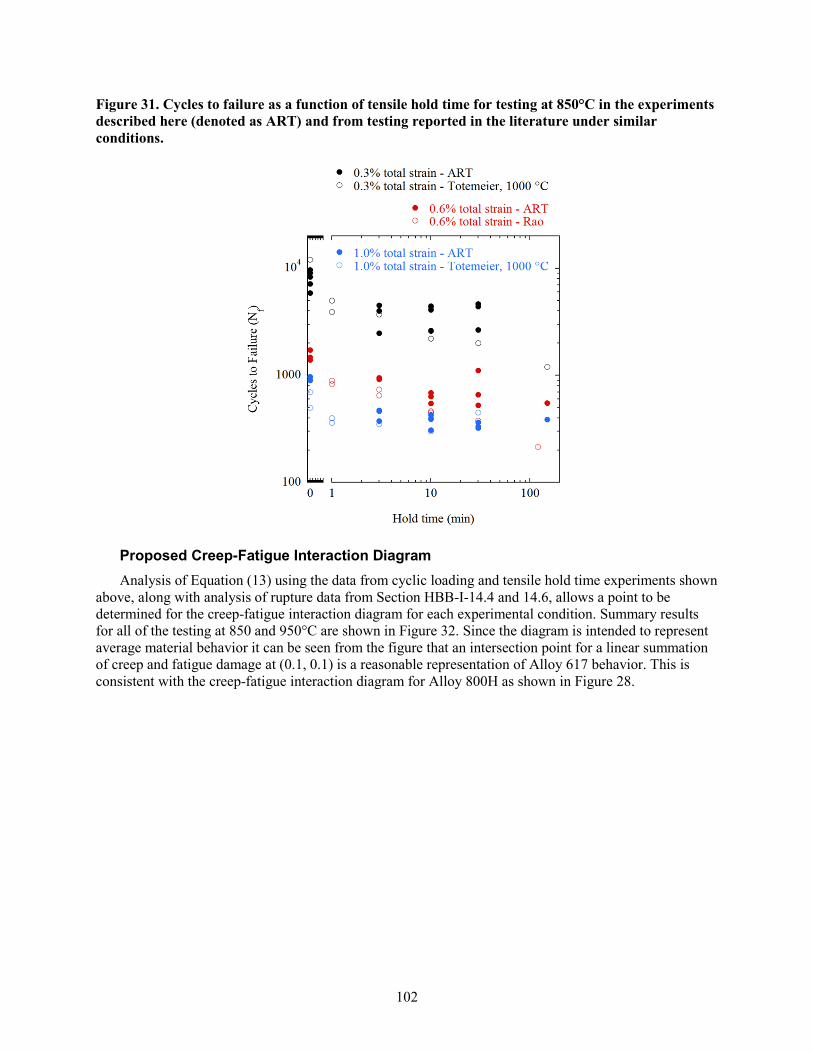
102
Figure 31. Cycles to failure as a function of tensile hold time for testing at 850°C in the experiments described here (denoted as ART) and from testing reported in the literature under similar conditions.
Proposed Creep-Fatigue Interaction Diagram Analysis of Equation (13) using the data from cyclic loading and tensile hold time experiments shown
above, along with analysis of rupture data from Section HBB-I-14.4 and 14.6, allows a point to be determined for the creep-fatigue interaction diagram for each experimental condition. Summary results for all of the testing at 850 and 950°C are shown in Figure 32. Since the diagram is intended to represent average material behavior it can be seen from the figure that an intersection point for a linear summation of creep and fatigue damage at (0.1, 0.1) is a reasonable representation of Alloy 617 behavior. This is consistent with the creep-fatigue interaction diagram for Alloy 800H as shown in Figure 28.

103
Figure 32. Creep-fatigue interaction diagram showing the data plotted with the proposed intersection of (0.1, 0.1).
HBB-T-1800 ISOCHRONOUS STRESS‐STRAIN RELATIONS
Figures HBB-T-1800-F-1 through HBB-T-1800-F-20 of this subarticle provide graphs presenting hot tensile and isochronous stress‐strain curves (ISSC), each graph being for a specific temperature. The graphs are intended to provide the designer with information regarding the total strain caused by stress under elevated temperature conditions, assuming average material properties. ISSC and hot tensile curves are needed up to 2.2% strain for temperatures of 800-1750°F in 50°F increments. Curves were developed based on experimental tensile and creep data measured at 50°C increments.
Hot tensile curves provide an upper bound for the ISSC at high temperature. ISSC that exceed the hot tensile curve in the 2% range are excluded, resulting in only hot tensile curves at low temperatures where creep is negligible. At intermediate temperatures, only long-time ISSC are shown with the hot tensile curves.
Average Isochronous Stress Strain Curves ISSC are constant-time stress-strain curves for a given temperature that are generated from creep data.
A creep strain equation used by Swindeman31, 32 and Booker33 was used to model experimental creep curves from recent testing of a single plate for ≥800°C up to 3% creep strain:
𝜀𝜀𝑐𝑐 = 𝑎𝑎𝐷𝐷1 3� + 𝑚𝑚𝐶𝐶𝑚𝑚 𝐷𝐷 (16) where a is the primary creep strain constant and mcr is the minimum creep rate.
Based on these results, the stress and temperature dependence of the minimum creep rate was determined using the equation

104
𝑚𝑚𝐶𝐶𝑚𝑚 = 𝑎𝑎 �𝜎𝜎𝐸𝐸�𝑏𝑏𝑒𝑒−𝑐𝑐 𝑅𝑅𝑇𝑇� (17)
where 𝜎𝜎 is stress, E is the elastic modulus R is the universal gas constant, T is the absolute temperature and a, b, and c are determined optimally. The stress and temperature dependence of the primary creep strain constant was quantified using the same equation form, and the ISSC are generated for each time-temperature combination. An example of a set of ISSC plotted with experimental creep data is shown in Figure 33 for 800°C.
Figure 33. Isochronous stress-strain curves for 800°C shown with experimental creep data.
To obtain average isochronous stress strain curves, the modeled curves are shifted along the trajectory of linear elastic deformation in order to pass through the average stress at 1% creep strain, as determined by the linear regression line of the Larson-Miller plot for 1% creep strain shown in Figure 15.
ISSC were developed for alloy 617 by the Germans34 and by Corum and Blass35 for high temperature gas reactor programs in the 1980s, although details of how they were generated are not clearly understood. Examples of comparisons are shown in Figure 34.

105
Figure 34. Comparison of generated ISSC to those published in a) German Standard KTA-3221 for 900°C and b) Corum and Blass for 816°C.
Average Hot Tensile Curves Average hot tensile curves are presented along with isochronous stress-strain curves. Two models
have been examined to describe the elevated temperature plastic tensile behavior of Alloy 617: the Ramberg-Osgood equation and a modified Voce equation. Experimental tensile curves from rod and plate tested at INL36 have been used as the source of stress and strain data (e.g. proportional limit) for fitting purposes, and for determining which model provides the best fit (magnitude and shape of the curve).
To generate a stress-strain curve, the model equation is solved for ep, the engineering plastic strain, and total strain, e, is calculated as:
e = 100*S/E + ep (18)
a)
b)

106
where S is the engineering stress, E is the elastic modulus, and the first term represents elastic strain. The modulus values were taken from the ASME Code Section II, Part D.
The Ramberg-Osgood37 equation can be used to model tensile plasticity when creep effects are not significant:
ep = a(S - Spl)m where S > Spl (19) where Spl is the proportional limit, and a and m are material constants that may vary with strain rate and temperature.35 The constants a and m are calculated using experimentally determined data pairs ep = 0.2% when S = Sys (0.2% offset yield strength), and ep = 2% when S = S2% (2% offset yield strength).
A modified Voce38, equation was used to describe the tensile inelasticity when creep is significant:
S - SUTS = (Spl - SUTS) exp [-(b ep)0.5] (20) where SUTS is the ultimate tensile strength, and b is the rate constant. The latter constant can be calculated when S = Sys, yield strength, and ep is 0.2%.38, 32
The Ramberg-Osgood equation describes the shape of the stress strain curves well in the range of 650-800°C, while a modified Voce equation describes the shape for temperatures greater than 800°C. At 800°C, the curves calculated by the two models are nearly identical.
To obtain average hot tensile curves, the modeled curves are shifted along the trajectory of linear elastic deformation in order to pass through 1.25Sy at 0.2% offset strain. Sy represents the minimum yield strength and is listed in ASME Code Section II, Part D, Table Y-1. Examples of experimental elevated temperature tensile curves are shown with shifted hot tensile curves in Figure 35.

107
Figure 35. Examples of hot tensile curves shifted to pass through the average 0.2% yield strength and plotted with experimental tensile curves from bar and plate stock at a) 650°C, b) 800°C and c) 950°C.
HBB-T-1820 MATERIALS AND TEMPERATURE LIMITS
Tabulated values are required in both customary (°F, ksi) and SI (°C, MPa) units. Temperature limits and allowable stresses in the ASME Code are determined using the customary units; SI values are determined from the customary values by calculation or interpolation. However, the temperature limits in customary and SI units do not coincide. In the allowable stress tables in ASME Code Section II, Part D, for example, a material might have an upper use temperature limited to 1750°F (954°C). The tabulated values in Section II, Part D (Metric) list allowable stresses in 25°C increments. For the case where a material is allowed up to 954°C, the process that has been adopted in Section II, Part D is to provide allowable values at 950 and 975°C with a footnote stating: “The maximum use temperature is 954°C; the value listed at 975°C is provided for interpolation purposes only.” Section III, Division 5, Subsection HB, Subpart B has not followed the Section II convention. Instead, the values are simply rounded to the nearest standard SI increment. Thus, while Alloy 617 will be allowed up to 1750°F, in SI units its allowed use temperature will be limited to 950°C.
For this Code Case this has a significant practical advantage. Experimental data are required up to 50°C above the maximum use temperature; because of the rounding to 950°C in Section III Division 5,
a) b)
c)

108
Subsection HB, Subpart B, it is only necessary to have data to 1000°C which is the upper limit of much of the recent experimental work on Alloy 617.
The lower temperature limit for tabulated values and figures in Section III, Division 5, Subsection HB, Subpart B is 800°F. Below this temperature Section III, Division 5, Subsection HB, Subpart A is used.

109
REFERENCES
1 B. H. Rabin, W. D. Swank and R. N. Wright, “Thermophysical Properties of Alloy 617 from 25 to
1000°C”, Nuclear Engineering and Design Journal, Vol. 262, 2013, p. 72. 2 INCONEL® Alloy 617 Datasheet, Special Metals Corp., Publication No. SMC-029 Huntington, WV,
2005. 3 Idaho National Laboratory, Advanced Reactor Technologies program, unpublished research. 4 R. W. Swindeman and M. J. Swindeman, Analysis of Time-Independent Materials Properties Data,
ASME Standards Technology, LLC, 2009. 5 Weiju Ren and Robert Swindeman, “A Review Paper on Aging Effects in Alloy 617 for Gen IV Nuclear
Reactor Applications”, Journal of Pressure Vessel Technology, Vol. 131, 2009. 6 Huntington Alloys, Inc., Huntington, WV, Alloy 617 data,1979. 7 H. E. McCoy and J. F. King (Oak Ridge National Laboratory), Mechanical Properties of Inconel 617
and 618, ORNL/TM-9337, 1985. 8 Q. Wu, H. Song, R. W. Swindeman, J. P. Shingledecker, and V. K. Vasudevan, “Microstructure of
Long-Term Aged IN617 Ni-Base Superalloy,” Metallurgical Transactions, Vol. 39A, 2008, pp. 2569-2585.
9 J. K. Wright and T. M. Lillo (Idaho National Laboratory), Progress Report on Alloy 617 time-Dependent Allowable Stresses, INL/EXT-15-35640, Revision 1, July 2015.
10 F. R. Larson and J. Miller, “A Time-Temperature Relationship for Rupture and Creep Stresses,” Trans. ASME, Vol. 74, 1952, pp. 765−775.
11 L. H. Sjodahl, “A Comprehensive Method of Rupture Data Analysis With Simplified Models,” in Characterization of Materials for Service at Elevated Temperatures, New York, NY: American Society of Mechanical Engineers, 1978, pp. 501–516.
12 R. W. Swindeman and M. J. Swindeman, Analysis of Time-Dependent Materials Properties Data, ASME Standards Technology, LLC, 2014.
13 M. Sengupta and J. E. Nestell, “Task 14a – Correct and Extend Allowable Stress Values for 304 and 316 Stainless Steel,” MPR-3813, Revision 2, ASME Standards Technology, LLC, October, 2013.
14 J. K. Wright, L. J. Carroll, and R. N. Wright (Idaho National Laboratory), Creep and Creep-Fatigue of Alloy 617 Weldments, INL/EXT-14-32966, August 2014.
15 K. Natesan, M. Li, W. K. Soppet, and D. L. Rink, Creep Testing of Alloy 617 and A508/533 Base Metals and Weldments, Argonne National Laboratory, ANL/EXT-12/36, September, 2012.
16 J. M. Gentzbittel, D. Vincent, N. Scheer, Results of Mechanical and Microstructural Characterizations of Alloys 617 and 230. Mechanical Properties of TIG Welded 617, DTH/DL/2007/80, 2007.
17 M. Spiegel, R. Krein (Salzgitter Mannesmann Forschung), J. Klöwer (Outokumpu VDM), T. Kremser, P. Schraven (Salzgitter Mannesmann Stainless Tubes), V. Knezevic, I. Steller (Vallourec & Mannesmann Tubes), Alloy 617B Metallurgy, Properties, Fabrication and Welding, 2013.
18 J. Shingledecker, J. Siefert, M. Santella, P. Tortorelli, “Creep-Rupture Analysis of Alloy CCA617 Base Metal and Weldments,” 7th International Conference on Advanced Material Technology for Fossil Power Plants, Hawaii, Oct. 23, 2013.
110
19 S. Yukawa, "Elevated Temperature Fatigue Design Curves for Ni-Cr-Co-Mo Alloy 617," 1st
JSME/ASME Joint International Conference on Nuclear Engineering, Tokyo, Japan, 1991. 20 J. P. Strizak, C. R. Brinkman, M. K. Booker, and P. L. Rittenhouse (Oak Ridge National Laboratory),
“The Influence of Temperature, Environment, and Thermal Aging on the Continuous Cycle Fatigue Behavior of Hastelloy X and Inconel 617,” ORNL/TH-8130, April 1982.
21 J. L. Kase (General Atomics Co.), “Low Cycle Fatigue Data for Inconel 617,” Document No. 904668, March 1980.
22 H. P. Meurer, H. Breitling, and E. D. Grosser, “Low Cycle Fatigue Behavior of High Temperature Alloys in HTR-Helium,” Behavior of High Temperature Alloys in Aggressive Environments, London: The Metals Society, 1980, pp. 1005-1015.
23 Project Staff (General Electric Co.), “Advanced Gas Cooled Nuclear Reactor Materials Evaluation and Development Program,” Final Report for Period Sept. 1976 to Sept. 1982, Report DOE-ET-34202-80, May 15, 1983.
24 M. Kitagawa, J. Hamanaka, T. Umeda, T. Goto, Y. Saiga, M. Ohnami, and T. Udoguchi, “A New Design Code for 1.5 MWt Helium Heat Exchanger,” in Proceedings of the 5th International Conference on Structural Mechanics in Reactor Technology, Berlin, Germany, Vol. F, 1979.
25 H. Hattori, M. Kitagawa, and A. Ohtomo, “Effect of Grain Size on High Temperature Low-Cycle Fatigue Properties of Inconel 617,” (in Japanese) Transactions of the Iron and Steel Institute of Japan, Vol. 68, No. 16, Dec. 1982, pp. 121-130.
26 S. S. Manson, Thermal Stress and Low Cycle Fatigue, McGraw-Hill, 1966, pp. 165-170. 27 M. J. Manjoine, and R. L. Johnson, “Development of Fatigue Design Curves for Ferritic Steels up to
700°F (371°C),” Symposium on ASME Codes and Recent Advances in PVP and Valve Technology Including a Survey of Operations Research Methods in Engineering, PVP Vol. 109, ASME, 1986, pp. 77-85.
28 J. K. Wright, L. J. Carroll, J. A. Simpson, and R. N. Wright, “Low Cycle Fatigue of Alloy 617 at 850 and 950°C,” Journal of Engineering Materials and Technology, Vol. 135, July 2013.
29 T. Totemeier T. and Tian H., "Creep-Fatigue-Environment Interactions in Inconel 617," Materials Science and Engineering A, Vol. 468-470, 2007, p. 81-87.
30 K.B.S. Rao, H.P. Meurer, H. Schuster, “Creep-fatigue interaction of Inconel 617 at 950ºC in simulated nuclear reactor helium,” Materials Science and Engineering A, Vol. 104, 1988, pp. 37-51.
31 R. W. Swindeman, “Cyclic Stress-Strain Response of a 9Cr-1Mo-V-Nb Pressure Vessel Steel at High Temperatures” in Low Cycle Fatigue, STP 942, American Society for Testing and Materials, 1988, pp. 107-122.
32 R. W. Swindeman, “Construction of Isochronous Stress-Strain Curves for 9Cr-1Mo-V Steel,” PVP Pressure Vessel Piping Advance Life Prediction Methodology ASME, Vol. 391, 1999, pp. 95–100.
33 M. K. Booker, 1990, “Creep Equation for Modified 9Cr-1Mo Steel,” submission to the Nuclear Systems Materials Handbook, Oak Ridge National Laboratory, Oak Ridge, TN.
34 KTA-3221 German Structural Design Rule for Metallic HTR-components. 35 J. M. Corum and J. J. Blass, “Rules for Design of Alloy 617 Nuclear Components to Very High
Temperatures,” PVP Pressure Vessel Piping Fatigue Fracture and Risk ASME, Vol. 215, 1991, pp. 147–153.

111
36 J. K. Wright, L. J. Carroll, C. Cabet, T. M. Lillo, J. K. Benz, J. A. Simpson, W. R. Lloyd,
J. A. Chapman, and R. N. Wright, “Characterization of elevated temperature properties of heat exchanger and steam generator alloys,” Nuclear Engineering Design, Vol. 251, 2012, pp. 252–260.
37 W. Ramberg and W. R. Osgood, “Description of stress–strain curves by three parameters,” National Advisory Committee for Aeronautics, Washington DC, Technical Note No. 902, 1943.
38 E. Voce, “The Relationship Between Stress and Strain for Homogeneous Deformation,” Journal of the Institute of Metals, Vol. 74, 1948, p. 537.

112

113
APPENDIX 3
LETTER FROM AREVA REQUESTING CODE ACTION ON ALLOY 617

114

115
APPENDIX 3 LETTER FROM AREVA REQUESTING CODE ACTION
ON ALLOY 617

116