is 8690 (1977): application guide for measuring devices for high voltage … · 2018-11-15 · the...
TRANSCRIPT

Disclosure to Promote the Right To Information
Whereas the Parliament of India has set out to provide a practical regime of right to information for citizens to secure access to information under the control of public authorities, in order to promote transparency and accountability in the working of every public authority, and whereas the attached publication of the Bureau of Indian Standards is of particular interest to the public, particularly disadvantaged communities and those engaged in the pursuit of education and knowledge, the attached public safety standard is made available to promote the timely dissemination of this information in an accurate manner to the public.
इंटरनेट मानक
“!ान $ एक न' भारत का +नम-ण”Satyanarayan Gangaram Pitroda
“Invent a New India Using Knowledge”
“प0रा1 को छोड न' 5 तरफ”Jawaharlal Nehru
“Step Out From the Old to the New”
“जान1 का अ+धकार, जी1 का अ+धकार”Mazdoor Kisan Shakti Sangathan
“The Right to Information, The Right to Live”
“!ान एक ऐसा खजाना > जो कभी च0राया नहB जा सकता है”Bhartṛhari—Nītiśatakam
“Knowledge is such a treasure which cannot be stolen”
“Invent a New India Using Knowledge”
है”ह”ह
IS 8690 (1977): Application guide for measuring devices forhigh voltage testing [ETD 19: High Voltage Engineering]


r!3 : 8698,- 1977
Indian Standard ” ’ :
APPLICATION GUIDE FOR MEASURING % *..\ DEVICES FOR HIGH VOLTAGE TESTING 4
/
( First Reprint JULY 1988 )
UDC 621.317.72.089.6( 026)
BUREAU OF INDIAN STANDARDS MANAK BHAVAN. 9 BAHADUR SHAH ZAFAR MAR0
NEW DELHI 110002
Gr 9 December 1979 _‘

.’
1s : 8699 - 1977
Indian Standard APPLICATION GUIDE FOR MEASURING DEVICES FOR HIGH VOLTAGE TESTING
High Voltage Techniques Sectional Committee, ETDC 19 Chairman
SHRI V. R. NARAJXMHAN
Members
Refxesenting LI Central Electricity Authority, New Delhi
DEPUTY DIRECTOR (Alternate to Shri V. R. Narasimban)
SHRI K. S. BHARDWAJ SHRI A. K. CHOPRA (Alternate )
Punjab State Electricity Board, Patiala
DR S. C. BHATXA DR D. P. SAHCWL ( Alternate)
Siemenslndia Ltd, Bombay
DR K. D.4.s GUPTA SHRI A. K. BARMAN (Alternate )
The Calcutta Electric Supply Corpn Ltd, Calcutta
SHRI V. B. DESAI Jyoti Ltd, Vadodara DR P. SAT~ANARAYANA ( Alternate )
SHRI V. S. MAFU Hindustan Brown Boveri Ltd, Bombay SHRI K. S. MA.DHAVAN ( Alternah )
SHRI S. K. MUKHERJEE SHRI D. V. NARK~
National Test Housct Calcutta Bharat Heavy Electrxals Ltd, New Delhi
SHRI B. N. GHOSF (Afternate ) SHRI P. N. SHRIVASTAVA ( Alternate )
SHRI V. H. NAVKAL The Bombay Electric Supply & Transport Under-
SHRI M. L. DONQRB ( Alternate ) taking, Bombay
PROF G. R. GOVIND.4 RAJIJ DR B. I. GURURAJ ( Alternate)
Indian Institute of Science, Bangalore
SHRI K. S. SIVAPRAKASAU Karnataka Electricity Board, Bangalore SHRI H. M. S. LIN~AIH (Alternate )
SHRI V. SRINIVASAN W. S. Insulators of India Ltd, Madras SHRI K. THIRU~IZNKADATHAN ( Alternate)
SHRI T. V. SUBRAMANIAN SHRI S. KRXPANIDHI ( Altcuaate )
Tamil Nadu Electricity Board, Madras
SHRI SURENDRA SINQH U.P. Govenment Pottery Development Centrc, Khurja
SHRI KOMAL SINGH (Alternate) SHRI C. R. VARIER Crompton Greaves Ltd, Bombay
DR G. PARTHASARATHY ( Alternate ) SHRI P. J. WADIA The Tata Hydro-ElcctRc Power Supply Co Ltd,
Bombay DR R. RANJAN ( Alternate )
SHRI s. P. SACHDEV, Director ( Eloc tech )
Director General, BIS ( Ex-oficio Member )
Secfetafy SHRI M. N. MURTHY
Assistant Director ( Elec tech ),BIS
(8 Coprright 1979
BUREAU OF INDIAN STANDARDS
This ublication is protected under the fndiun Copyrighf Act (XIV of 1957 ) and repro B uction in whole or in part by any means except with written permission of the+ publisher shall be deemed to be an infringement of copyright under the said Act.
IS : 8690 - 1977
Indian Standard APPLICATION GUIDE FOR MEASURING DEVICES FOR HIGH VOLTAGE TESTING
0. FOREWORD
0.1 This Indian Standard was adopted by the Indian Standards Institution on 30 December 1977, after the draft finalized by the Higb. Voltage Tech- niques Sectional Committee had been approved by the Electrotechnical Division Council.
0.2 This guide is divided into four sections dealing with systems and devices for measuring high direct voltages, alternating voltages, lightning and switching impulse voltages, and impulse currents, and a fifth section dealing with the statistical treatment of errors.
0.3 In the preparation of this standard, assistance has been derived from IEC Dot : 42 ( Central Office ) 27 Draft - ‘ High voltage test techniques - Measuring devices application guide ’ issued by International Electro- technical Commission ( IEC >.
0.4 In reporting the result of a test made in accordance with this standard, if the final value, observed or calculated, is to be rounded off, it shall be done in accordance with IS : 2-1960*.
1. SCOPE
1.1 This guide gives information on measuring systems and devices other than sphere gaps, used for the measurement of high voltages or currents during the performance of dielectric test in accordance with IS : 2071 &Part III )-19761_. In general, use of the devices and of the measuring and calibration procedures described herein will satisfy the specified requirements for accuracy, but their use is not mandatory, other devices and procedures may be used if they are shown to have equal accuracy.
1.1.1 Voltage measurements with sphere gaps are dealt with in IS : 1876-1961x.
YRules for rounding off numerical values ( rcuircJ) .
tMethods of high voltage testing: Part III Measuring devices (jk: revision ). ^ $Method for voltage measurement by means of sphere gaps ( one-sphere earthed ).
2
IS t 8690 - 1977
SECTION I DIRECT VOLTAGES
2. MEASUREMENT OF DIRECT VOLTAGES
2.1 General - Systems for measuring direct voltages generally consist of a measuring instrument and a high impedance across which almost the entire test voltage will appear. The value of the impedance is made high to minimize the power consumption. Some of the more commonly used systems for measuring the steady-state and ripple values are. described in this section.
2.2 Systems for Measuring the Steady-State Value of Direct Voltages
2.2.1 Instrument Used wi;h Series Resistor-A direct current measuring instrument is connected in series with a stable high value resistor.
2.2.2 Instrument Used with Voltage Divider - A voltmeter is connected across the low voltage arm of a resistance voltage divider, The resistance of the voltmeter shall be taken into account when determining the ratio of the divider.
NOTE -Depending on the type of instrument used, these methods will determine the arithmetic mean, the rms or the peak value of the voltage. 2.2.3 Electrostatic Voltmeter - An electrostatic voltmeter has two electrodes
which are connected to the points between which the high voltage is to be measured. The electrostatic field between the electrodes. generates an attracting force whit!. depends on the rms value of the voltage. By measurement of this force, an indicatiol of the rms value of the high voltage can be derived. This measuring principle can be used over the range of frequencies from zero up to several megahertz. If the measuring system is not shielded, special attention should be given to errors caused by stray fields and space charges.
2.2.4 Generating Voltmeter - A generating voltmeter is 2 capacitive device the input terminals of which are connected to the points between which the voltage is to be measured. It is essentially a variable capacitor, the capacitance being cyclically changed between two fixed values. A measur- ing instrument together with a suitable switching or rectifying device measures the change of charge which, in general, is proportional to the mean value of the direct voltage. By a suitable choice of frequency of the capacitance variation and its phase angle relative to the voltage to be measured, the crest value or any intermediate value can be determined.
2.3 Systems fDr Measuring RippIe Voltage
2.3.1 Oscilloscope Used with V&age Divider -An oscilloscope is cqnnccted to the low voltage arm of a voltage divider having a suitable frequency response. It should be noted that the capacitance of the cable between the divider and the instrument can modify the frequency response.
2.3.2 Insjrument Used with Filter - Such a device consists, in general, of an instrument connected to the circuit in such a way that the dc compopcnt
3
IS 2 8699 - 1977
is filtered out. A typical arrangement consists of a high voltage capacitor in series with a resistor across which a voltage measuring instrument is connected.
2.3.3 Instrument Measuring l’ht RectiJicd Current Through a Cajacitor - A capacitor in series with a full wave rectifier is connected to the points betweon which the voltage is to be measured. The ripple amplitude Ur is related to the rectified mean current I* flowing through the capacitor by the following relationship:
Ir ur - - 4Cf
where C = capacitance of the capacitor, and Jr - fundamental frequency of the ripple.
If the ammeter measuring the capacitor current is connected so that only alternate half cycles of current are measured, the factor 4 in the above expression becomes 2. The method is of limited application. If the ripple has more than one peak during each half cycle, then the accuracy depends upon the type of rectifier used.
2.4 Determitlation of Voltage Ratios and Scale Factors
2.4.1 Instrument Used with Series Resistor - The resistance of the series resistor is generally determined by a low voltage bridge measuretnent using direct voltage. From this value and the characteristics of the instrument, the scale fYctor is deduced.
The scale factor can also be determined by comparison during parallel opzrat’ion with an approved direct voltage measuring system.
The stability of thi: series resistor at high voltage can be verified by subjecting individual cotnponents of the resistor to suitable tests over the range of voltages at which they will operate.
2.4.2 Instrument Used with Voltfge Divider - Methods for determining the ratio of voltage dividers are dtscussed in 4.3.
2.4.3 Electrostatic Voltmeter and Generating Vo’oltmrter - Measuring systems of these types can be calibrated by comparison during parallel operation with other approved measuring systems. They may also be calibrated llsiq nuclear reactions.
NOTE -During reactions between proton or deuteron beams with different light-nucleus elements, precisely known resonant energies exist for which the cross section ful. a reaction ir a maximum. Thiq effect can be used as a very accurate absoluic cali!xation method for high dc voltages.
2.5 Determination of the Amplitude Frequency Response of a Measuring System - To determine the amplitude frequency rcsponsc of a rncasuring system, a sinusoid31 voltage is applied between its input
4

lS : 8690 - 1977
terminals. The ratio of the output to the input amplitudes is recorded as a function of frequency. The range of frequencies should extend from a low value to at least the highest of importance present in the voltage to be measured. The measurements are usually made at a low value of input voltage.
2.6 Possible Sources of Error and Precautions - When using direct voltage measuring systems of very high resistance, care must be exercised to avoid errors due to corona currents, or to leakage currents across insula- ting surfaces which may be contaminated by pollution or condensed moisture. Suitably dimensioned high voltage electrodes, guard circuits and surface treatment minimize such errors and thus the requirements for current level can be reduced.
Errors can also be caused by resistors which have significant voltage or temperature coefficients and by instruments which are subject to drift.
Generating and electrostatic voltmeters may develop errors due to field distortion arising from electrostatic charges on the surface of insulating materials or in space.
Overstressing of components in measuring equipment upon flashover of a test object or measuring errors due to partial discharges can occur in a measuring system having a high frequency response appreciably in excess of its response in the low frequency range. These phenomena are usually associated with the presence of stray inductance.
SECTION 2 ALTERNATING VOLTAGES
3. MEASUREMENT OF ALTERNATING VOLTAGES
3.1 General - Systems for measuring alternating voltages generally consist of ‘a measuring instrument and a voltage transformer, voltage divider, or a high impedance across which almost the entire test voltage will appear. The devices usually have high impedance to keep the loading of the test circuit within acceptable limits. Some of the more commonly used systems for measuPing high alternating voltages and the amplitudes of harmonics are described in this section.
3.2 Systems for Measuring the Amplitude of Alternating Voltages - The following systems will in most cases measure the peak, the rms or the mean value of an alternating voltage according to the type of instrument and arrangement used. Measurement of the rectified capacitance current (3.2.3) will determine the peak-to-peak amplitude and the electrostatic voltmeter ( 3.2.4 ) measures the rms value.
3.2.1 IMument Used with Voltage Transformer - A voltmeter is connected across the low voltage winding of a voltage transformer of either the inductive or capacitive type. In general, the choice of the instrument is not restricted as regards input impedance.
*
5
-- ^ .--.li_ _ ~_ ~_.. ___
IS : 8690 - 1977
3.2.2 Instrument Used with Voltage Divider -A voltmeter or an oscilloscope is connected across the low voltage arm of the divider through a measuring cable. In general, the input impedance of the low voltage measuring circuit including the measuring cable affects the divider ratio. Tn most cases, a capacitive voltage divider together with a low voltage circuit measuring the peak value of the high voltage is used.
3.2.3 Capacitor Used with a Rectlyying Device -A capacitor in series with a full wave rectifier is connected to the points between which the voltage is to be measured. The peak value of the voltage UP is related to the rectified mean current Ir flowing through the capacitor by the following relationship:
where C = capacitance of the capacitor, and f = frequency of the alternating voltage.
If the ammeter measuring the capacitor current is connected so that only alternate half cycles of current are measured, the factor 4 in the above expression becomes 2.
The method is of limited application. If the waveform has more than one peak during each half cycle, then the accuracy depends upon the type of rectifier which is used.
3.2.4 Electrostatic Voltmeter - This device is described in 2.2.3 for use with direct voltages. It can also be used for measuring the rms value of alternating ycltages in a large range of frequencies up to several megahertz.
3.2.5 Generating Voltmeter - A generating voltmeter is described in 2.2.4 for use with direct voltage. Such a’ voltmeter may also be used for the measurement of alternating voltages. By a suitable choice of frequency of the capacitance variation and its phase angle relative to the voltage to be measured the crest value or any intermediate value can be determined.
3.2.6 Instrument Used with Series Resistance - An alternating current measuring instrument is connected in series with a stable high value resistor.
3.3 Systems for Measuring the Amplitude of Harmonics
3.3.1 Oscilloscope Used with Voltage Divider - An oscilloscope is connected across the low voltage arm of a capacitor voltage divider. This method is sufficient only if the accuracies of both the recording and the subsequent analysis are high enough to ensure that the requirements are met. The method has limited accuracy especially in the case of low amplitude harmonics.
3.3.2 Instrument Used with Filter -A filter is used to suppress the fundamental component of the voltage and the rms value of the residual
6

IS : 8690 - 1977
harmonics (or with less accuracy, the peak value of the combined harmonics ) is measured with an appropriate instrument.
3.3.3 Wqve Anabser Used with Voltage Divider - This system permits separate measurement of the rms value of the fundamental and each harmonic.
3.4 Determination of Voltage Ratios and Scale Factors
3.4.1 Instrument Used with Voltage Transformer - Methods for determining the ratio of voltage transformers are covered in IS : 3156 ( Part II )-l’fi5*.
3.4.2 Instrument Used with Voltage Dividers - Methods for determ:mng the ratio of voltage dividers are discussed in 4.3.
3.4.3 Electrostatic Voltmeter and Generating Voltmeter - Measuring systems of these types can be calibrated by comparsion during parallel operation with other approved measuring systems.
3.4.4 Instrument Used with Series Resistance - Methods for calibrating systems of this type are discussed in2.4.1.
3.5 Determination of the Amplitude Frequency Response of a i Measuring System - To determine the amplitude frequency response of a measuring system, a sinusoidal voltage is applied between its input terminals. The ratio of the output to the input amplitudes is recorded as a function of frequency. The range of frequencies should extend from a low value to at least the highest of importance present in the voltage to be measured. The measurements are usually made at a low value of input voltage.
3.6 Possible Sources of Errors and Precautions - Due to the high impedance of some voltage dividers and series impedance elements, the effects of corona, ‘and stray capacitances may result in serious errors. Such errors can often be minimized by the use of suitably dimensioned high voltage electrodes and guard circuits. To avoid such effects on capacitor dividers, it is recommended that, when the capacitor is not effectively shielded, the overall series capacitance in pF be at least 30 to 40 times its overall length in metres.
Errors m5y also be caused by resistors which h&e significant voltage or temperature coefficients and by instruments which are subject to drift.
Electrostatic and generating voltmeters may develop errors due to field distortion arising from electrostatic charges on the surfaces of insulating materials.
When a high voltage series capacitor is used for voltage measurement, special protection of the measuring instruments is necessary during disruptive discharge tests. Disruptive discharge of a test object connected --
*Spceification for voltage trar.sformers : Part II Measuring voltage transfomcrs.
7 *
LI_ _._. _ ..-- -__
IS : 8690 - 1977
in parallel with measuring systems of these types results in the application of fast rising high voltage surges to the instruments which should be suitably protected.
Overstressing of components in measuring equipment upon disruptive discharge of a test object or measuring errors due to par5al discharges can occur in a measuring system having a high frequency response appreciably in excess of its response in the low frequency range. These phenomena arc usually associated with the presence of stray inductance.
SECTION 3 IMPULSE VOLTAGE
4. MEASUREMENT OF IMPULSE VOLTAGES
4.1 General -Measuring systems for lightning and switching impulse voltages must be capable of recording much higher rates of change of voltage than those used for measuring other types of high voltage. Conse- quently, the components of the system should be specifically designed to have a good transient response. Therefore, a large portion of this section deals with methods for determining the response -characteristics of measuring systems and the errors introduced by inadequate response capabilities. A circuit used for checking the response characteristic of a measuring system is shown in Fig. 1. Variations of this rechnique are possible.
It is also important that the measuring system does not load the generating system so heavily that it is prevented from developing the required high rates of change of voltage across the test object.
The induced voltages from heavy currents, or voltages outside of the measuring system are nor: taken into account when considering the response and the measuring error. Special care should be taken when the result of response measurements are applied to tests with heavy currents.
It should be realized that the voltage across the test object is rarely identical in all respects to that across the voltage divider. 4.2 Measuring System Components - Most high voltage impulse measuring systems (except sphere gaps) consist of a voltage divider, an oscilloscope or an indicating instrument or both, high voltage leads, low voltage measuring cables and earth return circuits. A high voltage damp- ing resistor may also be included. Important features of these components are explained in the following clauses.
4.2.1 Voltuge Divider - Most high voltage dividers have distributed stray capacitance to earth and to neighbouring earthed or live objects. In resistor dividers, these capacitances affect the response characteristics since they must be charged and discharged through the divider resistance; in capacitor dividers, the stray capacitances affect the scale factor of the system. *
8

IS : 8690 - 1977
e
n - To dc supplp or impulse generator b -Resistor c - Step generator d- Added vertical lead, length h e-High voltage lead, length 1, height h, above ground f - Voltage divider g- To oscilloscope
Fro. 1 THE UNIT STEP METHOD
The effect of stray capacitance can be reduced in resistor dividers by keeping the resistance as low as possible without unduly loading the gene- rating system and by using shielding electrodes at the high voltage end of the divider. These electrodes provide a capacitive path for charging the strav capacitance to earth. In capacitor dividers, the capacitance of the divider should be large enough to minimize the effect of stray capacitance.
Attention is drawn to the fact that capacitor dividers for rapidly changing impulses may have large overshoots or oscillations in their output due to parasitic inductances in the low voltage arm. Mixed dividers consist of both capacitive and resistive elements. In such dividers, the effect of stray capacitance depends on the manner in which the component parts are connected.
4.2.2 High Volta,(e Lead- The length, position and diameter of the lead connecting the high voltage terminal of the voltage divider to the high voltage terminal of the test object may all influence the performance of the measuring system. For any particular measurement, the length of the lead should bc stated and it should be within the range of lengths for which the measuring system was calibrated. When,important, its position should be approximately the same for a test as’during calibration.
9 . ~
t-
IS : 8690 - 1977
Ideally, the diameter of the lead should be large enough to prevent corona since corona on the lead can affect the performance of the measur- ing system. When corona cannot be prevented, it is better to use a small diameter lead. Vigorous streamer or leader discharges in the vicinity of the divider should be avoided.
The high-voltage lead should normally be connected directly to the high-voltage terminal of the test object and not to the impulse generator or any point on the interconnecting lead. This avoids inclusion in the measurement of the inductive voltage drop in this lead. However, when measuring full standard lightning impulses or impulses chopped on the tail, it can in general be assumed that the error due to connecting the divider to an intermediate point on the lead between the generator and test object is negligible if the condition 1/E < 0.05 ps is fulfilled. In this relationship, L is the inductance in PH of that part of the lead which is between the divider and the test object ( rough1.y 1 pH/m) and C is the effective capacitance of the test object in pF. The total length of lead between the voltage divider and the test object is then considered to be the high voltage lead of the measuring system.
4.2.3 Damping Resistor - A resistor of very low inductance may be inserted in the high voltage lead to damp oscillations. This resistor may either be located close to the divider or at the input end of the high voltage lead. In the first case the resistor is considered as a part of the divider and the system then is described as a two-component system. In the second case the system is described as a three-component system.
Whatever the position of the resistor, its value must be taken into account when determining the ratio of the system.
The resistor may have an appreciable influence on the response of the measuring system. Only two component systems are dealt with in this guide. For three component systems, reference may be made to the literature.
4.2.4 Oscilloscope - An impulse oscilloscope is essentially a well screened instrument with a high writing speed and with a single sweep time base which can be triggered in synchronism with the impulse. The high voltage supplies of the instrument should be stabilized and have practically no ripple. Means of calibrating the sweep speed and the voltage deflection sensitivity should be provided. Provision should also be made for photographic recording of the oscillograms
It is important that the deflection plates of the oscilloscope remain under the same conditions of earthing and biasing during the calibration and during the recording of the impulse voltages. Impulse oscil!oscopes are not normally equipped with amplifiers and the leads to the deflection plates are kept as short as possible to obtain good high frequency performance. Oscilloscopes with amplifiers are quite acceptable if they have a sufficiently, fast response and their voltage measuring accuracy is
10
IS : 8698 - 1937
sufficiently high. However, such instruments are especially sensitive to disturbances.
The oscilloscope is normally provided with an input connector for the coaxial cable from the voltage divider. The input impedance as measured at this connector should either match the characteristic impe- dance of the coaxial cable or be as high as possible depending on the type of the divider ( see 4.2.6 ). Sometimes, both possibilities are provided for. In either case, the input capacitance of the oscilloscope should be kept @J a minimum. The instrument may also include an internal attenuator to provide a stepwise division of voltage between the input connector and the deflection plates.
4.2.5 Peak Voltmeter - The peak voltmeter is an instrument which usually functions by charging a capacitor through rectifiers to a voltage which is proportional to the peak value of the impulse to be measured. The charge is retained on the capacitor and is read by means of a very high impedance amplifier plus a recording or indicating instrument which is incorporated into the device. Such a device has an error which depends on the shape of the impulse to be measured and should be determined experimentally. The input impedance of the instrument is subject to the same restrictions as noted for the oscilloscope. It should be noted that most instruments of this type have been found to be very subject to interference, especially when measuring impulses which are sharply chopped.
NOTE - It is important to check the overall sensitivity, the stability, the response characteristics and the sensitivity to disturbances both for impulse oscilloscopes and crest voltmeters. Methods for this checking are under consideration.
4.2.6 Coaxial Cable and Matching Devices - Any measuring cable on the low voltage side of a measurihg system should be coaxial and of the high frequency type. The dielectric loss of the insulation and the resistance of the inner conductor of the cable and that of the sheath may introduce errors. It is essential that the cables be matched at one or both ends to prevent multiple reflections which might result in measurements errors. If the cable is connected to two or more instruments at the same time and the length of the additional connecting cables is not negligible with respect to that of the main cable, a matching device should be inserted and all cables matched. When the lengths of the cables are negligible no matching devices are used and only one cable-is matched.
With resistor dividers, the cable is normally matched at the instrument end and sometimes at both ends ( see Fig. 2A). Any attenuator or connecting device inserted in the cable should match the cable impedance. When capacitor dividers are used, the cable is usually matched only at the divider end by connecting the matching impedance in series with the cable ( see Fig. 2B ). Any attenuator or connecting device inserted in the cable should have an input impedance as high as possible.
11

--- _ _ __
8690 - 1977
2A
28
Fro. 2 METHODS OF MATCHING COAXIAL CABLES
Other methods of matching may be used provided that the response of the system meets the requirements specified in 4.9.
4.2.7 Earth Returns - There are normally several points in the generating and measuring systems which are interconnected and connected to the earth terminal of the test object. It is important that the impedance bet- ween all of these points be kept to a minimum. Special care is necessary in areas of heavy earth currents, that is at the earth terminals of the test object, of the impulse generator and of any front capacitor. This reduction of impedance may be accomplished by the use of earth return conductors consisting of large non-magnetic metal sheets or by making short earth connections to a large metal sheet or mesh in or on the floor of the test area. 4.3 Determination of Voltage Ratios and Scale Factors - The scale factor of a measuring system is usually obtained by multiplying the yoltage
12

IS : 8690 - 1977
ratio of the dividers by tne sensitivity of the instrument. This sensitivity is determined by conventional methods.
Various methods are available for the determination of the ratio:
4
b)
4
by calculation of the ratio based on the measurement of the impedance of the individual components, by simultaneous measurements of the input and output voltage of the dividers, and by the use of some form of bridge circuit in which the output of the divider is balanced against the output of an accurate adjustable divider. ( This method is normally more accurate than the two former methods. )
The voltage ratio of a divider is usually determined at low voltage. For dividers of the resistor type, measurements can be made according to (b) or (c) with either alternating or direct voltage. For capacitor dividers alternating voltages are used. To check that the determined ratio is applicable within a given frequency range, it is recommended that the ratio be determined at several frequencies, for example, power frequency and 1 kHz.
In addition to the determination of the ratio it is normally necessary to check that the voltage ratio is constant within 1 percent for the region of times to crest for which the divider is intended to be used, and does not change more than 5 percent for the longest time to half value to be consi- dered. This check should be done by means of the step response or by comparison with an approved measuring system during the application of the appropriate impulse shapes.
With dividers of the capacitor or mixed type, it is generally necessary to check the overall scale factor of the complete system in the actual test arrangement to verify the voltage divider ratio when this ratio has been determined independently. This is because the presence of stray capaci- tances can affect the divider ratio and moreover, the ratio measured with a low frequency alternating voltage may differ from that applicable when measuring impulse voltages.
A suitable method for checking the overall scale factor is to make simultaneous measurements using two systems-the system to be checked and one involving either a suitable resistor divider or some other approved measuring system. In the check, an impulse voltage of the type to be measured should be used. The test may be done at a voltage level well below the rated voltage of the system being checked, thus a resistor divider or approved measuring system of relatively low voltage rating may be used. However, it should be recognised that the voltage ratio determined at low voltage may differ from that applicable at high voltage if there are voltage dependent effects in the measuring system, as for example, corona.
13
IS : 8690 - 1977
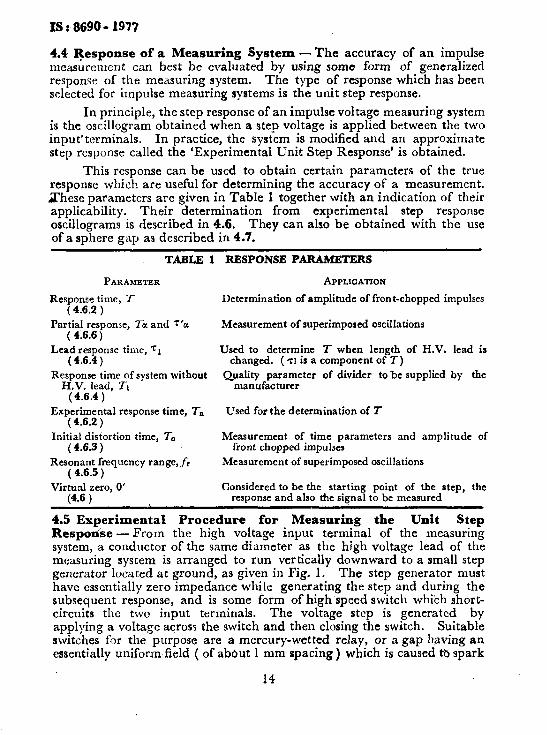
4.4 Response of a Measuring System - The accuracy of an impulse measurement can best be evaluated by using some form of generalized response of the measuring system. The type of response which has been selected for impulse measuring systems is the unit step response.
In principle, the step response of an impulse voltage measuring system is the oscillogram obtained when a step voltage is applied between the two input’terminals. In practice, the system is modified and an approximate step response called the ‘Experimental Unit Step Response’ is obtained.
This response can be used to obtain certain parameters of the true response which are useful for determining the accuracy of a measurement. Xhese parameters are given in Table 1 together with an indication of their applicability. Their determination from experimental step response oscillograms is described in 4.6. They can also be obtained with the use of a sphere gap as described in 4.7.
TABLE 1 RESPONSE PARAMETERS
PARAMETER APPLICATION
Response time, 7 Determination of amplitude of front-chopped impulses ( 4.6.2 )
Partial response, la and T’u Measurement of superimposed oscillations ( 4.6.6)
Lead response time, rr Used to determine T when length of H.V. lead is (4.6.4 ) changed. ( TI is a component of T)
Response time of system without Quality parameter of divider tobe supplied by the H.V. lead, Tt manufacturer
(4.6.4)
Experimental response time, T, Used for the determination of P ( 4.6.2 )
Initial distortion time, T,, Measurement of time parameters and amplitude of ( 4.6.3 ) front chopped impulses
Resonant frequency range,fr Measurement of superimposed oscillations ( 4.6.5 )
Virtual zero, 0’ Considered to be the starting point of the step, the (4.6 ) . response and also the signal to be measured
4.5 Experimental procedure for Measuring the Unit Step Resporise -From the high voltage input terminal of the measuring system, a conductor of the same diameter as the high voltage lead of the measuring system is arranged to run vertically downward to a small step generator located at ground, as given in Fig. 1. The step generator must have essentially zero impedance while generating the step and during the subsequent response, and is some form of high speed switch which short- circuits the two input terminals. The voltage step is generated by applying a voltage across the switch and then closing the switch. Suitable switches for the purpose are a mercury-wetted relay, or a gap having an essentially uniform field ( of about 1 mm spacing ) which is caused t& spark
14

over. Large gaps are not satisfactory for an accurate determination because they do not have a sufficiently fast rate of change of voltage nor do they have a sufficiently low impedance after spark over.
If a mercury-wetted relay is used, the voltage source can be a low direct voltage source connected through a current limiting resistor. &The output from the voltage divider will generally be too low to record with the normal impulse oscilloscope and.an oscilloscope having a higher sensi- tivity will have to be used. This oscilloscope should have response characteristics similar to those of the impulse oscilloscope normally used as otherwise erroneous information will be obtained about the behaviour of the measuring system when measuring rapid rates of change of voltage. It is also important that the normal impedance to earth from the divider output and the normal cabling arrangements be maintained when using this oscilloscope, especially when taking the response of capacitive dividers.
If a gap having an.essentially uniform field is used for the switch, an impulse having a front of 10 to 15 ps can be applied, the amplitude being adjusted to cause the gap to spark over at or near the peak of the voltage. For capacitor dividers, direct or alternating voltages may be used. The spark over voltage of the gap can be increased by Increasing the pressure; this may eliminate the need for amplification and thus permit the use of the normal impulse oscilloscope.
It is recommended that the experimental procedure be carried out for several lengths of the high voltage lead covering the range which is likely to be used in practice.
It is also recommended to take the response oscillogram with several time sweeps ( see 4.6.1).
4.6 Determination of the Response Parameters from Step Response Oscillograms -,Typical response oscillograms obtained by the unit step method are shown in Fig. 3. In many, the initial part is either founded as in Fig. 3C or shows -bumps, or oscillations as in Fig. 3F to 3H. This initial region. is referred to as the ‘toe’ region and its shape is important when analysing front-chopped oscillograms.
In order to establish the response parameters, a virtual zero point 0’ has to be determined; a procedure for doing this is given in 4.6.1. This virtual zero 0’ is considered to be the starting point of the step, the response, and also of the signal to be measured in a practical test.
4.6.1 Determination of the Viriual Starting Point 0’ and Unit Amplitude - The virtual starting point 0’ of a step response oscillogram is defined as the intersection of the time axis and a straight line drawn as a tangent to the steepest portion of the front of the response.
In the case of a response with oscillations on the front, a mean curve is drawn through the oscillations and used to determine the straight line. In the case of significant initial distortion as shown in Fig. 3F, 3G and 3H,

IS o 8690 - 1977
3 A
--$$$fTq- __. j
n\,
r,
3 c
..k.. ._-.,_
cz I
3E
I ----_
3G 3H
FIG. 3 TYPICAL OSCILLOGRAMS OBTAINED BY THE STEP METHOD
16

IS : 6690 - 1973
t&s distorted part is neglected when drawing the tangent and the virtual zero point is determined as above.
It is self-evident that the determination of 0’ is to a certain extent arbitrary, particularly in the case of responses having large initial distortion.
The level corresponding to unit amplitude must also be determined. In IS : 2071 ( Part III )-1976*, this amplitude is defined by the help of the scale factor of the system (see 4.11.1).
A simple but sufficiently accurate method for the determination is to take the level to which the response approaches or around which the response oscillates as unit amplitude. This may require, the use of different sweep speeds.
’ To clearly determine this reference line, it may be desirable to eliminate oscillation in the step response. This can be done by inserting a resistor at the junction of the measuring system lead and the switch used for generating the step.
4.6.2 Determination of the Response Time, T - To determine the response time T, the, areas Ta, Tp, etc, are determined as the areas enclosed between the step and the unit step response, both of which are assumed to start at 0’. In the case where there is an initial deviation between the response oscillogram and the straight line used to determine 0’, such as shown in Fig. 3C to 3H, this initial deviation is neglected and the straight line is considered to represent the response for that part.
In the experimental circuit for determining the response parameters, a vertical lead has to be used to connect the horizontal divider lead to the step generator. An approximate step response T,, called the ‘ Experimental Unit Step Response ’ is obtained and equals:
Tn = Ta - Tp + Ty ..*... The response time T is determined from Tn by correcting for the
effect of the vertical lead. The response time T is given by:
T=T,,+rv(Lz 5
where rv = the propagation time along the vertical lead; rv = h/c
where It is the length of the vertical lead and c is the velocity of propagation of an electromagnetic wave ( 300 m/Cts 1
5 = the characteristic impedance of the vertical lead. For practical purposes it is sufficiently accurate to use the impedance of the horizontal lead given by:
where d is the diameter of the lead,
-Methods of high voltage testing: Part III Measuring devkes (/irJt rern3itm ),
17 *

Is t 8699 - 1977
p. is the permeability of free space = 4x x lo-’ H/m z. is the permittivity of free space = 8.85 x lo-l2 F/m R e the resistance between the top of the divider and ground
and is infinite for capacitor dividers and for mixed dividers with series resistance.
The term rey ( 1 -$) P re resents the correction for the effect of the
vertical lead.
4.63 Determination of the Initial Distortion Time, To - The initial distortion time To is defined as the area between the unit step response and the straight line used to determine 0’, and is taken from the moment the response first deviates from zero up to the moment when’it meets the straight line ( see Fig. 3F to 3H ).
4.6.4 Determination of the Response Time, Tt, of’ the System Without High Valtagt Lead - The response time, Tt of the system without high voltage lead is determined from:
where
71 = l/c
71 = propagation time along horizontal lead, = 1/c, where 1 is the length of the horizontal lead [for the
significance of the other symbols ( see 4.6.2 ) 1, and
fi = lead response time.
NOTE - In Appendix A a method is given for estimating a value for 2-t for a simple resistor divider.
4.6.5 Determination of the Resonaq Frequency. Range - The resonant fre- quency range is defined as the range extending from the resonant frequency visible on the step response taken with the longest practicable lead to about l-5 times the frequency which is visible when the shortest lead is used. Oscillations ion the front of the response oscillogram as shown in Fig. 3E are neglected in this determination.
NOTE -When determining the resonant frequency range, it may be found desirable to take two additional step reponres with all series damping resistors in the divider rhort-circuited in order to increase the amplitude and duration of the oscillations.
4.6.6 Determination of Partial Response Time, la - The partial response time, Ta, ,is normally given by the area between the unit step shifted to the p&t 0’ and the normalized unit step response curve up to the instant when the response first reaches unit amplitude ( see Fig. 3 ).
18

1s s 8690 - 1977
This is the quantity which is related to the effective steepness of the step response and is indicative of the ability of the measuring system to reproduce oscillations superimposed on an impulse voltage. In particular cases, a different parameter T’u is used ( see 4.9.3 and Fig. 8 ).
4.7 Determination of the Response Parameters by the Sphere Gap Method- The sphere gap to be used in this method is a vertical one having 250 mm diameter spheres. It must meet the requirements laid down in IS : 1876-1961* and shall be adequately irradiated. The sphere gap is used in two different ways for the determination of the step response parameters. For t!le determination of T and ‘T;, the voltage/time charac- teristic of the gap is used, whereas for determining Ta, the gap is used as a step generator. Note, however, that using the gap as a step generator is not satisfactory for determining T and It-the gap sparkover is too slow.
4.7.1 Determination of the Response Time, T- The sphere gap mentioned in 4.7 when set to a spacing of 60 mm, has an accurately known voltage/ time curve for linearly rising voltages of negative polarity. The curve is reproduced in Fig. 4 in a form which enables it to be used for determining the response time T of a measuring system.
To determine the response time, the measuring system is used to measure one or more points on the curve of Fig. 4. The difference bet- ween the value given by the curve and the measured value of sparkover voltage, corrected to standard atmospheric conditions (see IS : 1876-1961* ) is inserted .in the following formula to obtain the response time or tbe system:
I= y(ns)
where AU ~=1 the difference in kilovolts between the sparkover voltage
U given by Fig. 4 and the measured value corrected to standard atmospheric conditions, and
S = the measured rate of rise of voltage in kilovolt per nanosecond.
If the measured sparkover voltage is lower than that given by Fig. 4 the response time is positive; if it is higher, the response time is negative.
In’order to achieve the greatest accuracy with this method, the following procedure is recommended.
4.7.1.1 The sphere gap should initially be set to a spacing of 70 to 75 mm and the impulse generator adjusted to produce across it, negative impulses which rise as linearly as possible. The critical part of the recor- ded voltage rise is the last 40 percent before the sparkover of the gap ( as
Wethod for voltage measurement by meana of sphere-gaps (one sphere cartbed).
19

ls : 8690 - 1977
in Fig. 5A ) unless this portion is all above 160 kV. In this latter case, the critical part extends down to 160 kV as in Fig. 5B ( the approximate value of the 50 percent sparkover voltage of the gap when set to a spacing of6Omm).
Fm. 4 SPHERE CAP SPARKOVER VOLTAOE AS A FUNCTION OF STEEPNESS (VALID FOR NEGATIVE VOLTAGEI)); SPHERE DIAMETER 250 mm, SPACING 60 mm, AIR TEMPERATURE 2O”C, BAROMETRIC
PmzssuRE 1013 rnB_
20

.
IS : 8690 - 1977
5B FIO. 5 DETERMINATION OF STEEPNESS WHEN USING SPHERE
GAP METHOD
4.7.1.2 Three impulses should be recorded with the gap set at this larger spacing without any change in the generator settings or controls. The rate of rise% determined for each of the oscillograms and the mean of the three rates is used as S in the above equation for T. The rate of rise is the slope of the best fit straight line for the critical part of the voltage rise described in 4.7.1 .l.
4.7.1.3 The gap is then set to the 60 mm value. Three. more oscillograms are recorded without any change in the generator settmgs or
21
.
IS : 8690 - 1977
controls. The mean of the three recorded sparkover voltage is corrected to standard atmospheric conditions and AU determined using Fig. 3 in conjunction with the previously determined value of S. is then calculated using the equation for T.
The response time
4.7.1.4 The procedure is repeated with two other appreciably’ different rates of rise of voltage to provide three determinations of T.
4.7.1.5 The average of the three response times obtained is the response time of the system and the spread of the three values is indicative of the accuracy of the determination.
NOTE -For the use of the method described above it is important that the following requirements are fulfilled:
4
b)
The gap setting, the irradiation of the gap, and the correction for the atmospheric conditions must be properly done.
4
The scale factor applicable to the measuring system must be accurately known. The error in the response time determination will be equal to the percentage error in the scale factor multiplied by the time to sparkover. It must be possible to determine the steepness of the applied voltage from the output of the measuring system, that is, the applied voltage must be linearly rising for a sufficiently long time to enable the output voltage to follow the input voltage.
In practice, the sphere gap method is not usually applicable to large measuring systems since they do not comply with item (c) above.
4.7.2 Detbmination of the Partial Resjonse Time, Ta or I’u - To determine the partial response time, ‘lir or T’a the same gap as above is used but the setting is no longer critical. To obtain the steepest voltage collapse and to reduce the influence of the impulse generator, it is recommended that a resistor of the order to 10 kn be inserted in the lead from the impulse generator to the sphere gap at the gap end of the lead. Also, it is desirable that the voltage across the gap has essentially zero rate of rise at the time that the gap sparks over which can be achieved by chopping an impulse at or near the peak. The resulting record of the voltage collapse can be treated as a step response for the determination of Ta or T’a. The value obtaine< will be somewhat larger than that obtained by the unit step method, but it is sufficiently accurate for most purposes.
4.7.3 Determination of the Response Time, Ti of the System Without High Voltage Lead - The response time Tt is calculated from the value of T determined above in the same manner as described in 4.6.4.
4.7.4 Determination of the Resonant Frequency Range - The resonant frequency range is determined in the same manner as described in 4.6.5 using the gap as a step generator as in 4.7.2.
4.8 Relation of Response Parameters to Measuring Errors - There are three response parameters, response time T, initial response time Ta, and initial distortion time TO, which can cause errors in the measurement of amplitude and time parameters of impulse voltages. n
22

_.._.._____. ._
b)_.,_ .,, . _ ̂ _. ..______..___...-,__- _ _.~ -.-. .--. .- ..- -.-.1_--.
IS I 8690 - 1977
4.8.1 Errors Caused by Resjonse Time, I - The response time T affects the measurement of the time parameters and the amplitude of front-chopped impulses.
According to the definition of the response time given in IS : 2071 ( Part III )-1976*, the response of the system to a ramp, after a certain time, can be regarded as following the ramp with a delay I, equal to the response time. At the moment of chopping, the difference 6 between the applied and measured voltage then becomes:
6=S.T . . . (1)
It can also be shown, as explained in Appendix B, that the same relation can be derived considering the response time determined from the unit step response.
Equation (1) is approximately valid under the following conditions: a) The output voltage form is linear and parallel to the input voltage
form. b) A virtual zero point of the response is defined according to 4.6.1,
this point is also considered as the starting point for any voltage to be measured. I
c) A measure of the response time is used as defined in 4.6.2. d) The initial distortion time i?,, as defined in 4.6.3 is sufficiently
small.
More general relationships are illustrated in Fig. 6A for a linearly rising front chopped impulse, the Fig. 6B for a non-linearly rising front chopped impulse and in Fig. 6C for a full impulse. Fig. 6D illustrates a case where a distortion occurs before the crest value is reached; this may be an effect of the initial distortion of the response. It also illustrates how the instant of the measured crest value does not coincide with the moment the chopping occurred which may result in a different error than the one given by equation (1). However, this phenomenon usually can be neglec- ted and, for front chopped impulses; the measuring error 6, defined as the difference between the crest value of the applied voltage and the measured one becomes approximately:
Be&. l-
where SL is the steepness of the applied voltage prior to chopping.
Similarly, the error 6t in the measured time to chopping for a linearly rising applied voltage becomes:
6t = T
For other types of applied voltage, no simple rules can be given.
The error in the measurement of the peak value of full impulses cannot be determined according to the formula since the steepness is zero
*Methods ofhigh voltage testing: Part III McastGng devices (&f reulrion ). I
23

IS : 8690 - 1977
at the peak. In fact, an amplitude erroroccurs but the error becomes much less than the one when the impulse is chopped on the front.
The delay, as indicated in Fig. 6C, also gives an error in the measurement of the time parameters of the full impulse. usually occurs in the measurement of the front time.
The greater error
The errors in crest value and in time parameters can be evaluated by applying Duhamel’s theorem to the response oscillogram and the assumed form of the applied voltage.
utt1
u ItI
I
/
IT 2L I t
u(t)
6A
u(t)
f-=-y h”, 6C ’ 6D
Fro. 6 RESPONSE TIME’ AND MEAWRINO ERRORS IN PRACTICAL MEASURJZMEIWS
4.8.2 Errors Caused by Initial Response Timc,Tu - The impulse to be measured may have superimposed oscillations. The accuracy with which these are recorded is governed by the steepness of the step response of the measuring system. IS : 2071 ( Part II )-1974* requires that the amplitude of these oscillations does not exceed 5 percent of the measured impulse crest value. To comply with this requirement it is necetsary to ensure that the system reproduces these oscillations correctly.
*Methods of high voltage testing: Part II Tert procedures (J’%J# rwinbn ).
24
IS : 8690 - 1977
In general, the ratio cc of the actual to the measured amplitude of these oscillations is given by:
cr”d 1 + (2 rrf Ta)2 . . . (2) wheref is the frequency of oscillation.
4.8.3 Errors Caused by Initial Distortion Time, To - The initial distortion time T, can cause additional errors in the measurement of front chopped impulses.
No guidance is given concerning corrections for these errors but they can bc made negligible by restricting the magnitude of T, (see 4.9.1).
If 7-0 does not meet the requirements of 4.9.1 the measuring system preferably should be modified.
4.9 Criteria Relating to Corrections - Measurements of the basic I impulse shape and peak value can be sufficiently accurate provided they meet the conditions outlined in 4.9.1.
In certain cases corrections may be made as described in 4.9.2.
4.9.1
a)
b)
c)
Conditionsfor Measurements to be SuJ’iciently Accurate Without Corrections
The response time Tmust be within the limits specified in IS : 2071 .( Part III )-1976*. In IS : 2071 (Part II)-1974t, the amplitude of oscillation on the peak of the impulse voltage is restricted to 5 percent. The maxi- mum frequency fmax which may reasonably occur in an impulse voltage test circuit is determined by its dimensions and given in IS : 2071 (Part III)-1976*. The requirements that oscillations up to this frequency should be discernible means that they should have an amplitude of not less than about 1 percent on the oscillqgram. This leads to the following requirement, based on equation (2):
Ta< 2 xfmax
. . . (3)
If the highest recorded frequency f meets the following requirement
then its amplitude is measured wi$h sufficient accuracy and no correction3 are necessary. When an impulse voltage is sharply chopped, the chopping can be considered as the addition to the unchopped impulse of a negative step plus a negative ramp having the same shape as the original impulse at the instant of chopping. The negative ramp cancels the original rate of rise and the negative step produces the sharp
*Methods of high voltage testing : Patt III Measuring devices (first revision ).
*Methods of high Joltage testing: Part II Test procedures (first revision ).
25
I-
IS t 8690 - 1977
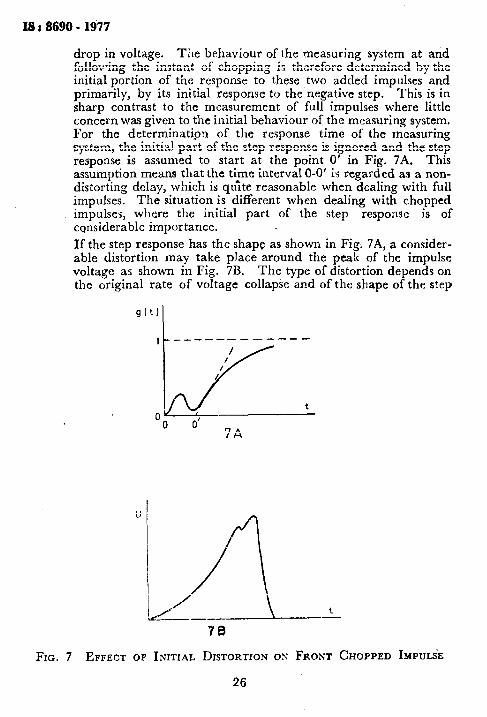
drop in voltage. The behaviour of the measuring system at and following the instant of choppin g is therefore determined by the initial portion of the response to these two added impulses and primarily, by its initial response to the negative step. This is in sharp contrast to the measurement of full impulses where little concern was given to the initial behaviour of the measuring system, For the determination of the response time of the measuring system, the initial. part of the step response is ignored and the step response is assumed to start at the point 0’ in Fig. 7A. This assumption means that the time interval O-O’ is regarded as a non- distorting delay, which is quite reasonable when dealing with full impulses. The situation is different when dealing with chopped impulses, where the initial part of the step response is of considerable importance.
If the step response has the shape as shown in Fig; 7A, a consider- able distortion may take place around the peak of the impulse voltage as shown in Fig. 7B. The type of distortion depends on the original rate of voltage collapse and of the shape of the step
U / /IT!_ kc_--_ i -
FIG. 7 EFFECT OF INITIAL DISTORTION ON FRONT CHOPPED IMPULSE
26
IS : 8690 - 1977
response during the interval O-O’, that is, the initial distortion time To,. Caution should be exercised in the evaluation of such oscillograms. If a correction has to be applied using the response time as defined in this document, the highest peak should be considered as the measured value :
In order to reduce the errors caused by the initial distortion time To to negligible proportions the following requirements should be met:
7-O < 0.005 cr, . . . (5)
If TO > 0,005 Tc, the measuring system preferably should be modified.
4.9.2 Conditions for Correcting Measurements and Limits of Application of the Corrections
a) Correction of the peak value of a front chopp,ed impulse is based on the response time T. In the case of impulses chopped on the front after relatively short times, the measuring system may not fulfil the requirements of IS: 2071 (Part III)-1976*. For such cases, with agreement between the parties involved, an approxi- mate correction of the measured peak value may be made according to:
Ucorr = Umeas + SL . T
where u corr = the corrected peak value,
&l,*, = the measured peak value, anct
SL. = the slope of the measured impulse prior to the chopping.
When corrections for response time are to be made, a test measurement should be made using two different lead lengths for - the measuring system. The shorter one should be the length which it is desired to be used and the longer one should preferably be long enough to bring the response time to within the required limits, or at least long enough to ensure that the two versions of the measuring system have appreciably different response times. Each of the measurements should then be corrected for the appropriate response time and if the correct values agree within say 2 or 3 percent and the correction does not exceed 20 percent, it can generally be assumed that the method of making the correction is valid.
The only time parameter measurements which can normally be corrected are those in which the two points defining the parameter are located on a portion of the impulse which has a
*Methods of high voltage testing: Part III Measuring devices (firsfrwision). .
27
LS : 8690 - 1977
constant slope. This generally means that only measurements o G can safely be corrected. Z-, is the rise time for a linearly rising front chopped impulse [see IS: 2071 ( Part II)-1974* 1. The correction is made by adding the response time of the system algcbraica!iy to the measured value of the time parameter. When suc11 corrections are made, their validity should be checked in the same manner as for corrections to amplitude measurements.
In all casts where measured values are corrected, it is important that every precaution bc taken to ensure that the cor- rection is accurate and justified. Even then, the uncorrcctcd results should be reported together with the corrected ones.
If the criteria given in equations (5) and (6) are not met, the true amplitude of the oscillations is then obtained by multiplying the recorded amplitude of the oscill:ltion by CL, wbcre GC is given by equation (6), except in cases (i) and (ii) below:
a = d 1 + ( 27rJt‘Ta )’ . ..(6)
wherefis the frequency of the oscillations.
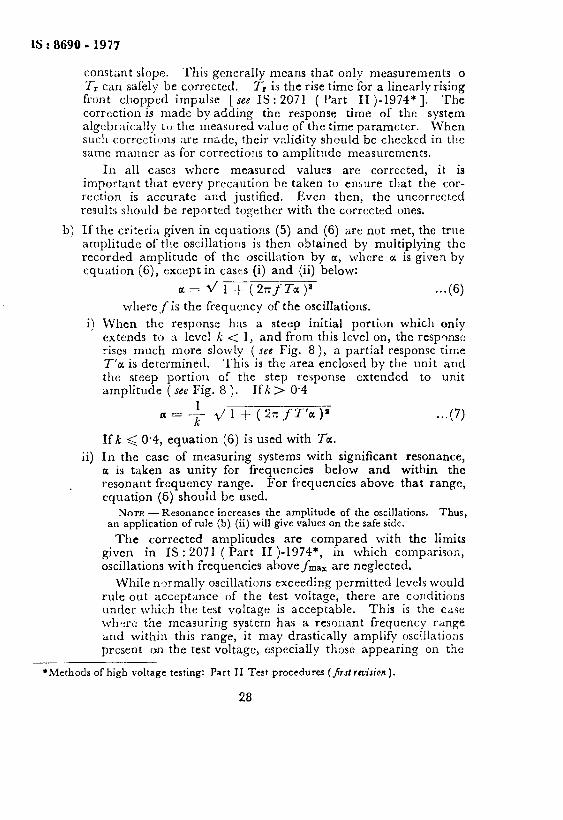
i) When the response has a steep initial portion which only extends to ;t level k < 1, and from this level on, the response rises much more slowly ( see Fig. 8), a partial response time T’u is determined. This is the area enclosed by the unit and the steep portion of the step response extended to unit amplitude ( see Fig. 8 ). Ifk > 0.4
a=-$ 2/1+(2xfT’a)’ . ..(7)
Ifk < 0.4, equation (6) is used with Ta.
ii) In the case of measuring systems with significant resonance, u is taken as unity for frequencies below and within the resonant frcqucncy range. For frequencies above that range, cquati,on (6) should be used.
-.-
Nom -Resonance increases the amplitude of the oscillations. Thus, an application of rule (b) (ii) will give values on the safe side.
The corrected amplitudes are compared with the limits given in IS : 2071 ( Part II )-1974*, in which comparison, oscillations with frequencies above_/&, are neglected.
While normally oscillations exceeding permitted levels would rule out acceptance of the test voltage, there are conditions under which the test voltage is acceptable. This is the case wh?rc the measuring system has a resonant frequency range and within this range, it may drastically amplify oscillations present on the test voltage, especially those appearing on the
l ,Mcthods of high voltage testing: Part II Test procedures (jir~:rtuvisi~n).
28
IS : 8690 - 1977
lower portion of the front. If it can be shown by suitable tests that the amplitudes of the oscillations on the test object are negligible, the oscillogram can be considered acceptable pro- vided the presence of the oscillations does not prevent an accurate evaluation of the shape and amplitude of the im- pulse. For example, if the impulse is chopped at or near the peak, the recorded oscillations must have died out before this point is r?ached.
If the oscillations do not prevent an accurate evaluation, a smooth curve shall bz drawn through them to determine the amplitude and shape of the impulse.
A procedure to determine if the oscillations recorded on the test voltage oscillogram are present on the voltage across the test object is described in Appendix C.
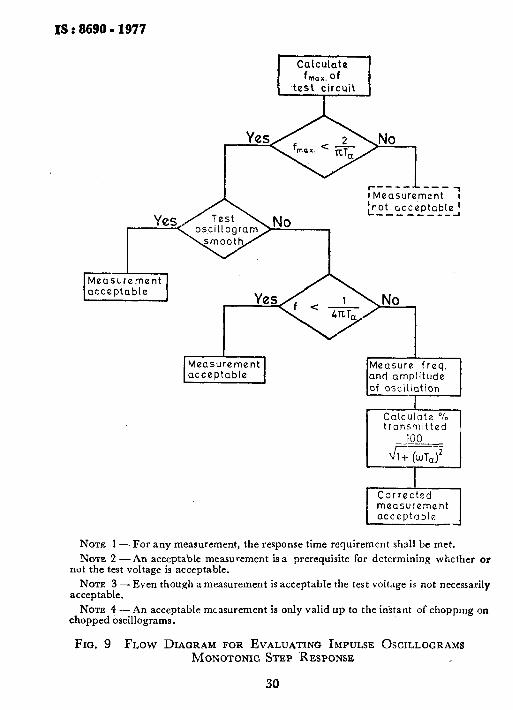
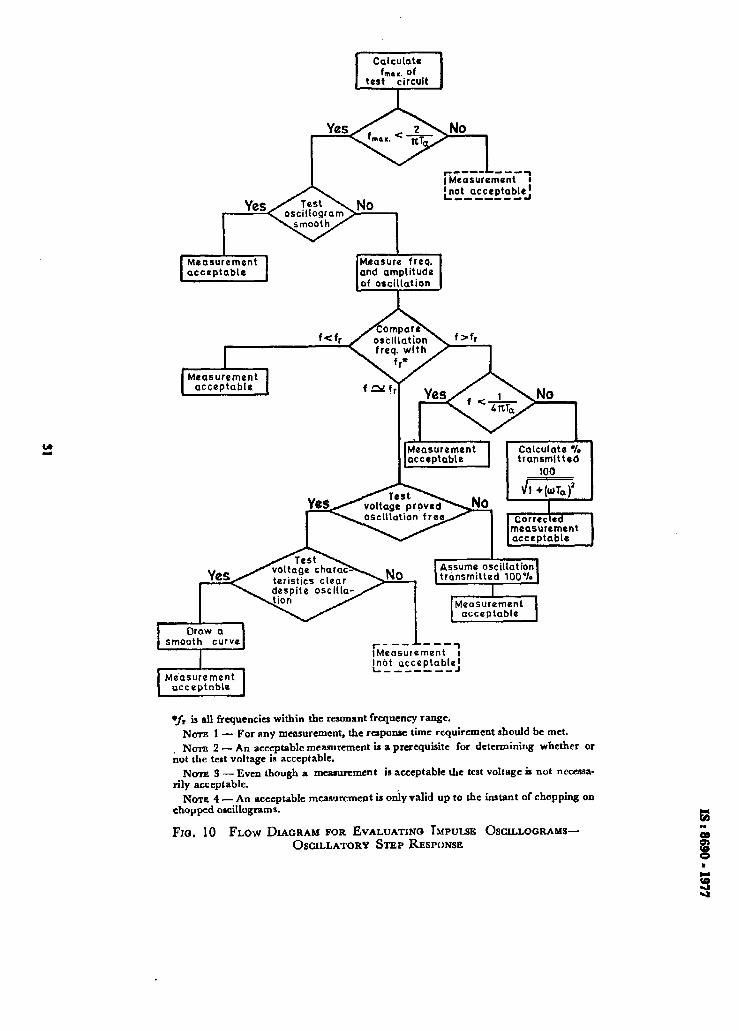
The above procedures concerning oscillations are illustrated by the flo~v chart diagrams in Fig. 9 and 10.
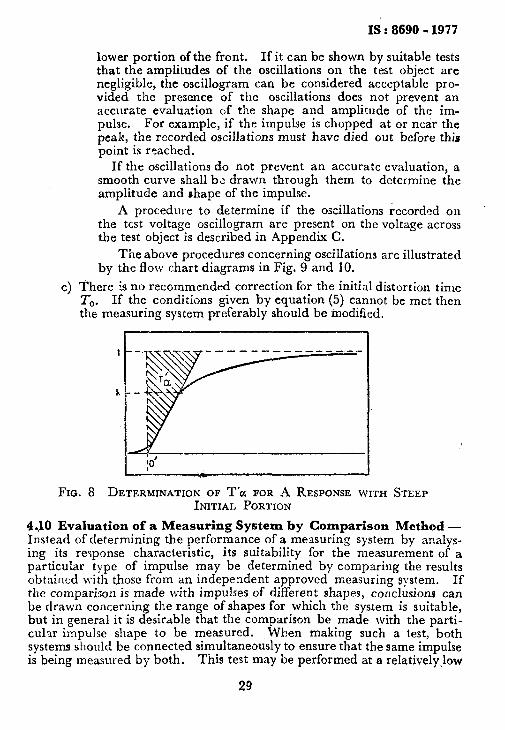
c) There is no recommended correction for the initial distortion time ‘1-,. If the conditions given by equation (5) cannot be met then the measuring system preferably should be modified.
FIG. 8 DETERMINATION OF T’a FOR A RESPONSE WITH STEEP INITIAL PORTION
4.10 Evaiuation of a Measuring System by Comparison Method - Instead of determining the performance of a measuring system by analys- ing its renponse characteristic, its suitability for the measurement of a particular type of impulse may be determined by comparing the results obtained with those from an independent approved measuring system. If the comparison is made with impulses of different shapes, conclusions can be drawn concerning the range of shapes for which the sys.tem is suitable, but in general it is desirable that the comparison be made with the parti- cul3r impulse shape to be measured. When making such a test, both systems should be connected simultaneously to ensure that the same impulse is being measured by bot.h. This test may be performed at a relatively_low
29
IS : 8690 - 1977
Calculate f rn~X. of
test circuit
Measurement and amplitude of oxcitiation
I Calculate % transmitted
iii0 -.--___
Jl++-GaT
Corrected measurement acceptable
NOTE 1 -For any measurement, the response time requirement shall be met. NOTE 2 -An acceptable measurement is a prerequisite for determining whether or
not the test voltage is acceptable.
NOTE 3 -Even though a measurement is acceptable the test voltage is not necessarily acceptable.
NOTE 4 -An acceptable measurement is only valid up to the instant of choppmg on chopped oscillograms.
FIG. 9 FLOW DIAGRAM FOR EVALUATING IMPULSE OSCILLOCRAMS MONOTONIC STEP RESPONSE
30
. J:
Calculate fin... of I test circuit
Yes No
L,-,q ~ZuLmont pot acceptable I
m-s-,,--.J
Measurement rMeasure freq. and amplitude of oscillation
I
Measurement
measurement
smooth curve
Measurement
Assume oscillation transmitted 100%
I Measurement
acceptable
1 ---1 ~~~s~rement
i F6’ acceptable, -------
l f, is all frCquencicS within the resonant frequency range.
Noxzl- For any measurement, the rcrponsc time requirement should be met.
NOTE 2 - An acceptable measurement is a prerequisite for determining whether or hot the test voltage is acceptable.
NOTE S - Even though a measurement is acceptable the test voltage is not neceasa- rily acceptable.
NOTE 4- An acceptable mcasurcmcnt is only valid up to the instant of chopping on chopped ouillograms.
FIO. 10 FLOW DIAGRAM FOR EVALUATING TMPULSB OSCXLLOGFUMS- OSCILLATORY STEP RESPONSE

As in the Original Standard, this Page is Intentionally Left Blank
IS : 8690 - 1977
voltage ievel so that an approved system of much lower rating than that being tested may be used. Note that there is a possibility that there may be c&rpling beiween the two systems and precautions should be taken tb ensure that this does not occur.
4.11 Various Sources of Errors and Precautions
4.11.1 Variation of Divider Ratio for Long Impulse Duration-The determination of the impulse voltage duration for which the scale factor of the measuring system is valid is particularly important in the case of capacitor voltage dividers. For such dividers a shunting resistance across the low voltage capacitor of the divider can cause an apparent change in scale factor with duration of the applied voltage; therefore, it has to be ensured that, the time constant of the low voltage arm of the divider is sufficiently large compared with the duration of the longest voltage to be measured.
The effective variation of ratio may also produce an error in the determination of the response time of the system as the reference line cannot be determined without ambiguity.
For resistor dividers, it is necessary to ensure that the temperature rise of the resistor is low enough to prevent any appreciable change in the resistance value during the duration of the impulse.
4.11.2 Proximity Efects - Both the voltage ratio and the response time of a voltage divider may be affected by changes in the capacitance to earth. It is important that the determinations of response times and divider ratios be made with the apparatus in a typical working position relative to other objects.
The minimum clearance which shall be maintained between a measuring system and other objects which are at either earth or high potential should be determined [see IS: 2071 ( Part III )-1976*]. One method of doing this is to investigate the effects on the step response when a vertical earth plane, for instance, is moved closer and closer to the voltage divider. In the case of resistor dividers, when the earth plane is too close, the shape of the step response will be affected because the stray capacitances to earth are augmented. The change in shape might not be readily apparent from a visual inspection of the response so the effect on Ta and It should be used as an indication of when the minimum clearance has been reached.
This method is not too reliable for dividers involving capacitors because the stray capacitances to earth may affect the scale factor rather than the response characteristics. For such dividers the scale factor should be measured or compared with that of some other system while the proximity effect is being investigated. This may be done by making simultaneous measurements with both systems as the earth plane is being moved in towards the divider of the system being investigated.
*Methods of high voltage testing: Part III Measuring devices (&t mvision ).
33 t-
IS : 8690 - 1977
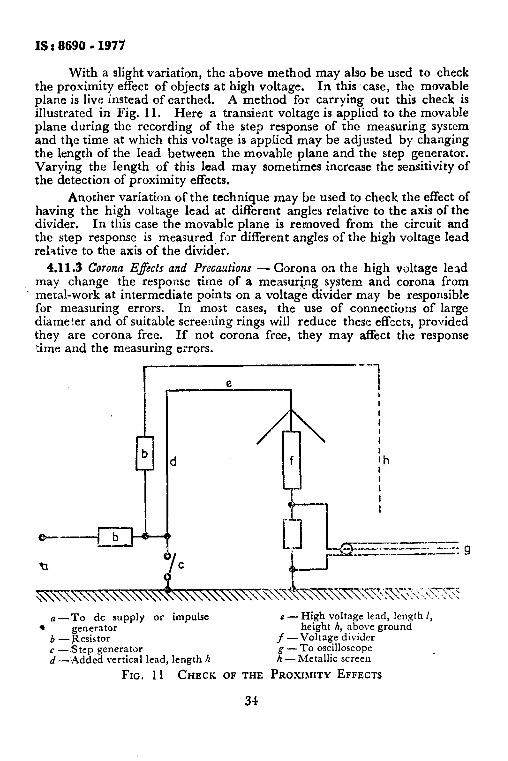
With a slight variation, the above method may also be used to check the proximity effect of objects at high voltage. In this case, the movable plane is live instead of earthed. A method for carrying out this check is illustrated in Fig. 11. Here a transient voltage is applied to the movable plane during the recording of the step response of the measuring system and the time at which this voltage is applied may be adjusted by changing the length of the lead between the movable plane and the step generator. Varying the length of this lead may sometimes increase the sensitivity of the detection of proximity effects.
Another variation of the technique may be used to check the effect of having the high voltage lead at different angles relative to the axis of the divider. In this case the movable plane is removed from the circuit and the step response is measured. for different angles of the high voltage lead relative to the axis of the divider.
4.11.3 Corona Efects and Precautions - Corona on the high voltage lesd may change the response time of a measur@g system and corona from
*’ mera!-work at inrermediate points on a voltage divider may be responsible for measuring errors. In most cases, the use of connections of large diameter and of suitable screening rings will reduce these effects, provided they are corona free. If not corona free, they may affect the response time and the measuring errors.
e - High voltage lead, length I, height h, above ground
f-Voltage divider ~-TO oscilloscope
d-added vertical lead, length h h -Metallic screen
FIG. 11 CHECK OF THE PROXIMITY EFFECTS
_~~~~~~~~~~__ .---~ , L... _ _ _ ___- ._.. _ ____-l_-----
IS : 8690 - 1977
4.11.4 Disturbance Level Check - Spurious indications on instruments or oscillograph may occur due to large currents circulating in the earthing system ( especially in the sheaths of measuring cables ), or to the influence of stray fields on either the measuring. circuit or the instrument itself.
One method for investigating the disturbance level caused by current in the sheath of a measuring cable is to short-circuit the input end of the cable, leaving the sheath connected to the earth terminal of the voltage divider and without changing any other connections in the circuit as in an actual test. If an impulse of about 60 to 100 percent of the appropriate test value is generated in the test circuit, the deflection on the instrument should be negligible, say 1 to 2 percent, for the system to be considered free of disturbance. If an appreciable deflection is obtained, the test may be repeated with the cable matched at its input end instead of being shorted. If this eliminates the deflection then the system may generally be consi- dered satisfactory. It should be pointed out that neither of these approaches gives a true indication of the disturbance level and the dis- turbance recorded may be exaggerated. However, if the disturbance is significant as shown by these tests, efforts should be made to eliminate it.
To reduce the dibturbance level, loops in the layout of the earthing system should be eliminated or reduced to the smallest practicable dimen- sions. It is also possible in some cases to effect an improvement by using double shielding on the measuring cable and by improving the shielding and isolation of the measuring instrument.
To reduce magnetic coupling measuring cables should whenever possible be located away from conductors carrying heavy currents.
NOTE -Other means of reducing disturbances are under consideration.
Flashover phenomena may create measuring errors or oscillations.
In a system whose high frequency response appreciably exceeds its response in the low frequency range, two phenomena may occur:
a) flashover of test object may result in overstressing the measuring equipment, and
b) extensive partial discharges may produce measuring errors.
These phenomena are usually associated with the presence of stray inductances in underdamped capacitive circuits. Heavy overshoot on an experimental step response is often indicative of this condition.
Excessive voltage drops may occur even on short’ lengths of ground conductor. These may give rise to measuring errors or may cause spurious oscillations due to sparking.
In the analysis of experimental step responses, maccuracy in locating the level of the standard unit step can be a major source of error in determining the various response times,
35

IS : 8690 - 1977
SECTION 4 IMPULSE CURRENT
5. MEASUREMENT OF IMPULSE CURRENTS
5.1 General - Measuring systems for impulse currents must be capable of handling very high currents- of the order of tens or even hundreds of thousands of amperes. Because of the very rapid rates of change of current involved, the inductance of the impulse current circuit shall be kept low and careful attention paid to the design of the components to ensure this. It is also important that the insertion of the measuring system into the test circuit should not introduce unnecessary impedances. 5.2 Commonly Used Measuring Systems - The fcllowing are typical systems used for measuring impulse currents:
a) Shunt with oscilloscope or peak reading instrument, and b) Current transformer with oscilloscope or peak reading instrument.
5.2.1 Measuring System Components -Many of the components of an impulse current measuring system are the same as those used in voltage measuring svstems and they sFould meet the same reauirements as outlined in 4.2. systems:
a)
b)
T’hi following components are specifically fbr current measurmg
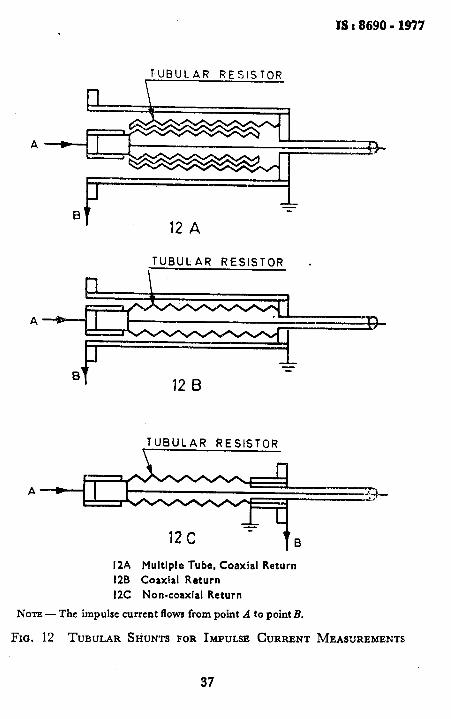
Shunt - The most commonly used form of shunt is that having a tubular construction. Figure 12 shows the construction features of some examples of this cipe of shunt. The resistance material used should be non-magnetic. Current transformers - Specialised wide-band current transformers may be used for the measurement of short duration impulses. They are advantageous over shunts in so far as they permit isola- tion from earth and hence may be arbitrari!y located in the current circuit. No guidance is given here on the design features of such components.
5.2.2 Step Response of Current Measuring Systems-The response time of a current measuring system shall be determined experimentally, however, the method outlined below for calculating the response time to tubular shunts may prove useful in design.
5.2.2.1 Response time of tubular shunts - Tubular resistance shunts usually have an aperiodic type of step response and if the actual zero is used the response time is given approximately by:
l- r.5 =--
where I = the response time in s,
PO = the absolute permeability in 4 x. IO-’ Vs/Am, d = the wall thickness of resistance in m, and p I= the resistivity of the tube material in Q m.
36 8
IS : 8690 - 1977
TUBULAR RESISTOR
TUBULAR RESISTOR . ,
TUBULAR RESISTOR
I2A Multiple Tube, Coaxial Return
12B Coaxial Return
I2C Non-coaxial Return
NOTE - The impulse current flows from point A to point B.
FIG. 12 TUBULAR SHUNTS FOR IMPULSE CURRENT MEAS'JREMENTS
37
IS : 8690 - 1977
However, due to the use of the virtual zero 0’, the response time is determined more accurately from:
NOTE -The response of tubular shunts may be improved by including a compensating network in the part of the shunt which provides the output voltage signal. Such a compensating network may be magnetically coupled with the current carrying part of the shunt.
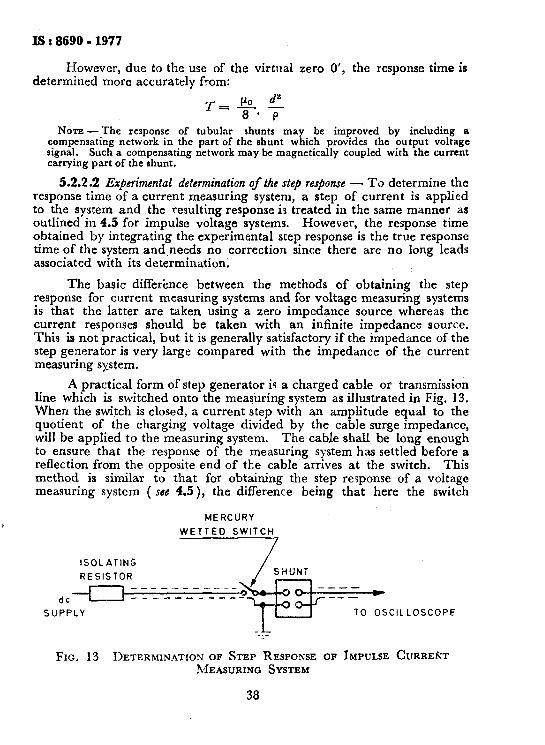
5.2.2.2 Experimental determination of the step response - To determine the response time of a current measuring system, a step of current is applied to the system and the resulting response is treated in the same manner as outlined in 4.5 for impulse voltage systems. However, the response time obtained by integrating the experimental step response is the true response time of the system and,needs no correction since there are no long leads associated with its determination.
The basic differknce between the methods of obtaining the step response for current measuring systems and for voltage measuring systems is that the latter are taken using a zero impedance source whereas the current responses should be taken with an infinite impedance source. This is not practical, but it is generally satisfactory if the impedance of the step generator is very large compared with the impedance of the current measuring system.
A practical form of step generator is a charged cable OP transmission line which is switched onto the measuring system as illustrated in Fig. 13. When the switch is closed, a current step with an amplitude equal to the quotient of the charging voltage divided by the cable surge impedance, will be applied to the measuring system. The cable shall be long enough to ensure that the response of the measuring system has settled before a reflection from the opposite end of the cable arrives at the switch. This method is similar to that for obtaining the step response of a voltage measuring system ( see 4.5), the difference being that here the switch
MERCURY
WETTED SWITCH
7
dC
SUPPLY
FIG. 13 DETERMINATION OF STEP RESPONSE h~~EASURING SYSTEM
38
TO osclLLoscoPF
OF IMPULSE CURREIQT
IS : 8690 - 1977
connects a voltage source onto the system whereas in the other, the switch generates the step by short-circuiting the input of a charged system. Because of the similarity of the two methods, the same types of switches are used and the same conditions regarding amplification apply.
5.3 .Precautions - In circuits where high current impulse occurs, the voltage drops on even short lengths of conductor may be ccnsiderable. Precautions are necessary to ensure that these do not result in measuring errors and that the earthing of test circuits is such that damage to the insulation of measuring or recording instruments does not occur.
Stray magnetic fields may also cause measuring errors which may be detected by altering the arrangement of conductors.
In addition, some specific precautions should be taken depending on the use of either shunts or current transformers,
5.3.1 Shunts - Care should be taken to ensure that the resistance of the shunt does not change appreciably with heating caused by the impulses to be measured. They should be designed with a sufficient energy storage to prevent permanent damage in case of failure of a series impedance such as a test object or a damping resistor.
5.3.2 Current Transformers - They are generally of lower bandwidth than shunts and are not capable of transferring dc components.
The step response of a current transformer decreases with time and the rate of decrease is determined by the ratio of mutual inductance and burden resistance.
Operating range of current transformers with magnetic core is limited by a rated ampere-second product of the current impulse, which saturates the core and reduces the coupling impedance.
SECTION 5 STATISTICAL EVALUATION
6. MEASURING ERRORS
6.1 In any measurement the actual value obtained differs by a certain amount from the true value.
6.1.1 This difference may come from two main causes, namely:
4
b)
the measuring system is not perfect, the recorded value being different from the value to be measured divided by the scale’ factor. That may be due, for example, to the effect ofthe response time, and a corrected value has to be calculated if needed. the characteristics of the measuring system are not known perfectly. Observational and environmental errors may occur at random. If each of these errors is called el, es, e3, . . . en, and,+if
39

Is I8690 - 1977
all thes? errors are independent, they arc likely to be both positive and negative and the statistical overall error is equal to:
E,,= --- 1/cl’ + e$ + esp + . . . _t ens
6.1.2 Consequently, the errors may be considered as randomly drawn from a Gaussian distribution defined by a standard deviation u and with a mean value equal to zero. Under this assumption the error, E 5 f 2 u, has 1e;s than 5 percent probability o,‘being exceeded and, therefore, is referred to as ‘ the maximum error ‘.
APPENDIX A
( Czuuse 4.0.4 >
RESISTOR DlVIDERS
As a first estimate, neglecting a number of factors, such as the induct- ance of the divider and the effect of the low voltage arm, the response:time of a vertical resistive divider without a high voltage shield electrode and with the bottom at ground level is given approximately by:
RC 7-t e -g-
where Tt = the response time in s, R 5 the total divider resistance in a, and C = the total divider capacitance to earth in F ( the capacit-
ance may be measured by a conventional capacitanc\. measuring bridge).
However, due to the use of the virtual zero; the response time is determined more accurately from:
The capacitance C of a vertical divider may be determined as the capacitance of a vertical conductor if the bottom of the divider is approxi- mately at ground level:
where e0 = the dielectric constant of vacuum = 8.85 IO-l? F/m, i = the length of the divider in m, and r = the radius of the divider in m.
40
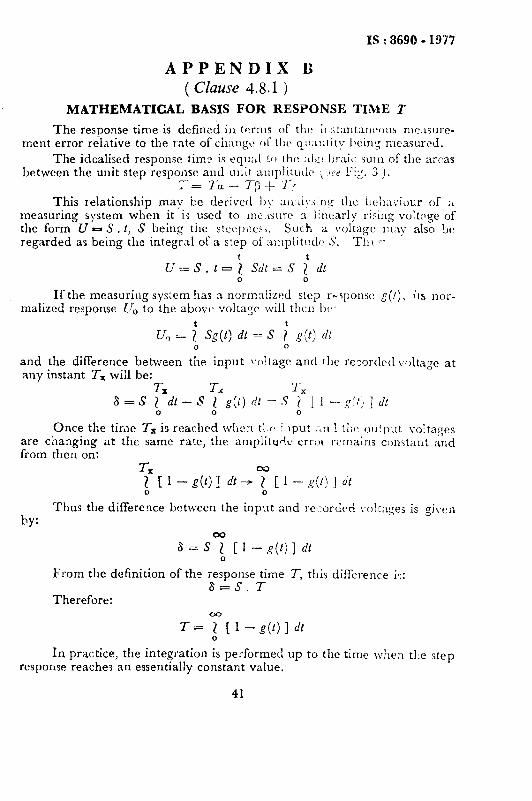
IS : 8690 - 1977
APPENDIX 13; ( Clause 4.8.1 )
MATHEMATICAL BASIS FOR RESPONSE TIME T
The response time is defined in terms of the il,starltancous mca~urc- mcnt error relative tc the rate of changes of t!:e ql:antity being measured.
The idcalised response time is rqnal to the :*1,2(.l)r3i(. ~LIII~ of the arcas between the unit step response and unlit amplit.utk ; cr’ 1-i;. 3 j.
- - ‘Ih - 79 _t_ ‘I’., *- This I-elationship may be derlvccl I)y sn:tiy.>~rlg the bcllai~iocr of ;,
measuring system when it is used to IIILISI:TC’ LL iincarly rising voltage of the form U = S . t, S being the steep~!e~~,. Sue h a voltage rn,iy also be regarded as being the integral of a step of :nllpiitu&~ 5’. Thl. ..
U=S.I--; Sdt=S 2” dt 0 0
If the measuring system has a norrnnlized step response s(t), ins nor- malized response U, to the above voltage will then b(~:
U, = 2’ Q(t) dt = S ; g(t) JI 0 0
and the difference between the input voltage and the recorded voltage at any instant TX will be:
L rr, ‘1-, 6 = S 1 dt - S 2 g(t) dt = 5’ j 1 1 --g/k! ] dt
0 0 0
Once the time -Ix is reached when tl P i lput are changing at the same rate,
.:rt,! tiic outnut voltages the amplituJL5 error rctrnains constant and
from then on: 7-x 1 [ 1 - g(t) j dt -+ “; [ I - g(t) ] dt 0 0
by: Thus the difference between the input and rezordrd l.ol:nges is given
8 = Sy [ 1 - p(t)] dt 0
From the definition of the response time T, this difference ic;: 6=S. T
Therefore:
T=$[L&)]dt 0
In practice, the integration is performed up to the time when the step response reaches an essentially constant value.
41

IS t 8690 - 1977
APPENDIX C [ Clause 4.9.2 (b) ]
PROCEDURE TO DETERMINE IF OSCILLATIONS ARE PRESENT ACROSS THE TEST OBJECT
C-l. The following procedure may assist in determining whether oscillations are present across the test object.
C-l.1 If the measuring system has no resonant frequency, as for example when the step response is exponential, the measuring system may not gi\le rise to oscillations. Thus oscillation on the test oscillogram,are generated in the impulse generator circuit, including the test object and the front capacitor. If the amplitudes of the oscillations on the test oscillogram, multiplied by the factor a exceeds the limits set forth in IS:2071 ( Part II )-1974*, the generator circuit should be changed.
C-l.2 If the measuring system has a resonant frequency range, cscillations on the oscillogram with frequcncics above or below this range may not be created bv the measuring system. The only source shall bc the generator circuit. if the amplitudes of the oscillations on the test oscillogram, multi- plied by the factor a exceeds the liinits above, the generator circuit should be changed.
C-l.3 IT the nleasuring system has a resonant frequency range, oscil1atio:l.s with a frequenc,y \vilhin this range may be caused either by the measuring system or by the generator circuit. To verify this, a resistor of a value of 300 to 50G~ may be inserted betwc:en the test object and thr input elid of the high voltage conductor. If the oscillations do not csrentially vanish, their origin lies in the generator circuit. If the amplitudes of the oscilla- tions on the originA test oscillogram exceeds the limits above, the generator circuit should be challged.
C-2. If the oscillations on the oscillogram essentially vanish, they originate in the measuring. system. These oscillations will cause oscillation in the circuit formed by the test object, the front capacitor and the high voltage conductor. The frequencies of the oscillations are inversely proportional to the capacitances of the divider and test object plus front capacitor respectively. Thus:
a) if the capacitance of the divider is small compared with that of the test object plus the front capacitor, it may be assumed that there will be negligible oscillations on the test object whereas the test oscillogram may exhibit heavy osciilarions;
b) if the capacitance of the divider is of the same order as that of t!le test object plus front capacitor, it may be assumed that the oscillations on the teSt object and on the divider are also of the same order.
-- *Methods of high voItagc testing. * Part II Test procedures (jirrl rtuirion ).
42
BUREAU OF INDIAN STANDARDS
Headquarters :
Manak Bhavan. 9 Bahadur Shah Zafar Marg, NEW DELHI 110002
Teleohones : 3 31 01 31,3 31 13 75 Telegrams : Manaksanstha
( Common to all Offices ) Regional Offices : Telephone
*Western ; Manakalaya, E9 MIDC, Marol, Andheri ( East ) 6 32 92 95 BOMBAY 400093
tEastern : l/14 C. I. T. Scheme VII M, V. I. P. Road, Maniktola, CALCUTTA 700054
Northern : SC0 445-446, Sector 35-C CHANDIGARH 160036
Southern : C. I. T. Campus, MADRAS 600113
Branch Offices :
36 24 99
{ 21843 31641
41
{
24 42 41 25 19 41 29 16
Pushpak,’ Nurmohamed Shaikh Marg, Khanpur, AHMADABAD 380001
‘F’ Block, Unity Bldg. Narasimharaja Square, BANGALORE 560002
C 2 63 48 2 63 49
22 48 05
Gangotri Complex, 5th Floor, Bhadbhada Road, T. T. Napar. 6 27 16 BHOPAL 462003
Plot No. B2/83, Lewis Road, BHUBANES,tiVVAR 751002 5 36 27 5315 Ward No. 29, R. G. Barua Road,
5th Byelane. GUWAHATI 781003 -
5-8-56C L. N. Gupta Marg, (Nampally Statinn Road) 22 10 83 HYDERABAD 500001
R14 Yudhister Marg. C Scheme, JAIPUR 302005 {
6 34 71 6 98 32
117/4288 Sarvodaya Nagar. KANPUR 208005
Patliputra industrial Estate, PATNA 800013 Hantex Bldg ( 2nd Floor ), Rly Station Road.
TRIVANDRUM 695001
C 21 68 76 21 82 92
6 23 05 52 27
inspection Office ( With Sale Point’).
institution of Engineers ( India) Building, 1332 Shivaji Nagar, 5 24 35 PUNE 410005
*Sales Office in Bombay is at Novelty Chambers, Grant Road, 99 66 28 Bombay 40000.7
tSales Office in Calcurta is at 5 Chowtinghee Approach. P. 0. Princep 2l69 00 Street. Calcutta 700072
Reprography Unit, BE, New Delhi, India