is big data performance reproducible in modern cloud networks?
TRANSCRIPT

This paper is included in the Proceedings of the 17th USENIX Symposium on Networked Systems Design
and Implementation (NSDI ’20)February 25–27, 2020 • Santa Clara, CA, USA
978-1-939133-13-7
Open access to the Proceedings of the 17th USENIX Symposium on Networked
Systems Design and Implementation (NSDI ’20) is sponsored by
Is Big Data Performance Reproducible in Modern Cloud Networks?
Alexandru Uta and Alexandru Custura, VU Amsterdam; Dmitry Duplyakin, University of Utah; Ivo Jimenez, University of California, Santa Cruz;
Jan Rellermeyer, TU Delft; Carlos Maltzahn, University of California, Santa Cruz; Robert Ricci, University of Utah; Alexandru Iosup, VU Amsterdam
https://www.usenix.org/conference/nsdi20/presentation/uta
Is Big Data Performance Reproducible in Modern Cloud Networks?
Alexandru Uta1, Alexandru Custura1, Dmitry Duplyakin2, Ivo Jimenez3, Jan Rellermeyer4,Carlos Maltzahn3, Robert Ricci2, Alexandru Iosup1
1VU Amsterdam 2University of Utah 3University of California, Santa Cruz 4TU Delft
AbstractPerformance variability has been acknowledged as a problemfor over a decade by cloud practitioners and performance en-gineers. Yet, our survey of top systems conferences revealsthat the research community regularly disregards variabilitywhen running experiments in the cloud. Focusing on net-works, we assess the impact of variability on cloud-based big-data workloads by gathering traces from mainstream commer-cial clouds and private research clouds. Our dataset consistsof millions of datapoints gathered while transferring over 9petabytes on cloud providers’ networks. We characterize thenetwork variability present in our data and show that, eventhough commercial cloud providers implement mechanismsfor quality-of-service enforcement, variability still occurs, andis even exacerbated by such mechanisms and service providerpolicies. We show how big-data workloads suffer from sig-nificant slowdowns and lack predictability and replicability,even when state-of-the-art experimentation techniques areused. We provide guidelines to reduce the volatility of bigdata performance, making experiments more repeatable.
1 Introduction
Performance variability [13, 47] in the cloud is well-known,and has been studied since the early days [7, 35, 55] of cloudcomputing. Cloud performance variability impacts not onlyoperational concerns, such as cost and predictability [14, 42],but also reproducible experiment design [3, 10, 31, 47].
Big data is now highly embedded in the cloud: for example,Hadoop [64] and Spark [65] processing engines have beendeployed for many years on on-demand resources. One keyissue when running big data workloads in the cloud is that,due to the multi-tenant nature of clouds, applications see per-formance effects from other tenants, and are thus susceptibleto performance variability, including on the network. Eventhough recent evidence [50] suggests that there are limited po-tential gains from speeding up the network, it is still the casethat variable network performance can slow down big data
systems and introduce volatility that makes it more difficultto draw reliable scientific conclusions.
Although cloud performance variability has been thor-oughly studied, the resulting work has mostly been in thecontext of optimizing tail latency [22], with the aim of pro-viding more consistent application-level performance [15,25, 29, 57]. This is subtly—but importantly—different fromunderstanding the ways that fine-grained, resource-level vari-ability affects the performance evaluation of these systems.Application-level effects are especially elusive for complexapplications, such as big data, which are not bottlenecked ona specific resource for their entire runtime. As a result, it isdifficult for experimenters to understand how to design ex-periments that lead to reliable conclusions about applicationperformance under variable network conditions.
Modern cloud data centers increasingly rely on software-defined networking to offer flows between VMs with reliableand predictable performance [48]. While modern cloud net-works generally promise isolation and predictability [7, 30],in this paper we uncover that they rarely achieve stable perfor-mance. Even the mechanisms and policies employed by cloudproviders for offering quality of service (QoS) and fairnesscan result in non-trivial interactions with the user applications,which leads to performance variability.
Although scientists are generally aware of the relationshipbetween repeated experiments and increased confidence inresults, the specific strength of these effects, their underlyingcauses, and methods for improving experiment designs havenot been carefully studied in the context of performance exper-iments run in clouds. Variability has a significant impact onsound experiment design and result reporting [31]. In the pres-ence of variability, large numbers of experiment repetitionsmust be performed to achieve tight confidence intervals [47].Although practitioners and performance engineers acknowl-edge this phenomenon [7, 35, 55], in practice these effects arefrequently disregarded in performance studies.
Building on our vision [34], and recognizing the trend ofthe academic community’s increasing use of the cloud forcomputing resources [53], we challenge the current state-of-
USENIX Association 17th USENIX Symposium on Networked Systems Design and Implementation 513
ReportingAverage or
Median
ReportingVariability
No or poorspecification
0102030405060
No.
Art
icle
s[%
]
(a) Experiment reporting.
3 5 9 10 15 20 100No. of Repetitions
0
5
10
15
No.
Art
icle
s[%
]
(b) Repetitions forwell reported studies.
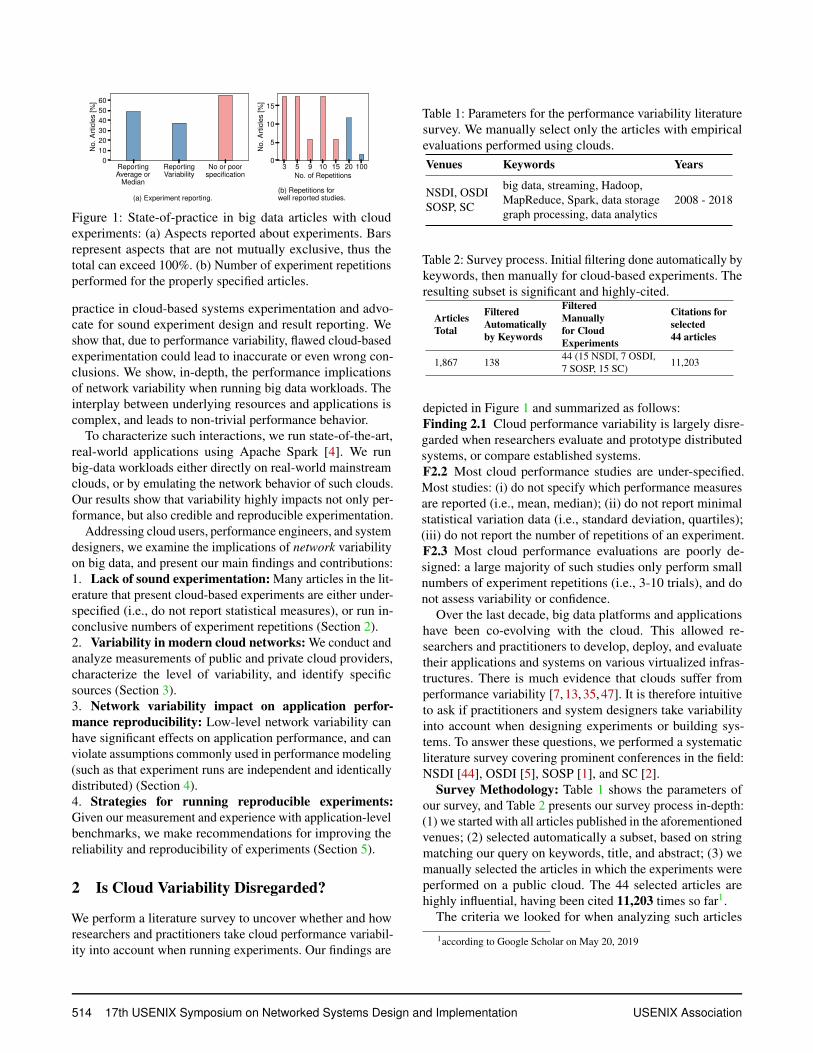
Figure 1: State-of-practice in big data articles with cloudexperiments: (a) Aspects reported about experiments. Barsrepresent aspects that are not mutually exclusive, thus thetotal can exceed 100%. (b) Number of experiment repetitionsperformed for the properly specified articles.
practice in cloud-based systems experimentation and advo-cate for sound experiment design and result reporting. Weshow that, due to performance variability, flawed cloud-basedexperimentation could lead to inaccurate or even wrong con-clusions. We show, in-depth, the performance implicationsof network variability when running big data workloads. Theinterplay between underlying resources and applications iscomplex, and leads to non-trivial performance behavior.
To characterize such interactions, we run state-of-the-art,real-world applications using Apache Spark [4]. We runbig-data workloads either directly on real-world mainstreamclouds, or by emulating the network behavior of such clouds.Our results show that variability highly impacts not only per-formance, but also credible and reproducible experimentation.
Addressing cloud users, performance engineers, and systemdesigners, we examine the implications of network variabilityon big data, and present our main findings and contributions:1. Lack of sound experimentation: Many articles in the lit-erature that present cloud-based experiments are either under-specified (i.e., do not report statistical measures), or run in-conclusive numbers of experiment repetitions (Section 2).2. Variability in modern cloud networks: We conduct andanalyze measurements of public and private cloud providers,characterize the level of variability, and identify specificsources (Section 3).3. Network variability impact on application perfor-mance reproducibility: Low-level network variability canhave significant effects on application performance, and canviolate assumptions commonly used in performance modeling(such as that experiment runs are independent and identicallydistributed) (Section 4).4. Strategies for running reproducible experiments:Given our measurement and experience with application-levelbenchmarks, we make recommendations for improving thereliability and reproducibility of experiments (Section 5).
2 Is Cloud Variability Disregarded?
We perform a literature survey to uncover whether and howresearchers and practitioners take cloud performance variabil-ity into account when running experiments. Our findings are
Table 1: Parameters for the performance variability literaturesurvey. We manually select only the articles with empiricalevaluations performed using clouds.Venues Keywords Years
NSDI, OSDISOSP, SC
big data, streaming, Hadoop,MapReduce, Spark, data storagegraph processing, data analytics
2008 - 2018
Table 2: Survey process. Initial filtering done automatically bykeywords, then manually for cloud-based experiments. Theresulting subset is significant and highly-cited.
ArticlesTotal
FilteredAutomaticallyby Keywords
FilteredManuallyfor CloudExperiments
Citations forselected44 articles
1,867 13844 (15 NSDI, 7 OSDI,7 SOSP, 15 SC) 11,203
depicted in Figure 1 and summarized as follows:Finding 2.1 Cloud performance variability is largely disre-garded when researchers evaluate and prototype distributedsystems, or compare established systems.F2.2 Most cloud performance studies are under-specified.Most studies: (i) do not specify which performance measuresare reported (i.e., mean, median); (ii) do not report minimalstatistical variation data (i.e., standard deviation, quartiles);(iii) do not report the number of repetitions of an experiment.F2.3 Most cloud performance evaluations are poorly de-signed: a large majority of such studies only perform smallnumbers of experiment repetitions (i.e., 3-10 trials), and donot assess variability or confidence.
Over the last decade, big data platforms and applicationshave been co-evolving with the cloud. This allowed re-searchers and practitioners to develop, deploy, and evaluatetheir applications and systems on various virtualized infras-tructures. There is much evidence that clouds suffer fromperformance variability [7, 13, 35, 47]. It is therefore intuitiveto ask if practitioners and system designers take variabilityinto account when designing experiments or building sys-tems. To answer these questions, we performed a systematicliterature survey covering prominent conferences in the field:NSDI [44], OSDI [5], SOSP [1], and SC [2].
Survey Methodology: Table 1 shows the parameters ofour survey, and Table 2 presents our survey process in-depth:(1) we started with all articles published in the aforementionedvenues; (2) selected automatically a subset, based on stringmatching our query on keywords, title, and abstract; (3) wemanually selected the articles in which the experiments wereperformed on a public cloud. The 44 selected articles arehighly influential, having been cited 11,203 times so far1.
The criteria we looked for when analyzing such articles
1according to Google Scholar on May 20, 2019
514 17th USENIX Symposium on Networked Systems Design and Implementation USENIX Association

Figure 2: Bandwidth distributions for eight real-world clouds.Box-and-whiskers plots show the 1st, 25th, 50th, 75th, and99th percentiles. (Distributions derived from the study [7]conducted by Ballani et al.)
are the following: (i) reporting average or median metricsover a number of experiments; (ii) reporting variability (suchas standard deviation or percentiles) or confidence (such asconfidence intervals); (iii) reporting the number of times anexperiment was repeated. These are all critical criteria fordetermining whether a study’s conclusions may be irrepro-ducible, or worse, not fully supported by the evidence (i.e.,flawed). To check the reliability of our manual filtering, itwas performed by two separate reviewers, and we appliedCohen’s Kappa coefficient [16] for each category presentedin Figure 1a: reporting average or median, statistics, and poorspecification. Our Kappa scores for each category, were 0.95,0.81, and 0.85, respectively. Values larger than 0.8 are inter-preted as near-perfect agreement between the reviewers [61].
Survey Results: The systems community centered aroundcloud computing and big data disregards performance vari-ability when performing empirical evaluations in the cloud.Figure 1 shows the results of our survey. Out of the two re-viewer’s scores, we plot the lower scores, i.e., ones that aremore favorable to the articles. We found that over 60% ofthe surveyed articles are under-specified (i.e., the authors donot mention how many times they repeated the experimentsor even whether they are reporting average, median, etc.);a subset of the articles report averages or medians, but outof those, only 37% report variance or confidence (i.e., error-bars, percentiles). We further found that most articles that doreport repetitions perform only 3, 5 or 10 repetitions of theexperiments. The reason for such practices might be that ex-perimenters are more used to evaluating software in controlledenvironments—what is true in controlled environments oftendoes not hold in clouds.
Moreover, 76% of the properly specified studies use nomore than 15 repetitions. Coupled with the effects of cloudvariability, such experiment design practices could lead towrong or ambiguous conclusions, as we show next.
2.1 How credible are experiments with fewrepetitions?
Experiments with few repetitions run the risk of reporting in-accurate results; the higher the variability, the greater the riskthat a low-repetition experiment’s results are unreliable. We
(a) Medians for HiBench-KMeans
(b) 90th percentile for TPC-DS Q68
Figure 3: Medians and 90th percentiles for K-Means (a) andTPC-DS Q68 (b). Estimates are shown along with their 95%confidence intervals (CIs) for performance measurements un-der the A-H distributions. � depicts estimates 50-runs. Judgedby the 50-run CIs we consider gold standard, accurate esti-mates (inside those CIs) are X; inaccurate estimates (outsidethose CIs) are × for 3- and 10-run sets.
use application-level benchmarks to show how the bandwidthdistributions found by Ballani et al. [7] for eight real-worldclouds—shown in Figure 2—do affect findings in practice.
We emulate the behavior of the eight clouds presented inFigure 2, which were contemporary with most articles foundin our survey. In a private Spark [4] cluster of 16 machines, welimit the bandwidth achieved by machines according to distri-butions A−H. We uniformly sample bandwidth values fromthese distributions every x ∈ {5,50} seconds. We used 50experiment repetitions as our “gold standard” to demonstratethe intuition that running more experiments yields more accu-rate results, and compared them to the 3- and 10-repetitionscommonly found in our literature survey. (In Section 4 wepropose better methods for experiment design.)
Emulation Results: We found that experiments with fewrepetitions often produced medians that are outside of the 95%confidence intervals (CIs) for larger experiment sequences.The 95% CIs for medians represent ranges in which we wouldfind true medians with 95% probability, if we were able to runinfinite repetitions. Thus, when the low-repetition medians lieoutside of the high-repetition CIs, there is a 95% probabilitythat the former are inaccurate. This can be seen in Figure 3,which plots estimates of 95% nonparametric (asymmetric)CIs [11] for experiments using bandwidth distributions A−Hfrom Figure 2. For each bandwidth distribution, we show themedians and CIs for 3-, 5-, and 50-repetition experiments.2
The median for the “gold standard” experiment is markedwith a diamond; medians for lower-repetition experiments areshown with an “X” if outside the gold-standard 95% CI, or acheck-mark if within it.
2Three repetitions are insufficient to calculate CIs; we plot mediansbecause this is representative of what is often found in the literature.
USENIX Association 17th USENIX Symposium on Networked Systems Design and Implementation 515

The top of Figure 3 (part (a)) shows our estimates of medi-ans for the K-Means application from HiBench [32]. Of theeight cloud bandwidth distributions, the 3-run median fallsoutside of the gold-standard CI for six of them (75%), and the10-run median for three (38%). The bottom half of Figure 3(part (b)) shows the same type of analysis, but this time, fortail performance [22] instead of the median. To obtain theseresults, we used TPC-DS [49] Query-68 measurements andthe method from Le Boudec [11] to calculate nonparametricestimates for the 90th percentile performance, as well as theirconfidence bounds. As can be seen in this figure, it is evenmore difficult to get robust tail performance estimates.
Emulation Methodology: The quartiles in Ballani’s study(Figure 2) give us only a rough idea about the probability den-sities and there is uncertainty about fluctuations, as there isno data about sample-to-sample variability. Considering thatthe referenced studies reveal no autocovariance information,we are left with using the available information to samplebandwidth uniformly. Regarding the sampling rate, we foundthe following: (1) As shown in Section 3 two out of the threeclouds we measured exhibits significant sample-to-samplevariability on the order of tens of seconds; (2) The cases F-Gfrom Ballani’s study support fine sampling rates: variabil-ity at sub-second scales [63] and at the 20s intervals [24] issignificant. Therefore, we sample at relatively fine-grainedintervals: 5s for Figure 3(a), and 50s for Figure 3(b). Fur-thermore, sampling at these two different rates shows thatbenchmark volatility is not dependent on the sampling rate,but rather on the distribution itself.
3 How Variable Are Cloud Networks?
We now gather and analyze network variability data for threedifferent clouds: two large-scale commercial clouds, and asmaller-scale private research cloud. Our main findings canbe summarized as follows:F3.1 Commercial clouds implement various mechanisms andpolicies for network performance QoS enforcement, and thesepolicies are opaque to users and vary over time. We found (i)token-bucket approaches, where bandwidth is cut by an orderof magnitude after several minutes of transfer; (ii) a per-corebandwidth QoS, prioritizing heavy flows; (iii) instance typesthat, when created repeatedly, are given different bandwidthpolicies unpredictably.F3.2 Private clouds can exhibit more variability than publiccommercial clouds. Such systems are orders of magnitudesmaller than public clouds (in both resources and clients),meaning that when competing traffic does occur, there is lessstatistical multiplexing to “smooth out” variation.F3.3 Base latency levels can vary by a factor of almost 10xbetween clouds, and implementation choices in the cloud’svirtual network layer can cause latency variations over two or-ders of magnitude depending on the details of the application.
Table 3: Experiment summary for determining performancevariability in modern cloud networks. Experiments markedwith a star (*) are presented in depth in this article. Due tospace limitations, we release the other data in our reposi-tory [59]. All Amazon EC2 instance types are typical offer-ings of a big data processing company [20].
Cloud InstanceType
QoS(Gbps)
Exp.Duration
ExhibitsVariability
Cost($)
*Amazon c5.XL ≤ 10 3 weeks Yes 171Amazon m5.XL ≤ 10 3 weeks Yes 193Amazon c5.9XL 10 1 day Yes 73Amazon m4.16XL 20 1 day Yes 153Google 1 core 2 3 weeks Yes 34Google 2 core 4 3 weeks Yes 67Google 4 core 8 3 weeks Yes 135*Google 8 core 16 3 weeks Yes 269HPCCloud 2 core N/A 1 week Yes N/AHPCCloud 4 core N/A 1 week Yes N/A*HPCCloud 8 core N/A 1 week Yes N/A
3.1 BandwidthWe run our bandwidth measurements in two prominent com-mercial clouds, Amazon EC2 (us-east region) and GoogleCloud (us-east region), and one private research cloud, HPC-Cloud3. Table 3 summarizes our experiments. In the interestof space, in this paper we focus on three experiments; alldata we collected is available in our repository [59]. We col-lected the data between October 2018 and February 2019. Intotal, we have over 21 weeks of nearly-continuous data trans-fers, which amount for over 1 million datapoints and over 9petabytes of transferred data.
The Amazon instances we chose are typical instancetypes that a cloud-based big data company offers to its cus-tomers [20], and these instances have AWS’s “enhanced net-working capabilities” [6]. On Google Cloud (GCE), we chosethe instance types that were as close as possible (though notidentical) to the Amazon EC2 offerings. HPCCloud offered amore limited set of instance types. We limit our study to thisset of cloud resources and their network offerings, as big dataframeworks are not equipped to make use of more advancednetworking features (i.e., InfiniBand), as they are generally de-signed for commodity hardware. Moreover, vanilla Spark de-ployments, using typical data formats such as Parquet or Avro,are not able to routinely exploit links faster than 10 Gbps, un-less significant optimization is performed [58]. Therefore, theresults we present in this article are highly likely to occur inreal-world scenarios.
In the studied clouds, for each pair of VMs of similar in-stance types, we measured bandwidth continuously for oneweek. Since big data workloads have different network accesspatterns, we tested multiple scenarios:• full-speed - continuously transferring data, and sum-
marizing performability metrics (bandwidth, retransmis-
3https://userinfo.surfsara.nl/systems/hpc-cloud
516 17th USENIX Symposium on Networked Systems Design and Implementation USENIX Association
6000
8000
10000
6000
8000
10000
0 10000 20000 30000 40000 50000Time [10s]
0100
full-speed
full-speed0
100
Ban
dwid
th[M
bps]
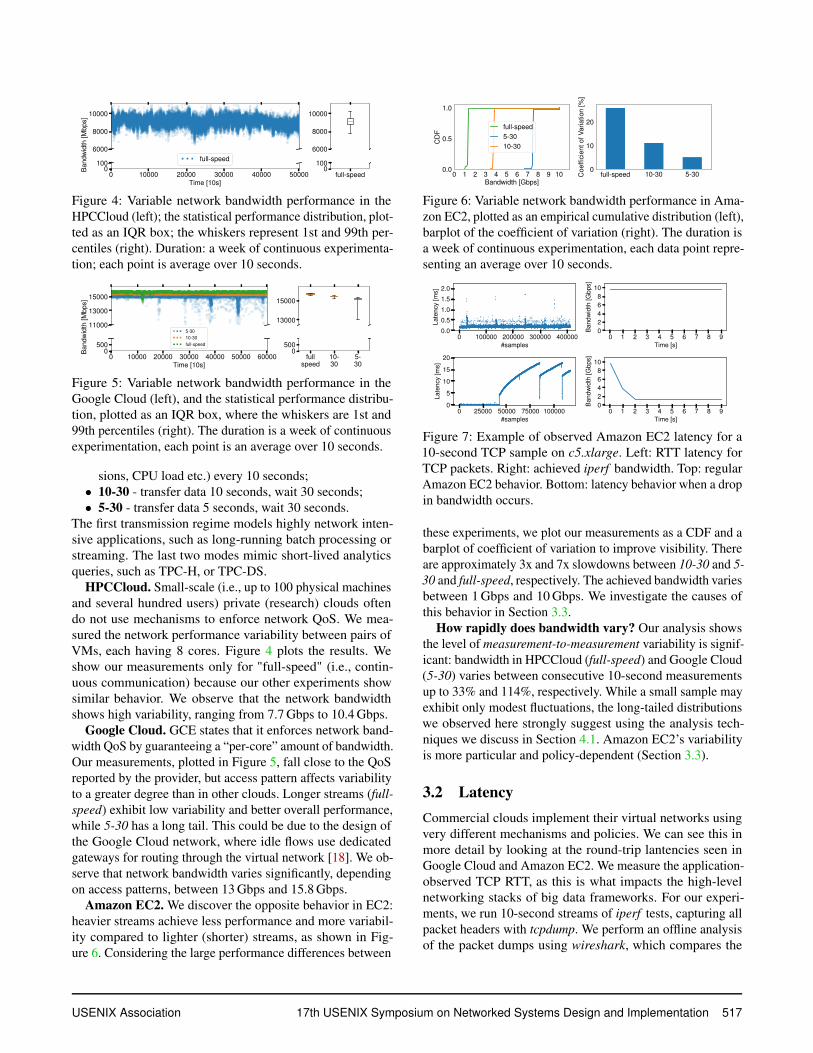
Figure 4: Variable network bandwidth performance in theHPCCloud (left); the statistical performance distribution, plot-ted as an IQR box; the whiskers represent 1st and 99th per-centiles (right). Duration: a week of continuous experimenta-tion; each point is average over 10 seconds.
11000
13000
15000
13000
15000
0 10000 20000 30000 40000 50000 60000Time [10s]
0500
5-3010-30full-speed
fullspeed
10-30
5-30
0500
Ban
dwid
th[M
bps]
Figure 5: Variable network bandwidth performance in theGoogle Cloud (left), and the statistical performance distribu-tion, plotted as an IQR box, where the whiskers are 1st and99th percentiles (right). The duration is a week of continuousexperimentation, each point is an average over 10 seconds.
sions, CPU load etc.) every 10 seconds;• 10-30 - transfer data 10 seconds, wait 30 seconds;• 5-30 - transfer data 5 seconds, wait 30 seconds.
The first transmission regime models highly network inten-sive applications, such as long-running batch processing orstreaming. The last two modes mimic short-lived analyticsqueries, such as TPC-H, or TPC-DS.
HPCCloud. Small-scale (i.e., up to 100 physical machinesand several hundred users) private (research) clouds oftendo not use mechanisms to enforce network QoS. We mea-sured the network performance variability between pairs ofVMs, each having 8 cores. Figure 4 plots the results. Weshow our measurements only for "full-speed" (i.e., contin-uous communication) because our other experiments showsimilar behavior. We observe that the network bandwidthshows high variability, ranging from 7.7 Gbps to 10.4 Gbps.
Google Cloud. GCE states that it enforces network band-width QoS by guaranteeing a “per-core” amount of bandwidth.Our measurements, plotted in Figure 5, fall close to the QoSreported by the provider, but access pattern affects variabilityto a greater degree than in other clouds. Longer streams (full-speed) exhibit low variability and better overall performance,while 5-30 has a long tail. This could be due to the design ofthe Google Cloud network, where idle flows use dedicatedgateways for routing through the virtual network [18]. We ob-serve that network bandwidth varies significantly, dependingon access patterns, between 13 Gbps and 15.8 Gbps.
Amazon EC2. We discover the opposite behavior in EC2:heavier streams achieve less performance and more variabil-ity compared to lighter (shorter) streams, as shown in Fig-ure 6. Considering the large performance differences between
0 1 2 3 4 5 6 7 8 9 10Bandwidth [Gbps]
0.0
0.5
1.0
CD
F
full-speed5-3010-30
full-speed 10-30 5-300
10
20
Coe
ffici
ento
fVar
iatio
n[%
]
Figure 6: Variable network bandwidth performance in Ama-zon EC2, plotted as an empirical cumulative distribution (left),barplot of the coefficient of variation (right). The duration isa week of continuous experimentation, each data point repre-senting an average over 10 seconds.
0 100000 200000 300000 400000#samples
0.0
0.5
1.0
1.5
2.0
Late
ncy
[ms]
0 1 2 3 4 5 6 7 8 9Time [s]
02468
10
Ban
dwid
th[G
bps]
0 25000 50000 75000 100000#samples
0
5
10
15
20
Late
ncy
[ms]
0 1 2 3 4 5 6 7 8 9Time [s]
02468
10
Ban
dwid
th[G
bps]
Figure 7: Example of observed Amazon EC2 latency for a10-second TCP sample on c5.xlarge. Left: RTT latency forTCP packets. Right: achieved iperf bandwidth. Top: regularAmazon EC2 behavior. Bottom: latency behavior when a dropin bandwidth occurs.
these experiments, we plot our measurements as a CDF and abarplot of coefficient of variation to improve visibility. Thereare approximately 3x and 7x slowdowns between 10-30 and 5-30 and full-speed, respectively. The achieved bandwidth variesbetween 1 Gbps and 10 Gbps. We investigate the causes ofthis behavior in Section 3.3.
How rapidly does bandwidth vary? Our analysis showsthe level of measurement-to-measurement variability is signif-icant: bandwidth in HPCCloud (full-speed) and Google Cloud(5-30) varies between consecutive 10-second measurementsup to 33% and 114%, respectively. While a small sample mayexhibit only modest fluctuations, the long-tailed distributionswe observed here strongly suggest using the analysis tech-niques we discuss in Section 4.1. Amazon EC2’s variabilityis more particular and policy-dependent (Section 3.3).
3.2 LatencyCommercial clouds implement their virtual networks usingvery different mechanisms and policies. We can see this inmore detail by looking at the round-trip lantencies seen inGoogle Cloud and Amazon EC2. We measure the application-observed TCP RTT, as this is what impacts the high-levelnetworking stacks of big data frameworks. For our experi-ments, we run 10-second streams of iperf tests, capturing allpacket headers with tcpdump. We perform an offline analysisof the packet dumps using wireshark, which compares the
USENIX Association 17th USENIX Symposium on Networked Systems Design and Implementation 517

0#samples
0
5
10
15
20
Late
ncy
[ms]
0 1 2 3 4 5 6 7 8 9Time [s]
02468
10
Ban
dwid
th[G
bps]
0#samples
0.0
2.5
5.0
7.5
10.0
Late
ncy
[ms]
0 1 2 3 4 5 6 7 8 9Time [s]
02468
10
Ban
dwid
th[G
bps]
Figure 8: Example of observed Google Cloud latency for a 10-second TCP sample on a 4-core instance. Left: RTT latencyfor TCP packets. Right: achieved iperf bandwidth.
0 100 200Thousand
Retransmissions
Amazon
HPCCloud
0 100 200 300Thousand
Retransmissions
full-speed10-30
5-30
Figure 9: TCP retransmission analysis, summarized for allexperiments presented before, in all clouds. Left: retransmis-sions as IQR boxplots, with the whiskers representing 1stand 99th percentiles; Right: violin plot for retransmissionsin Google Cloud; thickness of the plot is proportional to theprobability density of the data.
time between when a TCP segment is sent to the (virtual)network device and when it is acknowledged. Our data wascollected between August and September 2019. In total, itcontains over 50 million RTT datapoints.
The behavior we observe is inherently different: GoogleCloud exhibits latency in the order of milliseconds, with anupper limit of 10ms. Amazon EC2 generally exhibits fastersub-millisecond latency under typical conditions, but whenthe traffic shaping mechanism (detailed in Section 3.3) takeseffect, the latency increases by two orders of magnitude, sug-gesting large queues in the virtual device driver. Figure 7shows representative patterns of latency in the Amazon EC2cloud, while Figure 8 is representative of Google Cloud. Bothfigures plot latency as RTT packet data obtained from a 10-
0 20000 40000 60000Time [10s]
0
50
100
Traf
fic[T
B]
full-speed10-305-30
(a) Amazon EC2.
0 20000 40000 60000Time [10s]
0
500
1000
Traf
fic[T
B]
full-speed10-305-30
(b) Google Cloud.
Figure 10: The total amount of data transferred between thepairs of virtual machines involved in the three types of exper-iments performed. The total time is a week, while each pointon the horizontal axis represents 10 seconds.
second TCP stream obtained running an iperf benchmark.The behavior observed in the top half of Figure 7 lasts for
approximately ten minutes of full-speed transfer on c5.xlargeinstances. After this time, the VMs’ bandwidth gets throttleddown to about 1 Gbps (bottom half of Figure 7), which alsosignificantly increases latency. On Google Cloud, there is nothrottling effect, but the bandwidth and latency vary morefrom sample to sample.
3.3 Identifying Mechanisms and PoliciesThe behavior exhibited by the two commercial providers isnotably different. We uncover mechanisms and policies forenforcing client QoS by performing extra analysis, depictedin Figures 9 and 10. The former plots the number of retrans-missions per experiment (part (a)) and a zoomed-in view ofGoogle Cloud (part (b)). Amazon EC2 and HPCCloud have anegligible number of retransmissions, yet retransmission arecommon in Google Cloud: roughly 2% per experiment.
Figure 10 plots the total amount of traffic for Amazon EC2and Google Cloud over the entire duration of our experiments.It is clear that in Google Cloud’s case the amount of trafficgenerated by full-speed is orders of magnitude larger than forthe intermittent access patterns. In Amazon EC2’s case, thetotal amount of data sent for all three kinds of experimentsis roughly equal. By corroborating this finding the more fine-grained experiments we performed presented in Figure 7, andother empirical studies [51, 62], we find that Amazon EC2uses a token-bucket algorithm to allocate bandwidth to users.
Token-Bucket Analysis. The token-bucket algorithm op-eration can be explained as follows. When a VM is providedto the user, its associated bucket holds a certain amount oftokens (i.e., a budget). This budget is allowed to be spent ata high rate (i.e., 10 Gbps). When the budget is depleted (e.g.,after about 10 minutes of continuous transfer on a c5.xlargeinstance, the QoS is limited to a low rate (e.g., 1 Gbps). Thebucket is also subject to a replenishing rate that we empiri-cally found to be approximately 1 Gbit token per second, i.e.,every second users receive the amount of tokens needed tosend 1 Gbit of data at the high (10 Gbps) rate. Once the tokenbucket empties, transmission at the capped rate is sufficient tokeep it from filling back up. The user must rest the network,and re-filling the bucket completely takes several minutes.
We analyze the behavior of multiple types of VMs from thec5.* family, and find that their token-bucket parameters differ.More expensive machines benefit from larger initial budgets,as well as higher bandwidths when their budget depletes. Fig-ure 11 plots the token-bucket parameter analysis for four VMsof the c5.* family. For each VM type, we ran an iperf test con-tinuously until the achieved bandwidth dropped significantlyand stabilized at a lower value. For each instance type, we ran15 tests. Figure 11 shows the time taken to empty the tokenbucket, the high (non-empty bucket) bandwidth value, and thelow (empty bucket) bandwidth value. As the size (i.e., number
518 17th USENIX Symposium on Networked Systems Design and Implementation USENIX Association

c5.large c5.xlarge c5.2xlarge c5.4xlargeMachine Type
0500
10001500200025003000350040004500500055006000
Tim
eto
empt
ybu
cket
[s] Low Bandwidth High Bandwidth
01234567891011121314
Ban
dwid
th[G
bps]
Figure 11: The token-bucket parameters identified for severalinstances of Amazon EC2 c5.* family. The elapsed time toempty the token bucket is depicted with boxplots associatedwith left vertical axis. The high and low bandwidths of thetoken bucket are depicted with bar plots with whiskers andare associated with the right vertical axis.
Figure 12: Measured latency and bandwidth for Amazon EC2(c5.xlarge) and GCE (4-core VM with advertised 8Gbps)instances as functions of the write() size.
of cores, amount of memory etc,) of the VM increases, wenotice that the bucket size and the low bandwidth increaseproportionally. However, as the magnitude of the boxplotssuggests, as well as the error bars we plotted for the highbandwidth, these parameters are not always consistent formultiple incarnations of the same instance type.
Virtual NIC Implementations. We found that differencesin EC2 and GCE’s implementations of virtual NICs can leadto significantly different observed behavior. EC2’s virtualNICs advertise an MTU of 9000 bytes, a standard “jumboframe” size. GCE’s only advertise an MTU of 1500 bytes(standard Ethernet frame size), but instead enable TCP Seg-mentation Offloading (TSO), in which the NIC accepts larger“packets” from the device driver, but then breaks them downinto smaller Ethernet frames before transmission (we do notknow whether this occurs at the virtual or physical NIC inGCE’s implementation). Both of these techniques serve thesame basic function—reducing overhead by sending fewer,larger packets on the virtual NIC, but result in different ob-servable behavior on the host, and the details of this behaviordepend heavily on the application and workload.
The most striking effect is the way that the size of thewrite()s done by the application affects latency and packetretransmission. Figure 12 plots the effects of the write()size on latency and bandwidth. On EC2, the size of a single“packet” tops out at the MTU of 9K, whereas on GCE, TSOcan result in single “packet” at the virtual NIC being as largeas 64K in our experiments. With such large “packets,” per-
ceived latency increases greatly due to the higher perceived“transmission time” for these large packets. The number ofretransmissions also goes up greatly, presumably due to lim-ited buffer space in the bottom half of the virtual NIC driveror tighter bursts on the physical NIC. In practice, the sizeof the “packets” passed to the virtual NIC in Linux tends toequal to the write on the socket (up to the cap noted above).This makes the observed behavior—and thus repeatabilityand the ability to generalize results between clouds—highlyapplication-dependent. It is also worth noting that all streamsare affected when one stream sends large “packets”, sincethey share a queue in the virtual device driver. On GCE, whenwe limited our benchmarks to writes of 9K, we got near-zeropacket retransmission and an average RTT of about 2.3ms.When the benchmark used its default write() size of 128K,we saw the hundreds of thousands of retransmission shownin Figure 9 and latencies as high as 10ms.
4 Performance Reproducibility For Big DataApplications
Having looked at low-level variability in bandwidth and la-tency, we now move “up” a level to applications and work-loads. Our main findings are:F4.1 Under variability resembling Google Cloud and HPC-Cloud, which can be modeled as stochastic noise, reproducibleexperiments can be obtained using sufficient repetitions andsound statistical analyses.F4.2 Application transfer patterns exhibit non-trivial interac-tions with token-bucket network traffic shapers. Depending onthe bucket budget and the application, significant applicationperformance variability is incurred.F4.3 Token-bucket traffic shapers in conjunction with (im-balanced) big data applications can create stragglers.F4.4 In long-running cloud deployments that have incurredlarge amounts of varied network traffic, it is highly difficultto predict application performance, as it is dependent on thestate of the individual nodes’ remaining token-bucket budgets.
Big Data Workloads. In this section, we run the Hi-Bench [32] and TPC-DS [49] benchmarks on Spark 2.4.0 (seeTable 4) to showcase our main findings on network variabilityand big data workloads reproducibility. In 2015, Ousterhoutet al. [50] found that big data workloads are mostly CPUbound. The workloads we chose here are no exception. How-ever, they are sensitive to oscillations in the network transferperformance. Moreover, most of the CPU load in [50] is at-tributed to the framework’s inefficiencies [19], which havebeen solved in later releases. As a consequence, modern Sparkimplementations are more sensitive to network variations.
4.1 Experiments and Stochastic NoiseAs detailed in Section 3, the behavior of network performancevariability for Google Cloud and HPCCloud is closer in na-
USENIX Association 17th USENIX Symposium on Networked Systems Design and Implementation 519

(a) Median Performance for K-Means in Google Cloud.
0 20 40 60 80 100No. of Repetitions
90
95
100
105
110
Tim
e[s
]
(b) Median Performance for TPC-DS Q65 in HPCCloud.
0 20 40 60 80 100No. of Repetitions
20
25
30
35
40
45
50
Tim
e[s
]
Figure 13: CONFIRM analysis for K-Means and TPC-DSQ65 on Google Cloud and HPCCloud. Median estimates (bluethick curve), 95% nonparametric confidence intervals (lightblue filled space), and 1% error bounds (red dotted curves).Vertical axis not starting at 0 for visibility.
Table 4: Big data experiments on modern cloud networks.Workload Size Network Software #Nodes
HiBench [32] BigDataToken-bucket,
Figure 14Spark 2.4.0,
Hadoop 2.7.3 12
TPC-DS [49] SF-2000Token-bucket,
Figure 14Spark 2.4.0,
Hadoop 2.7.3 12
ture to stochastic variability given by transient conditions inthe underlying resources, such as noisy neighbors. To achievereproducible experiments under such conditions, system de-signers and experimenters need to carefully craft and plantheir tests, using multiple repetitions, and must perform soundstatistical analyses.
We ran several HiBench [32] and TPC-DS [49] benchmarksdirectly on the Google Cloud and HPCCloud clouds and re-port how many repetitions an experimenter needs to performin order to achieve trustworthy experiments. While it is truethat running experiments directly on these clouds we can-not differentiate the effects of network variability from othersources of variability, the main take-away message of thistype of experiment is that this kind of stochastic variabilitycan be accounted for with proper experimentation techniques.
On the performance data we obtained, we performed aCONFIRM [47] analysis to predict how many repetitionsan experiment will require to achieve a desired confidenceinterval. Figure 13 presents our findings, showing that forthese two common benchmarks, it can take 70 repetitions ormore to achieve 95% confidence intervals within 1% of themeasured median. As we saw in Section 2, this is far morerepetitions than are commonly found in the literature: mostpapers are on the extreme left side of this figure, where theconfidence intervals are quite wide. This points to the need forstronger experiment design and analysis in our community.
0 10 20 30 40 50 60 70 80 90
5
10
Ban
dwid
th[G
bps] (a) 10-30
0 10 20 30 40 50 60 70 80 90Time [s]
5
10
Ban
dwid
th[G
bps] (b) 5-30
AWSEmulation
Figure 14: Validation of the emulation of the token-bucketpolicy of Amazon EC2. The similar aspect of the two curvesindicates that emulation is high-quality.
02468
10
Ban
dw
idth
[Gb
ps]
initial budget = 5000
link capacity
budget
initial budget = 1000
0 1000 2000 3000Time [s]
02468
10
Ban
dw
idth
[Gb
ps]
initial budget = 100
0 1000 2000 3000Time [s]
initial budget = 10
010002000300040005000
Bu
dge
t[G
bit
]
010002000300040005000
Bu
dge
t[G
bit
]
Figure 15: Link capacity allocated when running Terasort on atoken bucket. Left vertical axis shows the link capacity; rightvertical axis shows the token bucket budget. Budget depletesdue to application network transfers.
4.2 Experiments and Token-BucketsIn contrast to Google Cloud and HPCCloud, the token-bucketshaping policy of Amazon EC2 is not stochastic noise, andneeds in-depth analysis. Because token-bucket behavior isdependent on past network access patterns, an application in-fluences not only its own runtime, but also future applications’runtimes.
Token-bucket Emulator. We decided to emulate the be-havior of Amazon EC2 token-bucket instead of directly run-ning applications in this cloud. We believe this type of ex-perimentation is superior to the other two alternatives: (i)simulation, or (ii) directly running applications on the cloud.For the former, we believe the behavior of big data applica-tions under network performance variability is far too subtleand complex to properly simulate while modeling and cap-turing all possible variables. For the latter, we perform theemulation in an isolated setup, i.e., a private cluster, that doesnot share resources. This allows us to test in isolation theeffects of network performance variability, excluding as muchas possible all other sources of variability one could encounterin a cloud (e.g., CPU, memory bandwidth, I/O etc.). If wewere to directly run applications in a cloud, it would havebeen difficult to separate the effects of network variability
520 17th USENIX Symposium on Networked Systems Design and Implementation USENIX Association
5000 1000 100 10Initial Budget [Gbits]
0
250
500
750
1000
Tim
e[s
]
(a) Average runtime.
TSWCBSKMS
BS KM S WC TSApplication
0
250
500
750
1000
Tim
e[s
]
(b) Performance variability.
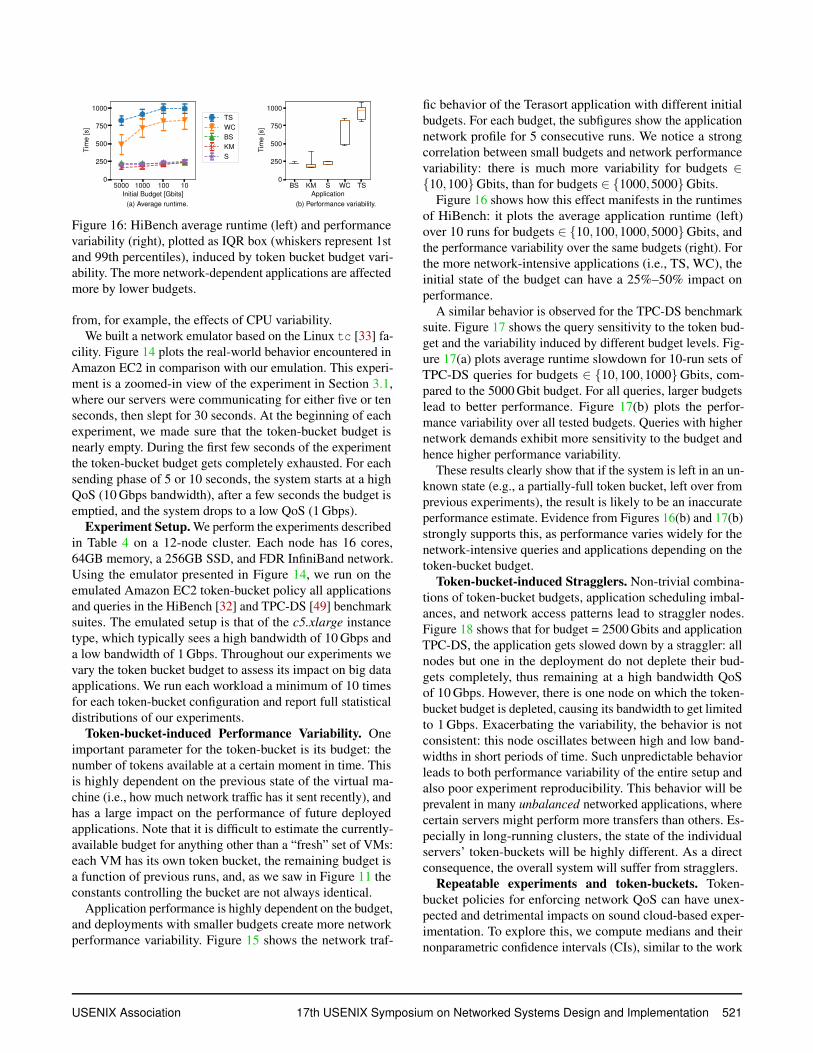
Figure 16: HiBench average runtime (left) and performancevariability (right), plotted as IQR box (whiskers represent 1stand 99th percentiles), induced by token bucket budget vari-ability. The more network-dependent applications are affectedmore by lower budgets.
from, for example, the effects of CPU variability.We built a network emulator based on the Linux tc [33] fa-
cility. Figure 14 plots the real-world behavior encountered inAmazon EC2 in comparison with our emulation. This experi-ment is a zoomed-in view of the experiment in Section 3.1,where our servers were communicating for either five or tenseconds, then slept for 30 seconds. At the beginning of eachexperiment, we made sure that the token-bucket budget isnearly empty. During the first few seconds of the experimentthe token-bucket budget gets completely exhausted. For eachsending phase of 5 or 10 seconds, the system starts at a highQoS (10 Gbps bandwidth), after a few seconds the budget isemptied, and the system drops to a low QoS (1 Gbps).
Experiment Setup. We perform the experiments describedin Table 4 on a 12-node cluster. Each node has 16 cores,64GB memory, a 256GB SSD, and FDR InfiniBand network.Using the emulator presented in Figure 14, we run on theemulated Amazon EC2 token-bucket policy all applicationsand queries in the HiBench [32] and TPC-DS [49] benchmarksuites. The emulated setup is that of the c5.xlarge instancetype, which typically sees a high bandwidth of 10 Gbps anda low bandwidth of 1 Gbps. Throughout our experiments wevary the token bucket budget to assess its impact on big dataapplications. We run each workload a minimum of 10 timesfor each token-bucket configuration and report full statisticaldistributions of our experiments.
Token-bucket-induced Performance Variability. Oneimportant parameter for the token-bucket is its budget: thenumber of tokens available at a certain moment in time. Thisis highly dependent on the previous state of the virtual ma-chine (i.e., how much network traffic has it sent recently), andhas a large impact on the performance of future deployedapplications. Note that it is difficult to estimate the currently-available budget for anything other than a “fresh” set of VMs:each VM has its own token bucket, the remaining budget isa function of previous runs, and, as we saw in Figure 11 theconstants controlling the bucket are not always identical.
Application performance is highly dependent on the budget,and deployments with smaller budgets create more networkperformance variability. Figure 15 shows the network traf-
fic behavior of the Terasort application with different initialbudgets. For each budget, the subfigures show the applicationnetwork profile for 5 consecutive runs. We notice a strongcorrelation between small budgets and network performancevariability: there is much more variability for budgets ∈{10,100}Gbits, than for budgets ∈ {1000,5000}Gbits.
Figure 16 shows how this effect manifests in the runtimesof HiBench: it plots the average application runtime (left)over 10 runs for budgets ∈ {10,100,1000,5000}Gbits, andthe performance variability over the same budgets (right). Forthe more network-intensive applications (i.e., TS, WC), theinitial state of the budget can have a 25%–50% impact onperformance.
A similar behavior is observed for the TPC-DS benchmarksuite. Figure 17 shows the query sensitivity to the token bud-get and the variability induced by different budget levels. Fig-ure 17(a) plots average runtime slowdown for 10-run sets ofTPC-DS queries for budgets ∈ {10,100,1000}Gbits, com-pared to the 5000 Gbit budget. For all queries, larger budgetslead to better performance. Figure 17(b) plots the perfor-mance variability over all tested budgets. Queries with highernetwork demands exhibit more sensitivity to the budget andhence higher performance variability.
These results clearly show that if the system is left in an un-known state (e.g., a partially-full token bucket, left over fromprevious experiments), the result is likely to be an inaccurateperformance estimate. Evidence from Figures 16(b) and 17(b)strongly supports this, as performance varies widely for thenetwork-intensive queries and applications depending on thetoken-bucket budget.
Token-bucket-induced Stragglers. Non-trivial combina-tions of token-bucket budgets, application scheduling imbal-ances, and network access patterns lead to straggler nodes.Figure 18 shows that for budget = 2500 Gbits and applicationTPC-DS, the application gets slowed down by a straggler: allnodes but one in the deployment do not deplete their bud-gets completely, thus remaining at a high bandwidth QoSof 10 Gbps. However, there is one node on which the token-bucket budget is depleted, causing its bandwidth to get limitedto 1 Gbps. Exacerbating the variability, the behavior is notconsistent: this node oscillates between high and low band-widths in short periods of time. Such unpredictable behaviorleads to both performance variability of the entire setup andalso poor experiment reproducibility. This behavior will beprevalent in many unbalanced networked applications, wherecertain servers might perform more transfers than others. Es-pecially in long-running clusters, the state of the individualservers’ token-buckets will be highly different. As a directconsequence, the overall system will suffer from stragglers.
Repeatable experiments and token-buckets. Token-bucket policies for enforcing network QoS can have unex-pected and detrimental impacts on sound cloud-based exper-imentation. To explore this, we compute medians and theirnonparametric confidence intervals (CIs), similar to the work
USENIX Association 17th USENIX Symposium on Networked Systems Design and Implementation 521

3 7 19 27 34 42 43 46 52 53 55 59 63 65 68 70 73 79 82 89 98Query
0
1
2
3
4
5S
low
dow
n budget=5000
(a) Average runtime slowdown per initial budget.
budget=10 budget=100 budget=1000
3 7 19 27 34 42 43 46 52 53 55 59 63 65 68 70 73 79 82 89 98Query
0255075
100125150175200
Tim
e[s
]
(b) Overall performance variability.
Figure 17: TPC-DS average runtime slowdown per query depending on initial budget (top); overall performance variability,summarized over initial budgets (bottom), plotted as IQR box; whiskers represent 1st and 99th percentiles.
0 1000 2000 3000Time [s]
02468
10
Ban
dw
idth
[Gb
ps]
Regular Node
link capacity
budget
0 1000 2000 3000Time [s]
Straggler
010002000300040005000
Bu
dge
t[G
bit
]
Figure 18: Link capacity allocation for TPC-DS on a token-bucket network, with initial budget = 2500 Gbit. Regular nodenetwork utilization (left); straggler node (right).
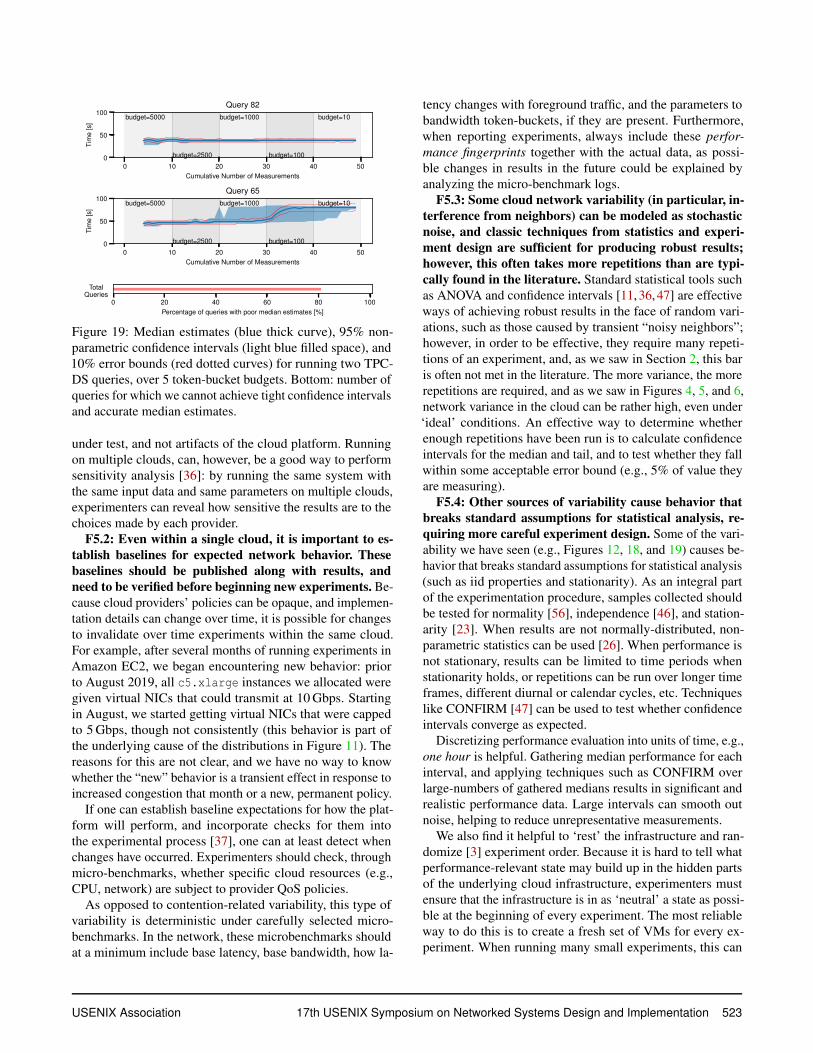
by Maricq et al. [47], across a number of initial token budgets.Figure 19 plots median estimates for two TPC-DS queries,along with 95% CIs and 10% error bounds around medians.Repetitions of the experiments are independent: each oneruns on fresh machines with flushed caches, and at the thebeginning of each repetition, we reset the token budget. Wereduce this initial budget over time to emulate the effectsthat previous experiments can have on subsequent ones: whatthis models is an environment in which many different ex-periments (or repetitions of the same experiment) are run inquick succession. This is likely to happen when running manyexperiments back-to-back in the same VM instances.
Query 82 (in the top of Figure 19) is agnostic to the tokenbudget. Running more repetitions of this experiment tight-ens the confidence intervals, as is expected in CI analysis.In contrast, query 65 (in the bottom of the figure) dependsheavily on the bucket budget; as a result, as we run more ex-periments, depleting the bucket budget, the query slows downsignificantly, and the initial CI estimates turn out to be inac-curate. In fact, the CIs widen with more repetitions, which isunexpected for this type of analysis. This is because the tokenbucket breaks the assumption that experiments are indepen-dent: in this model, more repetitions deplete the bucket thatthe next experiment begins with. These two queries representextremes, but, as shown in the bar graph at the bottom of thefigure, 80% of all queries we ran from TPC-DS suffer effects
like Query 65: most produce median estimates that are morethan 10% incorrect by the time we fully deplete the budget.
This demonstrates that, when designing experiments, wecannot simply rely on the intuition that more repetitions leadto more accurate results: we must ensure that factors hidden inthe cloud infrastructure are reset to known conditions so thateach run is truly independent. Others have shown that cloudproviders use token buckets for other resources such as CPUscheduling [62]. This affects cloud-based experimentation, asthe state of these token buckets is not directly visible to users,nor are their budgets or refill policies.
5 Summary: Is Big Data Performance Repro-ducible in Modern Cloud Networks?
We return to our two basic questions: (1) How reproducibleare big data experiments in the cloud?; and (2) What canexperimenters do to make make sure their experiments aremeaningful and robust? Our findings are:
F5.1: Network-heavy experiments run on differentclouds cannot be directly compared. Building a cloud in-volves trade-offs and implementation decisions, especiallyat the virtualization layer. Some of these decisions are well-documented by the platforms [6,28], but others, including theones we have examined in this paper, are not. Unfortunately,these differences can cause behaviors that result in differentapplication performance, such as the bandwidth differencesseen in Figure 10 or the latency effects seen in Figure 12.
Both of these effects are rather large, and are dependent onfactors such as the size of the application’s write buffer andspecific patterns of communication. While these decisionspresumably serve the clouds’ commercial customers well,they complicate things for those who are trying to draw sci-entific conclusions; when comparing to previously-publishedperformance numbers, it is important to use the same cloudto ensure that differences measured are that of the systems
522 17th USENIX Symposium on Networked Systems Design and Implementation USENIX Association
0 10 20 30 40 50Cumulative Number of Measurements
0
50
100
Tim
e[s
]
budget=5000
budget=2500
budget=1000
budget=100
budget=10
Query 82
0 10 20 30 40 50Cumulative Number of Measurements
0
50
100
Tim
e[s
]
budget=5000
budget=2500
budget=1000
budget=100
budget=10
Query 65
0 20 40 60 80 100Percentage of queries with poor median estimates [%]
TotalQueries
Figure 19: Median estimates (blue thick curve), 95% non-parametric confidence intervals (light blue filled space), and10% error bounds (red dotted curves) for running two TPC-DS queries, over 5 token-bucket budgets. Bottom: number ofqueries for which we cannot achieve tight confidence intervalsand accurate median estimates.
under test, and not artifacts of the cloud platform. Runningon multiple clouds, can, however, be a good way to performsensitivity analysis [36]: by running the same system withthe same input data and same parameters on multiple clouds,experimenters can reveal how sensitive the results are to thechoices made by each provider.
F5.2: Even within a single cloud, it is important to es-tablish baselines for expected network behavior. Thesebaselines should be published along with results, andneed to be verified before beginning new experiments. Be-cause cloud providers’ policies can be opaque, and implemen-tation details can change over time, it is possible for changesto invalidate over time experiments within the same cloud.For example, after several months of running experiments inAmazon EC2, we began encountering new behavior: priorto August 2019, all c5.xlarge instances we allocated weregiven virtual NICs that could transmit at 10 Gbps. Startingin August, we started getting virtual NICs that were cappedto 5 Gbps, though not consistently (this behavior is part ofthe underlying cause of the distributions in Figure 11). Thereasons for this are not clear, and we have no way to knowwhether the “new” behavior is a transient effect in response toincreased congestion that month or a new, permanent policy.
If one can establish baseline expectations for how the plat-form will perform, and incorporate checks for them intothe experimental process [37], one can at least detect whenchanges have occurred. Experimenters should check, throughmicro-benchmarks, whether specific cloud resources (e.g.,CPU, network) are subject to provider QoS policies.
As opposed to contention-related variability, this type ofvariability is deterministic under carefully selected micro-benchmarks. In the network, these microbenchmarks shouldat a minimum include base latency, base bandwidth, how la-
tency changes with foreground traffic, and the parameters tobandwidth token-buckets, if they are present. Furthermore,when reporting experiments, always include these perfor-mance fingerprints together with the actual data, as possi-ble changes in results in the future could be explained byanalyzing the micro-benchmark logs.
F5.3: Some cloud network variability (in particular, in-terference from neighbors) can be modeled as stochasticnoise, and classic techniques from statistics and experi-ment design are sufficient for producing robust results;however, this often takes more repetitions than are typi-cally found in the literature. Standard statistical tools suchas ANOVA and confidence intervals [11, 36, 47] are effectiveways of achieving robust results in the face of random vari-ations, such as those caused by transient “noisy neighbors”;however, in order to be effective, they require many repeti-tions of an experiment, and, as we saw in Section 2, this baris often not met in the literature. The more variance, the morerepetitions are required, and as we saw in Figures 4, 5, and 6,network variance in the cloud can be rather high, even under‘ideal’ conditions. An effective way to determine whetherenough repetitions have been run is to calculate confidenceintervals for the median and tail, and to test whether they fallwithin some acceptable error bound (e.g., 5% of value theyare measuring).
F5.4: Other sources of variability cause behavior thatbreaks standard assumptions for statistical analysis, re-quiring more careful experiment design. Some of the vari-ability we have seen (e.g., Figures 12, 18, and 19) causes be-havior that breaks standard assumptions for statistical analysis(such as iid properties and stationarity). As an integral partof the experimentation procedure, samples collected shouldbe tested for normality [56], independence [46], and station-arity [23]. When results are not normally-distributed, non-parametric statistics can be used [26]. When performance isnot stationary, results can be limited to time periods whenstationarity holds, or repetitions can be run over longer timeframes, different diurnal or calendar cycles, etc. Techniqueslike CONFIRM [47] can be used to test whether confidenceintervals converge as expected.
Discretizing performance evaluation into units of time, e.g.,one hour is helpful. Gathering median performance for eachinterval, and applying techniques such as CONFIRM overlarge-numbers of gathered medians results in significant andrealistic performance data. Large intervals can smooth outnoise, helping to reduce unrepresentative measurements.
We also find it helpful to ‘rest’ the infrastructure and ran-domize [3] experiment order. Because it is hard to tell whatperformance-relevant state may build up in the hidden partsof the underlying cloud infrastructure, experimenters mustensure that the infrastructure is in as ‘neutral’ a state as possi-ble at the beginning of every experiment. The most reliableway to do this is to create a fresh set of VMs for every ex-periment. When running many small experiments, this can
USENIX Association 17th USENIX Symposium on Networked Systems Design and Implementation 523
be cost- or time-prohibitive: in these cases, adding delaysbetween experiments run in the same VMs can help. Dataused while gathering baseline runs can be used to determinethe appropriate length (e.g., seconds or minutes) of these rests.Randomized experiment order is a useful technique for avoid-ing self-interference.
F5.5: Network performance on clouds is largely a func-tion of provider implementation and policies, which canchange at any time. Experimenters cannot treat “the cloud”as an opaque entity; results are significantly impacted byplatform details that may or may not be public, and that aresubject to change. (Indeed, much of the behavior that we doc-ument in Sections 3 and 4 is unlikely to be static over time.)Experimenters can safeguard against this by publishing asmuch detail as possible about experiment setup (e.g., instancetype, region, date of experiment), establishing baseline per-formance numbers for the cloud itself, and only comparingresults to future experiments when these baselines match.
Applicability to other domains. In this paper, we focusedon big data applications and therefore our findings are mostapplicable in this domain. The cloud-network related findingswe present in Section 3 are general, so practitioners from otherdomains (e.g., HPC) should take them in to account whendesigning systems and experiments. However, focusing indepth on other domains might reveal interactions between net-work variability and experiments that are not applicable to bigdata due to the intrinsic application characteristics. Therefore,while our findings in Section 4 apply to most other networkedapplications, they need not be complete. We also believe thata community-wide effort for gathering cloud variability datawill help us automate reproducible experiment design thatachieves robust and meaningful performance results.
6 Related Work
We have showed the extent of network performance variabil-ity in modern clouds, as well as how practitioners disregardcloud performance variability when designing and runningexperiments. Moreover, we have showed what the impact ofnetwork performance variability is on experiment design andon the performance of big data applications. We discuss ourcontributions in contrast to several categories of related work.
Sound Experimentation (in the Cloud). Several articlesalready discuss pitfalls of systems experiment design and pre-sentation. Such work fits two categories: guidelines for betterexperiment design [3,17,38,47] and avoiding logical fallaciesin reasoning and presentation of empirical results [10, 21, 31].Adding to this type of work, we survey how practitioners ap-ply such knowledge, and assess the impact of poor experimentdesign on the reliability of the achieved results. We investi-gate the impact of variability on performance reproducibility,and uncover variability behavior on modern clouds.
Network Variability and Guarantees. Network variabil-ity has been studied throughout the years in multiple contexts,
such as HPC [8, 9], experimental testbeds [47] and virtual-ized environments [35, 40, 55]. In the latter scenario, manystudies have already assessed the performance variability ofcloud datacenter networks [43, 51, 63]. To counteract thisbehavior, cloud providers tackle the variability problem atthe infrastructure level [12, 52]. In general, these approachesintroduce network virtualization [30, 54], or traffic shapingmechanisms [18], such as the token buckets we identified, atthe networking layer (per VM or network device), as well asa scheduling (and placement) policy framework [41]. In thiswork, we considered both types of variability: the one givenby resource sharing and the one introduced by the interactionbetween applications and cloud QoS policies.
Variability-aware Network Modeling, Simulation, andEmulation. Modeling variable networks [27, 45] is a topic ofinterest. Kanev et al. [39] profiled and measured more than20,000 Google machines to understand the impact of perfor-mance variability on commonly used workloads in clouds.Uta et al. emulate gigabit real-world cloud networks to studytheir impact on the performance of batch-processing applica-tions [60]. Casale and Tribastone [14] model the exogenousvariability of cloud workloads as continuous-time Markovchains. Such work cannot isolate the behavior of network-level variability compared to other types of resources.
7 Conclusion
We studied the impact of cloud network performance vari-ability, characterizing its impact on big data experiment re-producibility. We found that many articles disregard networkvariability in the cloud and perform a limited number of rep-etitions, which poses a serious threat to the validity of con-clusions drawn from such experiment designs. We uncoveredand characterized the network variability of modern cloud net-works and showed that network performance variability leadsto variable slowdowns and poor performance predictability,resulting in non-reproducible performance evaluations. Tocounter such behavior, we proposed protocols to achieve reli-able cloud-based experimentation. As future work, we hopeto extend this analysis to application domains other than bigdata and develop software tools to automate the design ofreproducible experiments in the cloud.
Acknowledgements
We thank our shepherd Amar Phanishayee and all the anony-mous reviewers for all their valuable suggestions. Work onthis article was funded via NWO VIDI MagnaData (#14826),SURFsara e-infra180061, as well as NSF Grant numbersCNS-1419199, CNS-1743363, OAC-1836650, CNS-1764102,CNS-1705021, OAC-1450488, and the Center for Researchin Open Source Software.
524 17th USENIX Symposium on Networked Systems Design and Implementation USENIX Association
Appendix – Code and Data Artifacts
Raw Cloud Data:DOI:10.5281/zenodo.3576604
Bandwidth Emulator:github.com/alexandru-uta/bandwidth_emulator
Cloud Benchmarking:github.com/alexandru-uta/measure-tcp-latency
References
[1] Proceedings of the 26th Symposium on Operating Sys-tems Principles, Shanghai, China, October 28-31, 2017.ACM, 2017.
[2] Proceedings of the International Conference for HighPerformance Computing, Networking, Storage, andAnalysis, SC 2018, Dallas, TX, USA, November 11-16,2018. IEEE / ACM, 2018.
[3] A. Abedi and T. Brecht. Conducting repeatable experi-ments in highly variable cloud computing environments.In Proceedings of the 8th ACM/SPEC on InternationalConference on Performance Engineering, pages 287–292. ACM, 2017.
[4] M. Armbrust, R. S. Xin, C. Lian, Y. Huai, D. Liu, J. K.Bradley, X. Meng, T. Kaftan, M. J. Franklin, A. Ghodsi,et al. Spark SQL: Relational data processing in spark. InProceedings of the 2015 ACM SIGMOD InternationalConference on Management of Data, pages 1383–1394.ACM, 2015.
[5] A. C. Arpaci-Dusseau and G. Voelker, editors. 13thUSENIX Symposium on Operating Systems Design andImplementation, OSDI 2018, Carlsbad, CA, USA, Octo-ber 8-10, 2018. USENIX Association, 2018.
[6] AWS Enhanced Networking. https://aws.amazon.com/ec2/features/#enhanced-networking, 2019.
[7] H. Ballani, P. Costa, T. Karagiannis, and A. Rowstron.Towards predictable datacenter networks. In ACM SIG-COMM Computer Communication Review, volume 41,pages 242–253. ACM, 2011.
[8] A. Bhatele, K. Mohror, S. H. Langer, and K. E. Isaacs.There goes the neighborhood: performance degradationdue to nearby jobs. In Proceedings of the InternationalConference on High Performance Computing, Network-ing, Storage and Analysis, page 41. ACM, 2013.
[9] A. Bhatele, A. R. Titus, J. J. Thiagarajan, N. Jain,T. Gamblin, P.-T. Bremer, M. Schulz, and L. V. Kale.Identifying the culprits behind network congestion. In
2015 IEEE International Parallel and Distributed Pro-cessing Symposium, pages 113–122. IEEE, 2015.
[10] S. M. Blackburn, A. Diwan, M. Hauswirth, P. F.Sweeney, J. N. Amaral, T. Brecht, L. Bulej, C. Click,L. Eeckhout, S. Fischmeister, et al. The truth, the wholetruth, and nothing but the truth: A pragmatic guide toassessing empirical evaluations. ACM Transactionson Programming Languages and Systems (TOPLAS),38(4):15, 2016.
[11] J.-Y. L. Boudec. Performance Evaluation of Computerand Communication Systems. EFPL Press, 2011.
[12] B. Briscoe and M. Sridharan. Network performanceisolation in data centres using congestion exposure(ConEx). IETF draft, 2012.
[13] Z. Cao, V. Tarasov, H. P. Raman, D. Hildebrand, andE. Zadok. On the performance variation in modernstorage stacks. In 15th USENIX Conference on File andStorage Technologies (FAST 17), pages 329–344, 2017.
[14] G. Casale and M. Tribastone. Modelling exogenousvariability in cloud deployments. ACM SIGMETRICSPerformance Evaluation Review, 2013.
[15] N. Chaimov, A. Malony, S. Canon, C. Iancu, K. Z.Ibrahim, and J. Srinivasan. Scaling Spark on HPCsystems. In Proceedings of the 25th ACM Interna-tional Symposium on High-Performance Parallel andDistributed Computing, pages 97–110. ACM, 2016.
[16] J. Cohen. A coefficient of agreement for nominal scales.Educational and psychological measurement, 20(1):37–46, 1960.
[17] C. Curtsinger and E. D. Berger. Stabilizer: Statisticallysound performance evaluation. SIGARCH Comput. Ar-chit. News, 41(1):219–228, Mar. 2013.
[18] M. Dalton, D. Schultz, J. Adriaens, A. Arefin, A. Gupta,B. Fahs, D. Rubinstein, E. C. Zermeno, E. Rubow, J. A.Docauer, et al. Andromeda: Performance, isolation, andvelocity at scale in cloud network virtualization. In 15thUSENIX Symposium on Networked Systems Design andImplementation (NSDI’18), pages 373–387, 2018.
[19] Databricks Project Tungsten. https://databricks.com/blog/2015/04/28/project-tungsten-bringing-spark-closer-to-bare-metal.html.
[20] Databricks Instance Types. https://databricks.com/product/aws-pricing/instance-types, 2019.
USENIX Association 17th USENIX Symposium on Networked Systems Design and Implementation 525

[21] A. B. De Oliveira, S. Fischmeister, A. Diwan,M. Hauswirth, and P. F. Sweeney. Why you should careabout quantile regression. In ACM SIGPLAN Notices,volume 48, pages 207–218. ACM, 2013.
[22] J. Dean and L. A. Barroso. The tail at scale. Communi-cations of the ACM, 56(2):74–80, 2013.
[23] D. A. Dickey and W. A. Fuller. Distribution of theestimators for autoregressive time series with a unitroot. Journal of the American Statistical Association,74(366a):427–431, 1979.
[24] B. Farley, A. Juels, V. Varadarajan, T. Ristenpart, K. D.Bowers, and M. M. Swift. More for your money: ex-ploiting performance heterogeneity in public clouds. InProceedings of the Third ACM Symposium on CloudComputing, page 20. ACM, 2012.
[25] B. Ghit and D. Epema. Reducing job slowdown vari-ability for data-intensive workloads. In 2015 IEEE 23rdInternational Symposium on Modeling, Analysis, andSimulation of Computer and Telecommunication Sys-tems. IEEE, 2015.
[26] J. D. Gibbons and S. Chakraborti. Nonparametric sta-tistical inference. Springer, 2011.
[27] Y. Gong, B. He, and D. Li. Finding constant fromchange: Revisiting network performance aware opti-mizations on iaas clouds. In Proceedings of the In-ternational Conference for High Performance Comput-ing, Networking, Storage and Analysis, pages 982–993.IEEE Press, 2014.
[28] Google Andromeda Networking. https://cloud.google.com/blog/products/networking/google-cloud-networking-in-depth-how-andromeda-2-2-enables-high-throughput-vms,2019.
[29] M. P. Grosvenor, M. Schwarzkopf, I. Gog, R. N. Watson,A. W. Moore, S. Hand, and J. Crowcroft. Queues don’tmatter when you can JUMP them! In 12th USENIXSymposium on Networked Systems Design and Imple-mentation (NSDI’15), pages 1–14, 2015.
[30] C. Guo, G. Lu, H. J. Wang, S. Yang, C. Kong, P. Sun,W. Wu, and Y. Zhang. Secondnet: a data center networkvirtualization architecture with bandwidth guarantees.In Proceedings of the 6th International Co-NEXT Con-ference, page 15. ACM, 2010.
[31] T. Hoefler and R. Belli. Scientific benchmarking of par-allel computing systems: twelve ways to tell the masseswhen reporting performance results. In Proceedingsof the International Conference for High PerformanceComputing, Networking, Storage and Analysis. ACM,2015.
[32] S. Huang, J. Huang, J. Dai, T. Xie, and B. Huang.The hibench benchmark suite: Characterization of themapreduce-based data analysis. In Data EngineeringWorkshops (ICDEW), 2010 IEEE 26th InternationalConference on, pages 41–51. IEEE, 2010.
[33] B. Hubert, T. Graf, G. Maxwell, R. van Mook, M. vanOosterhout, P. Schroeder, J. Spaans, and P. Larroy. Linuxadvanced routing & traffic control. In Ottawa LinuxSymposium, page 213, 2002.
[34] A. Iosup, A. Uta, L. Versluis, G. Andreadis, E. Van Eyk,T. Hegeman, S. Talluri, V. Van Beek, and L. Toader.Massivizing computer systems: a vision to understand,design, and engineer computer ecosystems through andbeyond modern distributed systems. In 2018 IEEE 38thInternational Conference on Distributed Computing Sys-tems (ICDCS), pages 1224–1237. IEEE, 2018.
[35] A. Iosup, N. Yigitbasi, and D. Epema. On the perfor-mance variability of production cloud services. In Clus-ter, Cloud and Grid Computing (CCGrid), 2011 11thIEEE/ACM International Symposium on, pages 104–113.IEEE, 2011.
[36] R. Jain. The art of computer systems performance anal-ysis: techniques for experimental design, measurement,simulation, and modeling. John Wiley & Sons, 1990.
[37] I. Jimenez, M. Sevilla, N. Watkins, C. Maltzahn, J. Lof-stead, K. Mohror, A. Arpaci-Dusseau, and R. Arpaci-Dusseau. The popper convention: Making reproduciblesystems evaluation practical. In 2017 IEEE Interna-tional Parallel and Distributed Processing SymposiumWorkshops (IPDPSW), pages 1561–1570. IEEE, 2017.
[38] T. Kalibera and R. Jones. Rigorous benchmarking inreasonable time. SIGPLAN Not., 48, 2013.
[39] S. Kanev, J. P. Darago, K. Hazelwood, P. Ranganathan,T. Moseley, G.-Y. Wei, and D. Brooks. Profiling awarehouse-scale computer. In ACM SIGARCH Com-puter Architecture News, volume 43, pages 158–169.ACM, 2015.
[40] D. Kossmann, T. Kraska, and S. Loesing. An evaluationof alternative architectures for transaction processing inthe cloud. In Proceedings of the 2010 ACM SIGMODInternational Conference on Management of data. ACM,2010.
[41] K. LaCurts, S. Deng, A. Goyal, and H. Balakrishnan.Choreo: Network-aware task placement for cloud ap-plications. In Proceedings of the 2013 conference onInternet measurement conference, pages 191–204. ACM,2013.
526 17th USENIX Symposium on Networked Systems Design and Implementation USENIX Association

[42] P. Leitner and J. Cito. Patterns in the chaos–a studyof performance variation and predictability in publiciaas clouds. ACM Transactions on Internet Technology(TOIT), 16(3):15, 2016.
[43] A. Li, X. Yang, S. Kandula, and M. Zhang. Cloudcmp:comparing public cloud providers. In Proceedings ofthe 10th ACM SIGCOMM conference on Internet mea-surement, pages 1–14. ACM, 2010.
[44] J. R. Lorch and M. Yu, editors. 16th USENIX Sympo-sium on Networked Systems Design and Implementa-tion, NSDI 2019, Boston, MA, February 26-28, 2019.USENIX Association, 2019.
[45] S. Madireddy, P. Balaprakash, P. Carns, R. Latham,R. Ross, S. Snyder, and S. Wild. Modeling I/O per-formance variability using conditional variational au-toencoders. In 2018 IEEE International Conference onCluster Computing (CLUSTER), pages 109–113. IEEE,2018.
[46] H. B. Mann and D. R. Whitney. On a test of whetherone of two random variables is stochastically larger thanthe other. The Annals of Mathematical Statistics, pages50–60, 1947.
[47] A. Maricq, D. Duplyakin, I. Jimenez, C. Maltzahn,R. Stutsman, and R. Ricci. Taming performance variabil-ity. In 13th USENIX Symposium on Operating SystemsDesign and Implementation (OSDI 18), pages 409–425,2018.
[48] J. C. Mogul and L. Popa. What we talk about when wetalk about cloud network performance. ACM SIGCOMMComputer Communication Review, 42(5):44–48, 2012.
[49] R. O. Nambiar and M. Poess. The making of TPC-DS.In VLDB, 2006.
[50] K. Ousterhout, R. Rasti, S. Ratnasamy, S. Shenker, andB.-G. Chun. Making sense of performance in data an-alytics frameworks. In NSDI ’15, volume 15, pages293–307, 2015.
[51] V. Persico, P. Marchetta, A. Botta, and A. Pescapé. Mea-suring network throughput in the cloud: the case ofamazon ec2. Computer Networks, 93:408–422, 2015.
[52] B. Raghavan, K. Vishwanath, S. Ramabhadran,K. Yocum, and A. C. Snoeren. Cloud control withdistributed rate limiting. ACM SIGCOMM ComputerCommunication Review, 37(4):337–348, 2007.
[53] J. Rexford, M. Balazinska, D. Culler, and J. Wing. En-abling computer and information science and engineer-ing research and education in the cloud. 2018.
[54] H. Rodrigues, J. R. Santos, Y. Turner, P. Soares, and D. O.Guedes. Gatekeeper: Supporting bandwidth guaranteesfor multi-tenant datacenter networks. In WIOV, 2011.
[55] J. Schad, J. Dittrich, and J.-A. Quiané-Ruiz. Runtimemeasurements in the cloud: observing, analyzing, and re-ducing variance. Proceedings of the VLDB Endowment,3(1-2):460–471, 2010.
[56] S. Shapiro and M. Wilk. An analysis of variance testfor normality (complete samples). Biometricka, 52:591–611, Dec. 1965.
[57] L. Suresh, M. Canini, S. Schmid, and A. Feldmann. C3:Cutting tail latency in cloud data stores via adaptivereplica selection. In 12th USENIX Symposium on Net-worked Systems Design and Implementation (NSDI’15),pages 513–527, 2015.
[58] A. Trivedi, P. Stuedi, J. Pfefferle, A. Schuepbach, andB. Metzler. Albis: High-performance file format forbig data systems. In 2018 USENIX Annual TechnicalConference (USENIX ATC 18), pages 615–630, 2018.
[59] A. Uta, A. Custura, D. Duplyakin, I. Jimenez, J. Reller-meyer, C. Maltzahn, R. Ricci, and A. Iosup. Cloud Net-work Performance Variability Repository. https://zenodo.org/record/3576604#.XfeXaOuxXOQ, 2019.
[60] A. Uta and H. Obaseki. A performance study of big dataworkloads in cloud datacenters with network variability.In Companion of the 2018 ACM/SPEC InternationalConference on Performance Engineering. ACM, 2018.
[61] A. J. Viera, J. M. Garrett, et al. Understanding in-terobserver agreement: the kappa statistic. Fam med,37(5):360–363, 2005.
[62] C. Wang, B. Urgaonkar, N. Nasiriani, and G. Kesidis. Us-ing burstable instances in the public cloud: Why, whenand how? Proceedings of the ACM on Measurementand Analysis of Computing Systems, 1(1):11, 2017.
[63] G. Wang and T. E. Ng. The impact of virtualizationon network performance of amazon ec2 data center. InINFOCOM. IEEE, 2010.
[64] T. White. Hadoop: The definitive guide. " O’ReillyMedia, Inc.", 2012.
[65] M. Zaharia, M. Chowdhury, T. Das, A. Dave, J. Ma,M. McCauley, M. J. Franklin, S. Shenker, and I. Stoica.Resilient distributed datasets: A fault-tolerant abstrac-tion for in-memory cluster computing. In NSDI’12.USENIX, 2012.
USENIX Association 17th USENIX Symposium on Networked Systems Design and Implementation 527