is chile a role model for development? -...
TRANSCRIPT

81Is Chile a Role Model for Development?
The Chilean economy is usually highly praised by some international financial institutions (IFIs), diverse political authorities and international ana-lysts. A generalized view prevails that there has been “one” successful Chilean model since the imposition of neo-liberal reforms under the dictatorship of general Pinochet in 1973. However, the four decades that have subsequently elapsed include several sub-periods with different policy approaches and external environments, as well as notably diverse economic and social outcomes. Accordingly, there is neither one unique model nor only one outcome. Sometimes, Chile has performed closer to become a “model” for development, and at other times the opposite or something in between.
Economic development at least includes the production of goods and services and its distribution among citizens. Accordingly, we will explore how both have evolved along the four decades, given that a role model case should be consistently achieving success in terms of both economic growth and its distribution.
In section I, a summary evaluation is presented of policies and outcomes during the four decades. Section II focuses on three episodes: one corresponds to the first half of the dictatorship, in 1973–1981; a second one during the first years of return to democ-racy, namely 1990–1995; and finally the period since the contagion of the global crisis, 2008–2013. Section III concludes.
IS CHILE A ROLE MODEL FOR DEVELOPMENT?*Ricardo Ffrench-Davis
* This chapter is based on material developed in Ffrench-Davis (2010, 2014). Most figures cited come from these publications, based on Central Bank, Ministry of Finance and National Institute of Statistics. I appreciate the support of CIEPLAN and the assistance of Simón Ballesteros and Nicolás Fernández.
Abstract
The Chilean economy is usually highly praised as having been successful since the imposition of neo-liberal reforms under the dictatorship of general Pinochet in 1973. However, the four decades that have elapsed include sub-periods with quite different policy approaches and notably diverse outcomes; thus, there is neither one unique model nor only one outcome. The four decades’ growth is moderate, averaging 4.2 per cent per year: it averaged 2.9 per cent (meagre) during the 16 years of dictatorship and a good performance of 5.1 per cent during a quarter-century of democracy, albeit with a vigorous 7.1 per cent in the initial years (1990–1998) and a modest 3.9 per cent in the last 15 years. Hence, sometimes, Chile has performed closer to becoming a “model” for development, and at other times the opposite or something in between. Focusing on three episodes (1973–1981, 1990–1995 and 2008–2013), we explore the underlying explanatory variables and some lessons for building “a model for development”.
Introduction
82 Rethinking Development Strategies after the Financial Crisis – Volume II: Country Studies and International Comparisons
In the five Governments under democracy (1990–2013), industrial or productive development policies have been largely absent, as they had been under the dictatorship; the Pinochet dictatorship had eliminated most of them in the early years of his regime. On the contrary, macroeconomic and social policies have undergone significant changes; in particular, the macroeconomic regime experienced notable contrasts among and within the periods 1973–1981, 1982–1989, 1990–1998, 1999–2007 and 2008–2013.
The first deep reforms were launched in 1973. This stage of the reforms (1973–1981) was character-ized by the implementation of a neo-liberal model in its purest and ideological form. Trade and financial liberalization practically free from prudential regula-tion, as well as the adoption of “neutral” economic policies – under the view that “always the market knows better” – were accompanied by massive privatizations. By 1981, success had been generally achieved in reducing inflation and eliminating the fiscal deficit inherited, albeit at the expense of the external balance, a highly appreciated exchange rate and huge external debt, while recording climbing financial savings yet a low investment ratio. The outcome was a banking and foreign exchange crisis with huge economic and social impacts in 1982, including a gross domestic product (GDP) drop of 14 per cent, high unemployment exceeding 30 per cent of the labour force and a significant increase in poverty, with a worsening income distribution.
The second stage of the dictatorship (1982–1989) implied moves toward more pragmatic policies to overcome the effects of the deep crisis. It involved a series of foreign debt renegotiations, several policy interventions aimed at balancing the external defi-cit – such as tariff increases and “selective” export incentives – and the Government’s direct take-over of the collapsed financial system, before subsequently privatizing it again when their balance sheets were in order, thanks to heavy public subsidies to banks and debtors, costing the Treasury some 35 per cent of annual GDP. At the end of this period, the economy had recovered, while income distribution had worsened even further than in the 1970s. During recovery, actual GDP grew vigorously, but after due consideration of the 1982 recession it emerges that average annual growth was 3 per cent or under in both halves of the Pinochet regime.
A third variant of the economic model began in 1990, during the return to democracy, when the Chilean economy faced the challenges of achieving a sustained high average GDP growth and serving the great social debt accumulated in the years of dictatorship. The formal slogan of the Concertación Democrática, a centre-left coalition of socialists and Christian democrats, was “change with stability” for achieving growth with equity in the socio-economic dimension of the programme of the new Government.
There were significant reforms of the market model, strengthening the social component and correcting severe pro-cyclical failures of economic policies, including labour and tax reforms to improve social expenditure. In addition, substantive counter-cyclical changes in fiscal, monetary, capital markets, exchange rate and regulatory policies were imple-mented, aiming at a sustainable real macroeconomic environment (beyond inflation and fiscal balance under control, an aggregate demand consistent with potential GDP and sustainable external balance and exchange rate).1
The new authorities considered these balances of the real economy crucial for development (meant as GDP growth with reduced inequality). One out-standing feature of this period was the regulation of the capital account, with a flexible reserve require-ment (encaje), which was quite active in these years of large supply of financial flows to the emerging economies. The counter-cyclical active regulation helped to control the volume of inflows, shifting its composition to the long term and their allocation in productive investment; moreover, it provided space for monetary policy and avoided undue exchange rate appreciation and instability. The economy benefited from comprehensive real macroeconomic stability, which is meant to be development-friendly, although there was practically no room for direct industrial or productive development policies nor for direct sup-port to small- and medium-sized enterprises (SMEs). The constitution inherited from Pinochet and the strong ideological fashion against selective develop-ment policies represented two particular obstacles.
Owing to the reformed macroeconomic policies, most of the period’s economic activity was close to potential GDP, which had only been the case in 1974, 1981 and 1989 during the dictatorship. It was in this reformed macro-environment that Chile expanded its
I. An overview of four decades

83Is Chile a Role Model for Development?
productive capacity in a sustainable manner between 1990 and 1998, with actual and potential GDP grow-ing in parallel at annual rates averaging 7.1 per cent, while also improving social indicators (table 1).
After the mid-1990s, Chile (actually the autono-mous Central Bank) gradually moved towards the neo-liberal fashion of capital account and exchange rate liberalization. The Treasury and the Ministry for the Economy were initially critical of the move, although some years later the Treasury also joined the fashion. Consequently, the exchange rate and domestic demand came to be led by financial flows and fell victim to their volatility. Thus, Chile became vulnerable to the turbulences originated by the Asian crisis in 1998, since it had allowed the exchange rate to appreciate “too much” and external deficit to double in 1996–1997 in comparison with 1990–1995. This was in acute contrast with the situation when Chile was immune to the Mexican financial crisis in 1995.
Vulnerability was aggravated with the full liberalization of the exchange rate in 1999 and the capital account in 2001. Subsequently, the economy exhibited a stagnating actual output and a drop in the growth of potential GDP during 1999–2003, when unemployment increased, while the richer/poorer quintiles ratio rose (back to 16 times). After a partial recovery in 2004–2008, led by a sharp improvement in the terms of trade, it suffered the arrival of the contagion of the global crisis in late 2008 and 2009. Export volumes and prices fell and capital inflows were reversed. Thanks to a sharply improved domestic macroeconomic management, with strong counter-cyclical fiscal policy and a pro-gressive bias (subsidies to youth employment and the unemployed), as well as the fortunate help of a rapid recovery of export prices, there was a solid revival of economic activity by late 2009.
Recovery was undeterred by a great earthquake in 2010, pushing actual GDP near its potential output by 2012. The average increase in GDP was 3.9 per cent between its peaks in 1998 and 2013.2 While this figure was greater than the 2.9 per cent of the dictatorship, it remained far weaker than the 7.1 per cent recorded during the first nine years of democratic regimes.
The fluctuating growth dynamism implies a vari-able development gap with the developed economies. Indeed, table 2 shows that the gap with developed
countries increased during the dictatorship. On the contrary, the rather good average performance in the two and half decades of democracy implied that Chile had reduced the distance with the developed world and left behind most of Latin America, as depicted in table 2. Nevertheless, this performance was not continuous. As shown in table 1, only the first half of the 1990s involved a vigorous GDP per capita growth (tripling the speed of the one of the United States), with a strong development convergence with the developed countries (the per capita income gap fell by one percentage point per year), including a significant reduction in income inequality with improvements in
Table 1
ABSOLUTE AND PER CAPITA GDP AND INCOME DISTRIBUTION, 1974–2013
GDP growth
(Per cent)
Per capita GDP growth(Per cent)
Q5/Q1 ratio
Gini coefficient
(1) (2) (3) (4)
1974–1981 3.0 1.5 15.1 51.91982–1989 2.9 1.2 20.2 56.71990–1995 7.9 6.0 15.3 52.71996–1998 5.8 4.3 16.0 53.21999–2007 3.9 2.8 15.4 52.72008–2013 3.9 2.9 12.3 49.21990–2013 5.1 3.8 14.7 51.9
Source: Ffrench-Davis (2014).Note: Data refer to annual averages. For the 1992–1995
subperiod, the Q5/Q1 ratio is 13.7 and the Gini coefficient is 50.9.
Table 2
PER CAPITA GDP IN CHILE RELATIVE TO OTHER BENCHMARKS, 1973–2013
(Per cent)
United States G-7 Latin America
1973 23 29 821989 21 25 911997 29 34 1282013 37 44 148
Source: Author’s calculations, based on IMF, World Economic Outlook database; World Bank, World Development Indicators database; ECLAC database; and Central Bank of Chile data.
Note: Data refer to PPP dollars.
84 Rethinking Development Strategies after the Financial Crisis – Volume II: Country Studies and International Comparisons
income distribution (to a richer/poorer quintiles ratio of 13.7). This shortening distance continued in the long second half (1999–2013), although per capita GDP growth trend halved and the strong development
convergence exhibited in 1990–1998 was weakened (to only one half percentage point per year), as well as previous improvements in income distribution and the intensity of poverty reduction.
A. The neo-liberal revolution, 1973–1981
Launched after the military coup of 11 September 1973, the first stage of the economic reforms (1973–1981) represented an extreme case due to the amplitude of the role granted to the market, the inten-sive privatization of the means of production, sharp liberalization of imports and the domestic financial markets, as well as the regressive changes imposed on social organizations. There was a determinant emphasis on the “neutrality” of economic policies, disregarding the high existing inequality, under the belief that the “market always knows better” and provides equitable outcomes.
The initial concerns of Pinochet’s Government lay with controlling the acute macroeconomic disequilibria inherited, particularly a 700 per cent hyper-inflation recorded in 1973, with the reduction of a huge fiscal deficit assuming top priority.
In 1973–1974, the Government benefited from a very high copper price (by far the main export, by a public firm – CODELCO), which increased public revenue and the availability of foreign currency. While it was evident to independent observers that the price was unsustainably high, the revenue from copper exports was fully spent by the Government pari passu with its collection. Economic activity significantly recovered in 1974, making use of installed capacity underutilized during the previous year. However, the price of copper sharply declined in late 1974, prompting the Government to introduce a tougher adjustment programme in 1975, led by fiscal and monetary contraction and significant exchange rate devaluation.
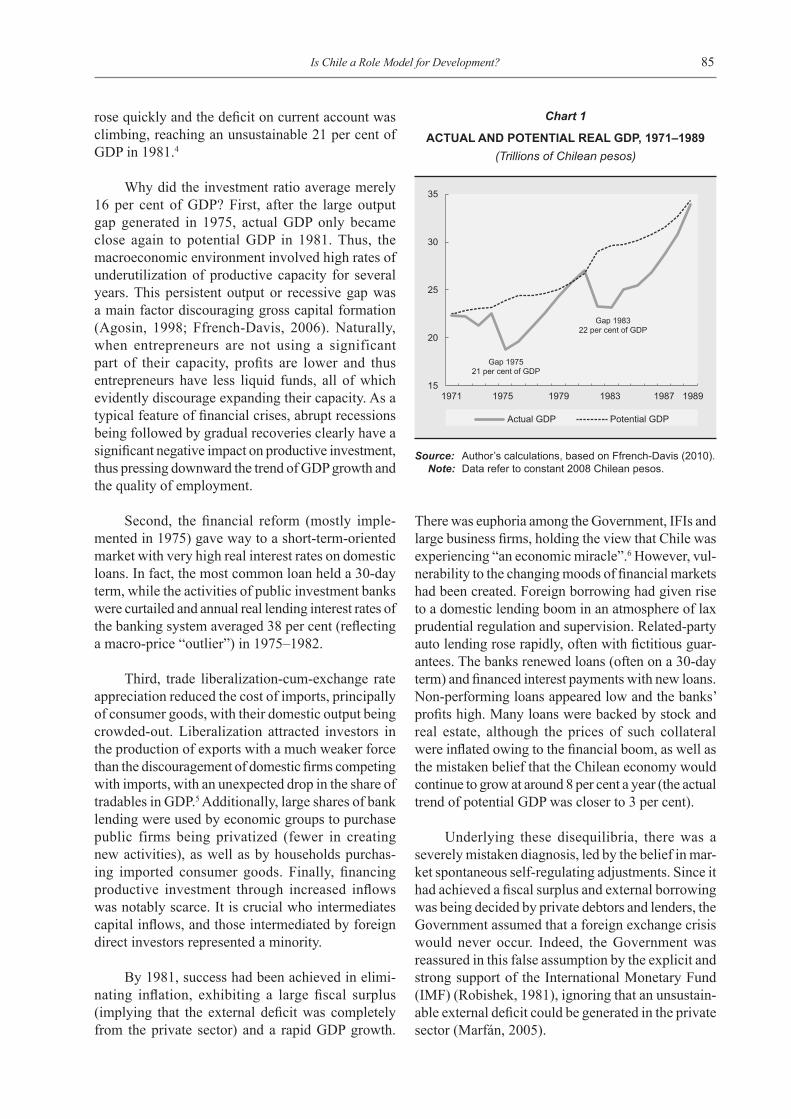
The acute monetary restrictions had a great impact on economic activity: during 1975, industrial output fell by 28 per cent, GDP declined by 17 per cent and total unemployment peaked at 20 per cent of the labour force. Since productive capacity was not destroyed but heavily underutilized – reflecting
a main real macroeconomic disequilibrium – a sig-nificant output gap between actual GDP and potential GDP emerged, whereby about 21 per cent of GDP was underutilized in 1975 (chart 1).
In 1975, the domestic capital market was fully liberalized under weak regulations (the “market knows”), import policy was moving toward free trade and taxes on profits had been drastically reduced, as well as public investment and real wages. Shortly after the fiscal budget shifted to a surplus.
In the meantime, international capital markets had become highly liquid, seeking newer destinations for their supply, including several Latin American nations. By 1977, Chile had started to receive huge capital inflows, mostly bank loans. Indeed, given that the public budget was then in surplus, they reached the private sector. A passive or neutral public policy allowed inflows, which appreciated the exchange rate and increased domestic demand.3 Naturally, the deepening exchange rate appreciation significantly contributed to the drastic decline in inflation by the early 1980s.
However, in parallel, trade liberalization plus exchange rate appreciation encouraged imports, which increased faster than exports, in a trend that continued for five years. Unavoidably, foreign debt of the private sector was accumulating.
In parallel, actual GDP was increasing fast, even though output capacity was rising quite slowly. In fact, the difference was made by the reutilization of the large output gap – as said, of about 21 per cent between actual and potential GDP – generated in the recession of 1975. Investment in new capacity was low, with the gross investment ratio averaging 16 per cent of GDP in 1974–1981, much lower than the 20 per cent recorded in the 1960s. Foreign loans were overwhelmingly used in imports of consumer goods, with limited imports of equipment and machinery. In the process, debt amortization and interest payments
II. Three quite diverse experiences
85Is Chile a Role Model for Development?
rose quickly and the deficit on current account was climbing, reaching an unsustainable 21 per cent of GDP in 1981.4
Why did the investment ratio average merely 16 per cent of GDP? First, after the large output gap generated in 1975, actual GDP only became close again to potential GDP in 1981. Thus, the macroeconomic environment involved high rates of underutilization of productive capacity for several years. This persistent output or recessive gap was a main factor discouraging gross capital formation (Agosin, 1998; Ffrench-Davis, 2006). Naturally, when entrepreneurs are not using a significant part of their capacity, profits are lower and thus entrepreneurs have less liquid funds, all of which evidently discourage expanding their capacity. As a typical feature of financial crises, abrupt recessions being followed by gradual recoveries clearly have a significant negative impact on productive investment, thus pressing downward the trend of GDP growth and the quality of employment.
Second, the financial reform (mostly imple-mented in 1975) gave way to a short-term-oriented market with very high real interest rates on domestic loans. In fact, the most common loan held a 30-day term, while the activities of public investment banks were curtailed and annual real lending interest rates of the banking system averaged 38 per cent (reflecting a macro-price “outlier”) in 1975–1982.
Third, trade liberalization-cum-exchange rate appreciation reduced the cost of imports, principally of consumer goods, with their domestic output being crowded-out. Liberalization attracted investors in the production of exports with a much weaker force than the discouragement of domestic firms competing with imports, with an unexpected drop in the share of tradables in GDP.5 Additionally, large shares of bank lending were used by economic groups to purchase public firms being privatized (fewer in creating new activities), as well as by households purchas-ing imported consumer goods. Finally, financing productive investment through increased inflows was notably scarce. It is crucial who intermediates capital inflows, and those intermediated by foreign direct investors represented a minority.
By 1981, success had been achieved in elimi-nating inflation, exhibiting a large fiscal surplus (implying that the external deficit was completely from the private sector) and a rapid GDP growth.
There was euphoria among the Government, IFIs and large business firms, holding the view that Chile was experiencing “an economic miracle”.6 However, vul-nerability to the changing moods of financial markets had been created. Foreign borrowing had given rise to a domestic lending boom in an atmosphere of lax prudential regulation and supervision. Related-party auto lending rose rapidly, often with fictitious guar-antees. The banks renewed loans (often on a 30-day term) and financed interest payments with new loans. Non-performing loans appeared low and the banks’ profits high. Many loans were backed by stock and real estate, although the prices of such collateral were inflated owing to the financial boom, as well as the mistaken belief that the Chilean economy would continue to grow at around 8 per cent a year (the actual trend of potential GDP was closer to 3 per cent).
Underlying these disequilibria, there was a severely mistaken diagnosis, led by the belief in mar-ket spontaneous self-regulating adjustments. Since it had achieved a fiscal surplus and external borrowing was being decided by private debtors and lenders, the Government assumed that a foreign exchange crisis would never occur. Indeed, the Government was reassured in this false assumption by the explicit and strong support of the International Monetary Fund (IMF) (Robishek, 1981), ignoring that an unsustain-able external deficit could be generated in the private sector (Marfán, 2005).
Chart 1
ACTUAL AND POTENTIAL REAL GDP, 1971–1989(Trillions of Chilean pesos)
Source: Author’s calculations, based on Ffrench-Davis (2010).Note: Data refer to constant 2008 Chilean pesos.
1975 1979 1983 198715
20
25
30
35
1971
Actual GDP Potential GDP
Gap 197521 per cent of GDP
Gap 198322 per cent of GDP
1989

86 Rethinking Development Strategies after the Financial Crisis – Volume II: Country Studies and International Comparisons
By 1981, bank debt per capita almost doubled the Latin America average. The current account deficit had risen to 21 per cent of GDP, with domestic savings having collapsed. Chile required growing net financial inflows quarter after quarter, which becomes increasingly difficult when the debt stock has been rising so much faster than wealth and income. It is evident that the probability of flows reversal sharply rises with an increase in the debt stock, size of amor-tizations and deficit on current account, as well as the consequent need for exchange rate devaluation.
The macro-adjustment started to take place in the first semester of 1982, well before the explosion of the Latin American debt crisis in Mexico, in August of that year. It is highly relevant that inflows remained quite large during 1982 (about 10 per cent of GDP), but much less than net inflows in 1981, to which the economy had become used. Actually, the economic authority was obliged to devalue by June. This intensified the deep recession already at work, with a 14 per cent GDP drop in 1982; open unem-ployment was affecting one in every three workers in 1983, there were countless bankruptcies including most of the private banks and a huge increase in poverty and income inequality was evident. In 1982, the Chilean economy – even with null inflation, fiscal surplus, widespread privatizations and free imports – experienced the deepest and more regressive adjust-ment in all of Latin America.
The combined changes to the production struc-ture, the repression of labour rights and the financial reforms, combined with real macroeconomic insta-bility, caused severe distributive setbacks. The ratio between household per capita incomes of the richest and poorest quintiles increased from 13 in the 1960s to 16 in 1976–81, (and to 20 during the 1980s, Ffrench-Davis, 2014), while the Gini index increased by 4 percentage points (and 5 more points in the 1980s).
In summary, prior to the debt explosion, the neo-liberal experiment had produced a society with increased inequality on many fronts in 1974–1981, a predominance of financierism over productivism (namely at the expense of increases in productivity of labour and capital, as well as productive entre-preneurship), a highly pro-cyclical macro-policy regime, as well as a meagre and regressive average economic growth. The 1982 crisis further worsened this mediocre outcome, which was so unfriendly with development. Only by 1988 was Chile able to recover the GDP per capita of 1981.
B. Counter-cyclical regulation of the capital account: 1990–1995
After the great debt crisis, Latin America regained access to private capital inflows by the early 1990s.7 Chile was one of the first to attract new funds and was among the countries facing the greatest sup-ply of inflows in relation to its economic size.
With the return to democracy in 1990, the Chilean economy faced the challenges of achieving a high and sustained average growth and serving the vast social debt accumulated during the dictatorship. There were significant reforms of the market model, including labour reforms (which restored several labour rights), a tax reform reintroducing taxes on profits eliminated by the dictatorship (which raised public revenues geared to increase social expendi-ture and improve the distributive effects of the tax system) and a substantive counter-cyclical reform in macroeconomic policies.8
In fact, the shadow of the great recession of 1982, including its negative impact on growth and equity, was quite present in the minds of the new authorities. Consequently, the top priorities for implementing macroeconomic policies were achieving sustained equilibrium in financial markets and the real economy, diminishing vulnerability to external shocks and improving employment. The macroeconomic reforms were implemented in the capital account, exchange rate, monetary and regu-lation policies, under the view that the equilibrium of the “real” economy was crucial for growth with equity; in parallel, the Government took care of fiscal responsibility.
Chilean public policy in the first half of the 1990s represented a significant step towards a counter-cyclical approach to macroeconomic man-agement. In brief, policymakers responded to the massive availability of foreign capital by implement-ing counter-cyclical policies to moderate short-term and liquid inflows, while keeping the door open to long-term flows. In a tightly coordinated action by the Ministry of Finance and the autonomous Central Bank, the authorities made use of a wide range of measures to regulate the surge in the offer of finan-cial inflows in 1990–1995. As a crucial element, this included an unremunerated reserve requirement (called encaje) established to raise the cost of bring-ing in short-term capital, which is a market-based instrument that affects relative costs. The rate of

87Is Chile a Role Model for Development?
the encaje, its coverage and the term for which it was retained in the Central Bank were periodically adjusted according to the intensity of the supply of funds from abroad and the evolution of international interest rates (Ffrench-Davis, 2010). Up to 1995, the authorities systematically monitored avoidances that might be appearing in the effectiveness of the encaje.
The authorities also used exchange rate inter-vention to hold down its real appreciation to a level consistent with the external balance, as well as monetary sterilization to keep domestic demand consistent with potential GDP. These and other counter-cyclical policies supported a development strategy that encouraged export growth and its diversification, as well as productive investment and employment.
Three other policies contributed to the success in managing capital inflows. First, there was a respon-sible fiscal policy, whereby permanent increases in social spending were financed with permanent new taxes. Consequently, Chile had a significant non-financial public sector surplus in 1990–1997, averaging 1.8 per cent of GDP which was used to reduce the large external liabilities generated dur-ing the 1980s crisis. The prudential fiscal approach included a stabilization fund for public copper revenues, which contributed to stabilizing public expenditure and preventing excessive exchange rate appreciation. Of course, running a fiscal surplus does not guarantee financial stability; recall that the great 1982 crisis occurred despite Chile having had large fiscal surpluses.
Second, prudential banking regulations had been introduced in 1986 in response to the banking crisis of 1982–1983. The democratic authorities effectively resisted pressures to weaken supervision when lobbying sectors argued that the system was sufficiently mature to self-regulate. This deterred capital inflows to trigger another domestic credit boom.
Third, authorities continually monitored aggre-gate demand and its consistency with productive capacity. Consequently, macroeconomic disequilibria were not allowed to accumulate. Some overheating occurred in 1991 and 1993, although the authorities conducted a downward adjustment in aggregate demand in due time. Chile was able to make active monetary policy with a significant interest rate dif-ferential with the one of the United States when
needed for domestic equilibria, thanks to the policy space provided by the encaje.
The set of policies was highly successful, in the sense that during 1990–1995 – and especially when the contagion of the tequila crisis spread in 1995 – the current account deficit was moderate (2.3 per cent of GDP in 1990–1995), its financing mostly involved long-term inflows, international reserves were increased, the total short-term external liabili-ties were held to a fairly low magnitude,9 aggregate demand was consistent with potential GDP and the real exchange rate was kept at a sustainable level, as shown by the moderate deficit on current account financed by greenfield foreign direct investments. All these are conditions of comprehensive real macroeconomic balances. They would not have been feasible without regulating capital inflows, managed flexibility of the exchange rate (see Williamson, 2003) and pursuing an active monetary policy.10 Strategic features of the policies used were in frontal contrast with the mainstream fashion of full capital account liberalization and fully free or fully pegged exchange rate policy.
When the Mexican exchange rate crisis ex-ploded, the Chilean economy proved immune to contagion; in 1995 it exhibited a vigorous GDP rise. In 1990–1995, average GDP growth peaked at 7.9 per cent, with some improvement in income distribution (see table 1) and a sharp drop in poverty. The producers of GDP – labour and capital, the real economy – benefited from comprehensive real macroeconomic stability.
One main merit of the policies during 1990–1995 is that Chile successfully resisted pressures of the fashion in academia in the United States and IFIs, as well as the temptation to achieve a faster disinflation by absorbing larger capital inflows at the expense of exchange rate appreciation and a larger external deficit. High productive investment was the main factor behind the outstanding sustained GDP growth. As empirical studies robustly show, given its irreversibility, private investment responds posi-tively to real macroeconomic equilibria, whenever they appear to be sustainable (Agosin, 1998). For real sustainability, it must fulfil two key conditions: first, effective demand has to be consistent with the productive capacity being generated; and, second, key macro-prices (particularly the exchange rate) must be consistent with a sustainable external bal-ance (Ffrench-Davis, 2006). In the six-year period

88 Rethinking Development Strategies after the Financial Crisis – Volume II: Country Studies and International Comparisons
from 1990 to 1995, actual and potential GDP rose at similar rates, with the economy working close to the production frontier; namely, with a minor output gap and a sustainable external balance. Indeed, these are crucial ingredients of real macroeconomic balances.
However, macroeconomic policies lost their strength after 1995. Paradoxically, the autonomous Central Bank gradually moved towards the neo-liberal fashion of capital account and exchange rate liberalization. In fact, in 1996–1998, Chile did partially bend towards the powerful international fashion of promoting capital account liberalization, allowing a real appreciation of the peso and imbal-ances such as in the external accounts and a domestic aggregate demand growingly intensive in imported components. This fashion was generally in command in emerging economies, pressed by the United States Government, the IMF and World Bank, the OECD and generally in the Anglo-Saxon academic world. It had been reinforced under the belief that the management of the tequila crisis had shown that the world had learnt to control financial crisis; indeed, such over-optimism was also absorbed domestically by business leaders and some public authorities. The weakening of the counter-cyclical approach took the form of principally allowing leakages to the encaje and stepping-back in the managed flexibility of the exchange rate.
Therefore, when the Asian crisis contagion reached Chile in 1998, the economy had accumu-lated rather significant imbalances, whereby the real exchange rate appreciated by 16 per cent between 1995 and 1997 and the current account deficit jumped to 4.8 per cent of GDP in 1996–1997, versus 2.3 per cent in 1990–1995, which further worsened with a sharp negative terms of trade shock in 1998. Fiscal responsibility had been kept, with an actual surplus averaging 2.1 per cent of GDP, while a larger private deficit was financed by the rise in their external liabilities, encouraged by a weaker regulation of the capital account and exchange rate appreciation.
In 1996–1997, Chile continued to record vigorous growth, with both output and investment remaining at high levels. A determinant factor behind the record investment ratio was the high employment of productive capacity as shown. However, as previ-ously mentioned, macroeconomic conditions were becoming vulnerable to changes in the international environment, with the appreciation of the exchange rate and rise of external deficit. As said, Chile did step
back in 1996–1998, albeit only to a mid-of-the-road position. While it did not dismantle regulations, it allowed a gradual weakening of their effects (Le Fort and Lehmann, 2003; Ffrench Davis, 2010, ch. VIII); accordingly, disequilibria were moderate after six years of counter-cyclicality and only a couple of years of soft pro-cyclicality.
Therefore, Chile had advanced towards devel-opment with the significant macroeconomic reform in 1990–1995, with some steps back in 1996–1997, while it only had made minor progress with respect to productive development policies. Later, it gave up liberalizing the exchange rate in 1999 and the capital account in 2001. Table 3 compares the average performance of GDP and wages in 1990–1998 and 1999–2013, showing a large contrast. The capital formation ratio is rather similar and suggests a sharp drop in total factor productivity, partly associated with real macroeconomic instability.
C. Contagion, counter-cyclical response and recovery in 2008–2013
When the contagion of the global crisis arrived in 2008, economic activity in Chile suffered a sharp recessive adjustment between late 2008 and 2009, led by a contraction of capital inflows, trade volume and copper price. In contrast with a mostly neutral
Table 3
GDP, EXPORTS, INVESTMENT AND WAGES, 1990–2013
(Per cent)
1990–1998 1999–2013
GDP 7.1 3.9
GDP exported 9.9 4.3
Rest of GDP 6.5 3.8
Net capital formation (per cent of GDP) 13.1 12.6
Index of real average wages 3.9 2.1
Real minimum wage 5.3 3.5
Source: Author’s calculations, based on Ffrench-Davis (2014, table I.7).
Note: Data refer to annual average rates of growth unless otherwise specified. Data for 2013 are provisional. Data for net capital formation in 2010 were not adjusted for an estimated drop of 3 per cent in the stock of capital due to the destruction generated by the earthquake of 27 February; which would cut the average 1999–2013 ratio by 0.5 points.

89Is Chile a Role Model for Development?
approach since the late 1990s, the Government adopted a resolute counter-cyclical approach, making use of the sovereign fund that had been accumulated during the boom in copper prices in accordance with the structural fiscal balance approach adopted in 2001.
Expenditure was increased by 17 per cent and some tax rates were reduced transitorily (on fuels, loans, SMEs), despite fiscal income having fallen 10 per cent in 2008 and 20 per cent in 2009.11 This implied a transitory actual deficit of 4.4 per cent of GDP in 2009. The Central Bank sharply reduced the monetary policy interest rate, albeit in a delayed deci-sion. The strong counter-cyclical fiscal policy was the main force compensating for the negative external shocks. The domestic economy (GDP non-exported) already exhibited a significant recovery push by the last quarter of 2009, outlining the effectiveness of the counter-cyclical fiscal policy.
The counter-cyclical behaviour of the Treasury had to coexist with huge outflows of funds from residents, principally the private social security firms, which transferred abroad the equivalent of 10 per cent of GDP in 2009.12 The liberalization of residents’ capital flows hampered macroeconomic management for their pro-cyclicality joined that of the financial flows of non-residents. The liberaliza-tion of the capital account continued to be costly for development.
By the last quarter of 2009, the economic recov-ery was well advanced, although it was momentarily stopped by a severe earthquake on 27 February 2010, only a few days before the end of President Bachelet’s Government and the beginning of that of President Piñera. In a few weeks, the recovery recommenced. The high level of domestic demand, a consequence of the counter-cyclical policy of 2009, was further increased by reconstruction costs following the earthquake of February 2010. Given that installed capacity was significantly underutilized – despite the destruction caused by the earthquake and the subse-quent tsunami13 – the accelerated public expenditure was consistent with a move toward macroeconomic equilibrium (using capacity) as long as a recessionary gap prevailed.
Indeed, in 2010, reconstruction spending strongly contributed to the reactivation of domestic demand and thus to that of GDP, without inflationary pressures. Of course, the recessive gap was being reduced during the adjustment period, increasing
employment and stimulating capital formation, although there were no structural progress in the gen-eration of GDP, manufacturing remained depressed and export diversification stagnated. It was rather the recovery effect. With recovery, employment and income distribution improved, albeit returning to the social achievements already attained by the mid-1990s.
Actual GDP was increasing strong until 2012, with an average 5.7 per cent annual rate over the three-year period. To avoid the recurrent mistake of confusing sustainable growth with recovery of economic activity, it is necessary to measure per-formance from peak to peak. If growth is measured from the previous peak of 2007, actual GDP growth averaged 3.9 per cent, which is consistent with the fact that actual GDP only rose 4.1 per cent in 2013. The economy had reached full capacity and the 4.1 per cent reflected the fact that potential GDP growth was closer to that figure than to 5.7 per cent.14
It is similar to the 3.9 per cent growth of the previous nine year period (1999–2007), but much lower than the 7.1 per cent recorded in 1990–1998. Moreover, average real wages and minimum wages had risen much slower during the 15 years that followed since 1999 (see table 3).
Slow economic growth and social indicators returning to achievements conquered almost two decades ago do not provide a “model” of develop-ment. However, there is more. The transition from the recessionary gap to close to full employment and use of potential GDP undoubtedly reflects one essential macroeconomic balance. Nonetheless, macroeco-nomic equilibria cover other important dimensions than inflation under control, including external and comprehensive fiscal balances. Therefore, to achieve sustainability, fiscal and external accounts must also converge to a sustainable balance when the recessive gap disappears.
Very early in the transition of actual GDP toward potential GDP, there was a significant exchange rate appreciation and new permanent public expenditures without the corresponding permanent fiscal income. As a result, when the recessionary gap disappeared in 2012 and early 2013, two macroeconomic disequilib-ria had emerged: (i) a strongly overvalued exchange rate; and (ii) a public budget supported by transitory high copper prices. For several years, imports and fiscal expenditure were growing much faster than the quantum of exports and tax proceeds.

90 Rethinking Development Strategies after the Financial Crisis – Volume II: Country Studies and International Comparisons
During 2009, the external sector regained a surplus due to jumps in the copper price. Meanwhile, after having experienced a strong revaluation up to $435 pesos to the dollar in March 2008, the exchange rate underwent a sharp devaluation, reaching $650 by late 2008. Then, it responded to the subsequent dominant expectation that Chile was emerging from the crisis. Consequently, there was a new trend toward appreciation, with the exchange rate having appreciated to $460 by mid-2011.
These intense fluctuations are in sharp contrast with the view that the exchange rate is a determinant variable for the allocation of resources for export-ers and those competing with imports. Evidently, derivatives markets do not solve the obstacle that instability brings for decision-makers of irreversible investment; rather, this instability is quite detrimental to development.
Table 4 shows that imports grew notably faster than GDP and exports for a full decade, with the gap financed by a high price of copper. Notwithstanding that high price – probably a transitory high one – the current account was exhibiting a 3.4 per cent of GDP deficit in 2012–2013. Additionally, a previous trend towards some export diversification had been stagnat-ing (a sort of Dutch disease was at work).
The fiscal disequilibria are also depicted in table 4. In this six-year period, GDP increased by 26 per cent, while fiscal expenditure rose by 52 per
cent, without any significant tax reform. The dif-ference was covered by fiscal income from copper exports.15 In fact, there is a dangerous dependence of public expenditure and private imports on a high copper price.16 Several permanent increases in public expenditure – such as continued implementation of the social security reform of 2008, increase in post-natal benefits and elimination of a 7 per cent tax on some pensions – have been financed to a minor degree by a tax adjustment that raised the rate on profits but reduced the progressive income tax. Financing has mostly come from the transitory tax proceeds generated by copper. In 2012, the Treasury spent the equivalent of fiscal revenue from copper correspond-ing to a $3.30 price per pound, compared with less than (a current) $1.00 in 2004–2007.
Obviously, permanent expenditure already at work and other required to finance new public goods and inclusive productive development demand a substantive tax reform that collects in a progressive way.
In brief, the inflation rate had been notably moderate. In contrast, there have not been sustain-able balances between (quantum) export supply and import demand, nor between permanent public expenditures and structural tax income, as well as between the evolution of aggregate demand and potential GDP. The real economy has responded with a modest 3.9 per cent average GDP growth, lower than the 7.1 per cent recorded in 1990–1998.
Table 4
SELECTED MACROECONOMIC INDICATORS, 2007–2013(Indexnumbers,2007=100)
2007 2012 2013Annual average growth
(Per cent)
GDP 100.0 121.0 125.9 3.9Exports 100.0 103.0 107.9 1.3Imports 100.0 140.9 145.6 6.5Real fiscal expenditure 100.0 146.5 152.4 7.3Real fiscal non-copper income 100.0 132.0 136.1 5.3Domestic demand 100.0 135.6 140.2 5.8
Source: Author’s calculations, based on Ffrench-Davis (2014, table X.5).
91Is Chile a Role Model for Development?
One distinctive feature of neo-liberalism is its neglect of the implications of initial inequality and sectoral imbalances; of the heterogeneity in produc-tive structures, among diverse economic agents, and in access to voice and power of different sectors; of the social and allocative implications of market segmentations; and of the difficulty of transparently transmitting information to diverse economic agents so that they can face comparable opportunities.
Ultimately, neo-liberalism underestimates the frequent presence of destabilizing adjustment processes, lags and overshooting, as well as the incompleteness of markets and institutions in developing nations. These elements represent severe obstacles that prevent “neutral” and indirect global economic policies from being effective.
Excepting the first years of return to democracy in 1990, an output gap prevailed for most of the time. The Chilean economy has been out of real macroeconomic equilibria, with significant output gaps, with only in 1991–1997, 2007 and 2012–2013 operating close to potential GDP. Furthermore, a quite unstable and outlier exchange rate has worsened trade performance.
The specific policies and approaches used in each of the three episodes varied, evolving from the extreme naiveté of the 1970s into the pragmatic approach of the early 1990s. The end of the century saw a move away from macroeconomic sustainabil-ity as authorities gave in to the temptation to move toward financial globalization without properly tak-ing account of the underlying risks.
For both growth and equity, it is necessary to reach sustainable real macroeconomic balances. Beyond low inflation and fiscal responsibility, an exchange rate management functional for pro-ductive development and an active management of aggregate demand in levels consistent with productive capacity are also required. The recent performance has been deficient on this matter. In returning to macroeconomic policies for develop-ment, the regulation of speculative capital flows deserves top billing among the list of actions for inclusive development.
Nonetheless, real macroeconomics is not enough. The 1990s experience was notably success-ful in growth with stability, although productive structures improved too mildly, as well as income distribution. It implied progress toward develop-ment, albeit in an incomplete manner. For long-term sustainability, the economic agenda requires further deep reforms to “complete” long-term innovative financing for development (with pro-SMEs and pro-employment biases), labour training and tech-nological innovation, among others.
The strong expressions of domestic discon-tent present in recent years can be interpreted as a reinforced message of the urgent need to design and implement coherent strategies and make major inclusive reforms to productive structures and public social and economic policies. The great challenge is to move towards comprehensive development with an increasingly inclusive and more equitable productive system.
III. Closing remarks
Notes
1 Details are analysed in Ffrench-Davis (2010, chap-ter VIII) and Lefort and Lehmann (2003).
2 The measurement of economic growth should be made between comparable macroeconomic situa-tions. We compare years with a high level of capacity use, namely those with actual GDP close to potential GDP. Significant recoveries of economic activity such as in 2004–2008 and 2010–2012 came after recessions that cannot be ignored. On the contrary, the vigorous growth from 1990–1998 followed an overheating economy in 1989.
3 In 1979, Chile moved to the then known as “monetary approach to the balance of payments”, which involved fixing the nominal exchange rate and determining that
the money supply would only be increased (reduced) in response to purchases (sales) of dollars by the Central Bank. It is similar to the “currency board” adopted by Argentina in 1991 and that collapsed in the midst of a dramatic crisis in 2001–2002.
4 Pro-cyclical monetary and exchange rate domestic policies were aggravated by a huge jump in interest rates in the United States in late 1979 and the dollar appreciation in 1981, which additionally raised the cost of the outstanding foreign debt.
5 Based on the national accounts, the share of “trad-ables” was estimated to have fallen about 5 percent-age points of GDP, instead of increasing as expected with trade liberalization.

92 Rethinking Development Strategies after the Financial Crisis – Volume II: Country Studies and International Comparisons
6 In his interesting evaluation of the experiment, Foxley (1983) presents several revealing citations, including one from an editorial of the Wall Street Journal: “USA should borrow the economic team of Chile” (18 January 1980), referring to the incoming Reagan presidency.
7 See, for instance, the classical paper by Calvo, Leiderman and Reinhart (1993).
8 The reforms approved by the Parliament (including the tax reform) were always less comprehensive than those originally proposed by the Government. A determining factor was the group of senators appointed under the Constitution designed by the dictator Pinochet in 1980, which more than com-pensated for the majority achieved by candidates of the new democratic Government in 1989 and 1993 parliamentarian elections.
9 In Ffrench-Davis (2010 and 2014), I conduct a detailed analysis of empirical literature critical and supportive of the working of the encaje.
10 Good luck also played a role, with a sharp improve-ment in the terms of trade in 1995, although it still remained 20 per cent below the average in the last biennium of the dictatorship.
11 Ffrench-Davis (2014, ch. IX, table IX.2). This chapter discusses policies between the contagion of the Asian crisis and the start of the global crisis.
12 Ffrench-Davis (2014, ch. X, table X.1). This chap-ter details the policy answer to the contagion in 2008–2009, recovery in 2010–2012, and building of dependency on a very high price of copper.
13 The Central Bank estimated that potential GDP had been reduced by 1.0 to 1.5 per cent by the earthquake and tsunami.
14 To be accurate, adjustment must be made for the destruction by the earthquake of February 2010 of capacity by adding 1–1.5 percentage points for the loss of potential GDP, thus arriving at an annual average for growth of close to 4.1 per cent in the six-year period 2008-2013. An additional adjustment could be made if it is assumed that the contribution of export volume to GDP growth would increase if world trade was normalized.
15 Real tax income from copper depends on both its real price and the costs of production, which have been increasing fast in real terms. Note that as the Chilean tax system is highly dependent on the VAT, tax rev-enue grows faster than GDP as the external deficit increases as happened in 2010–2013. See table 4.
16 Based on the significant revenue from copper mining, the opponents of tax reform have claimed that there are “sufficient fiscal resources.” They do so without examining the need to revise downwards sustainable revenue, with a “reasonable” trend estimate of cop-per prices.
References
Agosin MR (1998). Capital inflows and investment per-formance: Chile in the 1990s. In: Ffrench-Davis R and Reisen H, eds., Capital Flows and Investment Performance: Lessons from Latin America, Paris, OECD Development Centre/ECLAC.
Banco Central, Informe de Política Monetaria, IPOM, several issues.
Calvo G, Leiderman E and Reinhart C (1993). Capital inflows and real exchange rate appreciation in Latin America: The role of external factors. IMF Staff Papers, 40(1).
Edwards S and Cox-Edwards A (1991). Monetarism and Liberalization: The Chilean Experiment, Cambridge, Ballinger.
Ffrench-Davis R (2014). Chile entre el neoliberalismo y el crecimiento con equidad: 40 años de políticas económicas y sus lecciones (Quinta edición), San-tiago, JC Sáez Editor.
Ffrench-Davis R (2010). Economic Reforms in Chile: From Dictatorship to Democracy (Second Edition), London and New York, Palgrave Macmillan.
Ffrench-Davis R (2006). Reforms for Latin America´s Economies: After Market Fundamentalism, London and New York, Palgrave Macmillan.
Ffrench-Davis R and Tapia H (2001). Three varieties of capital surge management in Chile. In: Ffrench-Davis R, ed. Financial Crises in Successful Emerging Economies, Washington, DC, Brookings Institution.
Foxley A (1983). Latin American Experiments in Neo-conservative Economics, Berkeley, University of California Press.
Larraín F and Vergara R (2000). La transformación económica de Chile, Santiago, Centro de Estudios Públicos.
Le Fort G and Lehmann S (2003). El encaje y la entrada neta de capitales: Chile en el decenio de 1990. CEPAL Review, 81.
Marfán M (2005). La eficacia de la política fiscal y los déficit privados: un enfoque Macroeconómico. In: Ocampo JA, ed. Más allá de las reformas: dinámica estructural y vulnerabilidad macroeconómica, Bogotá, CEPAL/Alfaomega.
Robichek W (1981). Some reflections about external public debt management. Alternativas de políticas financieras en economías pequeñas y abiertas al exterior, Estudios Monetarios VII, Santiago, Banco Central de Chile.
Rodríguez J, Escobar L and Jorrat M (2009). Los ingresos tributarios en el contexto de la política de Balance Estructural. Estudios de Finanzas Públicas, San-tiago, Ministerio de Hacienda.
Tapia H (2003). Balance estructural del gobierno central de Chile: Análisis y propuestas. Serie Macroeconomía del Desarrollo, Nº25, CEPAL.
Williamson J (2003). Overview: An Agenda for Restarting Growth and Reform. In: Kuczynski PP and Wil-liamson J, eds. After the Washington Consensus: Restarting Growth and Reform in Latin America, Washington, DC, Institute for International Eco-nomics.