is dust “busting” crop yields? r · proceedings of the national academy approach is to use...
TRANSCRIPT

ndash
R
Figure 1 US and Asian Rice Yields 10 200
ee
erd
()
tt
hl
ii
e Y
h R
ac
csn
oo
gu
R ice is the staple food grain for over two billion people in Asia alone who derive 60-70 pershy
cent of their caloric intake from the grain and its derivatives It is also the most rapidly growing source of food in Africa According to the United Nations Food and Agriculture Organishyzation rice production and processing employs over one billion people in the developing world alone They identify declining yield growth rates natural resource depletion labor shortages gender issues institutional limitations and environmental pollution as the main threats to global rice production
As Figure 1 shows yields in China India and Indonesia grew rapidly dur-
V 10 no 1 bull SeptOct 200
Is Dust ldquoBustingrdquo Crop Yields Maximilian Auffhammer
due to the mismanagement of water and chemical inputs stagnant technol-We have long known that air pollution
has a negative effect on plant growth Dust deposits on leaves and higher ozone concentrations in fields result in smaller plants for many crops Recent research on local climate change has shown that a class of air pollutants called ldquoaerosolsrdquo may have a local drying and cooling effect While cooler nights are good for many plants these gains are possibly offset by decreased rainfall and solar radiation
ogy on rain-fed farms and reaching the technological frontier on irrigated farms Ongoing work by UC researchshyers and their collaborators is examining the role of another possible culprit air pollution
The Asian Haze Regional impacts of global warming hinge on the potentially sizeable cooling effect of a pollutant known as aerosols These small particles which measure about a millionth of a centimeter in diameter reflect sunlight back into space and cause a local cooling effect at ground level
ing the 1960s and 1970s Most of this growth was due to the Green Revolution which introduced hy-
Also in this issue
ARE Faculty Profile Aaron D Smith
Retailer Pricing Practices for Fresh Avocados Lan Li Hoy F Carman and Richard J Sexton
OECD Support for Agriculture Has it Historically Harmed Poor Countries Alix Peterson Zwane and Margaret McMillan
China India Indonesia USA
10 1 170 17 180 18 10 1 2000 200
8
7 brid varieties irrigation fertilizers and pesticides to the developing counshytry rice-production system During the 1980s and continuing
until present day howshyever yield growth
started to slow down and has recently leveled 2
off Explanations for the deceleration include 1
sharply lower rice prices deterioration of 0
irrigation infrastruc-Source IRRI World Rice Statistics (2006)
ture soil degradation
Biomass burning and fossil fuel combustion are major sources of the haze Photo Credit NASA
the impacts of global climate change on Asian agriculshyture have taken into account the impact of warming on the hydrological cycle water budget and fershytilization from additional CO2 The predicted decrease in yields from warming due
to global climate change averaged over the Asian region range from 15shy30 percent by the year 2050 These studies have however not taken into account the potential direct and indishyrect impacts from the haze
Impacts on Local Climate The negative impacts of local air polshylutants on human health have been extensively studied and have motishyvated regulation on a local regional national and global level The most widely discussed of these pollutshyants ozone also has direct negative impacts on plant growth Laboratory experiments using open-top chamshybers have shown that 50 parts per billion (ppb) concentrations of ozone decrease yields of winter wheat by 10 percent and rice by eight percent A doubling of this concentration which is 20 ppb below the hourly federal standard set by US Clean Air Act leads to decreases of yields by 59 percent and 26 percent respectively Other pollutants which make up the haze such as soot dust and fly ash can settle on plant leaves and shield pollutants from solar radiation These deposits interfere with the plantrsquos ability to conduct photosynthesis and may cause localized warming on the plant Further through the acidity of
This class of pollutant is made up of various components including sulfates soot organic carbon and mineral dust A large number of global warming models show that this cooling is one of the largest if not the largest source of uncertainty in predicting future climate at a regional scale Field experiments such as the Indian Ocean Experiment (INDOEX) have been undertaken to collect geographically specific data on the regional cooling effect of sulfates and other aerosols
The INDOEX experiment led to the Atmospheric Brown Cloud (ABC) Project chaired by UC San Diego Proshyfessor V Ramanathan which is a mulshytidisciplinary effort to study the aeroshysol layer known as the Indo-Asian haze its impacts on local climate and its socioeconomic consequences The Indo-Asian haze covers most of South Asia and a substantial portion of the Indian Ocean from roughly November to May Biomass burning and fossil fuel combustion are major sources of the haze The region is home to much of the worldrsquos population and is expeshyriencing rapid industrial and demoshygraphic growth It is vulnerable to unexpected negative impacts from the haze on health the hydrological cycle and agriculture Existing studies on
the haze it causes or augments negashytive consequences from acid rain on soil chemistry and plant tissues
These direct effects of air pollution ignore the recently discovered interacshytion between the haze and local climate In addition to the direct efshyfects mentioned above the haze can in theory affect agricultural production indirectly through three main pathshyways The first is the reduction of sunlight available to crops Aerosols increase the reflection of solar radiashytion back to space and in addition increase absorption of solar radiation in the atmosphere The absorption and scattering of solar radiation lead to a large reduction of direct sunlight availshyable to plants The reduction of solar radiation due to the haze at the surface is estimated to be approximately 10 percent The second indirect effect is the suppression of rainfall by haze The presence of aerosols results in more clouds which contain smaller droplets and are less likely to release rain The cloud drops in turn further scatter solar radiation and cause addishytional dimming The estimated rainfall reductions due to ABCs during monshysoon season range from five to eight percent annually relative to the 1930shy1960 average The climate models further forecast an increased frequency of droughts The final indirect effect of the haze is a local surface cooling which is strongest during the months between October and May
Estimating Impacts on Agriculture There are numerous studies which attempt to estimate the impacts of changes in solar radiation temperature and rainfall on crop yields Researchers either use data from experimental plots where crops are grown under optimal conditions and then artificially apply some stress to the plantsmdashsuch as less solar radiation or watermdashto estimate impacts on yields An alternate
Giannini Foundation of Agricultural Economics bull University of California 2
approach is to use computerized crop simulation models to estimate the impact of these stresses on yields and plant growth For both methods one attempts to apply all necessary inputs optimally and then increases or decreases the stress factor While these models ignore the farmerrsquos reaction to changes in environmental variables by switching crops or planting different varieties they provide a first-order estimate of the impacts from environmental stresses
A recent study published in the Proceedings of the National Academy of Sciences estimates the impact on rice yields from changes in nighttime temperatures and solar radiation Usshying weather and yield data from an experimental farm in Los Banos (Philshyippines) over the period 1979 to 2003 the authors show that a 10C increase in minimum temperature would result in a 10 percent decrease in grain yields during the growing season Crop simshyulation studies have estimated a similar impact Since aerosols cause a local cooling this may seem like good news for irrigated agriculture Unforshytunately this may not be so The same study shows a strong positive relationshyship between grain yield and solar radiation during low-radiation months which is the case during monshysoon season Although the mechanisms are not yet well undershystood a lower amount of solar radiation received by the plant during the grain-filling stage is one possible mechanism through which the haze may affect crop yields
The immediate impact on irrigated rice yields through reductions in rainshyfall are likely small in the short run since farmers can substitute by pumpshying more groundwater For non-irrigated rice farming the reducshytions in rainfall are likely to have larger consequences since farmers do not have this ability to substitute This
is a major concern for small subsistence farms
The California Enshyergy Commission has sponsored an ongoing research project which attempts to quantify the impacts of anthroshypogenic aerosols on California climate Preshyliminary results suggest a reduction in precipitation in the Sierra-Nevada Mounshytains and the Central Valley in February and August Furshyther simulations suggest decreased ground temperatures and solar radiashytion in both months The high concentrations of aerosols in many of the rural agricultural areas in the United States certainly warrant further examination of this phenomenon on crop yields in the US which is a question currently under study at UC Berkeleyrsquos ARE department
Los Angeles Haze Photo Credit Ramanathan 200
For additional information the author suggests the
following sources
California Energy Commission Effects of Anthropogenic Aeroshysol Particles and Their Precursor Gases on California and South Coast Climate wwwenergycagovpierfinal_ project_reportsCEC-500-2005ndash003 html
Peng Shaobing et al 2004 Rice yields decline with higher night temperature from global warmshying Proc Natl Acad Sci USA 101(27) pp 9971ndash9975
United Nations Environment Programme The Atmospheric Brown Cloud Climate and other Environmental Impacts wwwrrcapuneporgissuesair impactstudyindexcfm
V Ramanathan et al 2005 Atmoshyspheric brown clouds Impacts on South Asian climate and hydrological cycle Proc Natl Acad Sci USA 102(15) pp 5326ndash5333
Maximilian Auffhammer is an assistant professor in the International Area Studies Program and the Department of Agricultural and Resource Economics at UC Berkeley His interests include climate change and air pollution in the developing country context Maximilian can be contacted by telephone at (510) 643-5472 or by e-mail at auffhammer berkeleyedu
Giannini Foundation of Agricultural Economics bull University of California
ARE Faculty Profile Aaron Smith
Aaron D Smith Assistant Professor
Agricultural and Resource Economics UC Davis
S ince 2001 Aaron Smith has held a position as an assistant professor in the Department
of Agricultural and Resource Economics at UC Davis Prior to coming to Davis Aaron earned a PhD in Economics from UC San Diego and taught at the University of Virginia and UC Santa Barbara He grew up in New Zealand where his family operates a sheep farm
Professor Smithrsquos research adshydresses price behavior in commodity markets including cotton corn natushyral gas crude oil and electricity In addition he works on developing new statistical methods for predicting and understanding the dynamic behavior of commodity prices and other ecoshynomic variables
In one line of research Aaron studshyies the nature of price fluctuations in commodity futures markets Futures contracts enable the purchase or sale of a commodity at a fixed price at a fixed location in a particular month in the future In research on the corn and
cotton markets Aaron shows that futures prices become excessively volashytile as the delivery date approaches This phenomenon arises because only a limited amount of the commodity is available for trade near the delivery location and it is very expensive to transport the commodity from out of state at short notice Therefore when using futures markets to reduce price risk agricultural producers should avoid futures contracts that are close to the delivery date With Hiroaki Suenaga a UC Davis PhD graduate and Jeffrey Williams of UC Davis Proshyfessor Smith is conducting similar studies of futures markets for natural gas crude oil and gasoline
With Colin Carter of UC Davis Aaron studied the market impact of a prominent food scare In 2000 a geshynetically modified corn variety called StarLink that was not approved for human consumption was discovered in the food-corn supply Smith and Carter showed that this contamination event led to a 68 percent discount in corn prices and that the suppression of prices lasted for at least a year The StarLink case continues to surface around the world as an example of policy error in managing biotechnolshyogy adoption
In collaboration with a UC Davis PhD graduate Konstantinos Metaxoglou Smith showed that the California electricity reserves market operated inefficiently before during and after the 2001 electricity crisis The reserves market ensures the availability of extra generating capacity in case of unexpected spikes in electricity demand and it operates separately from the market for electricity itself In the reserves
market generators offer to keep their spare capacity on standby in case it is needed They offer this standby capacity in two separate hourly auctions one a day ahead and the other an hour ahead of the delivery hour Aaron and Konstantinos showed that utilities were forced to procure most of their standby capacity in the day-ahead market rather than the hour-ahead market even though the day-ahead prices averaged 35 percent higher This outcome raised the costs to utilities and ultimately consumers by hundreds of millions of dollars between 1999 and 2002
Aaron lives in Walnut Creek with his wife Heather Rose who works as a research economist at the Public Polshyicy Institute of California in San Francisco When Smith is not tackling economic data he spends his time tackling large human beings on the rugby field As a New Zealander he has played rugby since he was young and sees it as a natural part of life For the last five seasons he has played in the USA Rugby Super League for the San Francisco Golden Gate club Howshyever the fifth season may have been his lastmdashhe claims hersquos now too old to keep up
Aaron Smith can be contacted by telephone at (530) 752-2138 or by e-mail at asmithprimal ucdavisedu
Giannini Foundation of Agricultural Economics bull University of California
Retailer Pricing Practices for Fresh Avocados Lan Li Hoy F Carman and Richard J Sexton
Retailersrsquo pricing practices for Hass avocados depart considerably from the behavior predicted by a model of competitive pricing Retail prices within a market area exhibit considerable heterogeneity and little correlation with the farm price Further only about a third of farm price changes are transmitted to consumers Retail prices for avocados tend to be lower during peak-demand periods Finally evidence suggests that outdoor and radio promotions by the California Avocado Commission have been effective in raising demand for avocados in the cities where the campaigns have been conducted
Monthly demand for avocados varies seasonally Demand is high during the summer months May through September with June having the highest monthly demand
Photo Credit UC Regents
Retailers are becoming the dominant player in the food disshytribution networks of the United
States and other countries as a result of continuing growth and consolidation While market power in the retail food sector is a fact of life detailed inforshymation on the use of this power is not Understanding pricing behavior is an important factor in assessing retailer market power In addition retailersrsquo pricing practices for fresh produce are a critically important determinant of producersrsquo and handlersrsquo incomes This article presents results on retailersrsquo prishycing practices for fresh avocados in the United States
The characteristics of fresh avocashydos and many other produce items are important in pricing decisions and in the results of these decisions Producshytion is seasonal as is demand avocados are perishable and can only be stored for short periods weather can cause supply shocks industry proshymotion is concentrated in particular markets and at particular times and imports have been increasing signifishycantly over time A few large retailers are buying from many smaller hanshydlersgrowers and in markets that are separated in time and space considershyations that suggest the opportunity for retailers to exercise market power in procurement of avocados We focus on how retailers adjust avocado prices in response to changes in demand and cost factors especially producer-sponshysored promotion programs and seasonal demand cycles and how these adjustments impact retail marshygins We were particularly interested in the reactions of retailers to industry promotions
The Data and Analysis
The California Avocado Commission (CAC) provided access to a unique micro-level dataset that included weekly retailer-scanner data for 82 major US retail accounts across 38 markets for avocados from November 1998 to October 2004 The CAC also provided weekly shipment data including shipping-point prices and shipment volumes of Hass avocados from California to each of the 38 destination markets during the study period These data were supplemented with monthly import data from the United States International Trade Commission Finally we obtained information on the media types geographic locations and the timing of the CACrsquos advertising programs during the study period
The full data set pools retail acshycounts large and small avocados and all time periods generating 19072 obshyservations in total There are 124 acshycount-size combinations with 140 to 157 weeks for each account-size comshybination The sample averages for the retail price of Hass avocados and the shipping pointmdashretail-price spread were $130 and $073 per unit respecshytively A retail-pricing model was estishymated to examine how retail prices vary in response to changes in cost and demand variables such as conshytemporaneous and lagged shipping-point prices Retail prices had a statistically significant positive correshylation with the contemporaneous shipshyping-point price and its one period lag The coefficients however indishycate that only about 34 percent of a change in shipping-point price per unit is transmitted to the retail price
Giannini Foundation of Agricultural Economics bull University of California
Table 1 Descriptive Statistics of Retail Prices and Shipping-Point Prices for Hass Avocados for Los Angeles Retails Chains
mdashPrice Rangesmdash mdashPrice Rangesmdash
Std 25-75 Min- Std 25-75 Min-Mean Dev pct Max Mean Dev pct Max
Panel (a) Retail Prices
Account Large Size Small Size
Los Angeles 1 170 048 058 248 114 034 044 202
Los Angeles 2 133 033 028 164 050 016 019 088
Los Angeles 3 187 022 018 130 068 022 042 118
Los Angeles 4 133 027 043 125 ndash ndash ndash ndash
Los Angeles 5 166 036 061 151 116 028 050 112
Panel (b) Shipping-Point Prices
Market Large Size Small Size
Los Angeles 072 015 016
within the two-week period The parshytial response of retail prices to cost changes at the shipper level is a key inshydicator of retailer market power being exercised in the pricing decision
The estimated coefficient of shipshyment volumes in the model of shipper-retail price spreads indicates that the retail markup increased significantly by $004 per unit when weekly shipshyments to a market increased by one million units This result is consistent with prior work conducted at UC Davis that found retailers paid lower
072 037 008 012 050
prices to grower-shippers when there was a larger supply of a perishable commodity while maintaining retail prices and enjoying a larger profit margin Competitive or ldquoprice-takingrdquo retailers would be unable to capture larger margins in these settings so this result is also consistent with retailers exercising market power over grower-shippers in procurement of avocados
The data also reveal considerable heterogeneity among retailers in their pricing decisions for Hass avocados Tables 1 and 2 illustrate this point for
retail chains in the Los Angeles area Table 1 provides mean prices standard deviation of prices range in price for the 25th and 75th percentile observashytions and range between minimum and maximum price for both large and small Hass avocados for five Los Angeshyles chains Acquisition and transportation costs for these chains should be very similar yet we see that average prices vary considerably among the chains especially for small avocados as does the variability of prices as measured by the standard deviation and the price ranges Note that the variability of retail prices is much higher than variability of the shipping-point prices for the Los Anshygeles market
Table 2 presents correlations beshytween the retail prices for Hass avocados set by the chains and beshytween retail prices and shipping-point pricesmdashboth in the current period and lagged one period (ndash1) Recall that correlation coefficients range from ndash10 to 10 with negative correlations indishycating movements of prices in opposite directions correlations near zero indishycating little or no relationship in price movements and positive correlations indicating prices that move together
Because acquisition costs for Hass
Table 2 Price Correlations for Hass Avocados for Los Angeles Retail Chains avocados must be very similar among Los Angeles retailers weLA-1 LA-1 LA-2 LA-2 LA-3 LA-3 LA-4 LA-5 LA-5 would expect to see high correla-
Large Small Large Small Large Small Large Large Small tions among the retail prices and
LA-1-Large 100
LA-1-Small 053 100
LA-2-Large 031 016 100
LA-2-Small 009 011 019 100
LA-3-Large 012 032 016 001 100
LA-3-Small ndash009 030 004 035 033 100
LA-4-Large ndash020 032 043 009 017 ndash005 100
LA-5-Large 051 055 031 024 022 038 034 100
LA-5-Small 031 ndash015 023 002 008 ndash026 025 004 100
Shipping Point-Large 013 027 013 034 014 013 036 035 032
Shipping Point-Large(ndash1) 016 029 015 033 017 015 034 035 031
Shipping Point-Small 028 035 026 045 010 016 040 043 035
Shipping Point-small(ndash1) 028 038 027 048 012 018 034 044 033
between retail and shipping-point prices if retailers are pricing avoshycados competitively by imposing a markup to acquisition costs that is based upon their selling costs Instead however we see that the correlations of retail prices are in general near zero and in some cases are negative Further correshylations of retail prices with the shipping-point prices whether contemporaneous or lagged one period are also near zero indicatshying that changes in the
Giannini Foundation of Agricultural Economics bull University of California
shipping-point price have little effect on prices charged at retail On balance our results indicate that procurement costs are not a primary factor in detershymining retail prices for avocados
Characteristics of Demand for Hass Avocados An estimated retail-sales response model provides basic information on the retail demand for Hass avocados The average retail account in the database had average weekly sales of just over 34669 units of Hass avocados for each size The estimated own-price elasticity of demand for Hass avocados evaluated at the sample means is ndash22 and is highly significant suggesting that demand for Hass avocados at the individual-retailer level is quite elastic (responsive to price) We did not find any evidence of consumer stocking of avocados in response to low-price specials which is consistent with the perishability of fresh avocados
The estimated models reveal evishydence of rising retail prices and sales for avocados with prices and sales slightly higher in marketing year 2003 and significantly higher in marketing year 2004 than in the base 2002 marshyketing year This result is consistent with other research conducted at UC Davis that found annual US demand for avocados increasing significantly over time in response to increased consumer income industry-funded promotion programs growth in Hisshypanic population and other factors such as the increased popularity of Mexican foods
Monthly demand for avocados varshyies seasonally Demand was high during the summer months May through September with June having the highest monthly demand Although retail prices in the high-demand summer months were not significantly different from other months the farm-retail price spreads
were significantly lower in May and June and the probability of temporary price reductions (ie sales) was signifshyicantly higher in May July August and September Retail prices were sigshynificantly lower as a function of the amount of avocados imported from Chile and Mexico meaning that conshysumers have benefited from imports and trade liberalization for avocados
We also see evidence of price effects for some events and holidays Six holishydaysevents ChristmasNew Year Sushyper Bowl Sunday Cinco de Mayo Memorial Day Independence Day and Labor Day had significantly higher deshymands in the shopping week(s) preshyceding andor during the holidayevent (Figure 1) Among the six holidays events associated with significantly higher avocado sales ChristmasNew Year Super Bowl Sunday and Cinco de Mayo are associated with signifishycantly lower prices (Figure 1) lower retail margins and higher incidence of temporary price reductions Super Bowl Sunday had the strongest effect on sales and retail pricing among holishydaysevents Although prices were sigshynificantly higher in the weeks associated with Memorial Day retail markups were not significantly higher
1
1
12
10
8
2
0
1
1
12
10
8
2 0
-2
-
-
-8
-10
ChristmasNY
Labor Day
IndependenceDay
Memorial Day
Cinco de Mayo
Super Bowl
Incr
emen
tal S
ales
Cha
in1
000
Uni
tsW
eek
Change in Price
CentsU
nit
Sales in 1000 units Change in Price
Figure 1 Effects of HolidaysEvents on Retail Sales and Prices for Hass Avocados
and temporary price reductions were more likely to take place but not sigshynificantly Independence Day and Lashybor Day had no significant effects on retail pricing
The estimation results thus offer some evidence that retail prices and retail markups are lower and the probability of sales is higher during high-demand periods for avocados First retailers were more likely to conduct temporary price reductions during almost all the summer months when demand for avocados was high The retail price for avocados was significantly lower in May and the retail margin was significantly lower in May and June relative to the January base Second the retail price and markup were significantly lower and the probability of temporary price reductions was significantly higher during holidays and events associated with significantly higher demand for avocados in particular Super Bowl Sunday and Cinco de Mayo We normally think that higher demand is associated with higher prices but these results for avocados are consistent with results obtained by other researchers for different products
Giannini Foundation of Agricultural Economics bull University of California 7
Retailersrsquo pricing practices for fresh produce are a critically important determinant of producersrsquo and handlersrsquo incomes
Photo Credit UC Regents
CAC Promotion Programs The fact that the CAC selected a set of markets for its promotions during particular times of a year enables us to construct treatment and control groups and a before-andshyafter design for program evaluation The approach of ldquodifference-inshydifferencerdquo is employed to estimate the counterfactual retail demand for the selected markets that received the CACrsquos promotion programs Unobserved temporary factors and idiosyncratic retailer and market characteristics that might contribute to changes in demand are isolated to achieve a ldquocleanrdquo identification of the effects of the CACrsquos promotion programs
The analysis demonstrates that the CACrsquos radio campaign and outdoor advertisements were successful in raisshying avocado sales in the 11-12 major markets where the CAC conducted its promotions during the time period of our analysis The presence of the radio (outdoor) campaign in the treated
market was associated on average with 7058 (8822) more units sold for each size of Hass avocados at a retail acshycount in one week Neither the radio nor outdoor campaigns had a signifishycant impact on retail price or on retail markup on average The retail price and markup were lower (higher) durshying the radio (outdoor) campaigns but the effect was negligible and insignifishycant However retailers were more likely to hold temporary price reducshytions during the CACrsquos promotion programs In particular retailers tended to conduct significantly more temporary price reductions during the radio promotions Lower retail price and markup and more frequent temshyporary price reductions during the radio promotions suggest that retailers responded more actively to the radio advertising than to the outdoor proshymotions and that their response was at least mildly supportive of the CACrsquos programs In particular there is no evshyidence that retailers raised price to choke off the promotion-induced deshymand expansion
Concluding Comments Our results regarding retailersrsquo pricing for avocados are probably applicable to other produce products with similar characteristics We would not be surprised for example to find for other specialized perishable products with moderate sales that (i) the product is priced lower when demand is high (ii) changing procurement costs are not a major determinant of retail prices (iii) retailers increase their margins when weekly shipments are increasing and (iv) retailersrsquo pricing practices mildly support or at least do not offset industry-advertising programs
Lan Li received her PhD from the Department of Agricultural and Resource Economics at UC Davis where Hoy Carman and Richard Sexton are professors They can be reached by e-mail at lanlilatrobeeduau carmanprimalucdavis edu and richprimalucdavisedu respectively
Funding for this project has been made available by the Governorrsquos Buy California Initiative the California Department of Food and Agriculture (CDFA) and the US Department of Agriculture (USDA) The content of this publication does not necessarily reflect the views or policies of CDFA or USDA nor does any mention of trade names commercial products and organizations imply endorsement of them by CDFA or USDA
Giannini Foundation of Agricultural Economics bull University of California 8
OECD Support for Agriculture Has it Historically Harmed Poor Countries Alix Peterson Zwane and Margaret McMillan
This article summarizes recent research that assesses the impacts of the agricultural policies of rich countries on poverty in developing countries A central message of this research is that because of the diversity both within and among developing countries the extent to which rich-country support policies translate into lower incomes in poor countries varies on a country-byshycountry basis Many least-developed countries especially in Africa are net importers of food As net food importers they may be hurt by higher commodity prices
Rich countries are under increasing pressure from around the work to end support to
agriculture Agricultural subsidies and price supports (mainly given to bulk-commodity producers and dairy farmers in the US) allow the industrialized countries that are members of the Organization of Economic Cooperation and Development (OECD) to sell their agricultural products on world markets at prices that are below the cost of production California farmers have often complained that such support policies make it difficult for them to compete in foreign markets as many European specialty-crop producers receive government assistance that they do not get Competitive producers of bulk commodities in countries like Australia have made similar complaints about US cotton and corn producers Consumer advocates and agricultural economists have often emphasized the perverse effects of these policies on land and food
markets here at home Many observers outside of the agriculture sector on the other hand have focused on the concern that these policies are likely to hurt the poorest residents of poor countries Because many poor people in developing countries are farmers eliminating support for rich-country farmers will raise world prices and thus the incomes of the poor This argument for agricultural policy reform has been particularly common in recent years as the current round of trade talks at the World Trade Organization (WTO) has been dubbed the ldquodevelopment roundrdquo and the chance for developing countries to experience benefits from increased trade and globalization
In recent work we have evaluated these development-related arguments for trade liberalization systematically by measuring the impact of OECD agshyricultural policies on poverty in developing countries A central messhysage of this research is that because of the diversity both within and among developing countries the extent to which rich-country support policies translate into lower incomes in poor countries varies on a country-by-counshytry basis Many least-developed countries especially in Africa are net importers of food As net food importshyers they may be hurt by higher commodity prices Some countries may import cereals such as maize and rice but export other agricultural products such as sugar or cotton Higher prices for exports and imports will have net effects that are difficult to predict ex ante Even within importing countries the poorest members of soshyciety may be net sellers of food
In this article we review some of our analysis documenting the relationshy
ship between income per capita and the value of net cereal food and agrishycultural (food plus non-food) exports for each of the three decades leading up to 2000 We find thatmdashon aver-agemdashthe poorest countries have historically been net importers of cereshyals and food the products most heavily supported by the OECD counshytries just as they are today We encourage readers to turn to our comshyplete paper available at wwwnber orgpapersw11289 for a discussion of additional cross-country regression analysis and a case study of the impact of NAFTA on poor corn farmers in Mexico
The Agricultural Trade Position of Developing Countries We investigate the relationship between income per capita (measured in constant 1985 dollars at Purchasing Power Parity exchange rates (which account for variations in relative prices between countries) and collected from the Penn World Tables version 61) and the value of net cereal net food and net agricultural exports including non-food products as a share of GDP (measured at current prices) This can be thought of as the fraction of current income earned from the sale of these products or spent to purchase these products Because there is time-series data on agricultural imports and exports as well as income it is possible to track the behavior of the cohort of developing countries over time
We identify the countries that may have been most affected historically by OECD agricultural policy as those that have spent (earned) the greatest fraction of income on imports (exports) of supported products We
Giannini Foundation of Agricultural Economics bull University of California
-
-
10
ee
ee
ee
GG
ao
rr
aal
EN
t Cl
F
l
igure 2 Net Food Exports amp Income Per Capita 170 2000
us
Vtr
pxN
Figure 1 Net Cereal Exports amp Income Per Capita 170 2000 u
ts V
xpd
Eoo
ot F
))
t Pt P
riri
cc
ee
ee
s (
s (
t Ct C
urur
rr
nn
DD
P a
P a
are particularly interested in comparing how cereal importers differ from food or non-food agricultural exporters While cereals prices are depressed by OECD agricultural support policies the prices of most other food products (with the important exceptions of dairy and sugar) and non-food products (with the important exception of cotton) are largely unaffected by OECD support
Figures 1 2 and 3 present data on income earned from agricultural exshyports in three different ways First we use data from the FAO to calculate the value of annual net cereal exports as a percentage of GDP for a sample of 99 developing countries and take the avshyerage value of this number for the peshyriod 1970-1979 1980 -1989 and 1990-2000 We show the cross-secshytional income profile for these three time periods in Figure 1 by using a
-2
-
-
-
-
-7
Decade Average Income per Capita (log scale $18 PPP)
Avg Fraction of income spent on cereal net exports 170-80 Avg Fraction of income spent on cereal net exports 180-0 Avg Fraction of income spent on cereal net exports 10-2000
7 8 10
locally-weighted increases experienced at higher regression of income levels largely bypassed the decadal average poorest countries in the post-colonial cereal export era share on the These data suggest that depressed decadal average prices for food products may hurt mid-of the log of inshy dle-income countries but help the come per capita poorest and richest developing counshy(bandwidth = 08) tries As shown in Figure 2 and unlike We run the same in the case of cereals alone among regressions for non-OECD countries only middle-inshyfood export come countries earn income from food share and pres- exports The cross-sectional relationshyent those results ship between net earnings from all
in Figure 2 Figure 3 shows the regres- food exports as a share of GDP is nonshysions for agricultural export shares monotonic This production category (including non-food products such as includes non-cereal products that re-green coffee and fibers) ceive high levels of support in the
Figure 1 shows that in each de- OECD including sugar beef and cade the poorest countries spend the dairy products as well as unsubsidized largest fraction of their incomes on ce- products such as cocoa and most fruits real imports suggesting that they may and vegetables experience net benefits as a result of Poor countries are most likely to be depressed cereal prices In fact so few net exporters of agricultural products developing countries are net cereal ex- in total as shown in Figure 3 We run porters in any decade that the the same regressions to create this fig-predicted net cereal export share is ure but consider all agricultural prod-negative even at the highest income ucts including fibers industrial seeds levels observed in the data green coffee and tobacco In this case
Since 1970 the poorest countries we find a downward-sloping relation-have also experienced the smallest ship between net export earnings and reduction in net expenditures on cere- income Relatively well-off developing al exports as a share of GDP To trace countries import agricultural products the average cereal export share of a as a whole This suggests that deshygiven country experiencing economic pressed prices for non-food agriculshygrowth points should not be connect- tural products like cotton are ed within years but across the regres- particularly damaging to the poorest
sion lines countries
2 behavior of a
1 like country in the following
0 decade Thus the fact that the-1 regression lines
-2 are very close to each other at the lowest levels of income suggests that net export
7 8 10 Decade Average Income per Capita (log scale $18 PPP)
Avg Fraction of income spent on food net exports 170-80 Avg Fraction of income spent on food net exports 180-0 Avg Fraction of income spent on food net exports 10-2000
linking up the Summary and Conclusionexperience and Figures 1 2 and 3 together provide evidence that many poor countries import cereals but export agricultural products as a whole and have been in this position throughout the post-colonial era Many poor countries and even many middle-income countries that export food products also import cereals particularly in the 1990s Depressed commodity prices as a result of domestic support
Giannini Foundation of Agricultural Economics bull University of California
-
for agriculture in the OECD could oping counshylower the value of both imported tries Probably
products and exported products for the most imporshythese countries While it is true that tant reason for
2 a majority of poor countries are net the differences exporters of agricultural products in results is
a
Giannini Foundation of Agricultural Economics
a
bull University of California
Fig Net Agricultural Exports amp Income Per Capita 170 2000
ll
eut e
ue
G
xpor
ts
Vur
l Et A
gric
N
)
alization by developing countries with liberalization by developed countries when estimating welfare impacts We focus solely on the impacts of rich-country polices on poor countries and
t Pric
es
(t C
urr
nD
P a
the poor residents of these countries Nonetheless our work suggests that hopes for important income gains in poor countries as a result of broad-based agricultural trade liberalization by rich countries may be misplaced Rather most of the benefits of this trade liberalization will be captured by growers and consumers in a handshyful of well-off agriculturally competishy
assistant in the
resource economics department at UC Berkeley She can be contacted by e-mail at zwaneare berkeleyedu Margaret McMillan is an associate professor in the Department of Economics
7 8 10
0today among the non-food products that other stud-cotton stands out as the only non- ies have not food commodity whose price is focused explicshy
-2 likely to be significantly depressed itly on poverty
Decade Average Income per Capita (log scale $18 PPP)by OECD agricultural support but rather on Avg fraction of income spent on agricultural net exports 170-80Of course the experience of devel- developing Avg fraction of income spent on agricultural net exports 180-0
oping countries is diverse and because countries as a Avg fraction of income spent on agricultural net exports 10-2000 they are regressions Figures 1 through whole Addishy3 obscure differences in countriesrsquo ex- tionally many studies combine libershyperiences at any income level Howshyever these results suggest that it is unlikely that broad agricultural liberalshyization which is likely to result in higher world prices for cereals as well as dairy sugar and cotton will benefit the majority of the poorest countries On the other hand country-level avershyage values of net cereals or food exshyports tell us little about what happens to the poor within a country Even in countries that are net importers of food the poor may be net exporters of food Thus a poor country might be hurt by higher food prices while the
For additional information the authors recommend the following sources
McMillan M A Zwane and N Ashraf (forthcoming) My policies or yours Does OECD support for agriculture increase poverty in developing countriesrdquo In Globalization and Poverty A Harrison (ed) University of Chicago Press for National Bureau of Economic Research (forthcoming) Available wwwnberorgpapersw11289
Panagariya A (2002) ldquoTrade andpoor within that country benefit from tive economies food security Conceptualizinghigher food prices the linkagesrdquo Paper prepared forIn our research we find no support
Alix Zwane is Cooperative presentation at the Conferencean in cross-country regression analysis Extension specialist agricultural and on Trade Agriculturalfor the claim that OECD policies have worsened poverty in developing counshytries on average or for the particular claim that liberalizing US-Mexico
Development and Food Security The Impact of Recent Economic and Trade Policyat Reform Food and AgriculturalTufts University agricultural trade has harmed poor Organization Rome July 11-12 corn farmers in Mexico Our results
stand in stark contrast with the large body of literature that has been devoted to examining the potential impact of agricultural trade liberalshyization on developing countries using computable general equilibrium (CGE) models While the magnitudes of CGE estimates vary agricultural trade liberalization is typically preshydicted to increase world commodity prices to the overall benefit of devel-
Oxfam (2003) ldquoDumping without borders How US agricultural policies are destroying the livelihoods of Mexican corn farmersrdquo Oxfam Briefing Paper 50 London Oxfam
11
Agricultural and Resource Economics
UPDATE
Co-Editors
Steve Blank
Richard Sexton
David Zilberman
Alix Peterson Zwane
Managing Editor and Desktop Publisher
Julie McNamara
Published by the Giannini Foundation of Agricultural Economics
httpgianniniucopedu
ARE Update is published six times per year by the Giannini Foundation of Agricultural Economics University of California
Domestic subscriptions are available free of charge to interested parties To subscribe to ARE Update by mail contact
Julie McNamara Outreach Coordinator Department of Agricultural and Resource Economics University of California
One Shields Avenue Davis CA 95616 E-mail julieprimalucdavisedu Phone 530-752-5346
To receive notification when new issues of the ARE Update are available online submit an e-mail request to join our listserv to julieprimalucdavisedu
Articles published herein may be reprinted in their entirety with the authorrsquos or editorsrsquo permission Please credit the Giannini Foundation of Agricultural Economics University of California
ARE Update is available online at wwwageconucdaviseduoutreachareupdatephp
The University of California is an Equal OpportunityAffirmative Action employer
Department of Agricultural and Resource Economics UC Davis One Shields Avenue Davis CA 1 GPBS
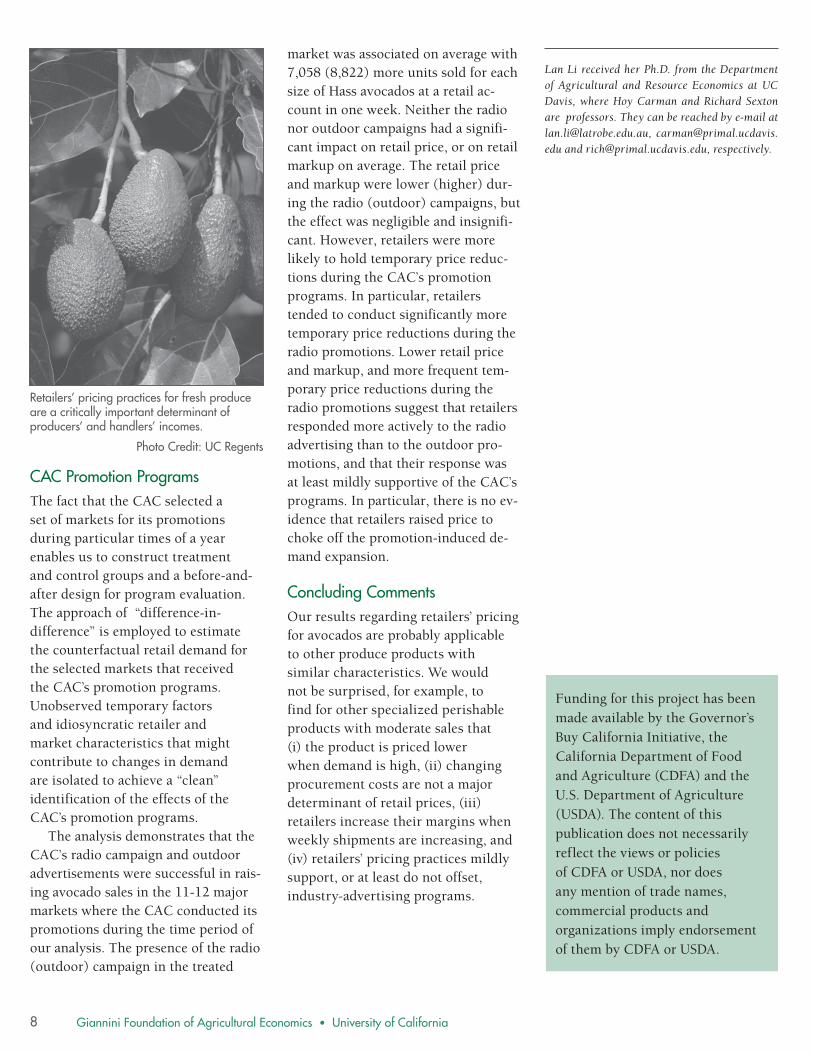

-
-
10
ee
ee
ee
GG
ao
rr
aal
EN
t Cl
F
l
igure 2 Net Food Exports amp Income Per Capita 170 2000
us
Vtr
pxN
Figure 1 Net Cereal Exports amp Income Per Capita 170 2000 u
ts V
xpd
Eoo
ot F
))
t Pt P
riri
cc
ee
ee
s (
s (
t Ct C
urur
rr
nn
DD
P a
P a
are particularly interested in comparing how cereal importers differ from food or non-food agricultural exporters While cereals prices are depressed by OECD agricultural support policies the prices of most other food products (with the important exceptions of dairy and sugar) and non-food products (with the important exception of cotton) are largely unaffected by OECD support
Figures 1 2 and 3 present data on income earned from agricultural exshyports in three different ways First we use data from the FAO to calculate the value of annual net cereal exports as a percentage of GDP for a sample of 99 developing countries and take the avshyerage value of this number for the peshyriod 1970-1979 1980 -1989 and 1990-2000 We show the cross-secshytional income profile for these three time periods in Figure 1 by using a
-2
-
-
-
-
-7
Decade Average Income per Capita (log scale $18 PPP)
Avg Fraction of income spent on cereal net exports 170-80 Avg Fraction of income spent on cereal net exports 180-0 Avg Fraction of income spent on cereal net exports 10-2000
7 8 10
locally-weighted increases experienced at higher regression of income levels largely bypassed the decadal average poorest countries in the post-colonial cereal export era share on the These data suggest that depressed decadal average prices for food products may hurt mid-of the log of inshy dle-income countries but help the come per capita poorest and richest developing counshy(bandwidth = 08) tries As shown in Figure 2 and unlike We run the same in the case of cereals alone among regressions for non-OECD countries only middle-inshyfood export come countries earn income from food share and pres- exports The cross-sectional relationshyent those results ship between net earnings from all
in Figure 2 Figure 3 shows the regres- food exports as a share of GDP is nonshysions for agricultural export shares monotonic This production category (including non-food products such as includes non-cereal products that re-green coffee and fibers) ceive high levels of support in the
Figure 1 shows that in each de- OECD including sugar beef and cade the poorest countries spend the dairy products as well as unsubsidized largest fraction of their incomes on ce- products such as cocoa and most fruits real imports suggesting that they may and vegetables experience net benefits as a result of Poor countries are most likely to be depressed cereal prices In fact so few net exporters of agricultural products developing countries are net cereal ex- in total as shown in Figure 3 We run porters in any decade that the the same regressions to create this fig-predicted net cereal export share is ure but consider all agricultural prod-negative even at the highest income ucts including fibers industrial seeds levels observed in the data green coffee and tobacco In this case
Since 1970 the poorest countries we find a downward-sloping relation-have also experienced the smallest ship between net export earnings and reduction in net expenditures on cere- income Relatively well-off developing al exports as a share of GDP To trace countries import agricultural products the average cereal export share of a as a whole This suggests that deshygiven country experiencing economic pressed prices for non-food agriculshygrowth points should not be connect- tural products like cotton are ed within years but across the regres- particularly damaging to the poorest
sion lines countries
2 behavior of a
1 like country in the following
0 decade Thus the fact that the-1 regression lines
-2 are very close to each other at the lowest levels of income suggests that net export
7 8 10 Decade Average Income per Capita (log scale $18 PPP)
Avg Fraction of income spent on food net exports 170-80 Avg Fraction of income spent on food net exports 180-0 Avg Fraction of income spent on food net exports 10-2000
linking up the Summary and Conclusionexperience and Figures 1 2 and 3 together provide evidence that many poor countries import cereals but export agricultural products as a whole and have been in this position throughout the post-colonial era Many poor countries and even many middle-income countries that export food products also import cereals particularly in the 1990s Depressed commodity prices as a result of domestic support
Giannini Foundation of Agricultural Economics bull University of California
-
for agriculture in the OECD could oping counshylower the value of both imported tries Probably
products and exported products for the most imporshythese countries While it is true that tant reason for
2 a majority of poor countries are net the differences exporters of agricultural products in results is
a
Giannini Foundation of Agricultural Economics
a
bull University of California
Fig Net Agricultural Exports amp Income Per Capita 170 2000
ll
eut e
ue
G
xpor
ts
Vur
l Et A
gric
N
)
alization by developing countries with liberalization by developed countries when estimating welfare impacts We focus solely on the impacts of rich-country polices on poor countries and
t Pric
es
(t C
urr
nD
P a
the poor residents of these countries Nonetheless our work suggests that hopes for important income gains in poor countries as a result of broad-based agricultural trade liberalization by rich countries may be misplaced Rather most of the benefits of this trade liberalization will be captured by growers and consumers in a handshyful of well-off agriculturally competishy
assistant in the
resource economics department at UC Berkeley She can be contacted by e-mail at zwaneare berkeleyedu Margaret McMillan is an associate professor in the Department of Economics
7 8 10
0today among the non-food products that other stud-cotton stands out as the only non- ies have not food commodity whose price is focused explicshy
-2 likely to be significantly depressed itly on poverty
Decade Average Income per Capita (log scale $18 PPP)by OECD agricultural support but rather on Avg fraction of income spent on agricultural net exports 170-80Of course the experience of devel- developing Avg fraction of income spent on agricultural net exports 180-0
oping countries is diverse and because countries as a Avg fraction of income spent on agricultural net exports 10-2000 they are regressions Figures 1 through whole Addishy3 obscure differences in countriesrsquo ex- tionally many studies combine libershyperiences at any income level Howshyever these results suggest that it is unlikely that broad agricultural liberalshyization which is likely to result in higher world prices for cereals as well as dairy sugar and cotton will benefit the majority of the poorest countries On the other hand country-level avershyage values of net cereals or food exshyports tell us little about what happens to the poor within a country Even in countries that are net importers of food the poor may be net exporters of food Thus a poor country might be hurt by higher food prices while the
For additional information the authors recommend the following sources
McMillan M A Zwane and N Ashraf (forthcoming) My policies or yours Does OECD support for agriculture increase poverty in developing countriesrdquo In Globalization and Poverty A Harrison (ed) University of Chicago Press for National Bureau of Economic Research (forthcoming) Available wwwnberorgpapersw11289
Panagariya A (2002) ldquoTrade andpoor within that country benefit from tive economies food security Conceptualizinghigher food prices the linkagesrdquo Paper prepared forIn our research we find no support
Alix Zwane is Cooperative presentation at the Conferencean in cross-country regression analysis Extension specialist agricultural and on Trade Agriculturalfor the claim that OECD policies have worsened poverty in developing counshytries on average or for the particular claim that liberalizing US-Mexico
Development and Food Security The Impact of Recent Economic and Trade Policyat Reform Food and AgriculturalTufts University agricultural trade has harmed poor Organization Rome July 11-12 corn farmers in Mexico Our results
stand in stark contrast with the large body of literature that has been devoted to examining the potential impact of agricultural trade liberalshyization on developing countries using computable general equilibrium (CGE) models While the magnitudes of CGE estimates vary agricultural trade liberalization is typically preshydicted to increase world commodity prices to the overall benefit of devel-
Oxfam (2003) ldquoDumping without borders How US agricultural policies are destroying the livelihoods of Mexican corn farmersrdquo Oxfam Briefing Paper 50 London Oxfam
11
Agricultural and Resource Economics
UPDATE
Co-Editors
Steve Blank
Richard Sexton
David Zilberman
Alix Peterson Zwane
Managing Editor and Desktop Publisher
Julie McNamara
Published by the Giannini Foundation of Agricultural Economics
httpgianniniucopedu
ARE Update is published six times per year by the Giannini Foundation of Agricultural Economics University of California
Domestic subscriptions are available free of charge to interested parties To subscribe to ARE Update by mail contact
Julie McNamara Outreach Coordinator Department of Agricultural and Resource Economics University of California
One Shields Avenue Davis CA 95616 E-mail julieprimalucdavisedu Phone 530-752-5346
To receive notification when new issues of the ARE Update are available online submit an e-mail request to join our listserv to julieprimalucdavisedu
Articles published herein may be reprinted in their entirety with the authorrsquos or editorsrsquo permission Please credit the Giannini Foundation of Agricultural Economics University of California
ARE Update is available online at wwwageconucdaviseduoutreachareupdatephp
The University of California is an Equal OpportunityAffirmative Action employer
Department of Agricultural and Resource Economics UC Davis One Shields Avenue Davis CA 1 GPBS
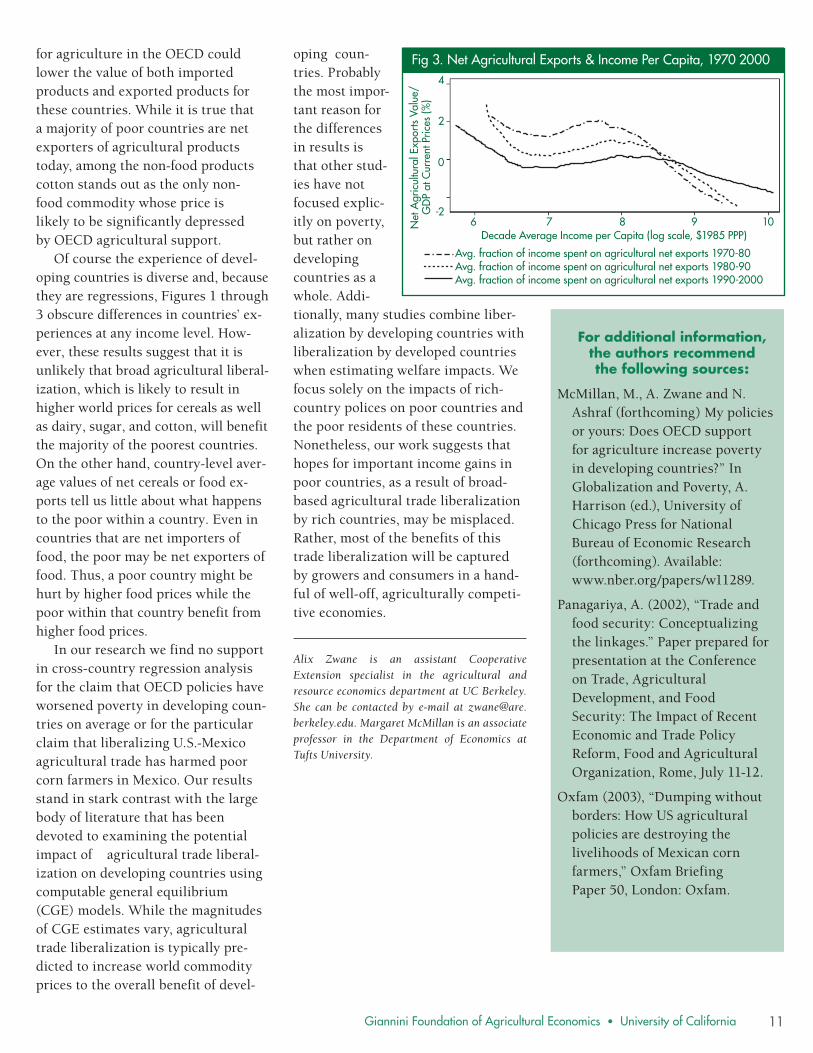
-
for agriculture in the OECD could oping counshylower the value of both imported tries Probably
products and exported products for the most imporshythese countries While it is true that tant reason for
2 a majority of poor countries are net the differences exporters of agricultural products in results is
a
Giannini Foundation of Agricultural Economics
a
bull University of California
Fig Net Agricultural Exports amp Income Per Capita 170 2000
ll
eut e
ue
G
xpor
ts
Vur
l Et A
gric
N
)
alization by developing countries with liberalization by developed countries when estimating welfare impacts We focus solely on the impacts of rich-country polices on poor countries and
t Pric
es
(t C
urr
nD
P a
the poor residents of these countries Nonetheless our work suggests that hopes for important income gains in poor countries as a result of broad-based agricultural trade liberalization by rich countries may be misplaced Rather most of the benefits of this trade liberalization will be captured by growers and consumers in a handshyful of well-off agriculturally competishy
assistant in the
resource economics department at UC Berkeley She can be contacted by e-mail at zwaneare berkeleyedu Margaret McMillan is an associate professor in the Department of Economics
7 8 10
0today among the non-food products that other stud-cotton stands out as the only non- ies have not food commodity whose price is focused explicshy
-2 likely to be significantly depressed itly on poverty
Decade Average Income per Capita (log scale $18 PPP)by OECD agricultural support but rather on Avg fraction of income spent on agricultural net exports 170-80Of course the experience of devel- developing Avg fraction of income spent on agricultural net exports 180-0
oping countries is diverse and because countries as a Avg fraction of income spent on agricultural net exports 10-2000 they are regressions Figures 1 through whole Addishy3 obscure differences in countriesrsquo ex- tionally many studies combine libershyperiences at any income level Howshyever these results suggest that it is unlikely that broad agricultural liberalshyization which is likely to result in higher world prices for cereals as well as dairy sugar and cotton will benefit the majority of the poorest countries On the other hand country-level avershyage values of net cereals or food exshyports tell us little about what happens to the poor within a country Even in countries that are net importers of food the poor may be net exporters of food Thus a poor country might be hurt by higher food prices while the
For additional information the authors recommend the following sources
McMillan M A Zwane and N Ashraf (forthcoming) My policies or yours Does OECD support for agriculture increase poverty in developing countriesrdquo In Globalization and Poverty A Harrison (ed) University of Chicago Press for National Bureau of Economic Research (forthcoming) Available wwwnberorgpapersw11289
Panagariya A (2002) ldquoTrade andpoor within that country benefit from tive economies food security Conceptualizinghigher food prices the linkagesrdquo Paper prepared forIn our research we find no support
Alix Zwane is Cooperative presentation at the Conferencean in cross-country regression analysis Extension specialist agricultural and on Trade Agriculturalfor the claim that OECD policies have worsened poverty in developing counshytries on average or for the particular claim that liberalizing US-Mexico
Development and Food Security The Impact of Recent Economic and Trade Policyat Reform Food and AgriculturalTufts University agricultural trade has harmed poor Organization Rome July 11-12 corn farmers in Mexico Our results
stand in stark contrast with the large body of literature that has been devoted to examining the potential impact of agricultural trade liberalshyization on developing countries using computable general equilibrium (CGE) models While the magnitudes of CGE estimates vary agricultural trade liberalization is typically preshydicted to increase world commodity prices to the overall benefit of devel-
Oxfam (2003) ldquoDumping without borders How US agricultural policies are destroying the livelihoods of Mexican corn farmersrdquo Oxfam Briefing Paper 50 London Oxfam
11
Agricultural and Resource Economics
UPDATE
Co-Editors
Steve Blank
Richard Sexton
David Zilberman
Alix Peterson Zwane
Managing Editor and Desktop Publisher
Julie McNamara
Published by the Giannini Foundation of Agricultural Economics
httpgianniniucopedu
ARE Update is published six times per year by the Giannini Foundation of Agricultural Economics University of California
Domestic subscriptions are available free of charge to interested parties To subscribe to ARE Update by mail contact
Julie McNamara Outreach Coordinator Department of Agricultural and Resource Economics University of California
One Shields Avenue Davis CA 95616 E-mail julieprimalucdavisedu Phone 530-752-5346
To receive notification when new issues of the ARE Update are available online submit an e-mail request to join our listserv to julieprimalucdavisedu
Articles published herein may be reprinted in their entirety with the authorrsquos or editorsrsquo permission Please credit the Giannini Foundation of Agricultural Economics University of California
ARE Update is available online at wwwageconucdaviseduoutreachareupdatephp
The University of California is an Equal OpportunityAffirmative Action employer
Department of Agricultural and Resource Economics UC Davis One Shields Avenue Davis CA 1 GPBS