is group model building worthwhile? considering the ... · is group model building worthwhile?...
TRANSCRIPT

See discussions, stats, and author profiles for this publication at: https://www.researchgate.net/publication/254880078
Is Group Model Building worthwhile? Considering the effectiveness of GMB
Article · January 2009
CITATIONS
7
4 authors, including:
Some of the authors of this publication are also working on these related projects:
Contracts, Deals and Bargains View project
M. McCardle
Radboud University
5 PUBLICATIONS 26 CITATIONS
SEE PROFILE
Etiënne A. J. A. Rouwette
Radboud University
88 PUBLICATIONS 1,529 CITATIONS
SEE PROFILE
All content following this page was uploaded by Etiënne A. J. A. Rouwette on 08 July 2014.
The user has requested enhancement of the downloaded file.

1
Is Group Model Building worthwhile?
Considering the effectiveness of GMB
Marleen McCardle-Keurentjes
1
Etiënne A. J. A. Rouwette
Jac A. M. Vennix
Eric Jacobs
Radboud University Nijmegen
Institute for Management Research
Thomas van Aquinostraat 1.2.24
P.O.Box 9108
6500 HK Nijmegen
The Netherlands
tel. +31 24 3611473
fax +31 24 3611599
- Work in progress-
Abstract
Many field studies are available that describe successful applications of model driven
group decision support methodologies. However, these studies suffer from a potential
bias of contextual factors. We aim at a more rigorous testing of the effectiveness of a
particular model driven approach, Group Model Building (GMB). The purpose of our
research is to determine the effectiveness of GMB in a controlled research situation.
Five-member groups were either supported (GMB groups, n=13) or working together
in an unsupported mode (control groups: n=13). We used the Competing Values
framework to measure the perceptions of participants on the decision-making process
(n=130). We also examined the decisions that the groups made by running
simulations. The overall results show that there are no winners. However, results
reveal the importance of the experience of the facilitator and of gender related
factors.
Key words: Group Model Building, experimental research, strategic decision-making
1 Contact author

2
1. Introduction
This paper focuses on the challenge to investigate the effectiveness of Group Model
Building (GMB) in an experimental research setting. GMB is one of the model driven
group decision support systems (Morton, Ackermann, and Belton 2003). We use GMB
here in the qualitative mode of System Dynamics (SD) modeling. Contrary to the
quantitative mode in which strategic decision-making groups are supported with
computer simulation, in the qualitative mode, an SD model is constructed with a
(client) group of decision-makers, without computer simulation support (Vennix 1995).
Here, we concentrate on GMB applications in which decision-making groups
participate in the construction of a causal loop diagram to tackle a strategic problem.
Increasingly, ‘Group Model Building’ is known as a general term for all client
oriented SD approaches (Rouwette 2003). From the early days of the SD field, the
importance of client involvement in the process of constructing models has been
acknowledged (Forrester 1961). In the 1990s, GMB was developed as an approach for
active client engagement in SD modeling, driven by the growing attention to
implementation of the results of SD modeling (Rouwette and Vennix 2006). At this
moment, GMB has been applied in many different organizations and sectors. This is
reflected in a steadily increasing amount of case studies that have described GMB
applications in practice (see e.g. Rouwette, Vennix, and van Mullekom 2002). These
studies give a rich account of the context in which the methodology is used, the processes
that are followed and the (perceptions of) outcomes.
The increasing number of descriptive case studies in the recent decade indicates
that the methodology is perceived to be useful in practice. However, the question is how
useful or effective GMB actually is in supporting group decision-making. In the next
section, we look at our reasons to conduct experimental research into effectiveness of
GMB. In section 3, we address the context of the situations in which GMB is used, the
goals of GMB and the process by which these goals are supposed to be achieved. The
Competing Values Approach (CVA) that we used for collecting data is presented in
section 4 as well as the hypotheses. In section 5, the methods of the present study are
addressed. Then, we present the results in section 6. In the final section, we discuss
implications of the findings for further research.
2. Need for more systematic research
Already in 1993, the need for testing the results of GMB in a systematic and rigorous
way was noted (Vennix, Scheper, and Willems 1993). The study focused on the
opinions of participants of four different GMB projects with regard to main goals of the
methodology. The study had an exploratory character and a sample of only 26
respondents, but it was a start of a systematic evaluation of GMB. In particular the
reasons why systematic evaluation is considered of the utmost importance are
interesting. The first reason is that systematic research forces us to think about benefits
that GMB might bring to organizations. The second reason is that by systematic
research, methods can be improved and ‘thus the effectiveness’ of GMB can be
increased (1993: 534). While the latter reason requires a certain body of knowledge - as
a condition for changing methods for the better -, the first reason, i.e. active reflection,
3
contributes to the body of knowledge. This reason seems to have a more fundamental or
theoretical character. Doing systematic research because that kind of research makes us
think, refers to the point where systematic research starts and where it encourages us to
move on: active reflection accompanies description, explanation and evaluation. This
argument will concern all researchers, but also all those in organizations who consider
the use of GMB and/or have to account for their investments in using GMB.
In the following years, active reflection on benefits of GMB did lead to gains,
for instance ideas on tensions stemming from different views on what purpose GMB
serves. For example, GMB leads the group of participants to a model that objectively
explains the problematic behavior of the system or alternatively, reflects an agreed-
upon view of different stakeholders. Both views may be combined, although tensions
will continue to exist (Zagonel 2004). Also, insights on the essential elements of GMB,
facilitation and modeling, have been illustrated, discussed and debated (Vennix 1996;
see e.g. Coyle 2000; Lane 2008).
But, even though substantial advancements in the field are affirmed (Rouwette
and Vennix 2006), the call for ‘adding more science to the craft’ (Andersen,
Richardson, and Vennix 1997: subtitle of article) has been revitalized: ‘the challenge
now is to begin converting a stock of ‘craft wisdom’ into a stock of scientifically tested
knowledge’ (Lane 2008). So recently, systematic evaluation of GMB has gained
renewed attention.
The plea to study the effectiveness of GMB in a more rigorous and more
systematic way is founded on methodological considerations. It should be noted that
process or contextual factors such as the fact that an outsider (the facilitator) helps to
structure the problem, are not fully addressed in most field studies. Yet, the skills and
tacit knowledge of the facilitator are seen as explanatory elements for success of model
driven methodologies. These personal or human elements pose difficulties regarding
transmission to new practitioners (Morton, Ackermann, and Belton 2003), but also for
measurement and comparison of methodologies. The fact that in real-life situations, a
client oriented methodology is adapted to the situation at hand complicates the
measurement and comparison of effects of client oriented SD approaches. Many case
studies are available and an accumulation of measurements from these studies is a good
way to reveal meaningful differences in effectiveness of GMB. Secondly, comparison
of cases could be helpful. However, both possibilities can only bring valid results under
the assumption of similarity in context and process factors that are not under
investigation. In this respect, an overall theoretical framework is lacking from which
empirical testing of context, process and outcome variables can be derived.
There is also a lack of formal testing in more controlled research situations.
Experimental research has rarely been used to draw conclusions about effectiveness of
GMB (Rouwette et al. 2002). This is unfortunate because research in a controlled setting
would allow for testing propositions on the effectiveness of GMB. We have to be aware
that the effectiveness of any group decision support methodology can easily been
questioned by referring to the Hawthorne effect hypothesis (Andersen, Richardson, and
Vennix 1997: 195): ‘What matters is that something special or out of the ordinary was
done with the group and the problem at hand’. On the other hand, if we do research in
laboratory settings, decision-making situations are inherently abstracted from real-life
contextual factors, such as involvement of real experts or organizational norms which

4
define decision-making in organizations (Meso, Troutt, and Rudnicka 2002). The
external validity of research in laboratory settings is debatable due to the artificial setting
of the research situation (Babbie 2001).
To conclude, the combination of multiple strategies which do not share the same
weaknesses will be best to gain knowledge on a particular research problem (cf. McGrath
1982). We believe we can enrich the understanding of effectiveness of GMB by moving
beyond the weaknesses of the research strategy that currently is used most often. Formal
experiments for evaluation and validation of GMB are clearly needed (Finlay 1998;
Rouwette et al. 2002). It has to be determined whether it is really the methodology itself
that is effective and if so, what elements of the methodology are contributing to
effectiveness.
3. Goals of Group Model Building
GMB is rooted in SD and refers to the process of building a SD model of a strategic
problem, together, in a group of stakeholders and experts under the guidance of a
facilitator (or facilitation team) (Andersen et al. 1997). SD modeling and facilitation are
the two pillars of the methodology. While participants share important information in the
group, they build a SD model that represents their ideas on the system.
From the above characterization, it appears useful to consider context factors in
more detail because from the situation in which GMB is used, the goals of GMB are
basically inferred. Next, we will move to the goals (expected outcomes) of GMB and
explain how the expected outcomes are thought to be brought about (i.e. process factors).
Context
GMB is used in strategic decision-making. Generally, within organizations, decision-
relevant information for strategic decision-making is dispersed over persons from
different departments and with different functional backgrounds. Therefore, strategic
decisions are usually made by groups under the assumption that a group will make
good use of the broad pool of information that individual participants have at their
disposal.
Typically, GMB is used when disagreement exists between the persons involved in a
decision, with regard to the magnitude and importance of the problem and the policies to
tackle the problem. Different interests and views on the problem hinder the clarification
of the problem. As a consequence, reaching agreement on policies for the future is also
problematic. Thus, a shared understanding of the problem is needed in order to achieve
consensus.
The nature of strategic decisions complicates the decision-making process.
Warren (2008) mentions several characteristics of strategic situations that make deciding
difficult, amongst others:
� the (potentially) large impact on the performance of organizations;
� considerable difference in performance of alternative policies in changing a
situation for the better: as time passes, small differences in effect accumulate;
� the interaction of important elements in the decision-making situation that
sometimes requires counterintuitive policies;

5
� delays between decisions and consequences: to find no effects of a decision at
time x does not say that a decision is not working.
In sum, relevant factors in the context of situations in which GMB is used are: (a)
the information distribution over diverse persons, (b) different interests and views of
these persons on the problem and policies, and (c) the complex nature of a strategic
decision.
As indicated above, from the context of strategic decision-making, it follows what GMB
aims to achieve and in what way these aims are supposed to be reached.
Goals and process
GMB intends to accomplish two main goals (Vennix 1996): The first goal is to build a
SD model of a strategic problem situation by helping decision-makers in modeling their
problem. Here, modeling means: identifying, structuring and visualizing the important
elements, causal links and polarities in the problem situation. The group builds its model
to solve their problem (cf. Sterman 2000). The process of building a model in the group is
the means by which clients can achieve more understanding of their problem situation
(Vennix 1996). More (shared) understanding or insight in the problem is required to
make a decision on policies that will relieve and/or improve the problem situation. This
goal relates to the difficulties that follow from the nature of strategic decisions, in
particular the fact that problems are complex and information is distributed. The
outcome2 at the level of the individual participant is: (more) shared understanding or
insight into the problem, i.e. (more) knowledge on important elements that play a role in
the problematic behavior, causal links between elements in the model, polarities of the
links and of the feedback loops3. Outcomes at the level of the group are: (a) a SD model
that represents the common understanding of the group, and that visualizes the important
elements in the problem situation, the causal links, loops and their polarities. The next
outcome at the group level is: (b) a decision on the problem that relieves or improves the
problem situation.
The second goal of GMB is reaching consensus and commitment on results of the
modeling by facilitating the communication process in the group (Vennix, 1996). Client
involvement is particularly valued when diverse decision-relevant information is used in
the modeling process. Mentioning and discussing unique (uniquely owned by different
participants) decision-relevant information is assumed to result in a better decision
(Stasser and Titus 2003; McCardle-Keurentjes, Rouwette and Vennix 2008). Because of
the differences in views and interests of the group members that hinder mentioning and
discussing unique information at the level of the group, facilitation is crucial. It is the
facilitator who guides the introduction and discussion of different and conflicting views
of the problem. Using a variety of decision inputs has several benefits. First, it is thought
to prevent premature closure of the decision-making process when considering alternative
strategies (Van Knippenberg, De Dreu, and Homan 2004). Second, in this way it is
2 Outcomes of GMB can be distinguished at different level of analysis. Huz, Andersen, Richardson, &
Boothroyd (1997) differentiate between outcomes at the individual level, at the group level, the
organizational and the methodological level. In this study, we focus on the individual and on the group
level. 3 Feedback loops are circular causal chains that are ‘reinforcing’ when an initial effect is accumulating in
the same direction, or ‘balancing’ when an effect is counteracted.

6
ensured that the model represents the problem situation as full as possible. It is expected
that the validity of the model is enhanced, which is of the utmost importance for
decisions that have far-reaching consequences. Third, while the informational items that
are used for constructing the model stem from the participants, it is assumed that a feeling
of ownership of the model is enhanced in the client group. Ownership will lead to more
commitment of participants to using the model in decision-making and in implementation
of decisions.
Facilitation not only is crucial for assuring that the SD model is as complete as
possible, but also is as small as desirable. For example, the facilitator prevents
discussions to go off-track, for instance, due to dominating participants. Facilitation
fosters a climate in which group members feel respected and invited to participate in the
information sharing process. In such a climate, consensus and commitment towards the
implementation of a decision can be created (Vennix, 1996). The outcomes at the level of
the individual participant are a higher degree of: (a) participation, (b) exchange of
different viewpoints, and (c) commitment to results of the modeling. The outcomes at the
level of the group are: (a) mentioning and (b) discussion of unique information to be
integrated into the SD model, and (c) consensus with regard to the results of the
modeling.
In conclusion, we have shed light on the goals of GMB and on the process of how
the expected outcomes are brought about. Modeling and facilitation constitute the main
process elements of the intervention. ‘Process’ refers to creating a climate that is
beneficial for communication between group members who have different interests and
viewpoints on the problem. Unique information and different viewpoints are exchanged.
During this process, the problem is unraveled as far as possible and as necessary in the
eyes of participants, that is, when all elements and relations that are felt to be important
are discussed and included in the model. In this climate, group members feel invited to
participate, so that consensus and commitment with regard to the results of the modeling
emerge. If this process is followed, a clear picture of the problem situation arises.
Participants have more shared insight in the problem situation, which helps them to
decide on policies to improve the situation. The following table proposes the main
process elements of GMB and the expected outcomes at the individual, i.e. subject level,
and the group level described above.
-------------------------------------
Table 1 about here
-------------------------------------
With regard to testing the effectiveness of GMB as a group decision support
system, it seems reasonable to investigate if GMB is producing the results that are
intended4. We should investigate the fit between the assumed benefits of GMB (expected
outcomes) and the degree to which GMB actually creates these benefits.
4 According to The New International Webster’s Dictionary (1995), effective is: causing or capable of
causing a desired or decisive result. Effective refers to ’producing the result that is wanted or intended;
producing a successful result’.

7
4 Competing Values Approach and hypotheses
Most of the outcomes that are reported in descriptive studies (Rouwette, 2003) can be
mapped onto the outcomes that we have mentioned above: mental model refinement (i.e.
more shared understanding), communication quality (satisfaction about participation) and
consensus. These outcomes are considered as a joint function of contextual and GMB
intervention characteristics. Additional outcomes are reported in other studies such as
behavioral and system changes. The latter category of outcomes concerns the follow-up
of decision-making in natural situations and is beyond the focus of this study.
An approach that has been used before to measure the effectiveness of group
decision-making processes and that incorporates the outcomes of our interests, is the
Competing Values Approach developed by Quinn and Rohrbaugh (Quinn, Rohrbaugh,
and McGrath 1985; Quinn and Rohrbaugh 1983). In the present study, we have employed
a questionnaire based on this approach.
Originally, the Competing Values Approach (CVA) was developed to assess
collective performance effectiveness in organizations (Quinn and Rohrbaugh 1983). The
framework is based on four models of organizational analysis: the rational goal model,
open systems model, human relations model and internal process model. The integration
of these models in one framework reflects the competing values and priorities that
organizations commonly face. For instance, internal control (internal process model) may
counteract the demand for flexibility to respond to external opportunities (open systems
model) (Reagan and Rohrbaugh 1990). These competing values and priorities are
reflected in the different interests and views of group members on a strategic problem.
Later, the CVA was extended to be used in specific organizational domains, such
as organizational culture and organizational decision-making (Rohrbaugh 1987; McCartt
and Rohrbaugh 1989). For assessing the effectiveness of decision-making, four
perspectives were identified that correspond to the four models:
- the rational perspective, emphasizing clear thinking and logic reasoning;
- the political perspective, focusing on flexibility and creativity;
- the consensual perspective, emphasizing participation and team building;
- the empirical perspective, emphasizing the importance of evidence.
In the different CVA perspectives, we recognize values that are connected to the
assumed benefits of GMB, for instance:
The rational perspective. Those who focus on goal attainment will appreciate
efficiency and logic in using methods and organizational resources. These decision-
makers value a careful consideration of different viewpoints and/of alternative policies
regarding the problem under discussion. This relates to the expected outcomes of GMB:
exchange of different viewpoints, and shared understanding which is required for making
decisions on policies that that will relieve and/or improve the problem situation
The political perspective. Decision-makers who primary focus on the external
environment will value creativity and adaptation to the external environment. Legitimacy
of the decision is seen as important. Variety, exchange of different viewpoints and unique
ideas are welcomed. This relates to the expected outcomes of GMB: mentioning and
discussion of unique information, and exchange of different viewpoints.
The consensual perspective. Participation and belonging to the group are the main
values. Decision-makers appreciate open expression of individual views. Discussions and

8
debate are valued and emphasis is placed on support for the decision. The decision should
be satisfactory for all group members. This relates to the expected outcomes of GMB:
exchange of different viewpoints, and also to participation, commitment and consensus.
The empirical perspective. The use of facts and evidence is greatly appreciated.
Documentation of the process is valued and there is close attention to explicit analysis.
Accountability for the decision-making process is deemed highly important. In the
context of GMB, this relates to the expected outcomes: shared understanding and the SD
model. The SD model as an outcome is a document in which the problem situation is
structured and visualized, that can function as an instrument for justifying policies.
All four perspectives reflect important considerations for assessing group
decision-making effectiveness. In different situations, emphasis may be placed on
different aspects. In other words, the importance of perspectives may shift depending on
what is needed. For example, in problem situations with conflicting interests, the
consensual and empirical perspectives might be favored. But when the urgency of a
problem is high, there is less time for participation and information search (Rohrbaugh
1987). Nevertheless, it is assumed that for effective decision-making, there should be a
certain balance in the extent that the different perspectives are present in the decision-
making process. Overemphasis of one perspective will draw attention from another
perspective. For example, too much structure can take away flexibility or too much
creativity might diminish goal attainment. Thus, a balance is assumed to be necessary for
decision-making effectiveness (cf. Denison and Spreitzer 1991).
Especially, the CVA framework is an instrument to assess effectiveness of
decision-making situations in which different interests and viewpoints play an important
role. The CVA questionnaire measures the perceptions of decision-makers on the
effectiveness of the decision-making process5 ((McCartt and Rohrbaugh 1989; Reagan
and Rohrbaugh 1990). Using this instrument, we can identify which perspectives and
underlying values are more or less prominent in a decision-making situation, in the eyes
of the participants. We consider this useful to determine effectiveness of a client oriented
decision support methodology such as GMB. Besides that, the fact that there has been
evidence to support the CVA framework (Kalliath, Bluedorn, and Gillespie 1999)
encouraged us to use the CVA for measuring the effectiveness of GMB.
We have planned several experiments that will be conducted. In the present study,
the experimental manipulation is: GMB. This study tests differences with regard to
effectiveness of decision-making between groups that are supported by GMB (GMB
groups) and groups that are not supported. The latter groups are referred to as ‘Meeting as
Usual’ (MU) groups and represent decision-making groups in organizations that come
together to resolve a strategic problem. ‘As usual’ means that they work together in the
way decision-making groups in organizations traditionally do when not assisted by any
decision support, that is: seated together, freely interacting, with a chairperson who
makes contributions to the content of the discussion in addition to leading the group. The
MU groups may use pen and paper, but have no flip-over or whiteboard at their disposal.
5 There is not a straightforward link between the decision-making process (and outcomes) at one side and
its effects during/after implementation on the other. Other factors than the decision-making process and
decision, can improve or deteriorate the effects (cf. Quinn, Rohrbaugh, and McGrath 1985).

9
In subsequent experiments, we intend to test the impact of GMB in more detail by
investigating the contribution of several elements of the methodology to the effectiveness
of group decision-making.
We test if GMB succeeds in creating the expected outcomes by comparing the
differences in perceptions and satisfaction of participants on the decision-making process
and outcomes. Taking into account the characteristics of the context of situations in
which GMB is used and that outcomes of GMB are reflected in the CVA framework, we
express several propositions in terms of differences in scores on CVA perspectives.
Moreover, we test if GMB succeeds in enabling decision-makers to make decisions that
relieve or improve the problem situation by comparing the differences in results between
GMB groups and MU groups. This leads to the following hypotheses:
Hypothesis 1- 4 Subjects of GMB groups will have a stronger (1) rational perspective, (2) political
perspective, (3) consensual perspective, and (4) empirical perspective, than subjects of
MU groups.
We consider the CVA perspectives to be more in balance if the CVA perspectives
altogether are stronger. We refer to the CVA perspectives altogether, in an overall view
on effectiveness, as the effectual perspective.
Hypothesis 5
Subjects of GMB groups will have a stronger effectual perspective than subjects of MU
groups.
Given the integration of the different perspectives in GMB groups, we expect that
participants in GMB groups will be more satisfied on how their meeting is executed and
on outcomes than participants in MU groups. Therefore:
Hypothesis 6 Subjects of GMB groups will be more satisfied on the process and outcomes of their
meeting than subjects of MU groups.
Because GMB groups model their strategic problem, we expect that participants in GMB
groups will better understand what elements play an important role in the problem under
discussion and how these elements interact. This increased understanding should enable
them to make better decisions on what policies will resolve the problem. Therefore, the
results of GMB groups are expected to be better
Hypothesis 7 The results of GMB groups will be better than the results of MU groups.
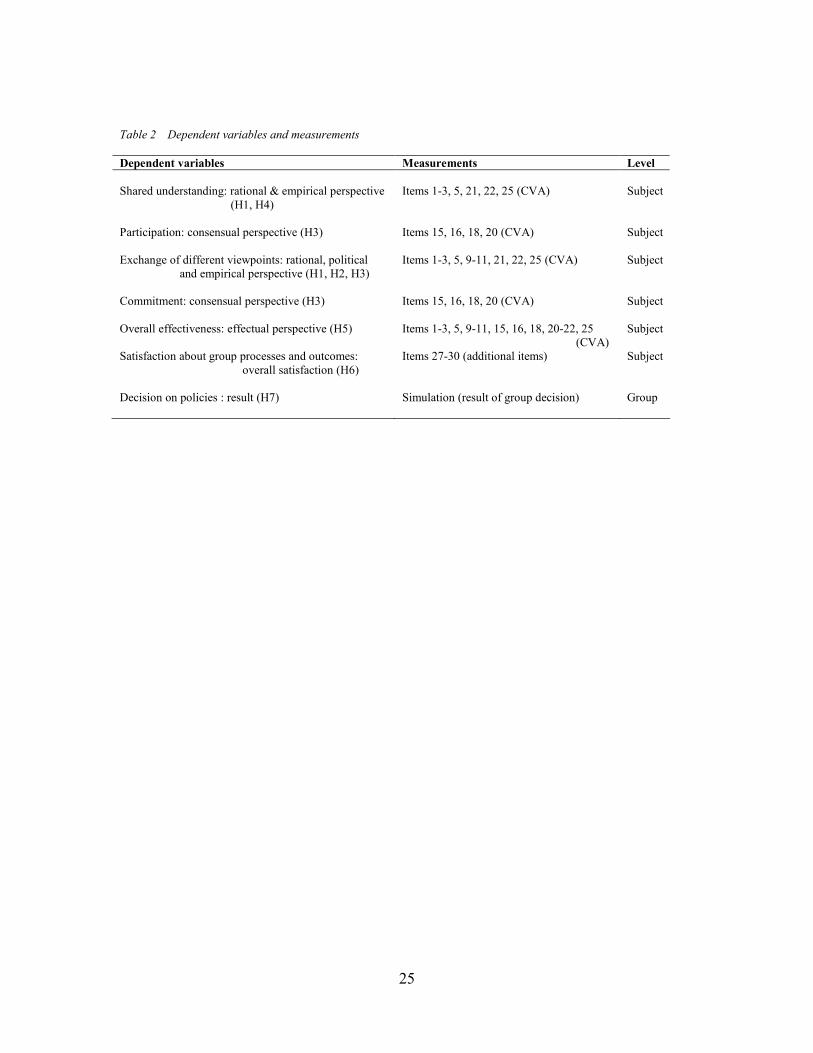
Hypotheses 1-4 and H7 account for testing the following outcomes of GMB that are
mentioned in table 1: shared understanding (H1 and H4), participation (H3), exchange of
different viewpoints (H1, H2 and H3) commitment (H3), and decision on policies (H7).
H5 and H6 account for overall outcomes of GMB (effectiveness and satisfaction).

10
Four outcomes of GMB at the group level, also mentioned in table 1, have been measured
but are not analyzed yet. This concerns the SD model, mentioning and discussion of
unique information and finally, consensus. Therefore, we do not report on these outcomes
in the following.
5 Methods
Participants and facilitators
A total of 135 students (undergraduates enrolled in a course on intervention
methodology, bachelor Business Studies, 3rd year) of Radboud University Nijmegen
participated in the experiment as part of their teaching program. Participants subscribed
in groups of three persons to the lecture that was presented to them as an exercise in
group decision-making. The lectures were planned over two days, in the time that was
convenient for the participants. Subsequently, they were assigned randomly to one of the
timeslots that they had subscribed to. Two groups of three were then combined and
assigned to either the GMB (n = 13 groups) or MU (n = 13 groups) condition.
In the GMB groups, a facilitator was present to guide the meeting process and five
students acted as the participants in the meeting. In the MU groups, one of five students
present acted as a chairperson, combining the role of a group member (by contributing to
the discussion process) and group leader.
Decision task
For the decision task, the case of the Saturday Evening Post, a former magazine in the
United States, was used (Hall, 1984). Two main considerations led to this choice. First,
the case represents a real-life strategic decision-making problem. In this case, changing
the situation for the better required a counterintuitive policy. Second, we estimated that
the case was feasible to explore and to decide on in a one-hour meeting. With only one
major feedback loop, this case seemed to fulfill the requirement of sufficient, but
‘limited’ complexity. We derived the latter requirement from a pilot experiment that we
had done before (McCardle-Keurentjes, Rouwette, and Vennix 2008). While the meeting
was planned for one hour, we estimated a problem situation that would contain several
feedback loops to be too demanding for decision-making.
Falling profits was the problem variable for each group. In their role as the
management team of the magazine, the decision-making groups were instructed to clarify
the problem of falling profits and to decide what to do to tackle the problem. There were
five managers in the management team belonging to different departments: circulation,
publisher, editor, production, president & board. All participants received a description of
the problem situation, including information regarding costs, revenues and results of the
previous years. In the development of the task, we followed the reconstruction that Hall
(1984) has made of the maps of causality used by the various departments in the
organization to structure their decisions. We distributed these maps in textual form
containing important elements of the problem situation and relations between these
elements, amongst the participants in accordance with their position. Thus, each manager
of the five departments received information that was particular for his/her position such
as goals of the department and considerations for choosing a policy.

11
All managers were instructed to promote the interests of their own department as
far as possible, but that the main goal was to analyze the situation and identify
appropriate policy actions, together as a management team. In the case description, three
potential options were given but other options were expected to be considered too.
Procedure
Upon arrival in the meeting room, participants were assigned randomly to one of the five
departments of the Saturday Evening Post. In case a sixth person was present, h/she
observed the decision-making process6. In the MU groups, a researcher in the role of
coach directed the procedure while one of the group members acted as a chairperson for
the duration of the actual meeting (h/she who was assigned to the role of president). In
the GMB groups, the facilitator led the group through the procedure and guided the
modeling process. It was the job of the coaches/facilitators to hand out reading material
and questionnaires to the participants and to keep track of time.
After they had read the case description, participants were asked to record their
individual decision7 (preference) on a form. Thereafter, the meeting started. The MU
groups were free in choosing how to organize their meeting. In the other condition, the
facilitator explained the GMB method in the first minutes. As a help for that purpose, the
main GMB steps were visualized on a flip-over at the wall at that time. A flip-over and
whiteboard were available, but no recorder. The facilitator was instructed to facilitate on
basis of his/her experience, to employ not more than two rounds of the Nominal Group
Technique for listing the most important variables and finally, to discuss a feedback loop
with the group as soon as a feedback loop would appear.
As indicated above, all groups had one hour for the decision-making discussion.
After fifty minutes, the groups were informed that ten minutes were left and they were
requested to record their group decision. First, a form with open questions was to be
filled out8. Then, the group was told that a structured questionnaire on the group decision
result should be filled out as well. After that, all participants were requested to
individually complete a questionnaire on their (post-discussion) decisions and their
opinions about the meeting. Upon completion of these questionnaires, the
coach/facilitator thanked the participants for their participation. The participants were
asked not to discuss the experiment with any potential future participant until the next
lecture of the course in which the experiment would be explained further.
Measures
The dependent variables that were included in the analyses are: rational perspective,
political perspective, consensual perspective, empirical perspective, effectual perspective,
overall satisfaction and the outcomes as a consequence of the decision of the group,
called result. The independent variables that were included are: being part of a decision-
making group that is supported or not supported (MU/GMB), the experience of the
6 Observers were not considered as participants. As the experiment was part of the course program and it
happens that a student is absent, we planned six students a meeting per group of five participants. In total,
there were 18 observers. Their observations were used in the lecture after the experiment in which we
discussed the research. 7,8 As indicated before, results of these measurements will not be reported here.

12
facilitator, the gender of the participant, the gender of the leader of the group, the gender
composition of the group and the position of the participants within the group. In table
two, the measurement of the dependent variables are summarized.
-------------------------------------
Table 2 about here
------------------------------------- With regard to the perceptions of participants on the process and outcomes of the
meeting, in the post-discussion questionnaire we presented the original CVA items
(Reagan and Rohrbaugh 1990) in a randomized order. The original questionnaire is given
in Appendix 1. The CVA items could be answered on a scale ranging from 1 (strongly
disagree) to 6 (totally agree). Principal factor analysis and reliability analysis on each
dimension separately were executed to determine the assumed dimensions of the CVA
framework9. From the seven items referring to a rational perspective, four make up one
dimension that can be regarded as satisfactorily internal consistent (Cronbach's α = .63)
(items 1 to 3 and 5, see Appendix 1). From the seven items referring to a political
perspective, three make up one dimension that can be regarded as satisfactorily internal
consistent (Cronbach's α = .55) (items 9 to 11, see Appendix 1). From the six items
referring to a consensual perspective, four make up one dimension that can be regarded
as satisfactorily internal consistent (Cronbach's α = .68) (items 15, 16, 18 and 20, see
Appendix 1). From the six items referring to an empirical perspective, three make up one
dimension that can be regarded as satisfactorily internal consistent (Cronbach's α = .55)
(items 21, 22 and 25, see Appendix 1). Finally, we have executed a second order factor
analysis on the four separate perspectives to examine whether it contains one dimension
referring to an overall perspective on effectiveness that could capture the CVA
perspectives altogether. It resulted in one dimension that is satisfactorily internal
consistent (Cronbach's α = .55). As indicated earlier, this dimension is called effectual
perspective.
In addition to the CVA items, we included four items10 in which the subjects were
asked to rate the degree their discussion was: (a) was competently executed, (b) its
overall quality was good (c) on the whole, was ineffective (reversed coded) and (d) its
outcome is satisfactory (see Appendix 2). Through principal factor analysis and reliability
analysis, we examined whether there is one dimension apparent referring to the overall
satisfaction of the participants about the process and outcomes of the meeting. The four
items referring to the overall satisfaction make up one dimension that can be regarded as
satisfactorily internal consistent (Cronbach's α = .73)
Finally, we made a variable in which the outcomes as a financial consequence of
the decision of the group were determined. For the purpose of measuring these
consequences of group decisions, we provided five policy variables in a structured
questionnaire. With regard to each of these five variables, the group was asked to indicate
whether they had decided to select it (yes or no) and if yes, how they were going to use
this variable: increase, decrease or keep constant. If the group had decided to use another
9 Technical criteria used for factor analysis are available from the authors.
10 The four items were part of a version of a CVA questionnaire that was adapted by colleague-researchers.
We did not use this adapted version, because we could not fully retrace why and how the adaptations were
made.

13
variable than mentioned on the form, they could indicate this variable as well as the
direction in which it would be changed. The financial consequences were analyzed by
determining the performance of each decision with a simulation model. Therefore, we
used the model of the Saturday Evening Post that Hall has built and tested on the basis of
an empirical study (Hall 1976). The variables to change (mentioned on the structured
questionnaire) correspond to variables in the model of Hall. In line with the experiments
of Hall, we have used a 20% change in the policy variables, meaning that an increase or
decrease in a variable is implemented by a 20% change in the corresponding model
variable.
This last dependent variable, in which the outcomes as a consequence of the decision of
the group were determined, is a group variable, and therefore also treated that way in
further analyses.
The main independent variable is the manipulation of the experiment referring to
whether the subjects participated in a decision-making group supported by GMB or in an
unsupported group (MU). The other independent variable related to the GMB context is
whether the leader of the group has previous experience as a facilitator of GMB groups.
This was determined by expert judgment. As a result, the leaders of the MU groups, i.e.
the chairpersons, were considered to have no experience, three facilitators of the GMB
groups were considered to have low experience and two other facilitators were
considered to have medium experience. Also, the gender of all subjects and of the leader
of all groups was coded. For all groups was the composition of gender determined. As a
result, two categories were distinguished: all participants of a group have the same
gender, or the composition is mixed. Finally, the position of the participants was added to
the analyses as a separate variable. Therefore, we coded the roles that were assigned to
the participants as has been described above.
6 Results
We have conducted analyses of variance to test our hypotheses and see whether the
independent variables have an effect on the perspectives, overall satisfaction and result.
One of the assumptions of analysis of variance is that error terms are normally
distributed. We have checked this assumption by examining the distributions and
normally probability plots of the interval variables, by executing Shapiro Wilk tests and
checking whether there is heteroscedasticy apparent when conducting regression analysis.
All these tests have resulted in that all of the dependent variables, except for result, have
been transformed into variables that are more normally distributed. As a consequence, we
have lost the original scale, but still the higher the score on each variable, the more a
participant supports this perspective or is more satisfied. Finally, all models meet the
requirement that the variances between the groups are equal.11
We have conducted two series of analyses of variance. First, we have analyzed
the models in which the bivariate relations between MU/GMB and experience of
facilitator on the one hand and all the dependent variables on the other hand, were tested.
Second, we have analyzed the models in which all the other independent variables were
added as well as the interactions of these with MU/GMB and experience. The unit of
analysis for all models was the individual participant, expect for the models in which
11 This was tested by Levene's test of homogenity.

14
result is the dependent variable. In the latter case, the unit of analysis was the group and
only the independent variables measured at group level were included. Finally, when it
comes to the main effects of MU/GMB and experience of facilitator, we executed one-
sided tests; all other tests were two-sided tests.
Main findings
In table 3, we present the results for the analyses in which the bivariate relations
between MU/GMB and the dependent variables is tested. As can be seen, no differences
in perspectives between MU and GMB are significant.
-------------------------------------
Table 3 about here
-------------------------------------
In table 4, we present the results for the analyses of the bivariate relations
between the experience of the facilitator and the dependent variables. Three effects were
significant in the expected direction. As can be seen, the subjects of groups with a
medium-experienced facilitator have a more rational perspective, a more consensual
perspective and are overall more satisfied than the subjects of groups with a low-
experienced facilitator. For all other perspectives and for result, the differences between
experiences of the facilitator are not significant.
-------------------------------------
Table 4 about here
-------------------------------------
In table 5, we present the results for the analyses of the relations between the
perspectives, the overall satisfaction and result on the one hand and MU/GMB, the other
independent variables and the interactions between them on the other hand. As can be
seen, no differences in perspectives between MU and GMB are significant in the
expected direction. This also counts for the overall satisfaction and for result. However,
some other effects appear to be significant. The subjects of the groups with only males or
females appear to have a lower political perspective than those of the groups in which
both genders are represented. Regarding the empirical, consensual and effectual
perspective, this difference appears to be the other way around: the subjects of the groups
with only males or females appear to have higher scores on these perspectives than those
in the mixed groups. For two dependent variables, the effect of the interaction of
MU/GMB and the gender of the leader of the group is significant. With respect to the
consensual perspective, there is no difference between MU and GMB subjects with
female leaders, while subjects of MU groups with a male chairperson show a higher
consensual perspective than subjects of the GMB groups having a male facilitator.
Regarding the overall satisfaction, subjects of MU groups with a chairwoman show a
lower satisfaction than GMB subjects with a female facilitator while for the subjects with
a male leader, this difference appears to be the other way around.

15
-------------------------------------
Table 5 about here
-------------------------------------
In table 6, we present the results for the analyses of the relations between the
perspectives, the overall satisfaction and result on the one hand and the experience of the
facilitator, the other independent variables and the interactions between them on the other
hand. As can be seen, in four models the differences in the experience of the facilitator
are significant. The subjects of the groups with a low-experienced facilitator have a lower
political, consensual and effectual perspective and are less satisfied than the subjects of
groups with a medium-experienced facilitator.
For the other main effects, we have found the following results. Male subjects
have a lower empirical perspective and are less satisfied than female subjects. The
subjects of the groups with only males or females appear to have a lower political
perspective than those of the groups in which both gender are represented. Regarding the
empirical, consensual and effectual perspective and the overall satisfaction, this
difference appears to be the other way around: the subjects of the groups with only males
or females appear to have higher scores than those of the mixed groups. When it comes to
the gender of the leader of the group, it appears that subjects of groups with a male leader
have a higher empirical and effectual perspective and are more satisfied than subjects of
groups with a female leader.
-------------------------------------
Table 6 about here
-------------------------------------
Regarding the empirical perspective and overall satisfaction, the interactions between the
experience of the facilitator, and the gender of the subjects and the gender of the leader of
the group appear to be significant. For females, there is no difference in empirical
perspective between subjects of groups with a leader with none, low or medium
experience. For males however, those of groups with an un-experienced leader have a
higher empirical perspective and are more satisfied than subjects of groups with a low-
experienced leader, while the subjects from the latter groups have a lower empirical
perspective and are less satisfied than the subjects of groups with a medium-experienced
leader. For subjects of groups with a male leader, there is no difference in empirical
perspective or overall satisfaction between those of groups with an un-experienced, low
or medium-experienced leader. However, for subjects of groups with a female leader,
those with an un-experienced leader have a higher empirical perspective and are more
satisfied than those of groups with a low-experienced leader. Additionally, subjects of
groups with a low-experienced, female leader have a less empirical perspective and are
less satisfied than subjects of groups with a medium-experienced, female leader12.
12 Although it has to be noticed that the scores on the CVA perspectives are measured on the level of
individual participants, these results certainly have to be considered with care. There was one female GMB
facilitator in the medium experience category and also one female GMB facilitator in the low experience
category.

16
Finally, subjects of groups with an un-experienced, female leader are less satisfied than
those of groups with a medium-experienced, female leader.
These results have the following consequences for our hypotheses as summarized
in table 7.
-------------------------------------
Table 7 about here
-------------------------------------
7 Discussion
Bearing in mind that not all expected outcomes of GMB have been tested yet, the current
findings seem to indicate that GMB does not accomplish the benefits that are expected.
Our findings did not support the hypotheses that the participants in GMB groups score
higher on the CVA perspectives. Compared to the participants in MU groups, the
participants in GMB groups did not gain more shared understanding. GMB group
participants did not differ from MU group participants in the degree in which different
viewpoints were exchanged in the meetings. Neither was the degree of participation
perceived to be higher, nor was there more commitment in the eyes of GMB participants.
A certain balance in the presence of CVA perspectives in a meeting is considered as
necessary for decision-making effectiveness (cf. Denison and Spreitzer 1991). However,
no more balance was found in GMB groups than in the control groups. Also, the overall
satisfaction of GMB group participants on process and outcomes of their meeting did not
differ from the participants in the control groups. Finally, also the decisions made by
GMB groups were not better than the decisions made by MU groups.
Taken together, the results indicate that there are no winners (cf. Dwyer and Stave
2008) and our results might seem disappointing. But simultaneously, they are intriguing.
We are indeed forced to think. Several explanations for the lack of significant differences
in the main effects between GMB groups and MU groups come to mind. Our
considerations relate to theoretical assumptions as well as to the way in which we have
designed the study.
For example, hypothesis 7 states that GMB groups make better decisions than
MU groups. This expectation is founded on the assumption that the shared action of
building a model in a group enhances the understanding of the problem situation by
decision-makers. Recognition of important elements in the problem situation, relations
between elements and their polarities are supposed to lead to more understanding. This
should enable decision-makers to choose policies that will resolve the problem. In these
assumptions, several steps are made that can be considered in more detail, for instance
the step between recognition of the structure and increased understanding and the step
between understanding and choosing the policies that resolve or improve the problem. If
participants have discovered the structure of the problem situation and feel that they have
gained understanding in the problem situation, does that really enable them to make a
better decision? Warren (2008) explains how difficult it is to determine policies when one
or more accumulating variables exist between two elements in a causal chain, even if the
chain is clear. In the decision task of this study, discovery of the major feedback loop was
supposed to lead participants to the policy that should be followed to resolve the problem.

17
But, even one feedback loop might be too demanding given our limited human, cognitive
capabilities. This point relates closely to discussions in the SD field on strengths and
weaknesses of quantitative vs. qualitative modeling and differences between diagrams
(Coyle 2000; Lane 2008). On the other hand, the fact that the case contains only one
major feedback loop might as well also explain the finding that GMB groups did not
differ from MU groups. Perhaps it was exactly the lack of cognitive load within the case,
which made it impossible for GMB to make a difference.
Another point to consider arises from decisions that we have made with regard to
the methods in this study. One point concerns the fact that we allowed for subscription in
subgroups of three. From those groups, participants were randomly assigned to the GMB
or the MU group. In hindsight, we realized that the participants in the subgroups might
have been friends. While communication might differ when knowing the other persons in
the group, this procedure might have influenced the results, for instance with regard to
participation (Bonito et al. 2006).
A further point of attention has to do with the time period that was planned for the
meetings. In one hour, all groups had to make a decision on the strategic problem. For
MU groups who could follow their usual way in the discussion, one hour for fulfilling the
task might be less demanding than for GMB groups. Participants in GMB groups had to
follow a methodology with a clear structure, moreover, a structure that was new to them.
Besides that, participants in a GMB group might experience a different type of climate in
comparison to what participants in a MU group may experience. In GMB groups,
participants are working in an atmosphere in which input of each member is valued and if
necessary, questioned. In one hour, the contours of the model are becoming clearer and
the problem is (more or less) structured, but little or no time might be left for analyzing
the system and for thinking on options to improve the situation. For participants in MU
groups, this might be quite the opposite; they might be focused on assessing and
evaluating the alternative options from the beginning of the meeting. This point relates to
different phases and activities in the decision-making process that we have not explicitly
addressed in this study. So far, the findings of this study indicate that participants in
GMB do not score higher on the CVA perspectives than participants in MU groups, but
how ‘right’ is our comparison? Content analyses of the videotapes of the meeting will
shed more light on these concerns and will reveal further outcome characteristics of
decision-making effectiveness at the group level. Moreover, the SD models that are built
in GMB groups will be analyzed to test for differences in variables, relations and
polarities that are identified.
We should note that the current study has also brought some other interesting
findings. First of all, the experience of the facilitator emerges as an important variable.
When testing the effect of the experience of the facilitator on the rational and the
consensual perspective, it was revealed that the experience of the facilitator matters:
participants in GMB groups with facilitators who have medium experience in facilitating
scored higher on the rational and consensual perspective than participants in GMB groups
who were facilitated by someone with low experience. Participants who are facilitated by
a medium experience facilitator appeared also to be more satisfied (overall satisfaction)
than the participants who received decision support of a facilitator with low experience.
These findings are in line with the importance of facilitation that is suggested in empirical
research (Vennix et al. 1993). While testing for experience of the facilitator, no

18
differences were found in the political and empirical perspectives. This might be
explained by other characteristics of GMB, such as the novel way of working and the
model that documents the facts that are discussed, that seem to be more at work than
facilitation in these perspectives. As may be clear, the experience of the facilitator was
not one of the variables that we purposefully planned to investigate. In fact, it was a
consequence of the necessity to have an adequate number of GMB facilitators available
at the time of the experiment. At that time, we realized that we would have to control for
experience of the facilitator.
A second serendipitous discovery is the relevance of controlling for gender
factors. One of the coaches of MU groups reported some observations in terms of the
girls’ group, boys’ group and the four boys-one girl’s group. We revealed several
differences in perceptions of participants that are related to gender variables:
- gender of the participant, for instance when testing the effect of experience of the
facilitator, the overall satisfaction of males differed between the GMB groups;
- gender of the leader of the group (facilitators and chairpersons), for instance,
when testing the effect of the experience of the facilitator, the overall satisfaction
of females differed between groups;
- gender diversity in the group, for instance when testing the effect of GMB, same-
sex groups scored higher on the consensual, the empirical and the effectual
perspective.
Gender differences may influence communication in groups and may be explained in
several ways such as biological, sex-role socialization and status differences (Davies
1994). One impression of the coach, who we mentioned above, was that in the four boys-
one girl’s group, seemingly, the boys wanted to impress the girl by making jokes.
Recently, it was demonstrated that mixed-sex interactions may temporarily impair
cognitive functioning of males (Karremans, Verwijmeren, Pronk and Reitsma 2009).
Although we have not addressed the mechanisms at work, gender variables seem relevant
to incorporate in future research on effectiveness of GMB.
In conclusion, not all expected outcomes of GMB have been examined yet and
content analyses still remain to be done for further exploration of what happened in the
meetings and to find explanations for results. With these limitations in mind and given
the counterintuitive finding that GMB does not accomplish all benefits that were
expected, the present work raises interesting questions and themes for future research. In
particular, the experience of the facilitator appears to make a difference. If GMB is used
as a decision support methodology, the experience of the person who facilitates seems to
matter. This study also points to the importance of investigating gender factors in future
studies. It will still take a while before the question can be answered if GMB is
worthwhile.
References
Andersen, D. F., G. P. Richardson, and J. A. M. Vennix. 1997. Group model building:
Adding more science to the craft. System Dynamics Review 13 (2):187-201.
Babbie, E. 2001. The practice of social research. 9 ed. Belmont: Wadsworth/Thomson
Learning.

19
Bonito, J. A., M.H. DeCamp, M. Coffman, and S. Fleming. 2006. Participation,
information, and control in small groups: An actor-partner interdependence
model. Group dynamics:Theory, research and practice 10 (1):16-28.
Coyle, G. 2000. Qualitative and quantitative modelling in system dynamics: Some
research questions. System Dynamics Review 16 (3):225-244.
Davies, F.M. 1994. Personality and social characteristics. In Small group research: A
handbook, edited by A. P. Hare, H. H. Blumberg, M. F. Davies and M. V. Kent.
Norwood: Ablex publishing corporation.
Denison, D.R., and G.M. Spreitzer. 1991. Organizational culture and organizational
development: A competing values approach. Research in organizational change
and development 5:1-21.
Dwyer, M., and K. Stave. 2008. Group Model Building wins: The results of a
comparative analysis. Paper read at The 26th international conference of the
System Dynamics Society, at Athens, Greece.
Finlay, P. N. 1998. On evaluating the performance of GSS: Furthering the debate.
European Journal of Operational Research 107 (1):193-201.
Forrester, J. W. 1961. Industrial dynamics. Cambridge, MA New York: M.I.T. Press;
Wiley.
Hall, R. I. 1976. A system pathology of an organization: The rise and fall of the old
Saturday Evening Post. Administrative Science Quarterly 21 (2):185-211.
———. 1984. The natural logic of management policy making: Its implications for the
survival of an organization. Management Science 30 (8):905-927.
Huz, S., D.F. Anderson, G.P. Richardson, and R. Boothroyd. 1997. A framework for
evaluating systems thinking interventions: An experimental approach to mental
system change. System Dynamics Review 13 (2):149-169.
Kalliath, T. J., A. C. Bluedorn, and D. F. Gillespie. 1999. A confirmatory factor analysis
of the competing values instrument. Educational and Psychological Measurement
59 (1):143-158.
Karremans, J.C., T. Verwijmeren, T. M. Pronk, and M. Reitsma. 2009. Interacting with
women can impair men's cognitive functioning. Journal of experimental social
psychology, In press, Accepted manuscript, doi: 10.1016/j.jesp.2009.05.004.
Lane, D.C. 2008. The emergence and use of diagramming in system dynamics: A critical
account. Systems Research and Behavioral Science 25:3-23.

20
McCardle-Keurentjes, M., A.J.A. Rouwette, and J. A. M. Vennix. 2008. Effectiveness of
Group Model Building in discovering hidden profiels in strategic decision-
making. Proceedings of the 26th International Conference of the System
Dynamics Society, at Athens, Greece.
McCartt, A. T., and J. Rohrbaugh. 1989. Evaluating group decision support system
effectiveness: A performance study of decision conferencing. Decision Support
Systems 5:243-253.
McGrath, J.E. 1982. Dilemmatics: The study of research choices and dilemmas. In
Judgment calls in research 2, edited by J. E. McGrath, J. Martin and R. A. Kulka.
Beverly Hills: Sage Publications.
Meso, P., M.D. Troutt, and J. Rudnicka. 2002. A review of naturalistic decision making
research with some implications for knowledge management. Journal of
Knowledge Management 6 (1):63-73.
Morton, A., F. Ackermann, and V. Belton. 2003. Technology-driven and model-driven
approaches to group decision support: focus, research philosophy, and key
concepts. European Journal of Information Systems 12 (2):110-126.
Quinn, R. E., and John Rohrbaugh. 1983. A Spatial Model of Effectiveness Criteria:
Towards a Competing Values Approach to Organizational Analysis. Management
Science 29 (3):363-377.
Quinn, R. E., J. Rohrbaugh, and M. R. McGrath. 1985. Automated decision conferencing:
How it works. Personnel 62 (6):49-55.
Reagan, P., and J. Rohrbaugh. 1990. Group decision process effectiveness. Group &
Organizational Studies 15 (1):20-43.
Rohrbaugh, J. 1987. Assessing the effectiveness of expert teams. In Expert judgment and
expert systems, edited by J. L. Mumpower, L. D. Phillips, O. Renn and V. R. R.
Uppuluri. Berlin Heidelberg: Springer-Verlag.
Rouwette, E. A. J. A. 2003. Group model building as mutual persuasion. PhD
dissertation, Radboud University Nijmegen. Nijmegen: Wolf Legal Publishers.
Rouwette, E. A. J. A., and J. A. M. Vennix. 2006. System dynamics and organizational
interventions. Systems Research and Behavioral Science 23 (4):451-466.
Rouwette, E. A. J. A., J. A. M. Vennix, and T. van Mullekom. 2002. Group model
building effectiveness: a review of assessment studies. System Dynamics Review
18 (1):5-45.
Stasser, G., and W. Titus. 2003. Hidden profiles: A brief history. Psychological Inquiry
14 (3-4):304-313.

21
Sterman, J. D. 2000. Business dynamics: Systems thinking and modeling for a complex
world. Boston: The McGraw-Hill Companies.
Van Knippenberg, D., C.K.W. De Dreu, and A. C. Homan. 2004. Work group diversity
and group performance: An integrative model and research agenda. Journal of
Applied Psychology 89 (6):1008-1022.
Vennix, J. A. M. 1995. Building Consensus in Strategic Decision-Making - System
Dynamics as a Group Support System. Group Decision and Negotiation 4
(4):335-355.
———. 1996. Group model building: Facilitating team learning using system dynamics.
New York: John Wiley & Sons.
Vennix, J. A. M., W. Scheper, and R. Willems. 1993. Group model-building: What does
the cliënt think of it? Proceesings of the 21th International Systems Dynamics
Conference, at Cancun, Mexico.
Warren, K. 2008. Strategic Management Dynamics. West Sussex: John Wiley & Sons.
Zagonel, A.A. 2004. Reflecting on group model building used to support welfare reform
in the state New York. PhD Dissertation, Albany, University at Albany, State
University of New York.

22
Appendix 1. The CVA questionnaire (Reagan and Rohrbaugh, 1990, pp. 40-41)
Rational Perspective Note, the items marked with an ® were reverse coded
Goal-centered process
1. All the potential effects of all the alternatives were carefully weighed.
2. Some of the key issues necessary to produce a useful solution were not fully considered. ®
3. The process was unable to capitalize on the wisdom and experiences of the group. ®
4. The process made us specifically relate our discussions to statements of the group’s values.
Efficiency of decision
5. Important organizational resources were wasted in the process of making a decision. ®
6. Results were archived in much less time than it ordinarily would have taken.
7. It was a productive process involving a lot of hard but worthwhile work.
Political Perspective
Adaptable process
8. The process was very flexible in dealing with the problem.
9. Certain preconceived ideas blocked more creative thinking. ®
10. The process stimulated innovative ways of looking at the problem.
11. The process was too structured. ®
Legitimacy of decision
12. An effort was made to find a solution that would not in any way damage the standing of our work
unit.13
13. Because the process seemed to be so fair, any result would have the appearance of greater
legitimacy.
14. An effort was made to find a solution that would not in any way damage how others perceived the
group.
Consensual perspective
Participatory process
15. Group members were encouraged to raise questions and express personal concerns even when
divergent.
16. We went to great lengths to understand the interests and concerns of every member of the group.
17. Conflict was dealt with constructively.
Supportability of decision
18. During the process the group achieved a common understanding of the problem.
19. Because of serious reservations about proposed courses of action, it was impossible to get a full
consensus. ®
20. At the end of the process, the group displayed high morale and a strong “team spirit”.
Empirical perspective
Data-based process
21. The process led us toward a decision that could be backed up by the facts.
22. The process was based too much on subjective judgments rather than on factual considerations. ®
23. All information relevant to the decision was available to the group.
Accountability of decision
24. A record was made to document the resolution of all key issues.
25. As a result of the process, the group was well prepared to be fully accountable for its deliberations.
26. The process recognized the need for the group to be answerable for its actions.
.
13 Instead of ‘work unit’ we used the term ‘firm’ in our questionnaire.

23
Appendix 2. Additional items
27. The group’s discussion was competently executed.
28. The overall quality of the group’s discussion was good.
29. The group’s discussion, on the whole, was ineffective. ®
30. The outcome of the group’s discussion is satisfactory.
Note, the item marked with an ® was reverse coded.

24
Table 1 Process elements and expected outcomes of GMB at the individual (subject) and group level
Expected outcomes
Process Subject level Group level
SD model Modeling Shared understanding
Decision on policies
Facilitation Participation Mentioning unique information Exchange of different viewpoints Discussion of unique information
Commitment Consensus
25
Table 2 Dependent variables and measurements
Dependent variables Measurements Level
Shared understanding: rational & empirical perspective
(H1, H4)
Participation: consensual perspective (H3)
Exchange of different viewpoints: rational, political
and empirical perspective (H1, H2, H3)
Commitment: consensual perspective (H3)
Overall effectiveness: effectual perspective (H5)
Satisfaction about group processes and outcomes:
overall satisfaction (H6)
Decision on policies : result (H7)
Items 1-3, 5, 21, 22, 25 (CVA)
Items 15, 16, 18, 20 (CVA)
Items 1-3, 5, 9-11, 21, 22, 25 (CVA)
Items 15, 16, 18, 20 (CVA)
Items 1-3, 5, 9-11, 15, 16, 18, 20-22, 25
(CVA)
Items 27-30 (additional items)
Simulation (result of group decision)
Subject
Subject
Subject
Subject
Subject
Subject
Group

26
Table 3. Results of ANOVAs testing the effect of GMB on the perspectives, overall satisfaction and
result (one-sided tests)
Variable Category M SD F a η2
rational perspective:
manip mu
gmb
3.80
3.75
0.70
0.78
0.13 .00
political perspective:
manip mu
gmb
1.70
1.67
0.23
0.23
0.75 .00
empirical perspective:
manip mu
gmb
17.40
17.24
5.65
5.93
0.02 .00
consensual perspective:
manip mu
gmb
20.51
18.08
5.94
5.62
5.75 .04
effectual perspective:
manip mu
gmb
4.02
3.96
0.56
0.56
0.33 .00
overall satisfaction:
manip mu
gmb
20.89
20.66
5.70
6.05
0.04 .00
result:
manip mu
gmb
-527.41
-523.23
236.04
156.95
0.00 .00
* p < .05, ** p< .01
a) for the dependent variables the unit of analysis is the subject (n = 130; df = (1,128)), except for
result the unit of analysis is the group (n = 26; df = (1,24))

27
Table 4 Results of ANOVAs testing the effect of experience of the facilitator on the perspectives, overall satisfaction
and result (one-sided tests)
Variable Category M SD F (df )a η2 Post-hoc
rational perspective:
experience none
low
medium
3.80
3.46
3.94
0.70
0.66
0.80
3.44 * .05 low < medium
political perspective:
experience none
low
medium
1.70
1.72
1.63
0.23
0.18
0.25
1.51 .02
empirical perspective:
experience none
low
medium
17.40
16.66
17.60
5.65
5.44
6.26
0.21 .00
consensual perspective:
experience none
low
medium
20.51
15.79
19.51
5.94
4.98
5.58
6.33** .09 low < medium
effectual perspective:
experience none
low
medium
4.02
3.76
4.09
0.56
0.44
0.59
2.79 .04
overall satisfaction:
experience none
low
medium
20.89
18.40
22.07
5.70
5.26
6.14
3.14* .04 low < medium
result:
experience none
low
medium
-527.41
-517.69
-526.69
236.04
121.16
183.86
0.00 .00
* p < .05, ** p< .01
a) for the dependent variables the unit of analysis is the subject (n = 130; df = (2,127)), except for result the unit of
analysis is the group (n = 26; df = (2,24))

28
Table 5. Results of ANOVAs testing the effect of GMB on the perspectives, overall satisfaction and result (two-sided
tests, except manip = one-sided tests)
Variable F a b η2 Post-hoc
rational perspective:
manip
gender
gender_diff
gender_lead
position
manip x gender
manip x gender_diff
manip x gender_lead
manip x position
0.60
0.40
0.04
0.19
1.16
0.10
2.20
0.03
1.10
.00
.00
.00
.00
.03
.00
.01
.00
.03
political perspective:
manip
gender
gender_diff
gender_lead
position
manip x gender
manip x gender_diff
manip x gender_lead
manip x position
0.00
0.52
3.80*
0.00
1.14
0.72
0.09
0.92
2.35
.00
.00
.03
.00
.03
.00
.00
.00
.07
same < mixed
empirical perspective:
manip
gender
gender_diff
gender_lead
position
manip x gender
manip x gender_diff
manip x gender_lead
manip x position
0.93
0.19
4.82*
0.95
1.21
0.33
1.02
0.00
0.23
.00
.00
.04
.00
.04
.00
.00
.00
.00
same > mixed
consensual perspective:
manip
gender
gender_diff
gender_lead
position
manip x gender
manip x gender_diff
manip x gender_lead
manip x position
6.90
0.52
5.40*
0.66
2.95
0.15
1.61
6.22*
0.51
.05
.00
.04
.00
.09
.00
.01
.05
.01
same > mixed
female: mu = gmb; male: mu > gmb
effectual perspective:
manip
gender
gender_diff
gender_lead
position
manip x gender
manip x gender_diff
manip x gender_lead
manip x position
1.65
0.06
4.76*
0.12
2.09
0.27
1.68
0.40
1.00
.01
.00
.04
.00
.06
.00
.01
.00
.03
same > mixed

29
overall satisfaction:
manip
gender
gender_diff
gender_lead
position
manip x gender
manip x gender_diff
manip x gender_lead
manip x position
0.00
0.23
1.38
0.26
0.33
0.00
0.79
10.25**
0.19
.00
.00
.00
.00
.03
.00
.01
.00
.03
male: mu > gmb; female: mu < gmb
result:
manip
gender_diff
gender_lead
manip x gender_diff
manip x gender_lead
0.00
0.01
0.58
0.08
0.03
.00
.04
.02
.00
.00
* p < .05, ** p< .01
a) for the dependent variables the unit of analysis is the subject (n = 130; df = (1,114)), except for result the unit of
analysis is the group (n = 26; df = (1,20))
b) for the independent variables position and manip x position df = (4, 114)

30
Table 6. Results of ANOVAs testing the effect of experience of the facilitator on the perspectives, overall satisfaction
and result (two-sided tests, except experience = one-sided tests)
Variable F a b c d e η2 Post-hoc
rational perspective:
experience
gender
gender_diff
gender_lead
position
experience x gender
experience x gender_diff
experience x gender_lead
experience x position
1.87
0.06
0.84
0.34
0.78
0.86
0.05
0.22
0.67
.03
.00
.00
.00
.02
.01
.00
.00
.04
political perspective:
experience
gender
gender_diff
gender_lead
position
experience x gender
experience x gender_diff
experience x gender_lead
experience x position
1.73
0.34
4.37*
0.13
0.56
0.18
0.30
0.13
1.54
.03
.00
.04
.00
.02
.00
.00
.02
.10
same < mixed
empirical perspective:
experience
gender
gender_diff
gender_lead
position
experience x gender
experience x gender_diff
experience x gender_lead
experience x position
3.61*
5.84*
10.34**
7.91**
0.68
4.08*
0.64
3.39*
0.43
.06
.05
.08
.06
.02
.07
.01
.06
.03
low < medium
male < female
same > mixed
male > female
female: none = low = medium
male: none > low ; low < medium
male: none = low = medium
female: none > low; low < medium
consensual perspective:
experience
gender
gender_diff
gender_lead
position
experience x gender
experience x gender_diff
experience x gender_lead
experience x position
3.84*
0.40
6.46*
0.08
2.21
0.10
0.22
1.37
0.50
.06
.00
.05
.00
.07
.00
.00
.02
.03
low < medium
same > mixed

31
effectual perspective:
experience
gender
gender_diff
gender_lead
position
experience x gender
experience x gender_diff
experience x gender_lead
experience x position
4.15*
1.59
8.32**
1.77*
1.23
1.35
0.19
0.38**
0.56
.07
.01
.07
.01
.04
.02
.00
.00
.04
low < medium
same > mixed
male > female
no difference p < 0.05 (two-sided)
overall satisfaction:
experience
gender
gender_diff
gender_lead
position
experience x gender
experience x gender_diff
experience x gender_lead
experience x position
8.08**
5.81*
10.64**
4.48*
0.32
3.70*
1.38
6.00**
0.48
.13
.05
.09
.04
.01
.06
.02
.10
.03
low < medium
male < female
same > mixed
male > female
female: none = low = medium
male: low < none; low < medium
male: none = low = medium
female: low < none; low < medium; none < medium
result
experience
gender_diff
gender_lead
experience x gender_diff
experience x gender_lead
0.09
0.11
0.74
0.23
0.08
.01
.00
.04
.02
.01
* p < .05, ** p< .01
a) for the dependent variables the unit of analysis is the subject (n = 130; df = (2,106), except for result the unit of
analysis is the group (n = 26; df = (2,17))
b) for the independent variables gender, gender_diff and gender_lead df = (1,106)
c) for the independent variables position df = (4,106)
d) for the independent variable experience x position df = (8,106)
e) for result the independent variable gender_diff and gender_lead df = (1,17)

32
Table 7. Summary of the results regarding the hypotheses
Hypotheses Result
1. Subjects of GMB groups will have a stronger rational perspective than subjects of MU groups.
2. Subjects of GMB groups will have a stronger political perspective than subjects of MU groups.
3. Subjects of GMB groups will have a stronger consensual perspective than subjects of MU groups.
4. Subjects of GMB groups will have a stronger empirical perspective than subjects of MU groups.
5. Subjects of GMB groups will have a stronger effectual perspective than subjects of MU groups.
6. Subjects of GMB groups will be more satisfied on the process and outcomes of their meeting than
subjects of MU groups.
7. The results of GMB groups will be better than the results of MU groups
not supported
not supported
not supported
not supported
not supported
not supported
not supported
View publication statsView publication stats