is ireland? entrepreneurial · how entrepreneurial is ireland? ... list of figures page figure 1:...
TRANSCRIPT

TThhee IIrriisshh RReeppoorrtt
How
Entrepreneurial
is Ireland?
TThhee GG
lloobb
aall EE
nnttrree
pprree
nneeuurrss
hhiipp
MMoo
nniittoo
rr 22000011
TThhee IIrriiss
hh RR
eepp
oorrtt
PPaauullaa FFiittzzssiimmoonnssCCoollmm OO’’GGoorrmmaannFFrraannkk RRoocchhee
PPaauullaa FFiittzzssiimmoonnssCCoollmm OO’’GGoorrmmaannFFrraannkk RRoocchhee
HHooww EEnnttrreepprreenneeuurriiaall iiss IIrreellaanndd??
Sponsored by:

How Entrepreneurial is Ireland?
The Global Entrepreneurship Monitor 2001
The Irish Report
Paula Fitzsimons Colm O’Gorman Frank Roche
Sponsored by: Enterprise Ireland and Forfas

Enterprise Ireland and Forfas are the principal sponsors of this independent report, the findings of which donot necessarily represent the views of these organisations.
The authors have attempted to ensure accuracy and completeness of the information contained in thispublication. However, no responsibility can be accepted for any errors and inaccuracies that occur.
This report was published by the
Department of Business AdministrationUniversity College Dublin.
Printed by Cahill Printers Limited, East Wall Road, Dublin 3

Contents
Page
Executive Summary … … … … … … … … … … … … 1
1. THE GEM PROJECT … … … … … … … … … … … 5
1.1. History of the Project … … … … … … … … … … 5
1.2. GEM Definition of Entrepreneurship … … … … … … … … 5
1.3. Thesis to be Proven … … … … … … … … … … 5
1.4. The GEM Theoretical Model … … … … … … … … … 5
1.5. How GEM Collects Data … … … … … … … … … 7
2. THE GEM RESULTS… … … … … … … … … … … … 9
2.1. The GEM Results … … … … … … … … … … … 9
2.2. Level of Entrepreneurship Across Countries … … … … … … 10
2.3. Entrepreneurship and Economic Growth … … … … … … … 12
2.4. Entrepreneurial Motivation … … … … … … … … … 12
2.5. Personal Characteristics of Entrepreneurs … … … … … … … 15
2.6. Entrepreneurial Framework Conditions … … … … … … … 18
2.6.1. Cultural and Social Norms … … … … … … … … 182.6.2. Financial Support … … … … … … … … … 192.6.3. Government Policies … … … … … … … … … 20
2.7. Formal and Informal Business Investment … … … … … … … 21
3. 3. HOW ENTREPRENEURIAL IS IRELAND? … … … … … … … … 23
3.1. Introduction … … … … … … … … … … … 23
3.2. Overall Results … … … … … … … … … … … 23
3.3. Backdrop to Entrepreneurship in Ireland … … … … … … … 25
3.4. Key Entrepreneurial Framework Conditions: Ireland’s Relative Position … … 26
3.4.1. Financial Support … … … … … … … … … 263.4.2. Cultural and Social Norms … … … … … … … … 273.4.3. Government Policies … … … … … … … … … 28
3.5. The Other Entrepreneurial Framework Conditions … … … … … 29
3.5.1. Government Programmes … … … … … … … … 293.5.2. Education and Training … … … … … … … … 303.5.3. R & D Transfer … … … … … … … … … … 313.5.4. Professional and Commercial Infrastructure … … … … … 313.5.5. Internal Market Openness … … … … … … … … 323.5.6. Access to Physical Infrastructure … … … … … … … 32
iii
Global Entrepreneurship Monitor
3.6. Entrepreneurial Characteristics Among the Irish People … … … … … 32
3.6.1. Entrepreneurial Opportunity … … … … … … … … 333.6.2. Entrepreneurial Capacity … … … … … … … … 333.6.3. Age and Gender of Entrepreneurs … … … … … … … 35
3.7 Conclusion … … … … … … … … … … … … 35
4. MAKING IRELAND MORE ENTREPRENEURIAL … … … … … … … 37
4.1 What GEM Has Achieved for Ireland… … … … … … … … 37
4.2 The Focus of the Recommendations … … … … … … … … 37
4.3 Championing Entrepreneurial Activity … … … … … … … 38
4.4 Actively Encouraging More Women Entrepreneurs … … … … … 39
4.5 Building Entrepreneurial Capacity … … … … … … … … 39
4.6 Making Seed Funding More Accessible … … … … … … … 40
4.7 Commercialising Publicly Funded Research … … … … … … … 41
4.8 Removing Infrastructural Inefficiencies … … … … … … … 41
APPENDIX 1
GEM 2000 and GEM 2001: Understanding the Change in Ireland’s Position … … … 43
iv

List of Figures
Page
Figure 1: The GEM Theoretical Model … … … … … … … … 2
Figure 2: Total Entrepreneurial Activity … … … … … … … … 10
Figure 3: Nascent vs. New Firm Entrepreneurs … … … … … … … 11
Figure 4: Opportunity vs. Necessity Entrepreneurship … … … … … … 13
Figure 5: Entrepreneurial Activity by Gender and Age … … … … … … 16
Figure 6: Entrepreneurial Activity by Gender and Educational Attainment … … … 17
Figure 7: Informal Investment by Country … … … … … … … … 21
Figure 8: Domestic Venture Capital Invested as a Percentage of GDP … … … 22
v

List of Tables
Page
Table 1: GEM Countries Categorised on the Basis of their Entrepreneurial Activity 11
Table 2: Entrepreneurship Motives and Selected Sectors … … … … … 14
Table 3: Entrepreneurship Motives and Growth Expectations… … … … … 15
Table 4: Educational Attainment and Type of Entrepreneurial Ventures … … … 18
Table 5: Global Experts’ Evaluations: Culture and Social Norms … … … … 19
Table 6: Global Experts’ Evaluations: Financial Support … … … … … 20
Table 7: Global Experts’ Evaluations: Government Policy … … … … … 20
Table 8: Summary of the Results for Ireland … … … … … … … 24
Table 9: Summary of All Experts’ Evaluations … … … … … … … 25
Table 10: Ireland’s Relative Position … … … … … … … … … 26
Table 11: Experts’ Evaluations: Financial Support … … … … … … … 27
Table 12: Experts’ Evaluations: Cultural and Social Norms … … … … … 27
Table 13: Experts’ Evaluations: Government Policy … … … … … … 29
Table 14: Experts’ Evaluations: Government Programmes … … … … … 30
Table 15: Experts’ Evaluations: Education and Training … … … … … … 30
Table 16: Experts’ Evaluations: R&D Transfer … … … … … … … 31
Table 17: Experts’ Evaluations: Professional and Commercial Infrastructure … … … 31
Table 18: Experts’ Evaluations: Internal Market Openness … … … … … 32
Table 19: Experts’ Evaluations: Physical Infrastructure … … … … … … 32
Table 20: Experts’ Evaluations: Entrepreneurial Opportunity … … … … … 33
Table 21: Experts’ Evaluations: Entrepreneurial Capacity (Skills) … … … … 34
Table 22: Experts’ Evaluations: Entrepreneurial Capacity (Motivation) … … … 34
vi

Acknowledgements
The Irish GEM team would like to thank all theexpert informants that were interviewed as partof this research. They gave generously of theirtime and their insights enriched ourunderstanding of the current state ofentrepreneurship in Ireland.
vii
We would also like to thank our sponsors,Enterprise Ireland and Forfas, without whosegenerous sponsorship Ireland’s participation inGEM 2001 would not have been possible.


The GEM 2001 Irish Research Team
Paula Fitzsimons, the national co-ordinator for Contact DetailsGEM, is an independent strategy and Paula Fitzsimons, 10 Grove Lawn, Malahide,management consultant, specializing in Co. Dublin.sectoral and enterprise development strategies. Tel: +353 87 277 4385;Her clients include government development Fax: +353 1 845 0770;agencies and individual start-up and developing E-mail: [email protected].
Dr. Colm O’Gorman is a lecturer in the Contact DetailsUndergraduate Business School and the Dr. Colm O’Gorman,Michael Smurfit Graduate Business School in Tel: +353 1 7168210;the Faculty of Commerce at the University Fax: +353 1 7161132;College, Dublin. He specialises in the areas of E-mail: [email protected] strategy and enterprisedevelopment.
Dr. Frank Roche holds the Berber Family Chair Contact Detailsof Entrepreneurship and is Head of the Dr. Frank Roche,Department of Business Administration and Tel: +353 1 7168820;Director of the Enterprise Centre at the Fax: +353 1 7168954Michael Smurfit Graduate School of Business E-mail: [email protected] University College Dublin. His teaching andresearch are now concentrated in the area ofentrepreneurship and corporate venturing. Heis Vice Chairman of the Dublin BusinessInnovation Centre and works closely with anumber of start-up companies.
Dublin, June 2002
ix

Executive Summary
The recently completed GlobalEntrepreneurship Monitor 2001 (GEM) ranksIreland 6th in terms of the overallentrepreneurial propensity of its adultpopulation across 29 countries. This is arevised result and corrects the very lowposition that Ireland obtained in GEM 2000.1
GEM is an international research programmerun jointly by London Business School andBabson College in the USA. It seeks to bringtogether some of the world’s leadingresearchers in the area of entrepreneurship toexplore three related questions:
• Does the level of entrepreneurialactivity vary between countries, and, ifit does, to what extent?
• Does the level of entrepreneurialactivity affect a country’s rate ofeconomic growth and prosperity?
• What makes a country entrepreneurial?
As a result of its analysis over three years,GEM clearly demonstrates that the level ofentrepreneurial activity differs betweencountries, and that entrepreneurial motivationdiffers between developing countries (‘‘push’’or necessity entrepreneurship) and those withmore developed economies (‘‘pull’’ oropportunistic entrepreneurship). Ireland quiteclearly falls into the latter category with 82% ofentrepreneurs responding to perceivedopportunities. The link betweenentrepreneurship and growth, however, is notas clear as originally thought. The level ofentrepreneurship and growth can only beclearly demonstrated in those countries withless developed economies.
1 New information came to light in September 2001, which cast doubt on the accuracy of the previous results for Ireland.Appendix 1 gives a detailed explanation as to how this situation came about.
2 ‘‘Capacity’’ in this context means possessing both the skills and motivation to bring the perceived entrepreneurial opportunity tocommercial reality.
1
The year 2001 is the third consecutive year inwhich this study has taken place. Each yearmore countries are becoming involved. GEMbegan as a pilot study in 1999 with 10countries involved. It grew to involve 21countries in 2000 and 29 countriesparticipated in the 2001 study. This is Ireland’ssecond year of participation. Forfas andEnterprise Ireland co-sponsored Ireland’sinvolvement in GEM in 2001.
GEM uses four research instruments in exactlythe same way in each of the participatingcountries. In this way, cross countycomparisons can be made. The instruments areas follows:
(i) A population survey of approximately2,000 adults;
(ii) Face to face in-depth interviews with atleast 36 key or expert informants onvarious aspects of entrepreneurship;
(iii) A detailed questionnaire completed bythe experts interviewed; and
(iv) Various comparable national economicdata.
GEM identifies nine framework conditions that,together with the degree of entrepreneurialrecognition and capacity2 within the adultpopulation, have a significant bearing on thediffering levels of entrepreneurial activityamong the adult population betweencountries.
The GEM 2001 results of the adult populationsurvey for Ireland confirm the views of theexperts interviewed. A generally supportiveenvironment now exists within Ireland for

Global Entrepreneurship Monitor
entrepreneurship. A summary of the mainresults of GEM 2001 for Ireland is as follows:
• 7.2% of the adult population iscurrently engaged in the process oftrying to start a new business. These arereferred to as nascent entrepreneurs.This level of activity places Ireland 12th
among the 29 countries;
• 4.8% of the adult population currentlypartly or fully own and operate abusiness that was started since 1998.These are referred to as new firmentrepreneurs. This level of activityamong new firm entrepreneurs placesIreland 6th; and
• 3% of all start-ups are perceived bytheir founders to have high growthpotential3. This result places Ireland in10th place among the 29 countries.
GEM clearly demonstrates the importance ofinformal or ‘‘business angel’’ investment insupporting new ventures. Just over 3% of Irishadults have informally invested in this way overthe last three years in a new venture started bysome one else. This result places Ireland justabove the average among GEM participatingcountries in terms of business angel investmentin new enterprises.
Areas that GEM highlights as a matter ofconcern for Ireland is the relative unavailabilityof seed funding, the low number of womenentrepreneurs, and infrastructural inefficienciesthat are beginning to have a negative effect onthe country’s overall relative internationalcompetitiveness.
There is general agreement that the positiveenvironment for entrepreneurship that exists inIreland should be further strengthened. To thisend, six recommendations are outlined whichare designed to achieve this objective bybuilding on Ireland’s strengths in this area,while seeking to overcome identifieddeficiencies.
3 ‘‘High growth potential’’ is defined as being capable of employing 50 people within five years.
2
In summary, the recommendations that arebeing proposed for Ireland by the Irish GEMteam are as follows:
• Entrepreneurial activity and itsconsequent benefits should bechampioned at national level.
• The barriers preventing a greaterinvolvement by women inentrepreneurial activity should besystematically identified and theirparticipation must be activelyencouraged and supported.
• A series of educational and traininginitiatives should be designed todevelop both the required skills andconfidence in individuals, through theformal general education system andthrough entrepreneurial specificinitiatives.
• The availability of pre- and start-up seedcapital for different types of business’needs should be reviewed and any gapsin the availability of financing should beaddressed. The relative attractivenessfor investors of investing in early stageenterprises should also be examinedand the risk/reward of such investmentmade more attractive through fiscalincentives
• Means of transferring the significantresearch, technological developmentand innovation (RTDI) investment,currently being implemented, into newentrepreneurial initiatives should beactively encouraged and any barriers toits transfer should be identified andremoved.
• The inefficiencies and shortcomings inthe country’s physical andtelecommunications infrastructureshould be addressed with a real senseof urgency.
These recommendations are detailed inSection 4.
GEM 2001 Irish Report
GEM has given Ireland for the first time ameans of benchmarking the entrepreneurialpropensity of its adult population against 28other countries. It also provides access to arange of international research and policyinitiatives, so that Ireland can learn from theexperience of other countries, ways and meansof encouraging a greater level ofentrepreneurial drive and initiative among itsadult population. International researchindicates that the more entrepreneurial activitythere is within a country, the greater thenumber of value adding, high growth potentialnew ventures that will be initiated.
3
The number of countries participating in GEMis set to rise to almost 40 in 2002 as more andmore countries perceive the benefits whichparticipation can convey. The Irish GEM teamis determined to ensure that Ireland will remainfully committed to GEM so that the countrycan continue to enjoy the benefits of collectivelearning, together with the means of measuringprogress towards the goal of becoming aleading entrepreneurial nation.


CHAPTER 1
The GEM Project
1.1 History of the Project
The Global Entrepreneurship Monitor (GEM) isa research programme run jointly by LondonBusiness School and Babson College in theUSA. The research also involves a consortiumof teams from each of the countries involvedin the study. In 2001, 29 countriesparticipated4.
The aim of GEM is to create an annualassessment of the levels of entrepreneurialactivity across countries. The research alsoexplores a variety of factors both within andacross countries that might give rise tosystematic differences in entrepreneurshiprates. Through a greater understanding of thesefactors, policies to enhance the level ofentrepreneurial activity can be based on solidresearch and the role of entrepreneurship incontributing to a positive economicenvironment can be better understood.
GEM began in 1999. The first study began with10 countries5, expanded to 216 in the year2000, and to 297 countries in 2001. In 2002, itis expected that the number of participatingcountries will rise to about 40.
1.2 GEM Definition ofEntrepreneurship
For the purposes of the research, GEM uses avery comprehensive definition ofentrepreneurship, which encompasses any type
4 Argentina, Australia, Belgium, Brazil, Canada, Denmark, Finland, France, Germany, Hungary, India, Ireland, Israel, Italy, Japan,Mexico, Netherlands, Norway, New Zealand, Poland, Portugal, Russia Singapore, South Africa, Spain, South Korea, Sweden, UK,and USA.
5 Canada, Denmark, Finland, France, Germany, Israel, Italy, Japan, UK and USA.6 Ireland was among the countries that participated in GEM for the first time in 2000. The other first time participants in that year
were Argentina, Australia, Belgium, Brazil, India, Norway, Singapore, Spain, South Korea and Sweden.7 The first time participants in GEM 2001 were Hungary, Mexico, Netherlands, New Zealand, Poland, Portugal, Russia and South
Africa.
5
of entrepreneurial initiative, including self-employment. The Total EntrepreneurshipActivity (TEA) rating is made up of thoseactively planning to become entrepreneurs,and taking some specific actions to bring thisabout, (categorised by GEM as ‘‘nascent’’entrepreneurs) and those who have set up anew enterprise in the 42 months prior to thecarrying out of the adult population survey(categorised by GEM as ‘‘new firm’’entrepreneurs).
1.3 Thesis to be Proven
GEM was designed to answer threefundamental questions:
(i) Does the level of entrepreneurialactivity vary between countries, and, ifit does, to what extent?
(ii) Does the level of entrepreneurialactivity affect a country’s rate ofeconomic growth and prosperity?
(iii) What makes a country entrepreneurial?
1.4 The GEM Theoretical Model
Most studies of economic performance focuson the ‘primary economy’ of large, establishedfirms and industries, and the ‘secondaryeconomy’ of small and medium sizedenterprises. The focus is, therefore, onenterprises already established, in other words

Global Entrepreneurship Monitor
the ‘‘status quo’’. The entrepreneurial sector,(i.e. start-ups and new firms), is missing.
The GEM model specifically incorporates boththe established and entrepreneurial sectors andillustrates the relationship between them. GEM
Figure 1: The GEM Theoretical Model
General NationalFramework Conditions
MajorEstablished Firms
Micro, Small andMedium Firms
EntrepreneurialOpportunities
EntrepreneurialFramework Conditions
EntrepreneurialCapacity
BusinessChurning
Social,Cultural,PoliticalContext
NationalEconomicGrowth
The general environment, which pertains withina particular country at a point in time,influences both new and existing firms. Thecharacteristics of this general environment arereferred to in GEM as the ‘‘NationalFramework Conditions’’.
The National Framework Conditions are asfollows:
• The relative openness of the economy,
• The role and extent of Governmentintervention,
• The efficiency of the financial markets,
• The level and intensity of technologyand R&D,
• The physical infrastructure,
• The availability and extent ofmanagement skills,
6
seeks to examine the strength and influence ofthe entrepreneurial sector, (i.e. the effect ofnew firm creation and growth,) on theeconomy.
The model for GEM is illustrated indiagrammatic form in Figure 1.
• The degree of flexibility in the labourmarket,
• The degree to which institutions areunbiased and the rule of law prevails.
In addition to this, there is a set of factors thatGEM has identified as specifically influencingthe entrepreneurial sector. These are termedthe ‘‘Entrepreneurial Framework Conditions’’.The Entrepreneurial Framework Conditions areas follows:
• Financial
• Government Policies
• Government Programmes
• Education and Training
• R&D Transfer
• Commercial Infrastructure

GEM 2001 Irish Report
• Internal Market Openness
• Physical Infrastructure
• Cultural and Social Norms.
There is somewhat of an overlap between theNational Framework Conditions and thosespecifically affecting entrepreneurship, butwithin the Entrepreneurial FrameworkConditions, it is the relative effect of theCondition for a new firm that is the issue. Forexample, there may be instances withincountries whereby the general financialenvironment is supportive of establishedbusinesses, but is less available to and lesssupportive of new businesses.
GEM suggests that at the heart of theexplanation of the relative entrepreneurialpropensity of a country’s adult population is acombination of the following:
• Differences in the nine EntrepreneurialFramework Conditions betweencountries;
• The relative perceptiveness of the adultpopulation of new ventureopportunities, (‘‘entrepreneurialopportunity’’); and
• The capacity and motivation of theadult population to capitalise on suchopportunities (‘‘entrepreneurialcapacity’’).
1.5 How Gem Collects Data
The GEM model incorporates four fundamentalresearch instruments8 in order to explore thesequestions. These instruments are as follows:
(i) A population survey, based on arandom sample of approximately 2,000adults.
(ii) Face-to-face interviews with at least 36experts (called ‘key informants’) onvarious aspects of entrepreneurship.
(iii) A detailed questionnaire completed bythe experts interviewed.
8 (i) and (iv) are the responsibility of the GEM central co-ordination team and (ii) and (iii) are the responsibility of the nationalteam.
7
(iv) The use of selected national economicdata, measured in standard units, fromcredible international sources includingthe Organisation for EconomicCooperation and Development(OECD), the World Bank, and theWorld Competitiveness Yearbook.
Details of each of these instruments arecontained in the paragraphs that follow.
(i) Adult Population Survey
Professional survey research firms in eachcountry administer the adult populationsurveys, which are based on a random sampleof approximately 2,000 adults. Samplingprocedures vary somewhat, but all of thesurvey firms are able to provide samples thatare, when properly weighted, representative ofthe adult population in each country.
Telephone interviews are utilized in Ireland, asin most of the developed countries, wheremost households have a telephone. Theinterview completion time ranges from a lowof 60 seconds to a high of 15 minutes,depending on the extent of the respondent’sinvolvement in entrepreneurial activity. The firstfour items asked of all those interviewed arerelated to participation in entrepreneurialactivities — starting a new firm, owning andmanaging a new firm and informally investingin another’s new firm. Anyone engaged in anyof these activities is asked for additionalselected details about that activity.
A further six items, also asked of all thoseinterviewed, are for assessing attitudes towardsand knowledge of the entrepreneurial climate.
(ii) Expert Informant Interviews
Expert informants are chosen by reputationand referrals to represent the nineentrepreneurial framework dimensions in theGEM model as outlined above. At least threeexperts should come from each of the nineentrepreneurial framework conditions and 25%of them should be entrepreneurs. The GEMnational team conducts face-to-face interviews

Global Entrepreneurship Monitor
with at least 36 such experts, called ‘‘keyinformants’’. The interviews attempt toascertain the views of national experts on thefactors that have been shown to influence thelevel of entrepreneurial activity.
(iii) Detailed Questionnaires Completed bythe ‘‘Key Informants’’
The experts interviewed also complete adetailed questionnaire. The group of experts,chosen for an in-depth face-to-face interview,complete this questionnaire in the presence ofthe interviewer at the end of the interview,while experts interviewed in the precedingyear(s) are requested to complete thequestionnaire and return it by post.
Expert self-completed questionnaires, translatedinto the national languages, consist of those
8
items asked in the adult population survey,plus an additional 69 five-point scale itemscovering a range of topics relating to theEntrepreneurial Framework Conditions, theentrepreneurial capacity and opportunityrecognition perceptiveness of the adultpopulation, as well as other socio-demographicitems. These questionnaires take about 15minutes to complete.
(iv) National Economic Data
Standardized cross-national data on a variety ofnational characteristics and attributes (e.g.,growth in GDP) are assembled from a widerange of harmonized international sources.Sources include the United Nations, Eurostat,ILO, U.S. Census International Data Base,World Bank, and International Monetary Fund,among others.

CHAPTER 2
The GEM Results
2.1 The GEM Results
GEM has identified the following trends acrossthe participating countries.
(i) The level of entrepreneurship differssubstantially between countries.
(ii) Only in the less developed countrieshas a link between entrepreneurshipand growth been demonstrated.
(iii) There is a distinct difference inentrepreneurship motivation (Necessityvs. Opportunistic) between countries.This has a significant impact on thegrowth potential of the entrepreneurialactivity in a country. For example, onein seven opportunity drivenentrepreneurs expects that their newbusiness will grow significantly, whileonly one in fifty necessityentrepreneurs have such growthexpectations. Opportunityentrepreneurship is also more prevalentin certain sectors of the economy.
(iv) The age, gender and educationalattainment levels of the adultpopulation has a profound effect onthe level, type and scale ofentrepreneurial activity within acountry.
Those who believe that there are goodopportunities within their communitiesto start a business are three times morelikely to be entrepreneurially activethan are those who do not believe thatsuch opportunities exist. While thosethat consider that they have the skillsto create and run a successful businessare six times more likely to beentrepreneurially active. Among thosepursuing opportunities, it is those withthe higher levels of education who arethe most entrepreneurially active. Thisholds true for both men and women.
9
(v) Three Entrepreneurial FrameworkConditions are generally considered bythe international group of experts asparticularly facilitating higher levels ofentrepreneurial activity. These are asfollows:
• Cultural and Social Norms,
• Financial Supports, and
• Government Policies.
The key informants, in the moreentrepreneurially active countries,placed particular emphasis on the needto encourage women and minorities tobe more entrepreneurial and to createa mind-set of creativity and innovation;to improve the risk assessment culturein the financial community; to increasethe long-term, strategic focus ingovernments’ perception of thebenefits of encouraging and supportingentrepreneurship; and to deepengovernments’ understanding ofentrepreneurship.
(vi) The level of informal and formalbusiness investment differs significantlybetween countries, with the USdominating in virtually every area inthis regard. Policy makers oftenunderestimate the significance ofinformal investment in entrepreneurialventures, with few realising that itrepresents the equivalent of 1.1% ofGDP on average across all GEMcountries. While venture capital isinvested in a much smaller number ofnew enterprises, those in which it isinvested tend to grow larger morequickly.
The paragraphs that follow analyse the GEMresults across the 29 countries in more detail ineach of the areas (i) to (vi) outlined above.

Global Entrepreneurship Monitor
Section 3 ‘‘How Entrepreneurial is Ireland?’’focuses specifically on the results for Ireland.
2.2 Level of Entrepreneurship acrossCountries
Figure 2 illustrates the results of GEM 2001 interms of the entrepreneurial activity of theadult populations across the 29 countries. Therange of entrepreneurial activity across the
Figure 2: Total Entrepreneurial Activity
Per
sons
per
100
Adu
lts, 1
8-64
Yrs
old
(95%
Con
fiden
ce In
terv
al)
25.00
20.00
15.00
10.00
5.00
0.00
Bel
gium
Japa
n
Sin
gapo
re
Isra
el
The
Net
herla
nds
Sw
eden
Rus
sia
Ger
man
y
Por
tuga
l
Fra
nce
Uni
ted
Kin
gdom
Spa
in
Den
mar
k
Nor
way
Fin
land
Sou
th A
frica
Pol
and
Italy
Arg
entin
a
Can
ada
Indi
a
Hun
gary
U.S
.
Irela
nd
Bra
zil
Kor
ea Aus
tralia N
ew Z
eala
nd
Mex
ico
All
Cou
ntrie
s
Upper
Average
Lower
The GEM study divides countries, based ontheir adult population survey, into twogroupings in terms of their entrepreneurialactivity rating. Counties are categorised as‘‘High’’ or ‘‘Low’’ based on the level ofentrepreneurial activity among their adultpopulations. Within the ‘‘High’’ category isincluded any country equal to or above the
10
participating countries differs substantially, froma low of less than 5% in Belgium to a high ofapproximately 18% in Mexico.
Mexico and New Zealand appear to lead agroup of five countries with generally higherentrepreneurial prevalence rates than all otherGEM 2001 countries. However, the rank orderamong the five is uncertain since thedifferences between the countries are notstatistically significant.
median prevalence rate. Within the ‘‘Low’’category is included any country below themedian prevalence rate on the TotalEntrepreneurial Activity (TEA) Index.
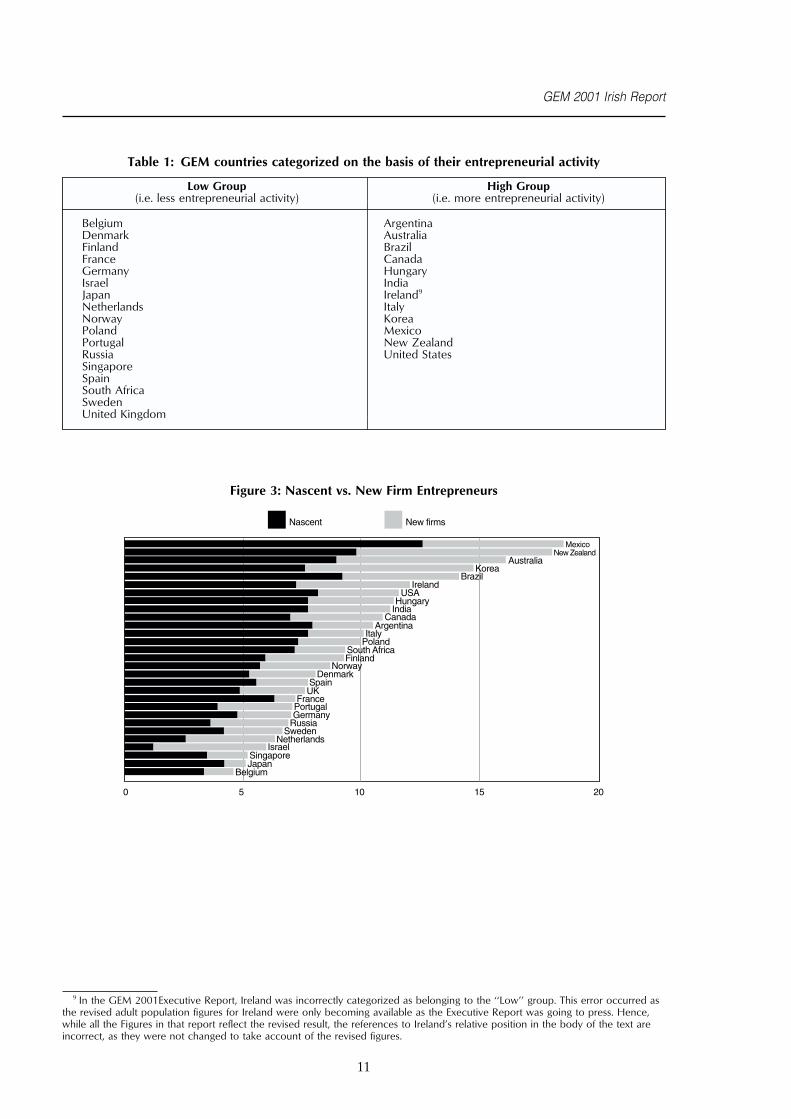
Table 1 lists the countries in alphabetical orderin each category.
GEM 2001 Irish Report
Table 1: GEM countries categorized on the basis of their entrepreneurial activity
Low Group High Group(i.e. less entrepreneurial activity) (i.e. more entrepreneurial activity)
Belgium ArgentinaDenmark AustraliaFinland BrazilFrance CanadaGermany HungaryIsrael IndiaJapan Ireland9
Netherlands ItalyNorway KoreaPoland MexicoPortugal New ZealandRussia United StatesSingaporeSpainSouth AfricaSwedenUnited Kingdom
Figure 3: Nascent vs. New Firm Entrepreneurs
Mexico
0 5 10 15 20
Nascent New firms
New ZealandAustralia
KoreaBrazil
IrelandUSA
HungaryIndia
CanadaArgentina
ItalyPoland
South AfricaFinland
NorwayDenmark
SpainUK
FrancePortugalGermany
RussiaSweden
NetherlandsIsrael
SingaporeJapan
Belgium
9 In the GEM 2001Executive Report, Ireland was incorrectly categorized as belonging to the ‘‘Low’’ group. This error occurred asthe revised adult population figures for Ireland were only becoming available as the Executive Report was going to press. Hence,while all the Figures in that report reflect the revised result, the references to Ireland’s relative position in the body of the text areincorrect, as they were not changed to take account of the revised figures.
11
Global Entrepreneurship Monitor
As might be expected, in almost everycountry10 there are much greater numbers ofpeople planning to start a new business(nascent entrepreneurs) than actually bring anew enterprise into being (new firmentrepreneurs).
Across the GEM countries, 6.3% of all adultsare actively planning a new business and arecategorised as ‘‘nascent entrepreneurs’’, while3.5% of entrepreneurs identified by GEMacross all countries have actually started a newenterprise over the previous 42 months andare categorised as ‘‘new firm’’ entrepreneurs.
Figure 3 illustrates for each of the countries therelative proportion of nascent and new firmentrepreneurs.
2.3 Entrepreneurship and EconomicGrowth
One of the initial objectives of GEM was toenquire whether the level of entrepreneurialactivity affected a country’s rate of economicgrowth and prosperity.
While the first study (1999) appeared to showa strong correlation between the level ofentrepreneurial activity in a country and itsgrowth rate, as the number of countriesinvolved in GEM expanded and included agreater variety in terms of size, stage ofdevelopment and propensity to tradeinternationally, the connection betweenentrepreneurship and economic growth wasperceived to be more complex.
The 2000 Report asserted that despite variousresearch initiatives ‘‘. . . remarkably little isknown about the relationship betweenentrepreneurship and economic growth,including how it works, what determines itsstrength and the extent to which it holds fordiverse countries.’’11
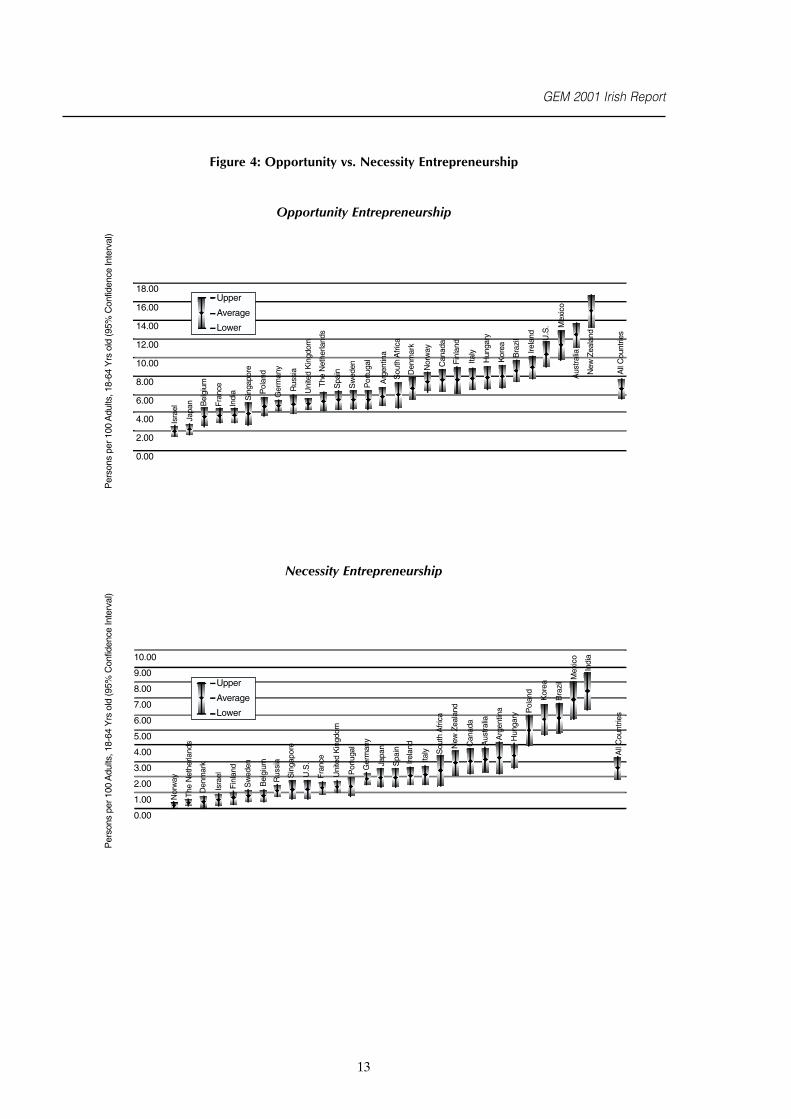
GEM 2001 was able to demonstrate a positivecorrelation between ‘‘Necessity’’entrepreneurship and GDP growth. In otherwords, where there was a high level of
10 Israel is a clear exception to this trend in 2001. This may have more to do with the political situation within in the country atthis time, however, rather than an inherently different underlying trend.
11 Reynolds, Hay, Bygrave, Camp and Autio, 2000.12 Garelli Stephane, The World Competitiveness Yearbook: 2000. Lausane, Switzerland International Institute for Management
Development. In 1999 and again in 2000, Singapore was ranked 2nd, just behind the United States.13 GEM 2000 (4.1% — 21st/21) and GEM 2001 (5.2% — 27th/29).14 Ireland is ranked 7th in the 2000 report, having been ranked 5th in the previous year’s report. Ireland’s relative position for 2001
has, however, fallen back to 10th position.
12
necessity entrepreneurship, and this tended tooccur in the less affluent, less developedcountries, the level of economic growth in thecountry tended to be high. India, Mexico andBrazil are examples of countries where thisrelationship is present. This correlation was notfound between ‘‘Opportunity’’entrepreneurship and GDP growth.
In the more developed countries, GEMsuggests that the desirable combination is ahigh degree of competitiveness relative toother countries, allied to a high level ofentrepreneurial propensity among its adultpopulation. Moreover, the entrepreneurialmotivation will tend to be based on a responseto perceived opportunity rather than on‘‘necessity entrepreneurship’’.
In certain countries, such as Singapore, whilethe country ranks well in the WorldCompetitiveness Index12, the level ofentrepreneurial activity among its adultpopulation is relatively low13. In response tothis situation, the Government of Singapore isactively promoting technology-basedentrepreneurship through its‘‘Technopreneurship 21’’ initiative, which itlaunched in 2000.
Ireland, on the other hand, ranks relatively wellon all three dimensions- relative internationalcompetitiveness14; a high level ofentrepreneurial activity among its adultpopulation; and a high level of opportunityrather than necessity driven entrepreneurship.
2.4 Entrepreneurial Motivation
GEM clearly demonstrates that the level ofentrepreneurial activity differs betweencountries. It also shows that the motivationaldrive behind the entrepreneurial activity differsbetween countries.
GEM 2001 Irish Report
Figure 4: Opportunity vs. Necessity Entrepreneurship
Opportunity Entrepreneurship
Upper
Average
Lower
18.00
16.00
14.00
12.00
10.00
8.00
6.00
4.00
2.00
0.00
Isra
el
Japa
n Bel
gium
Fra
nce
Indi
a
Sin
gapo
re
Pol
and
Ger
man
y
Rus
sia
Uni
ted
Kin
gdom
The
Net
herla
nds
Spa
in
Sw
eden
Por
tuga
l
Arg
entin
a
Sou
th A
frica
Den
mar
k
Nor
way
Can
ada
Fin
land
Italy
Hun
gary
Kor
ea
Bra
zil
Irela
nd U.S
. Mex
ico
Aus
tralia
New
Zea
land
All
Cou
ntrie
s
Per
sons
per
100
Adu
lts, 1
8-64
Yrs
old
(95%
Con
fiden
ce In
terv
al)
Necessity Entrepreneurship
Upper
Average
Lower
10.00
9.00
8.00
7.00
6.00
5.00
4.00
3.00
2.00
1.00
0.00
Isra
el
All
Cou
ntrie
s
Indi
a
Mex
ico
Bra
zil
Kor
ea
Pol
and
Ger
man
y
Japa
n
Bel
gium
Fra
nce
Sin
gapo
re
Rus
sia
Uni
ted
Kin
gdom
The
Net
herla
nds
Spa
in
Sw
eden
Por
tuga
l
Arg
entin
a
Sou
th A
frica
Den
mar
k
Nor
way
Can
ada
Fin
land
Italy
Hun
gary
Irela
nd
U.S
.
Aus
tralia
New
Zea
land
Per
sons
per
100
Adu
lts, 1
8-64
Yrs
old
(95%
Con
fiden
ce In
terv
al)
13

Global Entrepreneurship Monitor
Two distinct types of motivation are identified.The first relates to those involved in creatingand growing new firms who do so in responseto a perceived opportunity. These efforts arereferred to as ‘‘opportunity entrepreneurship’’,reflecting the voluntary nature of participation.Opportunity entrepreneurs have other optionsopen to them, but choose to start a newbusiness out of personnel preference. Incontrast, the second group become involvedbecause they perceive that they have ‘‘nobetter choices for work’’. Such efforts arereferred to as ‘‘necessity entrepreneurship’’,reflecting the individuals’ perception that suchactions present the best option available foremployment, but not necessarily the preferredoption.
About 54% of those involved in creating andgrowing new businesses across the entire GEMcountries were responding in a positive way toa perceived opportunity (‘‘opportunityentrepreneurship’’); 43% became involved out
Table 2: Entrepreneurship Motives and Selected Sectors
Opportunity NecessityEntre- Entre- Mixed or
Total preneurship preneurship Other
Start-up, or Nascent Firm (number of cases)15 6,609 3,489 2,908 212
Extractive:Farming, Fishing, Hunting, Forestry, Mining 4% 4% 4% 8%
Transforming:Construction, Manufacturing, Transportation,Wholesale, Communications, Utilities 33% 30% 37% 36%
Business Services:Financial, Insurance, Real Estate, Consulting,Business Professionals 14% 21% 5% 13%
Consumer-Oriented:Retail, Hotels, Restaurants, Consumer Services,Health, Education, Social Services 49% 45% 54% 43%
100% 100% 100% 100%
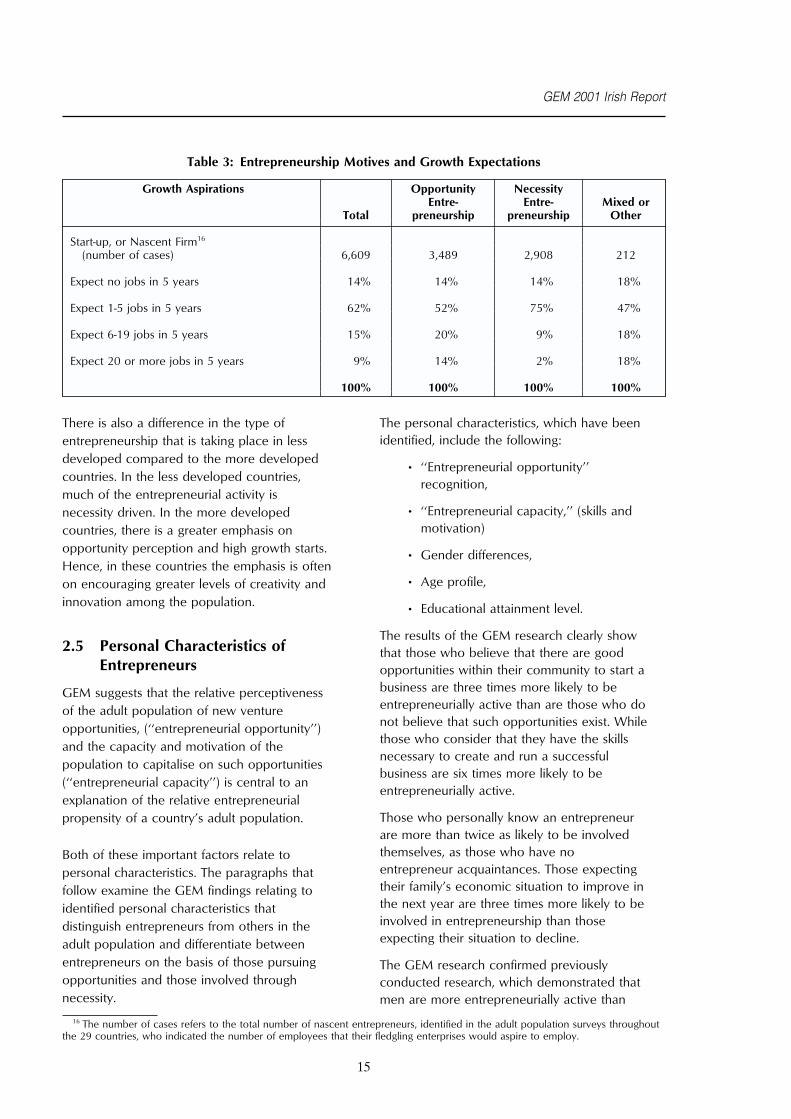
Growth aspirations also differ very dramaticallybetween necessity and opportunity drivenentrepreneurs, as is illustrated in Table 3.About 14% of opportunity entrepreneursexpect their new ventures to be high growthstart-ups, i.e. to produce 50 or more jobs infive years, compared with only 2% of necessity
15 The number of cases refers to the total number of nascent entrepreneurs, identified in the adult population surveys throughoutthe 29 countries, who indicated the sector in which their fledgling enterprises are active.
14
of necessity (‘‘necessity entrepreneurs’’); and3% became involved for other reasons.The pattern of participation in opportunity and
necessity entrepreneurship varies dramaticallyacross the GEM countries. Necessityentrepreneurship is much more prevalent inthe developing countries than it is in the moredeveloped economies.
Figure 4 separately illustrates the opportunityand necessity entrepreneurship rates for all 29GEM countries.
The results of GEM 2001 also show thatconsumer oriented businesses represent almost50% of all entrepreneurial activity. A muchgreater percentage of opportunity motivatedentrepreneurial activity occurs in the businessservices sector (21%), than in other individualsectors, while necessity entrepreneurship ismost prevalent in consumer-oriented services(54%). The relationship between the motivesfor entrepreneurship and the sectors in whichthe entrepreneurs engage is illustrated inTable 2.
entrepreneurs who have such expectations.Moreover, 90% of necessity entrepreneursexpect their new businesses to beemploying no more than 5 in the next fiveyears.
GEM 2001 Irish Report
Table 3: Entrepreneurship Motives and Growth Expectations
Growth Aspirations Opportunity NecessityEntre- Entre- Mixed or
Total preneurship preneurship Other
Start-up, or Nascent Firm16
(number of cases) 6,609 3,489 2,908 212
Expect no jobs in 5 years 14% 14% 14% 18%
Expect 1-5 jobs in 5 years 62% 52% 75% 47%
Expect 6-19 jobs in 5 years 15% 20% 9% 18%
Expect 20 or more jobs in 5 years 9% 14% 2% 18%
100% 100% 100% 100%
There is also a difference in the type ofentrepreneurship that is taking place in lessdeveloped compared to the more developedcountries. In the less developed countries,much of the entrepreneurial activity isnecessity driven. In the more developedcountries, there is a greater emphasis onopportunity perception and high growth starts.Hence, in these countries the emphasis is oftenon encouraging greater levels of creativity andinnovation among the population.
2.5 Personal Characteristics ofEntrepreneurs
GEM suggests that the relative perceptivenessof the adult population of new ventureopportunities, (‘‘entrepreneurial opportunity’’)and the capacity and motivation of thepopulation to capitalise on such opportunities(‘‘entrepreneurial capacity’’) is central to anexplanation of the relative entrepreneurialpropensity of a country’s adult population.
Both of these important factors relate topersonal characteristics. The paragraphs thatfollow examine the GEM findings relating toidentified personal characteristics thatdistinguish entrepreneurs from others in theadult population and differentiate betweenentrepreneurs on the basis of those pursuingopportunities and those involved throughnecessity.
16 The number of cases refers to the total number of nascent entrepreneurs, identified in the adult population surveys throughoutthe 29 countries, who indicated the number of employees that their fledgling enterprises would aspire to employ.
15
The personal characteristics, which have beenidentified, include the following:
• ‘‘Entrepreneurial opportunity’’recognition,
• ‘‘Entrepreneurial capacity,’’ (skills andmotivation)
• Gender differences,
• Age profile,
• Educational attainment level.
The results of the GEM research clearly showthat those who believe that there are goodopportunities within their community to start abusiness are three times more likely to beentrepreneurially active than are those who donot believe that such opportunities exist. Whilethose who consider that they have the skillsnecessary to create and run a successfulbusiness are six times more likely to beentrepreneurially active.
Those who personally know an entrepreneurare more than twice as likely to be involvedthemselves, as those who have noentrepreneur acquaintances. Those expectingtheir family’s economic situation to improve inthe next year are three times more likely to beinvolved in entrepreneurship than thoseexpecting their situation to decline.
The GEM research confirmed previouslyconducted research, which demonstrated thatmen are more entrepreneurially active than

Global Entrepreneurship Monitor
women. Across the 29 GEM countries, 70% ofall adults identified, as being entrepreneuriallyactive, were men.
In general, the most entrepreneurially activeage group is 25-44 year olds, with 55% of allentrepreneurs across all GEM countries beingwithin this age group. Patterns relating to age,however, are quite different for opportunityand necessity entrepreneurship. For men andwomen, opportunity entrepreneurship ishighest in the age group 35 to 44 years.Necessity entrepreneurship for men is highestin the 18 to 24 age group, and then declines
Figure 5: Entrepreneurial Activity by Gender and Age
TEA Opportunity18-24 yrs 3.1 6.625-34 yrs 4.0 9.735-44 yrs 4.9 9.745-54 yrs 4.3 6.355-64 yrs 2.4 4.5
TEA Overall18-24 yrs 5.5 17.2
Number Numberper 100 Women Men per 100
25-34 yrs 7.3 18.935-44 yrs 8.3 14.945-54 yrs 6.8 9.455-64 yrs 3.2 9.0
TEA Necessity18-24 yrs 2.3 10.525-34 yrs 3.1 8.735-44 yrs 3.1 4.845-54 yrs 2.3 2.855-64 yrs 0.7 4.0
Nascent Firms18-24 yrs 3.4 11.925-34 yrs 4.9 11.035-44 yrs 5.0 9.945-54 yrs 4.6 5.955-64 yrs 2.5 6.4
New Firms18-24 yrs 2.2 5.9
10 8 6 4 2 0 2 4 6 8 10 12 14 16 18 20
25-34 yrs 2.5 8.635-44 yrs 3.6 5.445-54 yrs 2.4 3.955-64 yrs 0.9 2.6
The GEM analysis shows that those who havecompleted secondary or third level educationor training, represent the majority (74%) ofthose currently active as entrepreneurs.
When all types of activity are considered, asshown in Figure 6, there are quite differentpatterns for men and women. Participation inentrepreneurial activity increases with more
16
steadily in the older age categories. Women,on the other hand, are equally represented upto the age of 54, when there is a dramaticdecline in their level of entrepreneurial activity.
Figure 5 illustrates the entrepreneurialprevalence rates for men on the right, and forwomen on the left, for all five GEM measuresof entrepreneurial activity (i.e. overall TotalEntrepreneurship Activity Rate (TEA), TEAOpportunity, TEA Necessity, NascentEntrepreneurs, and ‘‘New Firm’’ Entrepreneurs).The age categories are also presented for eachtype of entrepreneurial activity.
education for women, with a major jumpamong those who go beyond completion ofsecondary education. For men, in contrast,there is a reduced participation among thosewho go beyond secondary education, with thelowest levels among those with the most (i.e.,graduate experience) or least (i.e., non-completion of second level) amount ofeducation.

GEM 2001 Irish Report
When those pursuing opportunities, however,are compared with those involved inentrepreneurial activities out of necessity, thepatterns are quite different. Among thosepursuing opportunities, it is those with thehigher levels of education (at least secondaryschool completed) that are the mostentrepreneurially active. This is particularly truefor women who become moreentrepreneurially active as their level ofeducation increases. The pattern for necessity
Figure 6: Entrepreneurial Activity by Gender and Educational Attainment
Graduate Experience 9.3 9.7
TEA Opportunity
Post Secondary 7.2 9.5
Secondary Degree 3.6 9.8
No Secondary Degree 2.2 3.0
Graduate Experience 1.1 1.6
TEA Necessity
Post Secondary 1.9 5.8
Secondary Degree 2.0 7.3
No Secondary Degree 3.3 7.4
Graduate Experience 6.3 4.9
10 8 6 4 2 0 2 4 6 8 10 12 14 16 18
Nascent Firms
Post Secondary 4.9 10.0
Secondary Degree 4.0 12.0
No Secondary Degree 4.0 7.0
Graduate Experience 4.2 7.6
New Firms
Post Secondary 5.1 6.2
Secondary Degree 2.1 6.1
No Secondary Degree 1.7 3.9
Graduate Experience 10.5 11.7
TEA Overall
Post Secondary 9.5 15.8
Secondary Degree 6.0 17.6
No Secondary Degree 5.6 10.6
Number Numberper 100 Women Men per 100
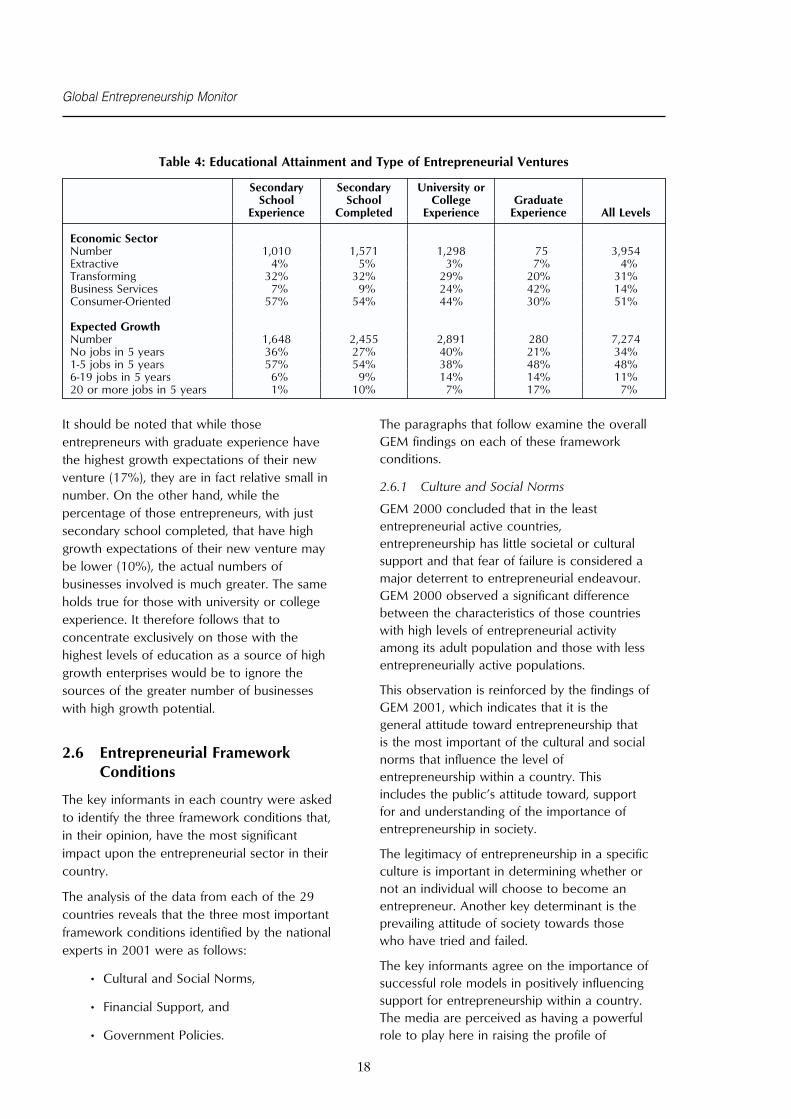
The GEM results also show that the type andscale of the entrepreneurial activity is directlyrelated to the educational attainment levels ofthe entrepreneurs. This is illustrated in Table 4.
17
entrepreneurship is reversed for both men andwomen. It is also true that those in the upperthird of household incomes within theircountries are much more active in pursuingopportunity entrepreneurship. This is onceagain particularly true for women.
The general patterns by gender andeducational attainment for the five types ofentrepreneurial activity are presented inFigure 6.
The most highly educated have the greatestexpectations that their enterprise will growsignificantly. They also tend to be the mostinvolved in Business Services.
Global Entrepreneurship Monitor
Table 4: Educational Attainment and Type of Entrepreneurial Ventures
Secondary Secondary University orSchool School College Graduate
Experience Completed Experience Experience All Levels
Economic SectorNumber 1,010 1,571 1,298 75 3,954Extractive 4% 5% 3% 7% 4%Transforming 32% 32% 29% 20% 31%Business Services 7% 9% 24% 42% 14%Consumer-Oriented 57% 54% 44% 30% 51%
Expected GrowthNumber 1,648 2,455 2,891 280 7,274No jobs in 5 years 36% 27% 40% 21% 34%1-5 jobs in 5 years 57% 54% 38% 48% 48%6-19 jobs in 5 years 6% 9% 14% 14% 11%20 or more jobs in 5 years 1% 10% 7% 17% 7%
It should be noted that while thoseentrepreneurs with graduate experience havethe highest growth expectations of their newventure (17%), they are in fact relative small innumber. On the other hand, while thepercentage of those entrepreneurs, with justsecondary school completed, that have highgrowth expectations of their new venture maybe lower (10%), the actual numbers ofbusinesses involved is much greater. The sameholds true for those with university or collegeexperience. It therefore follows that toconcentrate exclusively on those with thehighest levels of education as a source of highgrowth enterprises would be to ignore thesources of the greater number of businesseswith high growth potential.
2.6 Entrepreneurial FrameworkConditions
The key informants in each country were askedto identify the three framework conditions that,in their opinion, have the most significantimpact upon the entrepreneurial sector in theircountry.
The analysis of the data from each of the 29countries reveals that the three most importantframework conditions identified by the nationalexperts in 2001 were as follows:
• Cultural and Social Norms,
• Financial Support, and
• Government Policies.
18
The paragraphs that follow examine the overallGEM findings on each of these frameworkconditions.
2.6.1 Culture and Social Norms
GEM 2000 concluded that in the leastentrepreneurial active countries,entrepreneurship has little societal or culturalsupport and that fear of failure is considered amajor deterrent to entrepreneurial endeavour.GEM 2000 observed a significant differencebetween the characteristics of those countrieswith high levels of entrepreneurial activityamong its adult population and those with lessentrepreneurially active populations.
This observation is reinforced by the findings ofGEM 2001, which indicates that it is thegeneral attitude toward entrepreneurship thatis the most important of the cultural and socialnorms that influence the level ofentrepreneurship within a country. Thisincludes the public’s attitude toward, supportfor and understanding of the importance ofentrepreneurship in society.
The legitimacy of entrepreneurship in a specificculture is important in determining whether ornot an individual will choose to become anentrepreneur. Another key determinant is theprevailing attitude of society towards thosewho have tried and failed.
The key informants agree on the importance ofsuccessful role models in positively influencingsupport for entrepreneurship within a country.The media are perceived as having a powerfulrole to play here in raising the profile of
GEM 2001 Irish Report
entrepreneurs and in influencing a positiveattitude towards their activities.
Difficulties arise in those countries in whichthere is less entrepreneurial activity and where,consequently, fewer role models are available.According to the key informants, thesecountries are focused on efforts to get societyto simply accept entrepreneurship and toappreciate its wider economic benefits in theircommunities.
In the more entrepreneurially active countries,the focus is on the identification of ways ofencouraging women and minorities to be moreentrepreneurial, and here again the positive
Table 5: Experts’ Comments: Cultural and Social Norms
Cultural and Social Norms Differences Between Countries Common Themes Across Countries
More Encourage women andentrepreneurial minorities to be more Increase respect forcountries entrepreneurial entrepreneurs
Create mindset of creativityand innovation Lower fear of failure
Less Need for role modelsentrepreneurial Modify perception of wealthcountries Instill elementary aspects of creation
entrepreneurial mindset
2.6.2 Financial Support
GEM 2000 concluded that the moreentrepreneurially active a country is, the moredeveloped the sources of equity funding tendsto be. The availability of early-stage financing,either from informal sources such as privateindividuals or from formal sources such asventure capital funds, is greater amongcountries that have higher levels ofentrepreneurial activity.
Key informants in countries with lowentrepreneurial activity highlighted banking andaccess to debt capital as being of specialconcern, in particular the strong reliance onasset-based lending and the widely shared risk-adverse investment philosophy. Of particularconcern in the experts’ view is the inability ofthe banks in these countries to appropriatelyevaluate business deals.
In those same countries, the key informantswere also concerned about the financial
19
role that role models and the media can playwere identified by the key informants. The keyinformants within these countries also focusedon the need for a greater number of newenterprises to be created that have highgrowth potential.
Table 5 summarizes the views of all the keyinformants as to the improvements to thecultural and social norms that are requiredacross all countries in order to foster a higherlevel of entrepreneurial activity. The specificviews of the key informants in countries withhigh or low levels of entrepreneurial activityamong their adult population at present arealso summarized.
knowledge and skills of the entrepreneurs, forexample the ability of entrepreneurs to assesstheir capital needs; to identify potential sourcesof funds; and to negotiate deals.
In the more entrepreneurially active countries,the key informants were more concerned withthe ability to provide exit mechanisms forinvestors and the ability to earn money oninvestments, even when the deals were initiallyover-valued.
Table 6 summaries the views of all the keyinformants with regard to the commonchanges needed in their opinion across allcountries in order to strengthen the financialsupport available to entrepreneurs if a higherlevel of entrepreneurial activity is to beencouraged. The specific views of the keyinformants in countries with high or low levelsof entrepreneurial activity among their adultpopulation at present are also summarized.

Global Entrepreneurship Monitor
Table 6: Experts’ Comments: Financial Support
Financial Support Differences Between Countries Common Themes Across Countries
Improve the ability of lendingMore Improve the risk investment institutions and equity investorsentrepreneurial culture in the financial to assess entrepreneurialcountries community opportunities
Lower cost of capital forImprove banking and access entrepreneurs
Less to debt capitalentrepreneurial Modify inadequate regulationcountries Improve entrepreneurs’ by Government of the supply of
ability to assess capital needs capital
2.6.3 Government Policies
The experts in all of the GEM 2001 countriesidentified government policies in the area ofentrepreneurship as being important and inneed of attention. In countries with lowerlevels of entrepreneurial activity, the keyinformants focused on the need to improveoperational efficiencies in terms of the policiesand programmes that their governments arealready implementing in this area and the needfor a greater co-ordination between the variousprogrammes. In the more entrepreneuriallyactive countries, the key informants are moreconcerned with the need for their governmentsto take a more strategic approach to policyformulation in order to create the best climatefor entrepreneurship.
Key informants across all countries agreed onthe need for governments to deepen andextend their understanding of entrepreneurshipand its impact on the economy. For experts inthe less entrepreneurially active countries, the
Table 7: Experts’ Comments: Government Policy
Government Policies Differences Between Countries Common Themes Across Countries
Increase the long-term focus ofgovernment support for
More entrepreneurship Reduce administrative burdenentrepreneurial of regulatory compliancecountries Deepen government
understanding ofentrepreneurship
Increase coordination ingovernmental support Increase fiscal incentives to
Less initiatives stimulate entrepreneurialentrepreneurial initiativescountries Change government negative
perception of entrepreneurship
20
issue is image and awareness, both in terms ofthe need to overcome the general sense ofmistrust and disrespect that, in the opinion ofthe key informants, policy-makers have forentrepreneurs and the need to bring about amore supportive attitude towardsentrepreneurs and their activities among theirgeneral populations.
For experts in the more entrepreneurially activecountries, the issue is more about policyeffectiveness, including policies that reduce thebarriers to growth for young, emergingentrepreneurial enterprises.
Table 7 summarizes the views of all the keyinformants with regard to the commonchanges in government policy across all theGEM countries that are necessary, in theopinion of the key informants, in order tofoster a greater level of entrepreneurship. Thespecific views of the key informants incountries with high or low levels ofentrepreneurial activity among their adultpopulation at present are also summarized.

GEM 2001 Irish Report
2.7 Formal and Informal BusinessInvestment
There is a section in the 2001 GEM ExecutiveReport, specially written by William D,Bygrave, which takes a closer look at theavailability of informal finance and venturecapital for new enterprises and the relativeamounts invested through these means.
Policy makers often overlook the importanceof informal sources of finance andunderestimate its significance. While venturecapital is well known as a source of financingfor new enterprises, the flow of informalinvestment is in fact the source of the largestshare of the funds for new businesses. In allGEM 2001 countries, informal investorsallocated more money for start-ups andgrowing businesses than did professionalventure capital firms. On average across allGEM countries, for every one Euro of classic ortraditional venture capital that was invested,
Figure 7: Informal Investment by Country
All
Cou
ntrie
s8.00
7.00
6.00
5.00
4.00
3.00
2.00
1.00
0.00Per
sons
per
100
Adu
lts, 1
8Yrs
and
Old
er (9
5% C
onfid
ence
Inte
rval
)
Bel
gium
Japa
n
Sin
gapo
re
Isra
el
The
Net
herla
nds
Sw
eden
Rus
sia
Ger
man
y
Por
tuga
l
Fra
nce U
nite
d K
ingd
om
Spa
in
Den
mar
k
Nor
way Fin
land
Sou
th A
frica
Pol
and
Italy
Arg
entin
a
Can
ada
Indi
a
Hun
gary
U.S
.
Irela
nd
Bra
zil
Kor
ea
Aus
tralia
New
Zea
land
Mex
ico
Upper
Average
Lower
About 50% of informal funds go to familymembers and relatives; 30% goes to co-workers, friends and neighbours; and theremainder goes to ‘‘strangers with good ideas.’’This combined group of informal investors arealso known as ‘‘Business Angels’’.
21
there was an average of about \1.60 ofinformal capital invested.
It is estimated that informal investors, provide atotal of \215 billion in funds per year to start-up and growing companies in the participatingGEM countries. In the context of nationaleconomies, the total informal investment in theyear 2000 was 1.1% of the combined GDP forall GEM countries.
The proportion of adults, within the variousGEM countries, that was active as informalinvestors in 2001 averaged just over 3%, witha range from less than 1% in Brazil to over 6%in New Zealand. The rate of informalinvestment in Ireland is just above the midpoint for all GEM countries.
Figure 7 illustrates the level of informalinvestment by country.
The impact of classic venture capital is verysignificant for new and growing enterprises,although it is less important in terms of thetotal investment pool than informal investment.The companies that receive venture capitalfunding tend to grow faster and make a greater
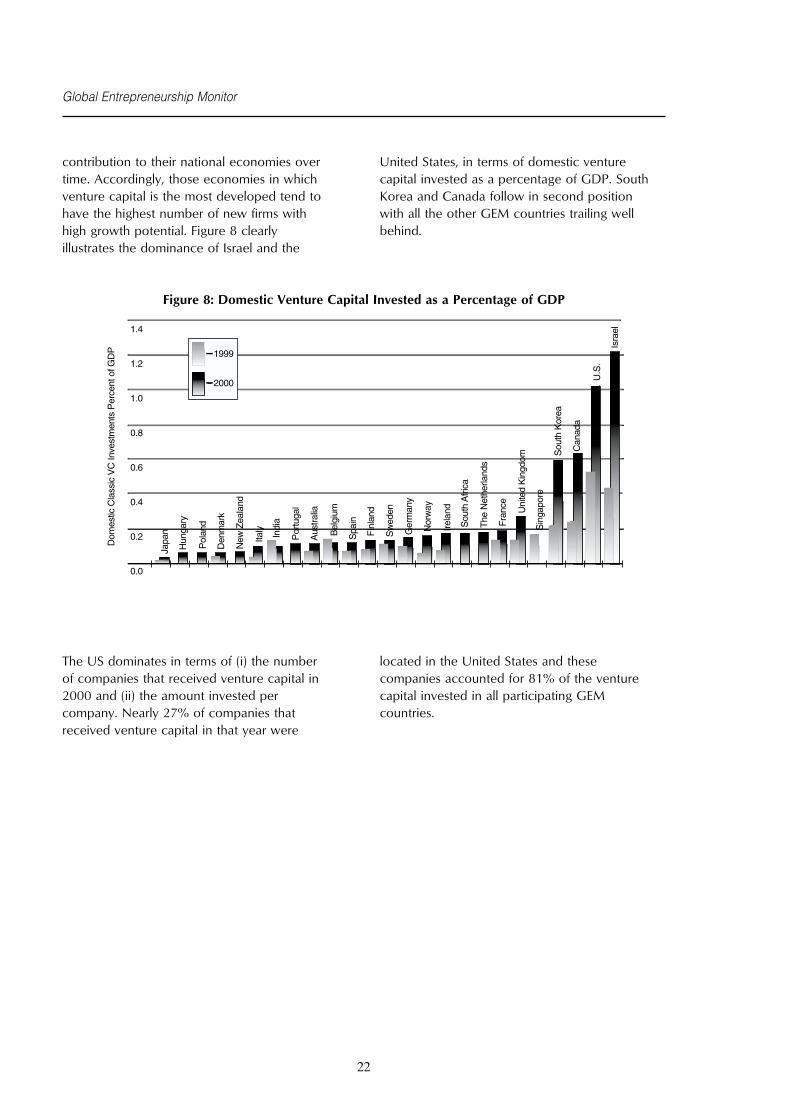
Global Entrepreneurship Monitor
contribution to their national economies overtime. Accordingly, those economies in whichventure capital is the most developed tend tohave the highest number of new firms withhigh growth potential. Figure 8 clearlyillustrates the dominance of Israel and the
Figure 8: Domestic Venture Capital Invested as a Percentage of GDP
1999
2000
1.4
1.2
1.0
0.8
0.6
0.4
0.2
0.0
Bel
gium
Japa
n Sin
gapo
re
Isra
el
The
Net
herla
nds
Sw
eden
Ger
man
y
Por
tuga
l
Fra
nce
Uni
ted
Kin
gdom
Spa
in
Den
mar
k
Nor
way
Fin
land
Sou
th A
frica
Pol
and
Italy
Can
ada
Indi
a
Hun
gary
U.S
.
Irela
nd
Sou
th K
orea
Aus
tralia
New
Zea
land
Dom
estic
Cla
ssic
VC
Inve
stm
ents
Per
cent
of G
DP
The US dominates in terms of (i) the numberof companies that received venture capital in2000 and (ii) the amount invested percompany. Nearly 27% of companies thatreceived venture capital in that year were
22
United States, in terms of domestic venturecapital invested as a percentage of GDP. SouthKorea and Canada follow in second positionwith all the other GEM countries trailing wellbehind.
located in the United States and thesecompanies accounted for 81% of the venturecapital invested in all participating GEMcountries.

CHAPTER 3
How Entrepreneurial is Ireland?
3.1 Introduction
In 2001, with sponsorship from Forfas andEnterprise Ireland, Ireland participated for thesecond time in GEM.
The paragraphs that follow detail the overallresults for Ireland as obtained from the adultpopulation survey carried out in September2001, from the expert key informant interviewscarried out slightly earlier in the year, and fromthe detailed questionnaires completed by thekey informants interviewed in 2000 and in2001. The environment for entrepreneurship inIreland relative to the entrepreneurialframework conditions is also examined. Finally,the entrepreneurial characteristics of the Irishadult population are analysed in the light of theGEM findings.
The GEM 2001 Global Executive Report ranksIreland 6th in terms of the overallentrepreneurial propensity of its adultpopulation across 29 countries. It should benoted that this is a revised result and correctsthe very low position that Ireland obtained inGEM 2000. For a full explanation of why theGEM 2000 Executive Report incorrectlyreported Ireland’s entrepreneurial ranking seeAppendix 1.
3.2 Overall Results
On the basis of the adult population survey for2001, the following results were obtained withregard to the level of entrepreneurial activity inIreland:
• 7.2% of the adult population arecurrently engaged in the process ofstarting a business. This level of activityranks Ireland in 12th position across the29 GEM countries.
• 4.8% of the adult population currently
17 High growth potential is defined as aspiring to employ 50 within 5 years.
23
partly or fully own and operate abusiness started since 1998. These are‘‘new firm’’ entrepreneurs. This level ofnew enterprise development placesIreland in 6th position.
• 82% of those actively involved in newentrepreneurial activity in Ireland areresponding to a perceived opportunityrather than being forced to do sothrough necessity. Ireland is ranked 5th
across the 29 GEM countries in termsof the proportion of its adult populationthat are pursuing opportunity drivenentrepreneurial activity.
• 3% of all nascent entrepreneurs believethat their new venture will have highgrowth potential.17 Ireland is rankedjoint 10th of the 29 countries in thisregard.
• The number of Business Angelsidentified among the Irish adultpopulation is just under 3.5 %. Thisplaces Ireland joint 12th and just abovethe average (3.1%) across all 29 GEMcountries.
Ireland’s overall entrepreneurial ranking (TEA)is 6th of the 29 GEM countries. This ranking isbased on the number of nascent and new firmentrepreneurs identified in each country’s adultpopulation survey.
In accordance with the general pattern acrosscountries, a greater number of Irish people areplanning new enterprises than have yet set upnew businesses.
The movement in Ireland’s relative rankingbetween nascent and new firm entrepreneurswould appear to indicate that either (i) Irelandhas a higher conversion rate of nascententrepreneurs (i.e. those planning new

Global Entrepreneurship Monitor
enterprises) into new firm entrepreneurs (i.e.those who have brought their entrepreneurialplans to reality) than is the norm across theGEM countries, or (ii) that there will be fewerfirms actually set up in the immediate futureand Ireland’s relative position in respect of newfirm entrepreneurs will decline as relativelyfewer people are actually planning newbusinesses at present.
From the available data it is not possible toascertain which is the correct interpretation toplace on these figures. The results of the 2002adult population survey, which will be carriedout shortly, should give further clarification inthis area.
Table 8: Summary of the Results for Ireland
Selective Measures of Highest Rate Average Rate Lowest Rate of Ireland’s Ireland’sEntrepreneurial Activity of all GEM of all GEM all GEM Rate Ranking
Countries Countries Countries18
Total Entrepreneurial Activity 18.7% (MX) 9.7% 4.5% (BE) 12.0% 6
Nascent Entrepreneurs 12.7% (MX) 6.3% 1.2% (IL) 7.2% 12
High Growth Nascent Start-Ups 7.0% 2.6% 0.0%19 3.0% 10(+)20
(ZA/NL/NO)
New Firm Entrepreneurs 7.2% (AU) 3.4% 0.8% (JP) 4.8% 6
Opportunity Driven Entrepreneurs 12.8% (NZ) 6.5% 2.0% (IL) 9.2% 5
Informal Investors 7.0% (NZ) 3.1% 1.0% 3.0% 12(+)20
(NL/BR/JP/PT)
The Irish key informants considered the framework condition the highest-ranking country,conditions prevailing in Ireland to be relatively the average score across all experts in all GEMfavorable to entrepreneurial activity. The countries, the lowest ranking country, the Irishquestionnaires, completed by 50 Irish key result and the relative position of Ireland. It alsoinformants, asked the experts to respond in terms illustrates the experts’ views on the relativeof a five point scale from True (5) to False (1). entrepreneurial characteristics of the adultTable 9 summarises for each entrepreneurial population.
18 International Country CodesAR = Argentina AU = Australia BE = Belgium BR = Brazil CA = CanadaDE = Germany DK = Denmark ES = Spain FI = Finland FR = FranceHU = Hungary IE = Ireland IL = Israel IN = India IT = ItalyJP = Japan KR = Korea MX = Mexico NL = Netherlands NO = NorwayNZ = New Zealand PL = Poland PT = Portugal RU = Russia SE = SwedenSG = Singapore UK = United Kingdom US = United States ZA = South Africa
19 No high growth nascent start-ups were identified in eight countries.20 More than one country was on this rank.
24
When the percentage of active entrepreneursis translated into numbers of people within theadult population, between the ages of 18-64,the results for Ireland indicate the following:
• Over 160,000 adults are currentlyengaged in the process of starting abusiness.
• Approximately 110,000 adults currentlypartly or fully own and operate abusiness started since 1998
• Almost 5,000 adults believe that thenew venture, which they are currentlyplanning, will employ at least 50 peopleafter 5 years from the start of the newenterprise.

GEM 2001 Irish Report
Table 9: Summary of all Experts’ Evaluations
Variable Description High Score Average Score Low Score Ireland Score Ireland Rank
Finance — Ease of Access 4.10 (US) 3.12 1.79 (AR) 3.64 5
Finance — Presence of VC,Business Angel and Other 4.49 (US) 3.02 1.85 (BR) 3.66 3
Cultural and Social Norms 3.64 (US) 2.43 1.89 (SE) 2.99 3
Cultural and Social Norms —Acceptance of CareerVolatility 4.32 (US) 3.50 2.92 (JP) 3.61 9
Government Policy 3.20 (DE) 2.71 1.37 (AR) 3.14 6
Government Policy — Ease,Speed and Lack of RegulatoryBurden 3.54 (SG) 2.23 1.22 (AR) 3.24 2
Government Programme —Efficiency and Effectiveness 3.57 (GER) 2.66 1.42 (AR) 3.16 6
Education and TrainingEffectiveness 2.79 (SG) 2.14 1.55 (PT) 2.60 3
Research and DevelopmentTransfer Effectiveness 3.24 (BE) 2.39 1.86 (AR) 2.69 9
Professional and CommercialInfrastructure 3.89 (US) 3.18 1.94 (JP) 3.49 5
Market Stability 3.64 (JP) 2.82 2.13 (NOR) 2.45 18
Relative Lack of Barriers toMarket Entry 3.44 (US) 2.63 1.22 (ZA) 2.93 8
Access to PhysicalInfrastructure 4.46 (SG) 3.82 2.88 (IN) 3.04 22
Entrepreneurial Opportunity 4.20 (US) 3.26 2.46 (AR) 3.74 2
Entrepreneurial Capacity(Skills) 3.13 (US) 2.40 1.77 (JP) 2.71 5
Entrepreneurial Capacity(Motivation) 4.49 (US) 3.37 2.84 (NO) 3.94 4
3.3 Backdrop to Entrepreneurship inIreland
In common with the other developedcountries, the factors that are of particularconcern to Ireland are the relativecompetitiveness of its environment for businessrelative to other countries; the level ofentrepreneurial activity of its adult population;and the proportion of its adult population thatare pursuing perceived opportunities.
While Ireland ranks relatively well on theentrepreneurial dimensions, 6th in overallentrepreneurial activity and 5th in terms ofproportion of opportunity entrepreneurship, itsrelative competitiveness rating is underpressure due to infrastructural shortcomings. Inthe 2002 World Competitiveness Yearbook,Ireland’s relative position on the World
21 The World Competitiveness Yearbook: 2002. Lausane, Switzerland International Institute for Management Development.
25
Competitiveness Index21 was 10th, representinga decrease in the country’s relative ranking forthe second year in a row (previous rankingswere 7th and 5th).
Table 10 illustrates Ireland’s relative ranking forsome of the various dimensions that go tomake up the World Competitiveness Index.Ireland is well positioned on most of thedimensions that affect the national frameworkconditions. While the low ranking oninfrastructure should come as no surprise,deficits in the availability and relative cost oftelecommunications and in the necessaryinfrastructure for exporting, can be a significantinhibitor of entrepreneurial activity and growthin a country like Ireland. With a small homemarket, new ventures, if they are to grow, mustexport at an early stage in their development.

Global Entrepreneurship Monitor
Table10: Ireland’s Relative Position
World Competitive Index Rankings (Gem Countries Only)22
Ireland’s RankingHighest Ranking GEM Lowest Ranking GEM (relative to GEM
Country Country countries only)
Economic Performance(Domestic Economy) USA Argentina 2nd
Government Efficiency Singapore Argentina 4th
Business Efficiency USA Argentina 6th
Infrastructure USA India 17th
3.4 Key Entrepreneurial FrameworkConditions: Ireland’s RelativePosition
The 36 key informants interviewed in Ireland23
were asked to highlight the three frameworkconditions that they considered to have themost important impact on the entrepreneurialsector in Ireland. As was the case in themajority of countries surveyed, these expertscited the following:
• Financial Support,
• Cultural and Social Norms, and
• Government Policy.
The paragraphs that follow summarise Ireland’sstanding on each of these conditions asperceived by the key informants.
3.4.1 Financial Support
In terms of adequate availability of debt andequity funding for new and growing firms andthe availability of sufficient governmentsubsidies in this area24, the Irish experts gave arelatively high rating. As Table 11 illustrates,comparing across countries, Ireland came out5th in terms of the satisfaction rating of itsexperts25. Experts in the US, Germany and theNetherlands gave the highest ratings to thesituation prevailing in their countries in thisregard. The experts in Argentina and Mexicoconsidered the situation in their countries to bethe most unsatisfactory with regard to
22 The World Competitiveness Yearbook: 2002. Lausane, Switzerland International Institute for Management Development.23 In Ireland, the thirty-six experts interviewed included government officials, development and support agency executives, private
sector providers of advice, supports and finance to new enterprises, academics and successful entrepreneurs.24 Finance- Ease of Access variables.25 It should be pointed out that the experts were only asked to comment on the situation within their own country. It is only after
all the results are collected and compared across countries that the relative position emerges.
26
entrepreneurs trying to finance their new andgrowing businesses.
The key informants were also asked for theiropinion on the situation in their country withregard to the availability of informal (‘‘BusinessAngel’’) and formal (Venture Capital) riskcapital and the relative importance of IPOs asan important source of equity. The Irishexperts’ views placed Ireland 3rd in this regard.However, quite a number of countriesreceived a broadly similar rating from their keyinformants. Not surprisingly, the US scoredparticularly well and far ahead of the othercountries. Once again, it was the experts in theless developed countries, such as Brazil,Hungary and Argentina that considered thattheir entrepreneurs have major difficulties inthis area.
The level of Business Angel investment,however, was much higher among the keyinformants than it was among the general adultpopulation. Of the key informants, 38%confirmed that they had personally providedfunds, in the last three years, for a newbusiness start-up that was not their own. Someexperts suggested that much of this businessangel activity is going to hi-tech, high-growthfirms and that the entrepreneurs with lesssophisticated and smaller-scale enterprises findit difficult to get access to this type of informalinvestment.
Ireland scored well in terms of the financialsupport available to entrepreneurs in thecountry as Table 11 illustrates.

GEM 2001 Irish Report
Table 11: Experts’ Evaluations: Financial Support
Variable Description High Score Average Score Low Score Ireland Score Ireland Rank
Finance — Ease of Access 4.10 (US) 3.12 1.79 (AR) 3.64 5
Finance — Presence of VC,Business Angel and Other 4.49 (US) 3.02 1.85 (BR) 3.66 3
Most of the Irish key informants point out thateven in the current more cautious climate,there is more venture capital available nowthan there was in the past. They do, however,highlight a lack of seed capital as a problem.The difficulty entrepreneurs have in securingrelatively small amounts of money iscompounded by the amount of paperworkinvolved.
Some claimed that sources of capital in Ireland,including the banks, are less interested in thenumerous smaller-scale new ventures than theyare in the relatively small number of hi-techstarts, that are perceived to have high growthpotential.
3.4.2 Cultural and Social Norms
In terms of the questions posed to the keyinformants with regard to cultural and socialnorms, the first set related to the value placedon self-sufficiency, the relative protectionoffered by social welfare support and theacceptance of income diversity. The expertsfrom the US considered that self-sufficiencywas well developed within their country, whilethe Nordic counties, particularly Sweden,
Table 12: Experts’ Evaluations: Cultural and Social Norms
Variable Description High Score Average Score Low Score Ireland Score Ireland Rank
Cultural and Social Norms 3.64 (US) 2.43 1.89 (SE) 2.99 3
Cultural and Social Norms —Acceptance of CareerVolatility 4.32 (US) 3.50 2.92 (JP) 3.61 9
Culture was a predominant theme raised bythe key informants during the one-to-oneinterviews. Overall, the Irish expert informantssuggested that the cultural and social norms inIreland have improved over the last decadewith regard to their acceptance and support of
27
which have a very well established socialsupport system and a greater culture ofequality, were less well positioned. The viewsof the Irish key informants placed Ireland 3rd
highest on this measure.
The second set of questions related to thegeneral value placed on personal initiative andindependence, attitudes to working with newand growing firms and with employmentvolatility. Across all countries, the keyinformants response seemed to affirm thatthere was a high value placed within theircountries on these factors. The experts in theUS were the most positive in the expression oftheir views, while the views of the keyinformants in Japan indicated a greaterconservatism on the part of the generalpopulation in that country. The views of theIrish experts placed Ireland 9th of the GEMcountries in this regard. In effect, their scoringon this group of questions was just above theaverage for the GEM countries, as manycountries were grouped around a relativelypositive score.
Table 12 illustrates the spread in the views ofthe key informants in respect of both measuresfor cultural and social norms.
entrepreneurship and that fear of failure is nolonger as much of a deterrent as it was in thepast.
Analysing the questionnaires completed by theIrish key informants, fear of failure would deter
Global Entrepreneurship Monitor
only 15% of them from entrepreneurialendeavours. It would, however, deter 42% ofthe general adult population from becomingentrepreneurs. While this may be a smallernumber than in the past, it is still represents arelatively high proportion of the adultpopulation that would be deterred by fear offailure. In this regard, Ireland ranked 5th highestamong the GEM countries. For Poland andGermany this is an even greater issue, while inthe United States, it offers relatively the lowestbarrier to entrepreneurial activity.
Many experts commented that Ireland in effecthad been transformed from a country in whichentrepreneurial endeavour was very much theexception, and all such ventures wereconsidered high risk, to a much more positiveenvironment brought about by a sustainedperiod of continued economic growth,perceived opportunity and the emergence ofhigh profile successful entrepreneurs. This isconfirmed by the results of the adultpopulation survey which indicate that 49% ofthe general Irish adult population knowsomeone personally who has started a businessin the last two years.
In this, Ireland is joint second with Sweden andAustralia of all the GEM countries, with Finlandin first position. This ranking reflects thesignificant increase in recent times in the levelof entrepreneurial activity in Finland.
Many of the experts commented on theoutward orientation of the younger generationand suggested that Ireland now has a younggeneration who are ambitious, confident andoutward focused. However, as one expertwarned:
‘‘While young Irish people are moreconfident than in the past, and that is agood thing, there is an ‘‘arrogance’’creeping in that the world owes them aliving and that would not be healthy. Abalance is needed’’
One of the problems highlighted by theexperts in relation to cultural norms, was thetendency of Irish people to focus on the
28
achievement of the individual entrepreneurrather than on the other broad basedeconomic benefits of entrepreneurship. This isalso reflected in the media coverage ofentrepreneurship. The key informants statedthat the media and Irish people, in general,give almost too much admiration to successfulentrepreneurs who have become ‘‘seriously’’wealthy.
One of the key informants summed it up inthis way:
‘‘Entrepreneurial success is measuredpurely in terms of the personal wealth ofindividuals with no focus or emphasis as tothe wider contributions of entrepreneurs.Often it is the ‘‘money’’ that is admired,not the achievement,’’
There is an inherent danger in this. Some ofthe experts were concerned that the currentwave of tribunals and investigations might addto the general sense of unease surrounding themanner in which certain entrepreneurs havebecome successful. If the goodwill that isincreasing towards entrepreneurship is basedon a culture of personality, then should any ofthese individuals ‘‘fall from grace’’ for whateverreason, the goodwill and general supporttowards entrepreneurship could evaporate.
3.4.3 Government Policies
In an overall measure of Government policysupport for entrepreneurship, the keyinformants across all countries were generallyneutral in their views. Germany received themost positive rating from its experts in thisregard, while those in Argentina were the leastpositive. The views of the key informants inIreland ranked the country 6th across the 29GEM countries.
With regard to the ease and speed with whichnew and growing firms can interact withGovernment and regulatory authorities, andtheir relative fiscal burden, there wasconsiderable variation across countries. Thekey informants in Ireland rated Ireland’sposition second only to Singapore with regardto its positive support for new and growingfirms in these areas. The key informants in

GEM 2001 Irish Report
Argentina considered that in general theirGovernment’s policies towardsentrepreneurship were the least supportive ofall the GEM countries.
Table 13 illustrates the spread in the views of
Table 13: Experts’ Evaluations: Government Policy
Variable Description High Score Average Score Low Score Ireland Score Ireland Rank
Government Policy 3.20 (DE) 2.71 1.37 (AR) 3.14 6
Government Policy — Ease,Speed and Lack of RegulatoryBurden 3.54 (SG) 2.23 1.22 (AR) 3.24 2
In their one-to-one interviews with members ofthe Irish GEM team, several of the keyinformants commented that they believed thatthere was a poor understanding ofentrepreneurship among the policymakers andthe agencies delivering programmes. Ingeneral, they felt that the agencies hadstagnated; had become too bureaucratic; andwere not prepared to take the risks that areassociated with supporting and encouragingentrepreneurship.
They also suggested that enterprise policy doesnot focus sufficiently on encouraging thegrowth of the entrepreneurial sector. Theyclaimed that as a result of both governmentregulations and the very dominant positionheld by the established incumbents in manysectors of the Irish economy, it was verydifficult for new entrants to establishthemselves in the market. This, they believe,tended to be anti-competitive and militatedagainst new opportunities opening up forentrepreneurs.
Another of the issues which the experts raisedwas their belief that there was a lack of a realunderstanding of issues facing growing exportorientated business. They commented that thesmall size of Irish home market necessitatedexports from an early stage and that it is vitalto help those with export potential to becomeexporters of substance.
29
the key informants across all GEM countries inrespect of the effectiveness of the supportoffered by government policy, in theircountries, to supporting entrepreneurs andnurturing entrepreneurship.
3.5 The Other EntrepreneurialFramework Conditions
There are six other entrepreneurial frameworkconditions about which GEM questioned thekey informants, both in the one-to-oneinterviews and in the questionnaires that theycompleted. These are as follows:
• Government Programmes,
• Education and Training,
• R&D Transfer,
• Commercial and ProfessionalInfrastructure,
• Internal Market Openness, and
• Access to Physical Infrastructure.
The paragraphs that follow briefly examine theviews of the expert informants with regard tothese framework conditions.
3.5.1 Government Programmes
This framework condition is obviously closelyrelated to government policy. It relates to therelative effectiveness of the developmentagencies, access to their programmes, theknowledge of their executives and the relativesupport offered to new and growing firms bybusiness parks.
There was a great degree of variation in theviews expressed by the various national key

Global Entrepreneurship Monitor
informants in this area. Most positive abouttheir government policy in this area, theGerman key informants were also the mostpositive in their overall assessment of theoperation of their programmes. Argentina, inthe view of its key informants, was once againthe least effective. The views of the Irish key
Table 14: Experts’ Evaluations: Government Programmes
Variable Description High Score Average Score Low Score Ireland Score Ireland Rank
Government Programme —Efficiency and Effectiveness 3.57 (GER) 2.66 1.42 (AR) 3.16 6
Several Irish informants expressed concern thatcertain new enterprises may be ‘‘fallingbetween the development agencies’’, beingtoo small in scale and growth potential forEnterprise Ireland to be interested in them andtoo large to be assisted by the CountyEnterprise Boards. Some experts also felt thatthe proliferation of agencies and programmesmay cause confusion.
The role, which mentors with the relevantdegree of experience and skills, can bring to anew and growing enterprise, is widelyrecognised. Several of the key informantssuggested that there is a shortage of goodguidance from suitably experienced mentorsfor the more sophisticated, high-tech, highgrowth new ventures.
3.5.2 Education and Training
GEM 2000 indicated that the general level ofeducation within a population had a closecorrelation with the relative rate ofentrepreneurial activity within a country. GEM2001 has further added to this finding. In thosecountries in which opportunityentrepreneurship is the dominant motivator,the greatest level of entrepreneurial activitytakes place among those who have completed
Table 15: Experts’ Evaluations: Education and Training
Variable Description High Score Average Score Low Score Ireland Score Ireland Rank
Education and TrainingEffectiveness 2.79 (SG) 2.14 1.55 (PT) 2.60 3
30
informants placed Ireland well within the topquadrant in this regard. Table 14 illustrates thespread of opinion among the GEM nationalexperts with regard to the efficiency andeffectiveness of their national government’sprogrammes supporting entrepreneurship.
second level education. For women, those withthe highest levels of education were the mostactive in pursuing entrepreneurial opportunity.Moreover, the scale of the aspirations for theirnew ventures increases for both men andwomen, as the educational attainment level ofentrepreneurs increases.
GEM 2001 has shown that those who believethat they have the particular skills to besuccessful in setting-up and running a newbusiness are six times more likely to becomeentrepreneurs, than are those who feel thatthey lack the necessary skills. This highlightsthe importance of entrepreneurial specificeducation and training.
This entrepreneurial framework conditionreceived the lowest satisfaction rating from allthe national experts. The key informants acrossall the GEM countries were simply notimpressed with the quality and effectiveness oftheir education and training systems to foster,encourage and empower new entrepreneursand a spirit of entrepreneurship within theircountries. In Singapore, the rating by theexperts was the most positive, while that withinPortugal was perceived to be the mostinadequate. Table 15 illustrates the spread ofnational expert opinion in this regard.
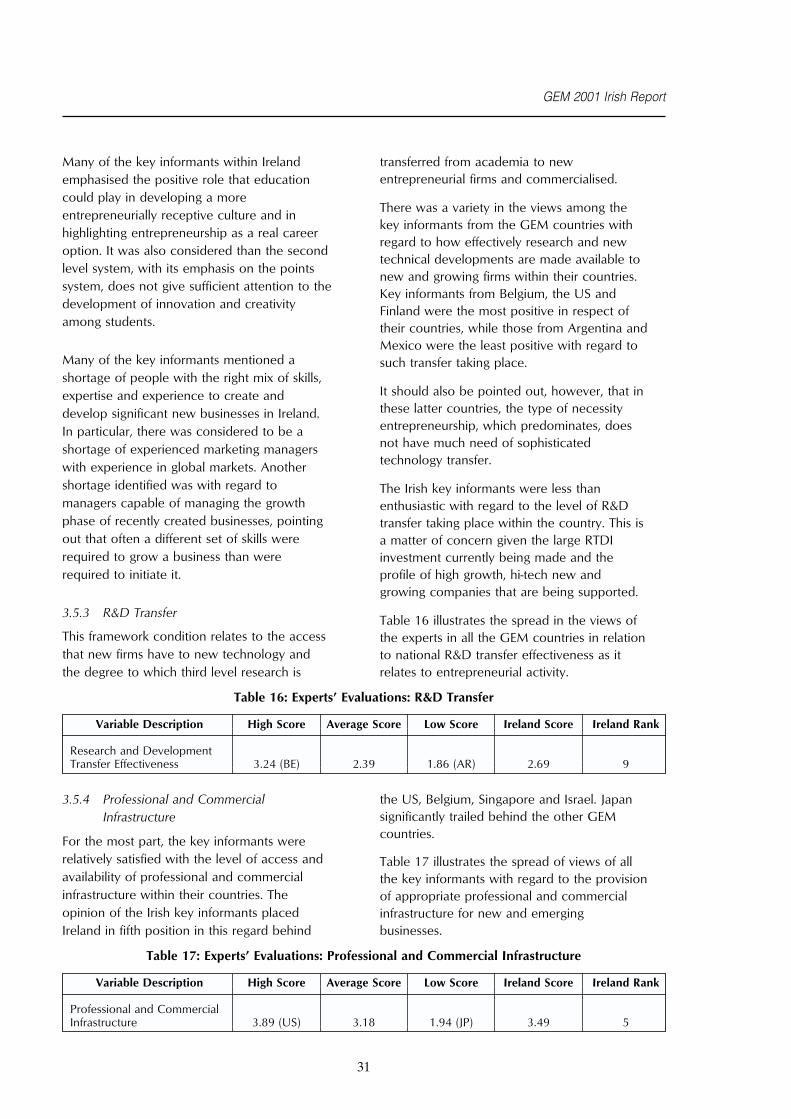
GEM 2001 Irish Report
Many of the key informants within Irelandemphasised the positive role that educationcould play in developing a moreentrepreneurially receptive culture and inhighlighting entrepreneurship as a real careeroption. It was also considered than the secondlevel system, with its emphasis on the pointssystem, does not give sufficient attention to thedevelopment of innovation and creativityamong students.
Many of the key informants mentioned ashortage of people with the right mix of skills,expertise and experience to create anddevelop significant new businesses in Ireland.In particular, there was considered to be ashortage of experienced marketing managerswith experience in global markets. Anothershortage identified was with regard tomanagers capable of managing the growthphase of recently created businesses, pointingout that often a different set of skills wererequired to grow a business than wererequired to initiate it.
3.5.3 R&D Transfer
This framework condition relates to the accessthat new firms have to new technology andthe degree to which third level research is
Table 16: Experts’ Evaluations: R&D Transfer
Variable Description High Score Average Score Low Score Ireland Score Ireland Rank
Research and DevelopmentTransfer Effectiveness 3.24 (BE) 2.39 1.86 (AR) 2.69 9
3.5.4 Professional and CommercialInfrastructure
For the most part, the key informants wererelatively satisfied with the level of access andavailability of professional and commercialinfrastructure within their countries. Theopinion of the Irish key informants placedIreland in fifth position in this regard behind
Table 17: Experts’ Evaluations: Professional and Commercial Infrastructure
Variable Description High Score Average Score Low Score Ireland Score Ireland Rank
Professional and CommercialInfrastructure 3.89 (US) 3.18 1.94 (JP) 3.49 5
31
transferred from academia to newentrepreneurial firms and commercialised.
There was a variety in the views among thekey informants from the GEM countries withregard to how effectively research and newtechnical developments are made available tonew and growing firms within their countries.Key informants from Belgium, the US andFinland were the most positive in respect oftheir countries, while those from Argentina andMexico were the least positive with regard tosuch transfer taking place.
It should also be pointed out, however, that inthese latter countries, the type of necessityentrepreneurship, which predominates, doesnot have much need of sophisticatedtechnology transfer.
The Irish key informants were less thanenthusiastic with regard to the level of R&Dtransfer taking place within the country. This isa matter of concern given the large RTDIinvestment currently being made and theprofile of high growth, hi-tech new andgrowing companies that are being supported.
Table 16 illustrates the spread in the views ofthe experts in all the GEM countries in relationto national R&D transfer effectiveness as itrelates to entrepreneurial activity.
the US, Belgium, Singapore and Israel. Japansignificantly trailed behind the other GEMcountries.
Table 17 illustrates the spread of views of allthe key informants with regard to the provisionof appropriate professional and commercialinfrastructure for new and emergingbusinesses.

Global Entrepreneurship Monitor
3.5.5 Internal Market Openness
GEM combined two sets of measures toascertain the relative openness of the internalnational market to entrepreneurial ventures.The first measured the relative stability for themarket for consumer and business goods andservices. A high score here reflected a highdegree of volatility in the market and rapidchange. Japan’s market in the opinion of itsexperts was the most prone to rapid change,while Ireland’s was much less volatile andmore predictable. On this measure Ireland wasranked 18th of all GEM countries.
Table 18: Experts’ Evaluations: Internal Market Openness
Variable Description High Score Average Score Low Score Ireland Score Ireland Rank
Market Stability 3.64 (JP) 2.82 2.13 (NOR) 2.45 18
Relative Lack of Barriers toMarket Entry 3.44 (US) 2.63 1.22 (ZA) 2.93 8
3.5.6 Access to Physical Infrastructure
Singapore, in the view of its key informants,has the most accessible, affordable andsupporting physical infrastructure of all theGEM countries. New enterprises in Finland,New Zealand and the United States are all wellprovided in this respect in the view of theirnational key informants. The key informantsfrom the less developed economies were thosewho highlighted major deficiencies in this area,with India being ranked the least favourable inthis regard by its key informants.
Again and again in their interviews, the Irishkey informants drew attention to nationalinfrastructural deficiencies. Mentioned inparticular were the shortage and excessive cost
Table 19: Experts’ Evaluations: Physical Infrastructure
Variable Description High Score Average Score Low Score Ireland Score Ireland Rank
Access to PhysicalInfrastructure 4.46 (SG) 3.82 2.88 (IN) 3.04 22
3.6 Entrepreneurial Characteristicsamong the Irish People
The adult survey, and theinterviews/questionnaires completed by theexperts or key informants when taken together
32
The second measure focused in particular onassessing the relative national barriers to newfirm formation and growth. The views of thenational experts placed Ireland in 8th positionin this regard. The country with most openaccess for entrepreneurial activity in the viewsof its key informants was the US, followed bythe UK and the Netherlands.
The spread of the views of all the experts interms of the relative openness of their nationalmarkets is illustrated in Table 18. This tableillustrates both measures separately.
of appropriate infrastructure for exporters(communications and transport). This isparticularly inhibiting in a small island statewhose small domestic market gives rise to theneed for the majority of companies to exportfrom an early stage. The subject of the costand availability of sites and accommodation fornew enterprises was also mentionedrepeatedly, as was the availability and cost oftelecommunications infrastructure.
Table 19 illustrates the spread of opinionamong national experts in relation to theaccessibility by entrepreneurs to appropriatephysical infrastructure within their countries. Inthis regard, Ireland is given a relatively lowrating by the key informants. This rating ranksIreland 22nd of all the 29 GEM countries.
give an interesting insight into theentrepreneurial characteristics of the Irishpeople, particularly with regard to theperception of entrepreneurial opportunity, andthe capacity of the Irish people, in terms of

GEM 2001 Irish Report
motivation and skills, to avail themselves ofthese perceived opportunities. They also givean insight into attitudes to failure as aninhibitor of entrepreneurial activity. The adultsurvey is also very useful as a means ofidentifying the age and gender of thosecurrently active as entrepreneurs. Theparagraphs that follow explore each of theseissues in turn.
3.6.1 Entrepreneurial Opportunity
The adult population survey clearly shows thatIreland has a high level of entrepreneurialactivity among its adult population and that themajority of this endeavour is driven by thedesire to capitalise upon a perceivedopportunity.
GEM has demonstrated that those who believethat there are good opportunities to create anew business are three times more likely to doso than are those who do not have such abelief. In response to a specific question put toall those questioned in the adult population,one in three of the general adult population inIreland indicated that they believed that therewould be good opportunities to start a newbusiness, within the next six months, in thearea in which they were living. A similarproportion of adults in the US expressed a
Table 20: Experts’ Evaluations: Entrepreneurial Opportunity
Variable Description High Score Average Score Low Score Ireland Score Ireland Rank
Entrepreneurial Opportunity 4.20 (US) 3.26 2.46 (AR) 3.74 2
Echoing the comments expressed by many ofthe Irish key informants during their interviews,the key informants’ opinion placed Ireland firstin terms of the experts’ views as to whethergood opportunities for new firms hadconsiderably increased in their respectivecountries in the last five years.
3.6.2 Entrepreneurial Capacity
Entrepreneurial capacity consists of both theskills and experience of the adult population tosuccessfully create and run new enterprisesand of their degree of motivation to do so.
GEM has demonstrated that those whobelieved that they have the necessary skills to
33
similar view. This placed Ireland 13th of the 29GEM countries in this regard. Of all GEMcountries, the most positive in their view of theopportunities that would exist in the nearfuture to start a new business were the adultsin the Nordic countries, in particular in Norway(59%) and in Finland (55%).
The national experts were also asked for theiropinion as to the opportunities that existed tocreate and develop successful new enterpriseswithin their countries. In their questionnairesthis issue of entrepreneurial opportunity wasaddressed in five separate questions, whichwere then combined, to give a single measureto reflect their considered opinion.
In general, these experts were very positivewith regard to the existence within theircountries of opportunities for entrepreneurialactivity. By the strength of their response, theIrish experts placed Ireland second only to theUnited States of all the GEM countries in termsof the positive environment that exists withinthis country at present for entrepreneurialendeavour.
Table 20 illustrates the spread of the views ofthe key informants with regard to the existenceof entrepreneurial opportunity within theirrespective countries.
successfully create and run new enterpriseswere six times as likely to be active asentrepreneurs as were those who believed thatthey lacked the necessary skills.
Each person interviewed as part of the adultsurvey was asked whether they believed thatthey had the knowledge, skill and experiencerequired to start a new business. The averagepositive response across all GEM countries wasthat 40% of adults indicated that they believedthat they had the required mix of skill andexperience to set up a new business. Justunder half of the Irish adults surveyed (46%)responded positively to this question. This
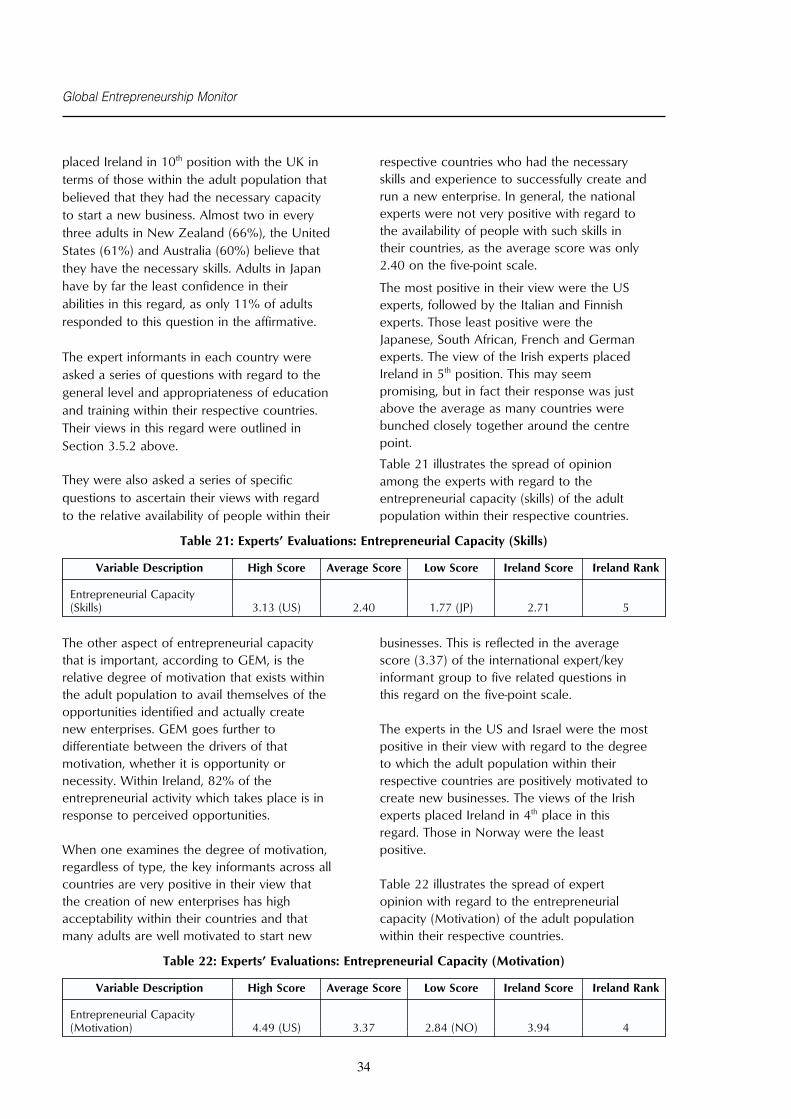
Global Entrepreneurship Monitor
placed Ireland in 10th position with the UK interms of those within the adult population thatbelieved that they had the necessary capacityto start a new business. Almost two in everythree adults in New Zealand (66%), the UnitedStates (61%) and Australia (60%) believe thatthey have the necessary skills. Adults in Japanhave by far the least confidence in theirabilities in this regard, as only 11% of adultsresponded to this question in the affirmative.
The expert informants in each country wereasked a series of questions with regard to thegeneral level and appropriateness of educationand training within their respective countries.Their views in this regard were outlined inSection 3.5.2 above.
They were also asked a series of specificquestions to ascertain their views with regardto the relative availability of people within their
Table 21: Experts’ Evaluations: Entrepreneurial Capacity (Skills)
Variable Description High Score Average Score Low Score Ireland Score Ireland Rank
Entrepreneurial Capacity(Skills) 3.13 (US) 2.40 1.77 (JP) 2.71 5
The other aspect of entrepreneurial capacitythat is important, according to GEM, is therelative degree of motivation that exists withinthe adult population to avail themselves of theopportunities identified and actually createnew enterprises. GEM goes further todifferentiate between the drivers of thatmotivation, whether it is opportunity ornecessity. Within Ireland, 82% of theentrepreneurial activity which takes place is inresponse to perceived opportunities.
When one examines the degree of motivation,regardless of type, the key informants across allcountries are very positive in their view thatthe creation of new enterprises has highacceptability within their countries and thatmany adults are well motivated to start new
Table 22: Experts’ Evaluations: Entrepreneurial Capacity (Motivation)
Variable Description High Score Average Score Low Score Ireland Score Ireland Rank
Entrepreneurial Capacity(Motivation) 4.49 (US) 3.37 2.84 (NO) 3.94 4
34
respective countries who had the necessaryskills and experience to successfully create andrun a new enterprise. In general, the nationalexperts were not very positive with regard tothe availability of people with such skills intheir countries, as the average score was only2.40 on the five-point scale.
The most positive in their view were the USexperts, followed by the Italian and Finnishexperts. Those least positive were theJapanese, South African, French and Germanexperts. The view of the Irish experts placedIreland in 5th position. This may seempromising, but in fact their response was justabove the average as many countries werebunched closely together around the centrepoint.
Table 21 illustrates the spread of opinionamong the experts with regard to theentrepreneurial capacity (skills) of the adultpopulation within their respective countries.
businesses. This is reflected in the averagescore (3.37) of the international expert/keyinformant group to five related questions inthis regard on the five-point scale.
The experts in the US and Israel were the mostpositive in their view with regard to the degreeto which the adult population within theirrespective countries are positively motivated tocreate new businesses. The views of the Irishexperts placed Ireland in 4th place in thisregard. Those in Norway were the leastpositive.
Table 22 illustrates the spread of expertopinion with regard to the entrepreneurialcapacity (Motivation) of the adult populationwithin their respective countries.
GEM 2001 Irish Report
Fear of failure is considered to be a factor inlowering the motivation of people to becomeentrepreneurs. This factor is closely associatedwith the social and cultural norms of aparticular society. All of the adults questionedas part of the adult population surveys wereasked whether fear of failure would preventthem from starting a new business.
One in three of the adult populations across allGEM countries indicated that fear of failurewould prevent them from trying to start a newenterprise. Those least deterred by the fear offailure were in the US, while for those forwhom it was the strongest demotivator were inPoland and Germany, where more than one intwo indicated that that fear of failure wouldprevent them even trying to becomeentrepreneurs. A high level of cautiousness wasalso detected in Ireland, where 42% of theadults interviewed indicated that fear of failurewould prevent them from starting a newbusiness. There were only four countries thathad a higher response rate to this questionthan Ireland. Obviously, a fear of failure is stillvery pervasive in this country among thegeneral adult population, despite the boost tothe national confidence that the recent years ofgrowth and prosperity have given.
Within the key informant group, however, thisemotion is much less an inhibitor ofentrepreneurial activity. Less than 15% of theIrish key informants indicated that fear offailure would prevent them from becomingentrepreneurs. This is broadly in line with theUS key informants expressed position. Theexperts in 21 of the GEM countries indicatedhigher levels of concern concerning the powerof failure as an inhibitor of entrepreneurialactivity than did those in Ireland.
3.6.3 Age and Gender of Entrepreneurs
Section 2.5 above details the results of theGEM research with regard to the personalcharacteristics of entrepreneurs, including thatrelated to gender and age. Drawing upon theadult population survey, this section describesthe characteristics of Irish entrepreneurs inthese terms.
Across the 29 GEM countries, 70% of all adultsidentified, as being entrepreneurially active,
35
were men. The same pattern prevails in Irelandwith regard to gender representation amongactive entrepreneurs. There is, however, aslightly higher percentage of women nascententrepreneurs (32.5% of all nascententrepreneurs, i.e. those actively planning newbusinesses in Ireland), than there are new firmentrepreneurs (27% of all new firmentrepreneurs, i.e. those who have establisheda new enterprise in the 42 months prior to theadult survey). This may be an indication thatincreasingly more women will become activeas entrepreneurs. It is also true, however, thatmore people plan to become entrepreneursthat in fact realise their ambition. Research inDenmark has shown that women seek moreadvice and support in their efforts to becomeentrepreneurs than do men. Hence, a greaterlevel of support may be necessary to convertthese nascent female entrepreneurs into newfirm entrepreneurs i.e. entrepreneurs who havetaken their entrepreneurial endeavours beyondthe planning stage.
There are indications that the mostentrepreneurially active age group in Irelandfor both men and women is that between 18and 34. This holds true in Ireland for bothnascent and new firm entrepreneurs. This issomewhat unusual. The younger age group isusually the more entrepreneurially active in theless developed countries where those activetend to be less educated and are driven bynecessity into entrepreneurial activity.
The 2001 adult survey for Ireland does notcontain information on the educationalattainment level of those interviewed. Hence, itis not possible to analyse thegender/age/educational attainment of Irishentrepreneurs further. The 2002 adult surveywill, however, contain this information and thuswill facilitate further analysis of this nature.
3.7 Conclusion
GEM suggests that entrepreneurial activity inIreland has four important features. These areas follows:
(i) Entrepreneurial activity in Ireland ischaracterized by the response ofentrepreneurs to perceived

Global Entrepreneurship Monitor
opportunities (‘‘pull’’). Ireland is ranked5th of the 29 GEM countries in thisregard;
(ii) Irish entrepreneurs tend to come froma younger age group than would beexpected for a country characterizedby a developed economy andopportunistic entrepreneurship;
(iii) Ireland’s relative ranking (6th) is muchhigher for those who have actuallystarted new businesses in the 42months prior to the adult survey, thanthose who are actively planning newbusiness (12th); and
(iv) Fear of failure is a powerful deterrentdiscouraging entrepreneurial activity inIreland among a considerableproportion of the general adultpopulation26.
GEM reports in the years ahead will indicate ifthese features of entrepreneurial activity inIreland will continue. It will be particularlyinteresting to see which is the correctexplanation for (iii) above, i.e. whether itindicates the occurrence of a higherconversion rate of nascent to new firmentrepreneurs or whether the lower proportionof nascent to new firm entrepreneurs in Irelandwill have a negative impact on the number of
26 42% of the adults that were interviewed in Ireland indicated that fear of failure would prevent them from starting a business.There were only four other countries that had a higher response rate to this question than Ireland. See 3.6.2.
36
new business which will come into being inIreland in the years ahead.
With regard to the number of nascententrepreneurs who believe that their newventures will have high growth potential,Ireland is ranked joint 10th across the 29 GEMcountries. This is not a particularly highranking, considering that it is within the moredeveloped economies, which are characterizedby opportunity entrepreneurship, that can befound the majority of entrepreneurs who havehigh growth expectations of their new venture.Hence, the number of GEM countries withsimilar characteristics, against which Irelandcan realistically compare itself on this measure,are greatly reduced.
It should be noted that not all new enterprises,perceived to have high growth potential bytheir promoters, fall within the high technologysectors. Hence, the concentration of thedevelopment agencies primarily on hightechnology new ventures as a source of highpotential growth may be too restrictive.Excluding from their help and support asignificant proportion of innovative newenterprises that may also have high growthpotential, but are not within the hightechnology sectors, may have negativeconsequences on the scale and rate ofdevelopment of these new enterprises.

CHAPTER 4
Making Ireland More Entrepreneurial
4.1 What GEM Has Achieved forIreland
Many facets of social and economic life inIreland have experienced profoundtransformation in recent years. There isevidence from the popular press that thesesocial and economic transformations includechanging attitudes towards entrepreneurs andentrepreneurial endeavor in general.
Even ten years ago the climate in Ireland forentrepreneurs was very difficult and, in manycases, hostile in the extreme. There were fewcelebrated successful role models and theconservative pursuit of secure paidemployment was lauded over the moreadventurous pursuit of entrepreneurship as alegitimate career aspiration.
Media profiling of business and entrepreneurialsuccess stories in more recent times suggeststhat there has been a marked change in thecareer choices and work patterns of Irishpeople. Within the business press there hasbeen extremely positive coverage ofentrepreneurial activity in the technologysectors, particularly in the software sector.There was little evidence until now, however,as to whether the nature and extent ofentrepreneurial activity in the software sectorin Ireland represents a ‘paradigm shift’ forbusiness organization and career choices inIreland, or whether the software sector is anisolated and exceptional occurrence.
GEM 2001 seeks to explore these issues byascertaining the extent to which there hasbeen a general transformation in the rate ofentrepreneurial activity in Ireland and thefactors that have precipitated such atransformation. In this, it has provided someinitial answers to important questions aboutentrepreneurial activity.
37
GEM 2001 has benchmarked theentrepreneurial propensity of the Irish adultpopulation against 28 other countries andexamined in-depth the relative position ofIreland on each of the factors, environmentaland personal, considered to be important inthe development of a high level of successfulentrepreneurial endeavor among a nation’spopulation. It is intended that this process willbe repeated on an annual basis, so that theresults and lessons, which can be taken fromone year’s research and analysis, can begreatly strengthened when the process isrepeated over many years.
4.2 The Focus of theRecommendations
A very favorable picture of the extent ofentrepreneurial activity in Ireland is portrayedby the Irish adult population survey, by theviews expressed in the in-depth one-to-oneinterviews with key informants and in theircompleted detailed questionnaires. These alsosuggest some economic explanations as towhy Ireland is a relatively favorableenvironment for entrepreneurial activity. Givensuch favorable findings the reader might wellask why the Irish GEM team is suggesting anumber of further recommendations withregard to encouraging and promotingentrepreneurial activity. There are two reasonsfor this.
First, among the positive indicators outlined inthis report, there are a number of factorswhere Ireland’s relative position is weak.Critically for Ireland, some of these factorsappear to be important determinants of therate of entrepreneurial activity. Second, webelieve that economic success at a nationallevel will increasingly be associated withentrepreneurial capabilities. That is, in the neweconomic order of the 21st century, thecapability and motivation to engage in

Global Entrepreneurship Monitor
entrepreneurial and innovative activity, amonga broad section of the population, will be animportant determinant of the ability of a nationstate to create new wealth.
Therefore, we make a number ofrecommendations with regard to thepromotion of entrepreneurial activity in Irelandbased on the following:
(i) The results of the GEM 2001 adultpopulation survey,
(ii) The in-depth one-to-one interviews withkey informants in Ireland (36 in each of2001 and 2000), and
(iii) The comparison of the results of theadult population survey and the keyinformant interviews across all 29countries in GEM 2001 and all 21countries in GEM 2000.
Overall, the GEM 2001 study suggests that theeconomic environment in Ireland is broadlysupportive of entrepreneurial activity.Accordingly, the focus of theserecommendations is less on the generaleconomic environment and is directedspecifically at the challenge of making Irelandmore entrepreneurial.
In summary, the recommendations that arebeing proposed for Ireland by the Irish GEMteam are as follows:
• Entrepreneurial activity and itsconsequent benefits should bechampioned at national level.
• The barriers preventing a greaterinvolvement by women inentrepreneurial activity should besystematically identified and theirparticipation must be activelyencouraged and supported.
• A series of educational and traininginitiatives should be designed todevelop both the required skills andconfidence in individuals, through theformal general education system andthrough entrepreneurial specificinitiatives.
38
• The availability of pre- and start-upseed capital for different types ofbusiness’ needs should be reviewedand any gaps in the availability offinancing should be addressed. Therelative attractiveness for investors ofinvesting in early stage enterprisesshould also be examined and therisk/reward of such investment mademore attractive through fiscalincentives
• Means of transferring the significantresearch, technological developmentand innovation (RTDI) investment,currently being implemented, into newentrepreneurial initiatives should beactively encouraged and any barriersto its transfer should be identified andremoved.
• The inefficiencies and shortcomings inthe country’s physical andtelecommunications infrastructureshould be addressed with a real senseof urgency.
The paragraphs that follow set out the rationalebehind these recommendations and suggestspecific means by which they might beimplemented.
4.3 Championing EntrepreneurialActivity
While Ireland’s overall entrepreneurial rankingis high, the ranking for nascententrepreneurship is more modest, with Irelandranking only 12th among the 29 countries interms of those actively planning a newenterprise. Furthermore, a ‘‘fear of failure’’ isstill relatively high among the adult populationin Ireland (only four countries reported ahigher fear of failure among their adultpopulations). The Irish GEM team believes,therefore, that entrepreneurial activity needs tobe encouraged and that the benefits of theapparent increased levels of entrepreneurialactivity in Ireland must be articulated to a verybroad section of the Irish population. As such,entrepreneurial activity should be articulated asan important component of our national ability
GEM 2001 Irish Report
to create wealth; as a way of encouraginginnovation; and as an important mechanism forincreasing economic efficiency.
There needs to be a greater understanding bythe adult population of the broad benefits ofentrepreneurial activity to the individual,benefits that include alternative career options,increased personal autonomy, and a way ofcreating personal wealth. The Irish keyinformants also expressed a view that thecelebration of certain entrepreneurialpersonalities was driving the greateracceptance of entrepreneurial activity withinthe country. They considered that while it wasimportant to have celebrated role models, itwas also necessary that the benefits ofentrepreneurial activity be more clearlyunderstood in their own right, so that the riseand fall in popularity of individualentrepreneurs would not negatively affect theperception of entrepreneurship.
It is recommended, therefore, that bothentrepreneurial activity and the benefits ofentrepreneurial activity to society, and toeconomic development generally, bechampioned, celebrated and encouraged atthe highest levels within society. Thedevelopment agencies can play a key role inthis area if they take up the challenge to do so.
4.4 Actively Encouraging MoreWomen Entrepreneurs
Each year the Executive GEM InternationalReport highlights the far greater proportion ofnew and active male entrepreneurs to femaleentrepreneurs in nearly all of the countriessurveyed. As a result, each year GEM hasdrawn attention to the fact that countries thatdo not fully encourage women to engage inthe creation and growth of new businessesmay not be fully realising their fullestentrepreneurial potential. In 2001, the GEMExecutive Report once again makes a veryclear statement.
‘‘There is perhaps no greater initiative acountry can take to accelerate its pace ofentrepreneurial activity than to encourage
39
more of its women to participate (inentrepreneurial activity).’’
Against this background, the low number ofwomen participating in the Graduate EnterpriseProgramme/ Enterprise Platform Programme invarious centres around the country is a matterof concern, as it is one indicator of acontinuing low level of female entrepreneurialparticipation in Ireland.
While the Irish GEM team is aware that thereare some tentative initiatives being planned inIreland in this area, the team considers thatcoherent policy initiatives need to be broughtforward in the short term. These have provento be successful in the US and in Canada. Inthose countries, a relatively high and growingproportion of women are active asentrepreneurs. Ireland can learn from theexperience of these other countries. Researchin Denmark has found that women seekgreater levels of advice and support in theirefforts to become entrepreneurs than do men.It is important that a focused support networkbe put in place to encourage more women toconsider entrepreneurial initiatives in the firstplace. The challenge then is to convert more ofthe ensuing women nascent entrepreneurs intonew firm entrepreneurs.
The Irish team, having highlighted this issue inthe 2001 Irish GEM Report as one needing tobe addressed, considers that once againattention should be drawn to this issue, as littlehas happened in the meantime. The barrierspreventing a greater involvement by women inentrepreneurial activity must be systematicallyidentified and their participation must beactively encouraged and supported.
4.5 Building EntrepreneurialCapacity
The evidence from GEM suggests thatperceived entrepreneurial capability is animportant determinant of the level ofentrepreneurial activity. GEM 2001 suggeststhat a relatively large percentage of the Irishpopulation does not believe that they have thecapability to start a new business. Irelandranked joint 10th of the 29 GEM countries in
Global Entrepreneurship Monitor
this regard. Therefore, there is a strong case forinterventions that will increase the perceivedentrepreneurial capability of the Irishpopulation.
This widespread perception among the Irishpopulation that they lack the required mix ofskill and experience to set up a new business27
might reflect a variety of factors: (i) thehistorically relatively low level ofentrepreneurial activity, and therefore, the lackof accumulated capability across all sections ofthe population; (ii) a weakness in theeducation system or the established firm baseat engendering specific entrepreneurialcapabilities; and/or (iii) it may simply be amisunderstanding of the particular skillsrequired and a failure to realise that they mayalready have been acquired. This lack ofperceived capability, however, should not beoverstated as a relatively high percentage ofthe general adult population in Ireland hasactually engaged in entrepreneurial activity inrecent times,28 and has thereby demonstratedtheir capability. Specifically, GEM suggests thatas many as 110,000 adults currently partly orfully own and operate a business started since1998.
The most obvious way for the Government toinfluence entrepreneurial capability is throughinitiatives within the general education systemand within vocational training programmes.Therefore, we recommend that theGovernment consider a series of educationaland training initiatives that will develop boththe required entrepreneurial skills andconfidence in individuals. In putting forwardthis recommendation, we suggest that theentrepreneurial skills that the general educationsystem can engender should be defined in thebroadest possible terms, e.g. developing asense of independence and self-determination,the ability to think creatively and to beinnovative. Many of these skills can beengendered through changes in approaches tolearning and do not necessarily require theintroduction of new course content. We
27 54% of those surveyed in the adult population in Ireland indicated that they believed that they did not have the necessaryknowledge, skill and experience to start a new business.
28 In 2001 Ireland ranked 6th of the 29 GEM countries, in terms of the total entrepreneurial activity (TEA) of its adult population.
40
caution, however, that such changes representno trivial task in terms of the demands onteaching style and emphasis.
4.6 Making Seed Funding MoreAccessible
GEM has consistently demonstrated that theavailability of finance is a critical determinantof entrepreneurial activity. In the context ofnational economies, the total informalinvestment was 1.1% of the combined GDPfor all GEM countries. GEM has emphasizedthat in many countries informal investment, socalled ‘Business Angels’, represent animportant source of finance for entrepreneurialactivities. The proportion of adults, within thevarious GEM countries, that was active asinformal investors in 2001 averaged just over3%.
The rate of informal investment in Ireland isjust above the mid point for all GEM countries.The availability of venture capital and the levelof funds provided by venture capitalists hasincreased significantly in Ireland in recentyears, and has now reached a stage ofdevelopment similar to that of many otherGEM countries. It is, however, significantlybehind that available in the US and in Israel.Research has clearly shown that newenterprises which have adequate equityfunding from the outset are more likely toweather the unexpected turmoil that mostfirms encounter in their early years. Moreover,those firms that have received VC equityfunding tend to grow more quickly and to agreater scale than do other new firms.
The key informants recognized the sea changethat had taken place in Ireland with regard tothe availability and cost of finance for newbusiness ventures. They welcomed the arrivalof the VC funds but expressed the view thatthese were primarily interested in second orthird stage investment, when the new venturewas already established and seeking funds todevelop further. Even in the current more
GEM 2001 Irish Report
cautious climate, the general belief was thatfunds could be found for the more attractiveventures, although the valuation of thebusinesses had been negatively affected byrecent developments.
The concerns raised by the key informantsinterviewed in relation to the cost andavailability of finance related in particular tothe availability of pre- and start-up seed capitalfor different types of business’ needs.Accordingly, the Irish GEM team recommendsthat the availability of funds for these purposesshould be reviewed and any gaps in theavailability of early stage financing should beaddressed. Specifically, the relativeattractiveness for investors of investing in earlystage enterprises should also be examined andthe risk/reward of such investment made moreattractive through fiscal incentives. It should berecognised that early stage investment is notwithout risk, and, if it is to be activelyencouraged and promoted, the potential forreward must be greater than that availablefrom ‘‘no risk’’ savings schemes.
4.7 Commercializing PubliclyFunded Research
High technology entrepreneurship already hasan established position in Ireland in terms ofboth policy and perception. The challenge is toincrease the number of new enterprises beinginitiated in high technology areas and tosupport their subsequent growth anddevelopment.
The Government has emphasized the need forIreland to move to a knowledge society as thebasis for sustained growth and development.High technology new enterprises arerecognized as having a key role to play inachieving this objective. Accordingly, thedevelopment agencies are focused onimplementing policies designed to support andencourage new high potential enterprises innew and emerging high technology sectors.
High-tech entrepreneurs have also had anotherimportant role to play in bringing about apositive change in the culture and attitudes
41
within Ireland towards entrepreneurship. Theyhave acted as the principal catalyst to theawakening of a pro-enterprise culture amongthe general population, as many of theirnumber, who have created new high growthventures, have received very positive mediacoverage. Through their success theythemselves have demonstrated what can beachieved. Thus they are fulfilling an importantnational requirement for entrepreneurial rolemodels.
Moreover, many of the current ‘‘generation’’ ofhigh tech entrepreneurs have been initiated byformer employees of an earlier ‘‘generation’’ ofindigenous high-tech firms.
In recognition of the strong link betweeninvestment in the research and innovation baseof the economy, sustained economic growthand the initiation of new high potential growthenterprises, the government has already begunto invest the funding of \2.4 million which hasbeen earmarked to be invested in the period2000 to 2006 to bring about a majoraccelerated increase in Research,Technological Development and Innovation(RTDI) and to leap frog Ireland to a new levelof RTDI activity. All the key informantsconsidered this to be a very necessary andimportant initiative, given the historically lowlevel of R&D investment in the country.
International evidence suggests that investmentin scientific research will not on its own resultin entrepreneurial activity. The history of hightech regions such as Silicon Valley clearlyshows that knowledge creation in publicinstitutions is only one of many prerequisites tothe emergence of dynamic clusters of hightechnology firms. Therefore it is imperative thatmeans of transferring the significant RTDIinvestment, currently being implemented, intonew entrepreneurial initiatives must be activelyencouraged and any barriers to its transfermust be identified and removed.
4.8 Removing InfrastructuralInefficiencies
The low ranking on infrastructure in both theWorld Competitiveness Index and in the views

Global Entrepreneurship Monitor
articulated by the key informants should comeas no surprise. They are of particular concernto entrepreneurs, however, as deficits in theavailability and relative cost oftelecommunications and in the necessaryinfrastructure for exporting, can be a significantinhibitor of entrepreneurial activity and growth.This is particularly the case in a country likeIreland, which has a small home market. This
42
obliges new ventures, if they are to grow, toexport at an early stage in their development.
Therefore the Irish GEM team echoes the callof many of the key informants interviewed thatthe inefficiencies and shortcomings in thecountry’s physical and telecommunicationsinfrastructure should be addressed with a realsense of urgency.

APPENDIX 1
GEM 2000 and GEM 2001:Understanding the Change in Ireland’s
Position
Ireland participated in GEM for the first time in2000. The result of the adult population surveycarried out by Lansdowne Market Research aspart of the GEM 2000 study appeared toindicate a very low level of entrepreneurialactivity among the Irish adult population.
This result was at odds with the opinion of theIrish expert informants who had also beenquestioned as part of the 2000 GEM Irishstudy. The Irish experts were much morepositive in their opinion of the positiveconditions for entrepreneurship that prevailedwithin the country and of the general level ofentrepreneurial activity that was taking place.
Given that GEM ranks the various countries onthe basis of the entrepreneurial propensity oftheir adult populations, despite the viewsexpressed by the Irish key informants, Irelandwas ranked by GEM among the ‘‘Low’’ groupof the 21 countries participating.
Preliminary results from the adult surveycarried out for the 2001 study, which wascarried out in June/July 2001 by the samemarket research firm, appeared to confirm theoutcome of the 2000 survey and once againGEM was preparing to place Ireland in the‘‘Low’’ group of countries, in terms of theentrepreneurial propensity of its adultpopulation.
During September 2001, alarm bells began toring, however, as there were indications thatthe Irish population survey might befundamentally flawed. In the words of theprincipal GEM central co-ordinator, it quicklybecame apparent that ‘‘the worst-case
43
scenario’’ had occurred and that Ireland was inthe centre of it.
This situation arose as a result of the responseof the Irish adults to the first statement in thepopulation survey. The adults surveyed werefirst asked to say if the following statementapplied to them:
‘‘You are, alone or with others, currentlytrying to start a new business, includingany type of self-employment’’.
It had been assumed that the majority of therespondents would provide a simple ‘‘yes’’ or‘‘no’’ response, with a small percent refusing toanswer. A category of ‘‘don’t know’’ responsewas also available to respondents. Those thatprovided a ‘‘don’t know’’ or ‘‘refuse’’ responsewere asked no further questions and noinformation is available about these individuals.
In fact, in the pre-test completed in the US,and the subsequent US interviews, norespondents were coded as ‘‘don’t know.’’ Thisassumption is reflected in the skip pattern inthe interview schedule; only thoserespondents, that provided an unequivocal‘‘yes’’, were asked the follow-up questionsabout activity, ownership, and the payment ofsalaries of wages for 3 or more months.
It was presumed that all survey vendors acrossthe various countries would have about thesame low proportion of ‘‘don’t know’’ and‘‘refusals’’ facilitating cross-countrycomparisons.
In September 2001, the issue of the ‘‘don’tknow’’ responses came to the fore, for an

Global Entrepreneurship Monitor
unrelated reason, and all surveys were re-checked to verify that the ‘don’t know’’responses were uniformly low across countries.
At that stage, it emerged that the level of‘‘don’t know’’ responses to the centralstatement in the Irish 2000 and 2001 surveyswas much too high. Consequently, the resultsfor Ireland were clearly unusable for seriouscross-national comparisons, as the populationsurvey data from Ireland ignored hundreds ofpeople that might qualify as being involved inentrepreneurship.
A decision was taken to re-run the adultpopulation study for Ireland. GEM central co-ordination agreed to fund the additional costsinvolved. This time, two different survey firmswere used. Each surveyed 1,000 adults eachand the interviewers were directed not to
44
accept ‘‘don’t know’’ responses. The surveyswere conducted in September 2001.
These surveys gave a quite different outcomefor Ireland. The re-run adult population surveyshad now placed Ireland in a much higherposition within the expanded group ofcountries, and the adult population data for theyear 2000 was clearly perceived to beincorrect and misleading. As a result, GEMsubstantially revised Ireland’s entrepreneurialranking upwards.
Following independent expert advise andconsultation, the Irish national team decidedthat, for a variety of reasons, the September2001 re-run surveys were more likely to becorrect than the previously run surveys, andthe national team accepted GEM’s revisedranking of Ireland.