is misallocation higher in france than in the united states? · product of capital relative to...
TRANSCRIPT

IS MISALLOCATION HIGHER IN FRANCE THAN IN THE UNITED STATES?
Documents de travail GREDEG GREDEG Working Papers Series
Flora BelloneJérémy Mallen-Pisano
GREDEG WP No. 2013-38http://www.gredeg.cnrs.fr/working-papers.html
Les opinions exprimées dans la série des Documents de travail GREDEG sont celles des auteurs et ne reflèlent pas nécessairement celles de l’institution. Les documents n’ont pas été soumis à un rapport formel et sont donc inclus dans cette série pour obtenir des commentaires et encourager la discussion. Les droits sur les documents appartiennent aux auteurs.
The views expressed in the GREDEG Working Paper Series are those of the author(s) and do not necessarily reflect those of the institution. The Working Papers have not undergone formal review and approval. Such papers are included in this series to elicit feedback and to encourage debate. Copyright belongs to the author(s).
Groupe de REcherche en Droit, Economie, GestionUMR CNRS 7321
Is Misallocation Higher in France than in the
United States ?
Flora Bellone∗ Jeremy Mallen-Pisano †
September 2013
Abstract
In this paper, we apply the Hsieh and Klenow (2009) methodologyto French microdata on manufacturing firms to quantify the poten-tial extent of intra-industry misallocation in France versus the UnitedStates. In contrast to what has been found for developing countries,such as China, India and some countries in Latin America, we do notfind any sizeable ”efficiency gap” between France and the U.S. in themanufacturing industry. This new evidence is robust to a series oftests addressing both measurement and specification issues. In light ofrecent advances in the fields of productivity and misallocation, and inparticular Bartelsman et al. (2013), we also discuss to what extent ournew empirical findings challenge the established view on which conti-nental European economies have higher input and output distortionsthan the American economy.
Keywords: Misallocation; Productivity, Manufacturing; Firm-leveldata, FranceJEL Classification Codes: O47, O57
∗Univ. Nice Sophia Antipolis, CNRS, GREDEG, France. Address: GREDEG, 250 rueAlbert Einstein, 06560 Valbonne, France. E-mail: [email protected].
†Univ. Nice Sophia Antipolis, CNRS, GREDEG, France. Address: GREDEG, 250 rueAlbert Einstein, 06560 Valbonne, France. E-mail: [email protected]
1

1 Introduction
An increasing number of researchers in the field of productivity analysis aredevoting their efforts to analyzing the role of market distortions in shap-ing international productivity gaps1. A key contribution in the productivityanalysis field is a paper by Hsieh and Klenow (2009) (HK afterwards), whichhas provided scholars with a new methodology for indirectly inferring theimpact of misallocation on total factor productivity (TFP) from longitudinalmicro-level databases. Using data on China, India and the U.S., HK showedthat moving China and India to ”U.S. efficiency” would allow for TFP gainsof 30 to 50 percent in China and of 40 to 60 percent in India. Further evi-dence using the same methodology indicates that large potential aggregateTFP gains due to removing misallocation have been recently accumulatedon other developing countries, particularly Latin American ones2.
While it is not surprising to find such large efficiency gaps between theU.S. and developing economies, one may wonder whether misallocation is animportant source of TFP differences among developed economies. Indeed,because those economies are closer to each other in terms of technologicalabilities, one may even expect that misallocation explains much of the TFPgap between them.
In this paper, we propose applying the HK methodology on the Frencheconomy. France is a good case for study because one would expect to findsizeable misallocation gaps relative to the U.S. economy. First, since the1990s, France’s economy has significantly under-performed compared to theeconomy of the U.S in terms of aggregate TFP (see Van Ark et al. (2008)and Inklaar and Timmer (2008)). In contrast, resource reallocations havebeen identified as a key driver of the resurgence of productivity growth in theU.S. economy since the early 19th century (Olley and Pakes (1996), Fosteret al. (2001)). Second, similar to most of its European partners, France hasa highly regulated market compared to that of the US. (see for instance,Crafts (2006)). These regulations, which concern both input and outputmarkets, have been emphasized as potential key factors driving Europe’slow growth performance compared to the U.S. since the 19th century (seein particular Aghion et al. (2007), Arnold et al. (2011)).
The above-mentioned evidence supports the working assumption thatmisallocation may be key to explaining the under-performance of the Frencheconomy compared to the U.S. economy over the last two decades. However,none of the previously mentioned studies allow for a global quantificationof the extent of misallocation in France relative to the U.S. economy3. The
1see Restuccia and Rogerson (2013) for a recent overview.2References will be detailed in Section 2 infra.3A noticeable exception is a recent paper by Bartelsman et al. (2013)(BHS afterwards),
which relies on a slightly different methodology than that of HK to compare the amountof intra-industry misallocation between the U.S. and a set of European countries. In this
2

present paper attempts to fill in the above-mentioned gap in the literatureby offering the first quantification of misallocation in France relative to theU.S., which is directly comparable to the benchmark quantifications thatHK derived for the American, Chinese and Indian economies.
For that purpose, we rely on a micro dataset on French manufacturingfirms from the French Annual Census of Manufacturers collected by INSEE.Our paper will assess the extent to which the structural differences betweenour dataset and the ones used by HK cause any specific bias in our rela-tive estimates of misallocation. The paper will also assess whether the HKtheoretical framework is relevant for picking up some of the relationship inFrance between market distortions and misallocation. Finally, we will devotepart of the discussion to the current debate on the efficiency gap betweenthe European and the U.S. economies by comparing our new evidence tothe evidence recently added to the literature, particularly by Bartelsman etal. (2013), Van Ark et al. (2008), and Rodrik (2013).
The rest of the paper is organized as follows. Section 2 describes themain steps of the HK methodology. Section 3 presents the micro-data onFrench manufacturing firms used for our analysis. Section 4 displays thecomparative results for France. Sections 5 and 6 test, respectively, the ro-bustness of our empirical analysis and the relevance of the HK theoreticalframework in the French case. Section 7 provides a general discussion onproductivity and misallocation, and our conclusions and perspectives forfurther work are presented in a final Section.
2 The HK methodology
This section describes the main steps of the methodology by Hsieh andKlenow (2009), incorporating their correction appendix (Hsieh and Klenow(2013)), for revealing the impact of misallocation on aggregate TFP. Basi-cally, HK relies on a Melitz-type model in which firms are assumed to differnot only in their efficiency levels (as in Melitz, 2003) but also in terms ofthe output and capital distortions they may face.
Specifically, the HK theoretical framework is composed of a closed econ-omy with two primary inputs, labor and capital, as well as S differentiatedintermediate goods industries and one single homogeneous final goods indus-try. The supply side of the economy is vertically integrated in the sense thatthe primary inputs are only used in the intermediate goods industries, whilethe final good industry is a ”pure assembly” sector that combines the S dif-ferent sets of differentiated intermediate goods to produce a (homogeneous)final output. On the demand side, final producers compete on a perfectlycompetitive market to sell their products to a representative final consumer,
paper, a section will be dedicated to comparing the results obtained through the HK andthe BHS methodologies.
3

while intermediate firms compete on monopolistic competitive markets tosell their differentiated outputs to final producers.
These assumed market structures are consistent with the productiontechnologies specified by HK for the homogenous final goods and the differ-entiated intermediate goods. The production function for the final goods isa Cobb-Douglas aggregator of the S intermediate inputs, each of which is aCES aggregate of the differentiated individual intermediate goods producedin the industry. Within each of the S industries, the production function forthe individual intermediate input i is a firm-specific Cobb-Douglas technol-ogy that combines primary inputs only. Specifically, the production functionof intermediate goods firm i operating in industry s is:
Yis = AisKαsis L1−αs
is (1)
where Ais is the firm-specific productivity parameter, Yis, Kis, and Lis
are, respectively, the output, capital input and labor input of firm i operatingin industry s, and αs is the industry-specific capital share.4
HK introduces idiosyncratic markets distortions in this Melitz-type frame-work by assuming that firms face different restrictions on both their outputand input markets. Denoting τY is, the firm-specific distortions that increasethe firm’s marginal products of capital and labor in the same proportion,and τKis, the firm-specific capital distortions that raise the firm’s marginalproduct of capital relative to labor, market distortions manifest in the profitequation of firm i operating in industry s as follows:
πis = (1− τY is)PisYis − wLis − (1 + τKis)RKis (2)
where Pis is the output price fixed by the firm, R is the rental price ofcapital and w is the common wage all firms face.5
Using standard profit maximization rules on monopolistic competitionmarkets, and solving for the equilibrium allocation of resources across sec-tors, HK derives a number of interesting properties about the physical pro-ductivity and revenue productivity of firms operating in intermediate goodssectors.
4In the HK model, input shares are supposed to vary across industries but not acrossfirms within the same industry framework. This assumption directly impacts the measureof relative capital distortions in the HK framework and will be discussed later in the paper.
5The simplifying assumption that all firms face the same wage means that a labormarket distortion will manifest as a low capital market distortion in the HK framework.In such a case, the idiosyncratic input distortion would lower the firm’s marginal productof capital with respect to labor.
4

Let us denote TFPQis ≡ Ais the physical productivity of firm i op-
erating in industry s, and TFPRis ≡ (PisYis)/Kαsis L
(1−αs)is to its revenue
productivity. HK shows that the TFPR would not vary across firms withina same industry unless firms face capital and/or output distortions6. In-tuitively, in the absence of distortions, more capital and labor would beallocated to firms with higher TFPQ to the point where their higher outputresults in a lower price and the same TFPR as that found for smaller firms.In contrast, in the presence of distortions, a high TFPR is a sign that thefirm confronts barriers that raise its capital and labor, rendering the size ofthe firm less than optimal.
At the aggregate level, the presence of firm distortions translates into alower industry TFP. This can be illustrated by comparing the expression forindustry TFP in the absence of distortions with the corresponding expres-sion in the presence of distortions. First, in the absence of distortions, the”efficient” industry TFP is straightforwardly given by the CES aggregate ofeach individual firm TFPQ operating in the industry:
TFPs”efficient” ≡ Ams =
[Ms∑i=1
Aσ−1is
]1/(σ−1)
(3)
where σ is the elasticity of substitution of any pair on intermediate inputsproduced in industry s, Ms is the total number of individual firms producingdifferentiated goods in industry s, Asi is the physical productivity (i.e.,TFPQ) of the individual firm i operating in industry s, and Ams is theaggregate and average physical productivity in industry s.
Second, in the presence of firm distortions, industry TFP is itself dis-torted, as it depends both on the firms’ absolute physical productivities andon their relative revenue productivities. Indeed, high-productivity firms thatconfront distortions (i.e., firms characterized by both high TFPQ and highTFPR), will be less than optimal. In contrast, low-productivity firms thatbenefit from distortions (i.e., firms characterized by both low TFPQ and lowTFPR), will be more than optimal. In this context, ”inefficient” industryTFP is given by:
TFPs =
[Ms∑i=1
(Ais
TFPRms
TFPRis
)σ−1]1/(σ−1)
(4)
6For a demonstration, see Hsieh and Klenow (2009, page 1,410) and their correctionappendix (Hsieh and Klenow (2013)
5

where TFPRis is the revenue productivity of the individual firm i op-erating in industry s, and TFPRms is the average revenue productivity inindustry s.
Intuitively, equation (4) implies a negative relationship between the de-gree of dispersion of firms’ TFPR within an industry and the degree ofinefficiency in the industry TFP. This property can be fully established ina special case in which output distortions prevail and the distributions offirms’ TFPQ and TFPR are jointly log-normal
logTFPs =1
σ − 1log
(Ms∑i=1
Aσ−1is
)− σ
2var(log TFPRis) (5)
meaning that the negative effect of distortions on aggregate TFP canbe summarized by the variance of log TFPR, which reveals the extent ofmisallocation due to the dispersion of marginal products7 .
The next step of the HK methodology is choosing a benchmark value forthe dispersion of TFPR in order to accurately evaluate the extent of mis-allocation in any given country. Obviously, if the HK model did not omitany factors (other than modeled market distortions) susceptible to generat-ing gaps in marginal products, and if firm-level data sets were not subjectto measurement errors, the accurate benchmark value for the variance ofTFPR would be zero. However, because the presence of omitted factorsand measurement errors are both likely, the choice of a relevant benchmarkbecomes critical.
HK solves this issue by choosing as a benchmark the dispersion of TFPRobserved in the U.S. economy. HK’s basic idea is that if omitted factorsand measurement errors do not differ much across countries, then a positivedeviation of the dispersion of TFPR between any given country and the U.S.can be interpreted as a sign of greater market distortions in that country’seconomy compared to the U.S. economy.
Implementing Equation (4) for India and China using the U.S. as abenchmark, HK found that moving to ”U.S. efficiency” would increase TFPat by 30 to 50 percent in China and by 40 to 60 percent in India. Ap-plying the HK methodology to other developing countries, the recent lit-erature has consistently found sizeable potential aggregate TFP gains byremoving misallocation in a variety of Latin American countries. For ex-ample, these studies found that both Bolivia and Uruguay could increasetheir manufacturing TFP by approximately 10 to 15 percent by equalizingthe marginal products of capital and labor of their respective firms to the
7For more complex formulae in the general case in which both input and output dis-tortions prevail, see Hsieh and Klenow (2013)
6
extent of the U.S. plants in 1997 (see Machicado and Birbuet (2012) forBolivia and Casacuberta and Gandelman (2012) for Bolivia). Camacho andConover (2010) and Neumeyer and Sandleris (2010) found fewer efficiencygains for Colombia and Argentina. Specifically, both studies found potentialTFP gains relative to the U.S. of approximately 6 to 8 percent. However,both studies acknowledged some potential downward bias in their estimatesof the TFPR dispersion8.
What should we expect when applying for the first time the HK method-ology to a developed country, in this case, France? On the one hand, we mustnote that the efficiency gap between France and the U.S. is much smallerthan the efficiency gap between China or India (or some Latin Americancountries) and the U.S. (as France can be seen as relatively undistortedcompared to these developing countries). On the other hand, as the issue ofomitted factors and measurement errors is likely to be less severe in the caseof a comparison between similarly developed economies, we should be moreconfident in the fact that a revealed ”efficiency gap” would indeed reflect dif-ferences in market distortions rather than differences in measurement errorsor omitted factors.
The next section presents the dataset we used for France to quantify theextent of misallocation along the lines of the HK methodology.
3 French data
Our main source for French data is the confidential Enquete Annuelle d’Entreprises (EAE), an annual survey conducted by the French NationalStatistical Office (INSEE) that gathers information from the financial state-ments and balance sheets of all individual manufacturing firms with at least20 employees. The firms surveyed account for approximately 25% of thetotal number of French manufacturing firms and approximately 85% of to-tal value added in manufacturing. The raw data consist of approximately20,000 firms in each year over the period 1990 to 2007. In comparison,the main source for U.S. data used by HK is the quinquennial Census ofManufactures(CM) conducted by the U.S. Bureau of the Census from 1977to 1997. This survey covers all manufacturing plants (but not firms), formore than 160,000 plants in each year after dropping the smallest units withlimited production data (Administrative records).
At first glance, the French and the U.S. data do not appear comparable.They differ in the unit of observation (plant versus firm), the number ofobservations (on average, 8 times larger in the U.S.) and in the period ofcoverage. While these caveats call for attention9, they apply to the compara-
8In the Argentinean case, the authors show that misallocation increased substantially(to a peak of 12 percent) after the crisis of 2001-2.
9and will be addressed in a dedicated robustness checks section.
7

tive exercise initially performed by HK on the Chinese, Indian and Americaneconomies. Specifically, HK drew their data on China from a firm-level an-nual survey conducted between 1998 and 2005 that included approximately100,000 state and non-state firms in 1998, a number that grew to 200,000in 2005. HK drew the data for India from an annual plant-level census con-ducted between 1987 and 1995 covering all individual manufacturing plantswith at least 50 workers, and a random one-third sample of registered plantswith more than 10 workers. This raw data consisted of approximately 40,000plants in each year. Compared to the Chinese and Indian data, the Frenchdata do not appear less suitable for comparison with the U.S. data.
Let us now describe the main firm-level variables that we used. Weuse the firm’s industry (at the four-digit level, as in the HK paper), laborcompensation, value-added (excluding taxes), capital stock and age (basedon first entry into the EAE survey10). For the U.S. data, we compute laborcompensation as wages plus benefits. Concerning capital stocks, the EAEreports information on investment flows by firms. We can then estimate realcapital stocks using a permanent inventory methodology(PIM) based on pastfirm-level investment series and industry-level investment price indexes 11.
Finally, let us present the data we used for the industry-level variables.As required by the HK methodology, we must choose values for the followingset of industry parameters: The elasticity of substitution of manufacturesσ, the rental price of capital R, and the elasticity of output with respectto capital α. (This third industry parameter should be the one to prevailif France’s economy was to be liberalized to the extent to which the U.S.economy is). For each of these parameters, we follow as closely as possiblethe HK original paper. In all industries, we set R to the value of 10%,which corresponds to a rough 5% real interest rate added to a rough 5%depreciation rate, and σ to the value of 3 which corresponds to the lowerbound value found by Broda and Weinstein (2006) in their estimates of thesubstitutability of competing manufactures in a variety of manufacturingindustries.
For the elasticity of output with respect to capital, we follow HK in re-lying on the NBER-CES Manufacturing Industry database, which providesindustry capital shares computed as 1 minus the labor share in the corre-sponding industry in the U.S. However, because of a lack of concordanceacross the U.S. industrial classification (US-SIC) and the French classifica-
10Similar to the U.S. Census, the EAE data do not provide information on the birthdate of the firm. Thus, we use the date of the firm’s first entry into the EAE data (startingin 1984) to identify the firm’s birth year. Specifically, we follow HK in assuming that thebirth date is the year the plant first appeared in the survey, minus three years
11We can alternatively take the average of the net book value of fixed capital at thebeginning and end of the year, as HK did. However, this estimation method would reducethe number of observations in the early period of our coverage because book values oftangible assets were not available in the EAE dataset for firms under 100 employees until1994. We reserve this alternative measure for a robustness check.
8
tion (NAF rev 1 2003), we rely on the U.S. capital shares at the three-digitlevel instead of at the four-digit level, as HK did12 Finally, we use as indus-try output shares the French industry value added shares computed fromthe EAE database.
On the basis of these industry parameters and firm data, we can estimatethe distortions and productivity for each French firm in each year. We canthen use those estimates to infer potential gains from reallocation in theFrench economy. The results of these computations are presented in thenext section.
4 French manufacturing misallocation in interna-tional perspective
According to our methodology, revenue productivity and physical produc-tivity for each firm can be inferred from the following equations:
TFPRis ≡PisYis
Kαsis L1−αs
is
(6)
TFPQis ≡ Ais ≡Yis
Kαsis L1−αs
is
= ks(PisYis)
σσ−1
Kαsis L1−αs
is
(7)
with ks a scalar of unobservable variables, which can be set equal to1 without affecting relative productivities (and consequently, reallocationgains).
Equations (6) and (7)show how, in the HK framework, real output Ysican be inferred from the observed nominal output ( PsiYsi) simply by assum-ing an elasticity of demand. This is what makes this framework so suitablefor distinguishing a firm revenue and physical productivities despite the lackof information on firm output prices.
We estimate both equations (in log) using (the log of) our previouslydefined firm-level data, particularly the firm value added as the nominaloutput, PsiYsi and the firm capital stock as the capital input Ksi. However,for the labor input, we follow HK’s empirical strategy of using the wage bill
12Camacho and Conover (2010) perform this exercise in their paper on Colombia. Theyshow how the estimated extent of misallocation substantially varies depending on theassumed capital shares. In particular, they show that the estimated TFP gains (fromequalizing TFPR within industries) are significantly smaller when U.S. capital shares areused instead of Colombian capital shares. On average, those TFP gains are approximately48% in Colombia when computed using U.S. capital shares(at the 3-digit level in lieu ofthe 4-digit level, due to industrial classification correspondence issues), and approximately77% when computed using Colombian capital shares (at the 4 digit level).
9

Table 1: Dispersion of TFPQ
France 1998 2001 2005 China 1998 2001 2005S.D. 0.90 0.94 0.93 S.D. 1.06 0.99 0.9575-25 0.99 1.03 1.03 75-25 1.41 1.34 1.2890-10 1.92 2.06 2.05 90-10 2.72 2.54 2.44N 18,438 18,057 16,250 N 95,980 108,702 211,304
U.S.A. 1977 1987 1997 India 1987 1991 1992S.D. 0.85 0.79 0.84 S.D. 1.16 1.17 1.2375-25 1.22 1.09 1.17 75-25 1.55 1.53 1.6090-10 2.22 2.05 2.18 90-10 2.97 3.01 3.11N 164,971 173,651 194,669 N 31,602 37,520 41,006
Notes. The statistics are for deviations of log(TFPQ) from industry means. S.D. is thestandard deviation, 75-25 is the difference between the 75th and the 25th percentiles,and 90-10 is the difference between the 90th and the 10th percentiles. Industries areweighted by their value-added shares. N is the number of firms. Values for the U.S.,China, and India are from Hsieh and Klenow (2009). Values for France are from theauthors’ calculations.
instead of the employment level to estimate Lsi in order to (crudely) controlfor differences in human capital and worked hours across firms. Finally, wetrim the 1% tails of both firm productivities to make the results robust tooutliers, as HK does.
The dispersions in French firms (log) TFPQ and TFPR are analyzedin Tables 1 and 2, respectively. Each table displays the standard deviation(S.D.), the ratio of the 75th minus the 25th percentiles, and the ratio of the90th minus the 10th percentiles of the productivity distribution. In eachtable, the values for the French economy are compared with the correspond-ing values for the U.S. economy, drawn from HK. Moreover, to broaden theinternational comparative perspective, the HK values for China and Indiaare also reported in a dedicated section of each table.
Obviously, the figures reported for France in Table 1 and 2 are similarto the values reported for the U.S. and are significantly below the valuesfound for China and India. The U.S. standard deviation of the log TFPQ isslightly lower than the corresponding French figure. However, the ratios of75th to 25th and of 90th to 10th are higher. The presence of more extremevalues of the distribution of TFPQ in the U.S. economy compared to theFrench economy may be because the U.S. data encompass small units, whilethe French data cover only units comprised of more than 20 employees.Turning to the dispersion of firm (log) TFPR, we found a similar picture.French data reveal a firm TFPR dispersion close to that of the U.S. economyand below the economies of China and India. Finally, in each country, the
10
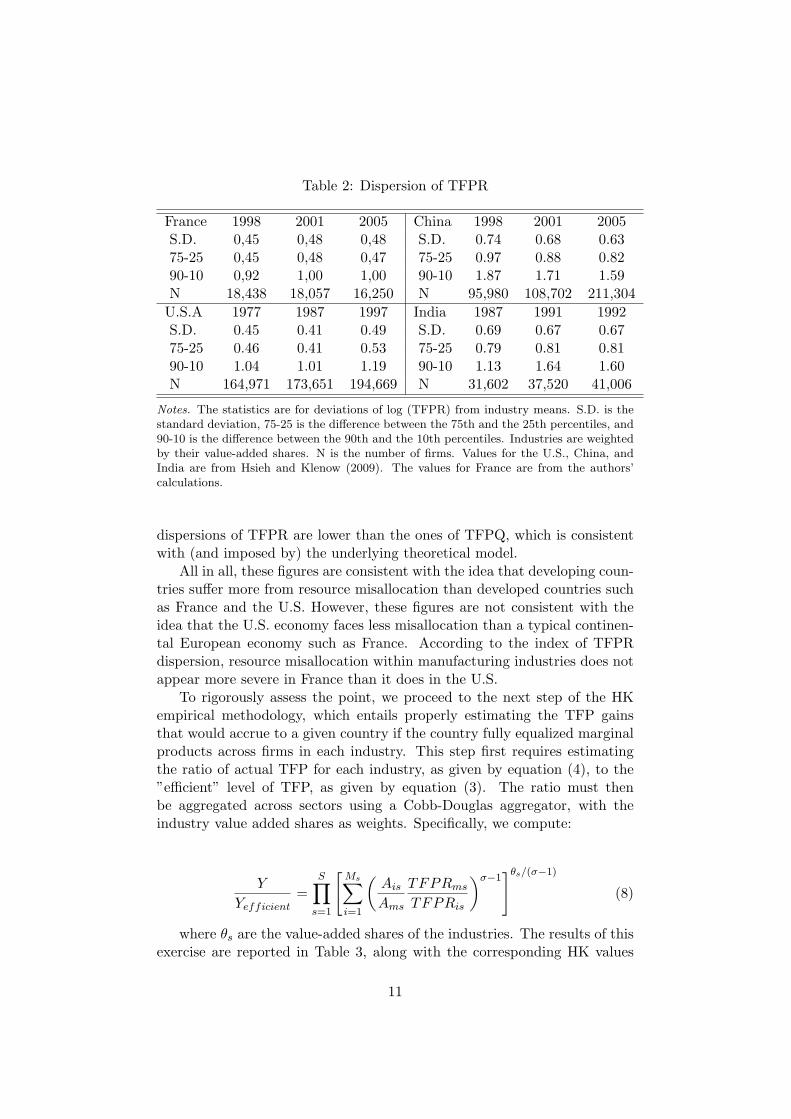
Table 2: Dispersion of TFPR
France 1998 2001 2005 China 1998 2001 2005S.D. 0,45 0,48 0,48 S.D. 0.74 0.68 0.6375-25 0,45 0,48 0,47 75-25 0.97 0.88 0.8290-10 0,92 1,00 1,00 90-10 1.87 1.71 1.59N 18,438 18,057 16,250 N 95,980 108,702 211,304
U.S.A 1977 1987 1997 India 1987 1991 1992S.D. 0.45 0.41 0.49 S.D. 0.69 0.67 0.6775-25 0.46 0.41 0.53 75-25 0.79 0.81 0.8190-10 1.04 1.01 1.19 90-10 1.13 1.64 1.60N 164,971 173,651 194,669 N 31,602 37,520 41,006
Notes. The statistics are for deviations of log (TFPR) from industry means. S.D. is thestandard deviation, 75-25 is the difference between the 75th and the 25th percentiles, and90-10 is the difference between the 90th and the 10th percentiles. Industries are weightedby their value-added shares. N is the number of firms. Values for the U.S., China, andIndia are from Hsieh and Klenow (2009). The values for France are from the authors’calculations.
dispersions of TFPR are lower than the ones of TFPQ, which is consistentwith (and imposed by) the underlying theoretical model.
All in all, these figures are consistent with the idea that developing coun-tries suffer more from resource misallocation than developed countries suchas France and the U.S. However, these figures are not consistent with theidea that the U.S. economy faces less misallocation than a typical continen-tal European economy such as France. According to the index of TFPRdispersion, resource misallocation within manufacturing industries does notappear more severe in France than it does in the U.S.
To rigorously assess the point, we proceed to the next step of the HKempirical methodology, which entails properly estimating the TFP gainsthat would accrue to a given country if the country fully equalized marginalproducts across firms in each industry. This step first requires estimatingthe ratio of actual TFP for each industry, as given by equation (4), to the”efficient” level of TFP, as given by equation (3). The ratio must thenbe aggregated across sectors using a Cobb-Douglas aggregator, with theindustry value added shares as weights. Specifically, we compute:
Y
Yefficient=
S∏s=1
[Ms∑i=1
(Ais
Ams
TFPRms
TFPRis
)σ−1]θs/(σ−1)
(8)
where θs are the value-added shares of the industries. The results of thisexercise are reported in Table 3, along with the corresponding HK values
11

for the U.S., China and India.
Table 3: TFP gains resulting from Equalizing TFPR within Industries
France 1998 2001 2005 China 1998 2001 2005% 30.5 27.5 30.5 % 115.1 95.8 86.6
U.S.A. 1977 1987 1997 India India 1987 1991 1992% 36.1 30.7 42.9 % 100.4 102.1 127.5
Notes: Entries are 100(Yefficient/Y − 1).Values for the U.S., China, and India are from Hsieh and Klenow (2009).Values for France are from the authors’ calculations.
As expected, in Table 3, the French figures are similar to the Ameri-can ones. Both countries exhibit values of misallocation gains far below thecorresponding values for developing countries such as China and India. Fur-thermore, France exhibits lower TFP gains due to misallocation than doesthe U.S.
Finally, we perform the last step in the HK methodology, which entailsexpressing the percentage of TFP gains in each country relative to thosein the U.S. This step allows us to assess to what extent TFP in a countrywould hypothetically increase if the country moved to the ”U.S. efficiency”level. In Table 4, we report the results of this exercise for France usingas a benchmark either the 1997 TFP gains in the U.S. (as in the originalHK paper) or the 1987 TFP gains in the U.S., which corresponds to theconservative choice in our case 13.
Table 4: French TFP gains derived from Equalizing TFPR relative to U.S.Gains
1998 2001 2005Benchmark U.S. 1997 -4.4% -2.4% -8.7%Benchmark U.S. 1987 -0.2% -2.4% -0.2%
Notes: Entries are the ratio of Y/Yefficient for France to the benchmark U.S. ratio minus1, multiplied by 100. The benchmark U.S. ratio is computed either as the 1997 ratio (firstrow) or as the 1987 ratio (second row).
13In the original HK paper, the choice of the year 1997 as the benchmark year wouldbe seen as conservative because 1997 is the year for which the potential U.S. TFP gainsderived from the removal of misallocation are the highest. Consequently, this choice wouldminimize the TFP gains for China and India relative to those for the U.S. However, incomparing France and the U.S., the conservative choice consists in using 1987 as thebenchmark year (when U.S. TFP gains were the lowest)
12

According to the figures in Table 4, hypothetically moving France to the”U.S. efficiency level of 1997” may decrease (rather than increase) TFP byapproximately 5 percent. However, looking at the conservative case, the av-erage efficiency gap between France from 1998 to 2005 and the U.S. in 1987is less than 1 percent. We thus cautiously conclude that the HK methodol-ogy does not allow for comparison of the allocative efficiency of the Frenchand American manufacturing industries.
5 Measurement issues
Our results on the reallocation gains in France relative to the U.S. may bebiased due to differences between the French and U.S. data. In this section,we check for the robustness of our results to some expected downward biasesin our estimates of French TFPR dispersions.
Analysis of the TFPR variance
Our first concern is whether the difference in the sample structure of Frenchand U.S. data can induce a downward bias in the French TFPR dispersions.To shed some light on this issue, we compute how much of the within-yearand industry TFPR dispersion in France is due to differences in firm size,firm age and firm structure (i.e., mono- versus multi-plants).
The results of this exercise are reported in Table 5. Specifically, columns1 and 2 provide, respectively, the coefficients and the standard errors of alinear regression of the intra-industry variance of log of firm TFPR on firmsize, firm age, and firm structure. The regression also includes a full set ofyear dummies, which are all significant but whose coefficients and standarderrors are not reported (to save space). Column 3 provides the percentage ofthe intra-industry variance of TFPR (within-year), which is explained by theage, size and multi-plant structure of firms. The cumulated contribution ofthese three variables to the variance is reported in the last row of the table.
Table 5: Analysis of the French intra-industry TFPR dispersion
Size Age Multi-plant total% of the variance 1.00% 4.95% 0.05% 6,01%
Notes. The dependent variable is the variance of the deviation of the firm log TFPRfrom its industry average. The explicative variables are size quartiles, age quartiles, and adummy variable, which takes the value 1 for firms with more than one plant and the value0 for mono-plant firms. The regression includes a full set of year dummies (not reportedin the table).
Table 5 shows that the variance of log TFPR is weakly impacted by
13

firm-level variables. In particular, the variance of intra-industry, intra-yearlog TFPR is larger within the sub-groups of smaller firms, younger firms,and multi-plant firms. The U.S. dataset includes more numerous small firmsthan the French dataset (which covers only firms of more than 20 employees),which can introduce a downward bias in the estimated TFPR dispersion ofFrench firms relative to U.S. firms. However, the fact that the French datasetcovers firms while the U.S. dataset covers plants is not likely to introduceany bias in the estimated firm TFP dispersion. Indeed, the plant structureof French firms (mono- versus multi-plants) has only a weak impact on thevariance of log TFPR (approximately 0.05%). Moreover, dispersion acrossmulti-plant firms is larger than dispersion across mono-plant firms. Interest-ingly, the firm-level variable, which has the strongest impact on the FrenchTFPR dispersion, is the age of the firm (not its size). The former variable(age) explains almost 5% of the intra-industry variance of log TFPR, whilethe latter (size) explains only 1% of it. However, the firm-level variables donot explain much more than 6% of the intra-industry variance of log TFPR.Thus, it is unlikely that the differences between the French and U.S. dataregarding the unit surveyed affect the estimated TFPR dispersions.
Trends in Misallocation
A second issue is whether the TFPR dispersion in France exhibits a decreas-ing trend over the period of coverage, which could introduce a downwardbias in the estimated intra-industry variance of log TFPR. If such a trendexisted, this could partly explain why we do not find an efficiency gap be-tween the French manufacturing data between 1998 and 2005 and the U.S.manufacturing data between 1977 and 1997.
In Figure 1 above, we then trace the evolution of TFPR dispersion overour period of coverage: 1990-2007. The values reported in Figure 1 corre-spond to the weighted sum across industries of the variance of the deviationof the firm log TFPR to its industry average. Figure 1 shows an increasingtrend in the intra-industry TFPR dispersion, decreasing the likelihood of adownward bias in firm TFPR dispersion in France due to a difference in theperiod of coverage between French and U.S. data.
Alternative measure of capital stocks
We may also want to check to what extent our results are sensitive to al-ternative measures of key firm-level and industry-level variables. Here, ourmain concern is the way we estimated firm capital stocks. We relied on realcapital stocks inferred from the past investment series of firms14 followinga traditional perpetual inventory method (PIM). Specifically, we computed:
14Actually, we are able to trace firm investments back to 1984 or, for firms started after1984, back to their date of entry in the dataset.
14

Figure 1: Evolution of the Dispersion of TFPR.
Ki,t = (1− δS,t−1)Ki,t−1]+ Ii,t/PI,S,t where Ki,t is the capital stock of firm iat date t, δS,t−1 is the depreciation rate at the date t−1 in industry S, Ii,t isthe nominal amount invested by firm i at date t, and PI,S,t is the price indexof investment in industry S at time t. Both investment price indexes anddepreciation rates are defined at the 2-digit industrial classification level.While this methodology is known to provide more reliable estimates of firmreal capital stocks than the current book values of capital method (as HKdid), it may have introduced a downward bias into our French TFPR disper-sion relative to what has been observed by HK for the U.S. economy. Indeed,if real capital stocks are a less noisy variable than current book values, itcould partially explain why the French TFPR dispersion does not appear tobe higher and may even be slightly lower than the U.S. TFPR dispersion.In that respect, it is noticeable that Camacho and Conover (2010), whichalso used a PIM methodology to compute real capital stocks, found a muchlower TFPR dispersion in Colombia compared to other developing countries,such as India and China. To check for this potential bias, we re-estimateour TFPR indexes using the current book value of tangible assets insteadof the real capital stocks as our firm capital input variables.
The results, presented in Table 6, show that our estimates for the dis-persions of TFPR in France are not significantly affected by the way wemeasure firm capital inputs. Both the standard deviations and the ratios of
15
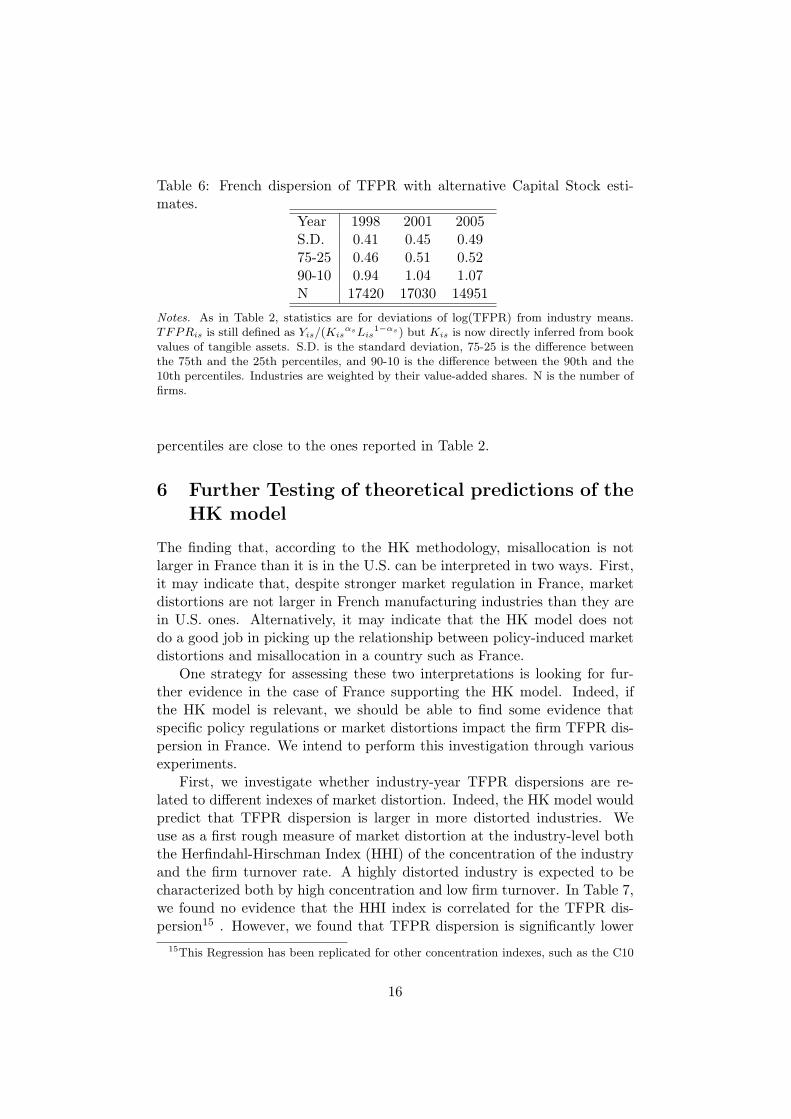
Table 6: French dispersion of TFPR with alternative Capital Stock esti-mates.
Year 1998 2001 2005S.D. 0.41 0.45 0.4975-25 0.46 0.51 0.5290-10 0.94 1.04 1.07N 17420 17030 14951
Notes. As in Table 2, statistics are for deviations of log(TFPR) from industry means.TFPRis is still defined as Yis/(Kis
αsLis1−αs) but Kis is now directly inferred from book
values of tangible assets. S.D. is the standard deviation, 75-25 is the difference betweenthe 75th and the 25th percentiles, and 90-10 is the difference between the 90th and the10th percentiles. Industries are weighted by their value-added shares. N is the number offirms.
percentiles are close to the ones reported in Table 2.
6 Further Testing of theoretical predictions of theHK model
The finding that, according to the HK methodology, misallocation is notlarger in France than it is in the U.S. can be interpreted in two ways. First,it may indicate that, despite stronger market regulation in France, marketdistortions are not larger in French manufacturing industries than they arein U.S. ones. Alternatively, it may indicate that the HK model does notdo a good job in picking up the relationship between policy-induced marketdistortions and misallocation in a country such as France.
One strategy for assessing these two interpretations is looking for fur-ther evidence in the case of France supporting the HK model. Indeed, ifthe HK model is relevant, we should be able to find some evidence thatspecific policy regulations or market distortions impact the firm TFPR dis-persion in France. We intend to perform this investigation through variousexperiments.
First, we investigate whether industry-year TFPR dispersions are re-lated to different indexes of market distortion. Indeed, the HK model wouldpredict that TFPR dispersion is larger in more distorted industries. Weuse as a first rough measure of market distortion at the industry-level boththe Herfindahl-Hirschman Index (HHI) of the concentration of the industryand the firm turnover rate. A highly distorted industry is expected to becharacterized both by high concentration and low firm turnover. In Table 7,we found no evidence that the HHI index is correlated for the TFPR dis-persion15 . However, we found that TFPR dispersion is significantly lower
15This Regression has been replicated for other concentration indexes, such as the C10
16
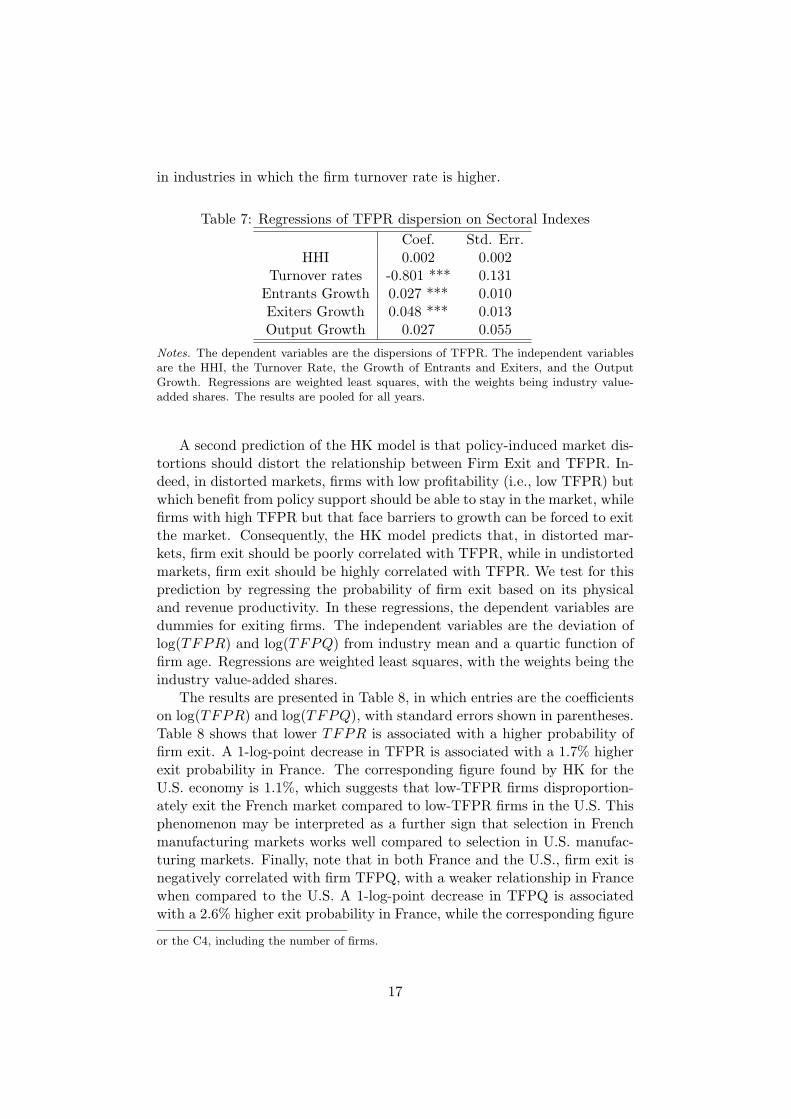
in industries in which the firm turnover rate is higher.
Table 7: Regressions of TFPR dispersion on Sectoral Indexes
Coef. Std. Err.HHI 0.002 0.002
Turnover rates -0.801 *** 0.131Entrants Growth 0.027 *** 0.010Exiters Growth 0.048 *** 0.013Output Growth 0.027 0.055
Notes. The dependent variables are the dispersions of TFPR. The independent variablesare the HHI, the Turnover Rate, the Growth of Entrants and Exiters, and the OutputGrowth. Regressions are weighted least squares, with the weights being industry value-added shares. The results are pooled for all years.
A second prediction of the HK model is that policy-induced market dis-tortions should distort the relationship between Firm Exit and TFPR. In-deed, in distorted markets, firms with low profitability (i.e., low TFPR) butwhich benefit from policy support should be able to stay in the market, whilefirms with high TFPR but that face barriers to growth can be forced to exitthe market. Consequently, the HK model predicts that, in distorted mar-kets, firm exit should be poorly correlated with TFPR, while in undistortedmarkets, firm exit should be highly correlated with TFPR. We test for thisprediction by regressing the probability of firm exit based on its physicaland revenue productivity. In these regressions, the dependent variables aredummies for exiting firms. The independent variables are the deviation oflog(TFPR) and log(TFPQ) from industry mean and a quartic function offirm age. Regressions are weighted least squares, with the weights being theindustry value-added shares.
The results are presented in Table 8, in which entries are the coefficientson log(TFPR) and log(TFPQ), with standard errors shown in parentheses.Table 8 shows that lower TFPR is associated with a higher probability offirm exit. A 1-log-point decrease in TFPR is associated with a 1.7% higherexit probability in France. The corresponding figure found by HK for theU.S. economy is 1.1%, which suggests that low-TFPR firms disproportion-ately exit the French market compared to low-TFPR firms in the U.S. Thisphenomenon may be interpreted as a further sign that selection in Frenchmanufacturing markets works well compared to selection in U.S. manufac-turing markets. Finally, note that in both France and the U.S., firm exit isnegatively correlated with firm TFPQ, with a weaker relationship in Francewhen compared to the U.S. A 1-log-point decrease in TFPQ is associatedwith a 2.6% higher exit probability in France, while the corresponding figure
or the C4, including the number of firms.
17
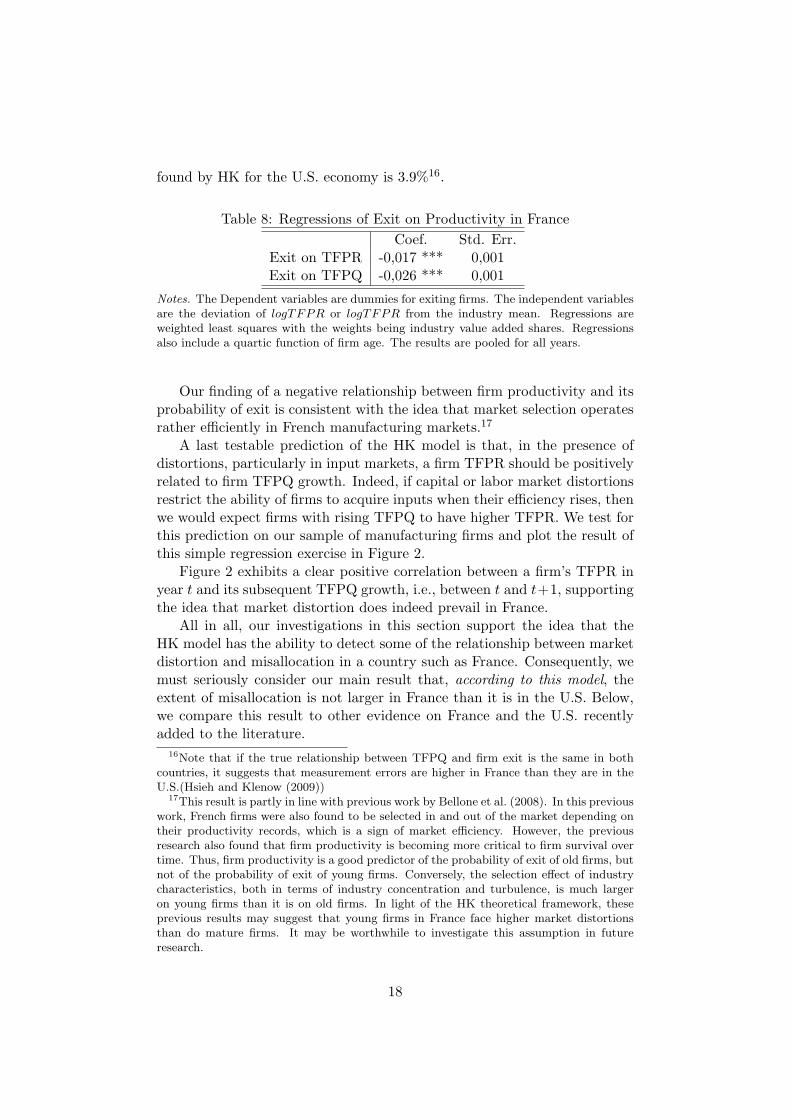
found by HK for the U.S. economy is 3.9%16.
Table 8: Regressions of Exit on Productivity in France
Coef. Std. Err.Exit on TFPR -0,017 *** 0,001Exit on TFPQ -0,026 *** 0,001
Notes. The Dependent variables are dummies for exiting firms. The independent variablesare the deviation of logTFPR or logTFPR from the industry mean. Regressions areweighted least squares with the weights being industry value added shares. Regressionsalso include a quartic function of firm age. The results are pooled for all years.
Our finding of a negative relationship between firm productivity and itsprobability of exit is consistent with the idea that market selection operatesrather efficiently in French manufacturing markets.17
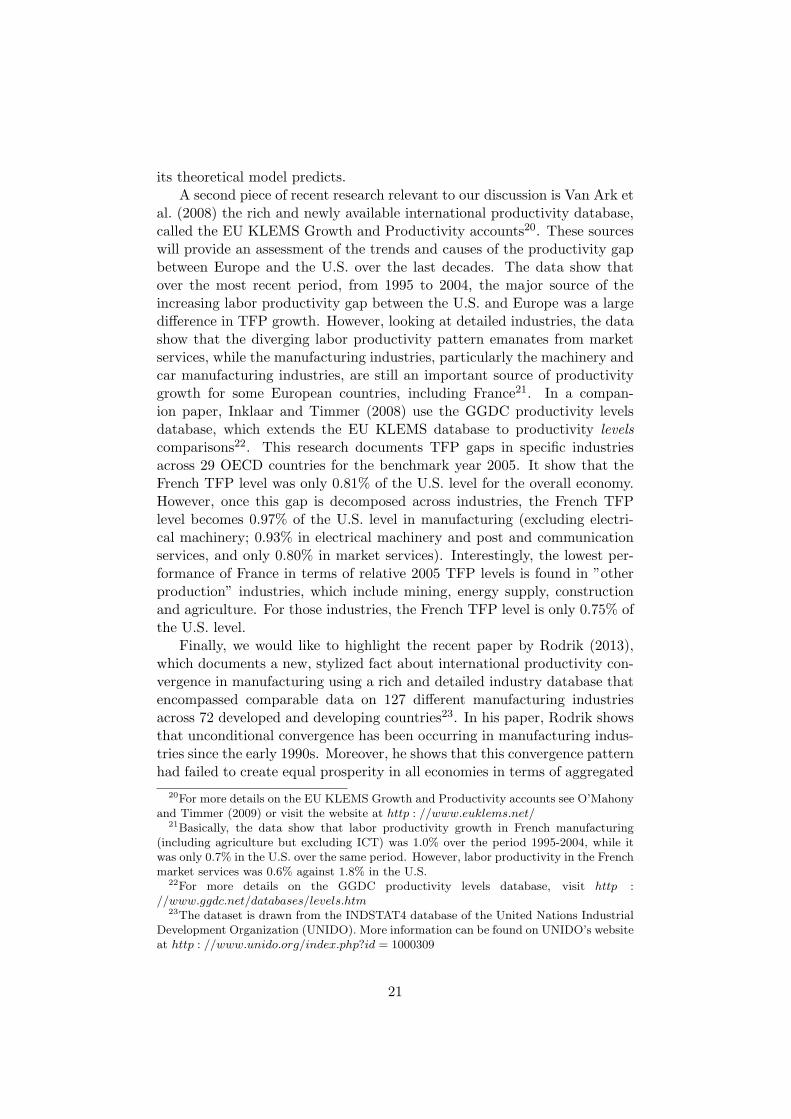
A last testable prediction of the HK model is that, in the presence ofdistortions, particularly in input markets, a firm TFPR should be positivelyrelated to firm TFPQ growth. Indeed, if capital or labor market distortionsrestrict the ability of firms to acquire inputs when their efficiency rises, thenwe would expect firms with rising TFPQ to have higher TFPR. We test forthis prediction on our sample of manufacturing firms and plot the result ofthis simple regression exercise in Figure 2.
Figure 2 exhibits a clear positive correlation between a firm’s TFPR inyear t and its subsequent TFPQ growth, i.e., between t and t+1, supportingthe idea that market distortion does indeed prevail in France.
All in all, our investigations in this section support the idea that theHK model has the ability to detect some of the relationship between marketdistortion and misallocation in a country such as France. Consequently, wemust seriously consider our main result that, according to this model, theextent of misallocation is not larger in France than it is in the U.S. Below,we compare this result to other evidence on France and the U.S. recentlyadded to the literature.
16Note that if the true relationship between TFPQ and firm exit is the same in bothcountries, it suggests that measurement errors are higher in France than they are in theU.S.(Hsieh and Klenow (2009))
17This result is partly in line with previous work by Bellone et al. (2008). In this previouswork, French firms were also found to be selected in and out of the market depending ontheir productivity records, which is a sign of market efficiency. However, the previousresearch also found that firm productivity is becoming more critical to firm survival overtime. Thus, firm productivity is a good predictor of the probability of exit of old firms, butnot of the probability of exit of young firms. Conversely, the selection effect of industrycharacteristics, both in terms of industry concentration and turbulence, is much largeron young firms than it is on old firms. In light of the HK theoretical framework, theseprevious results may suggest that young firms in France face higher market distortionsthan do mature firms. It may be worthwhile to investigate this assumption in futureresearch.
18

Figure 2: TFPR on TFPQ Growth
19

7 Related new findings in the International pro-ductivity gaps literature
In this paper, our basic finding is that, according to the HK methodology,France is similar to the U.S. in terms of allocative efficiency in manufactur-ing. This finding challenges established beliefs that continental Europeaneconomies have higher input and output distortions than does the U.S. econ-omy. Nonetheless, this finding is not at odds with some new evidence re-cently provided by the literature on productivity and misallocation.
First, Bartelsman et al. (2013) (BHS afterwards) exploit a rich sourceof data with harmonized statistics on firm-level variation in manufacturingindustries on a number of countries (5 industrialized economies, includingthe U.S. and France, and 3 emerging economies in Eastern Europe) between1993 and 200118. Consistent with our findings, the data show that within-industry labor productivity dispersion in France is slightly lower than it isin the U.S. Specifically, the BHS data show that the standard deviation inrevenue labor productivity (firm value added over employment) is 0.53 forthe French economy and 0.58 for the U.S. economy. Additionally, the BHSrevealed an even larger gap in the within-industry dispersions of TFP inFrance and the U.S. in favor of France (0.22 standard deviation for Franceagainst 0.38 for the U.S)19.
However, BHS did not conclude that France faces less misallocation thanthe U.S., but rather that the within-industry dispersion of productivity maybe too sensitive to measurement error. BHS proposes instead using, as apreferred measure of misallocation, the within-industry covariance betweenproductivity and size following the industry-level index of productivity de-veloped by Olley and Pakes (1996). According to the OP methodology, ahigh covariance term means that firms with higher than average productivityhave a higher than average market share. Accordingly, a low covariance termshould signal misallocation. Following this alternative approach to misallo-cation, BHS compared the OP covariance term for labor productivity acrosscountries and found, in particular, that France is much less efficient than theU.S., with an OP covariance term (in labor productivity) of 0.24 against anOP covariance term of 0.51 for the U.S. Replicating the BHS methodologyon our own sample, we found a consistent estimate of the OP covarianceterms (in labor productivity) of an average of 0.27 between 1998 and 2005.However, the observed productivity dispersion and productivity covarianceof the BHS methodology do not move in the same direction contrary to what
18For more details on the BHS database, visit the website http ://econweb.umd.edu/ haltiwan/BHS jobflows productivity/
19However, the BHS measure of TFP is not directly comparable to the HK measure ofTFP, as the BHS measure relied on gross output (sales deflated with the industry priceindex).
20
its theoretical model predicts.A second piece of recent research relevant to our discussion is Van Ark et
al. (2008) the rich and newly available international productivity database,called the EU KLEMS Growth and Productivity accounts20. These sourceswill provide an assessment of the trends and causes of the productivity gapbetween Europe and the U.S. over the last decades. The data show thatover the most recent period, from 1995 to 2004, the major source of theincreasing labor productivity gap between the U.S. and Europe was a largedifference in TFP growth. However, looking at detailed industries, the datashow that the diverging labor productivity pattern emanates from marketservices, while the manufacturing industries, particularly the machinery andcar manufacturing industries, are still an important source of productivitygrowth for some European countries, including France21. In a compan-ion paper, Inklaar and Timmer (2008) use the GGDC productivity levelsdatabase, which extends the EU KLEMS database to productivity levelscomparisons22. This research documents TFP gaps in specific industriesacross 29 OECD countries for the benchmark year 2005. It show that theFrench TFP level was only 0.81% of the U.S. level for the overall economy.However, once this gap is decomposed across industries, the French TFPlevel becomes 0.97% of the U.S. level in manufacturing (excluding electri-cal machinery; 0.93% in electrical machinery and post and communicationservices, and only 0.80% in market services). Interestingly, the lowest per-formance of France in terms of relative 2005 TFP levels is found in ”otherproduction” industries, which include mining, energy supply, constructionand agriculture. For those industries, the French TFP level is only 0.75% ofthe U.S. level.
Finally, we would like to highlight the recent paper by Rodrik (2013),which documents a new, stylized fact about international productivity con-vergence in manufacturing using a rich and detailed industry database thatencompassed comparable data on 127 different manufacturing industriesacross 72 developed and developing countries23. In his paper, Rodrik showsthat unconditional convergence has been occurring in manufacturing indus-tries since the early 1990s. Moreover, he shows that this convergence patternhad failed to create equal prosperity in all economies in terms of aggregated
20For more details on the EU KLEMS Growth and Productivity accounts see O’Mahonyand Timmer (2009) or visit the website at http : //www.euklems.net/
21Basically, the data show that labor productivity growth in French manufacturing(including agriculture but excluding ICT) was 1.0% over the period 1995-2004, while itwas only 0.7% in the U.S. over the same period. However, labor productivity in the Frenchmarket services was 0.6% against 1.8% in the U.S.
22For more details on the GGDC productivity levels database, visit http ://www.ggdc.net/databases/levels.htm
23The dataset is drawn from the INDSTAT4 database of the United Nations IndustrialDevelopment Organization (UNIDO). More information can be found on UNIDO’s websiteat http : //www.unido.org/index.php?id = 1000309
21

labor productivity (in the sense that some economies have performed badlyin terms of aggregate labor productivity while converging in terms of man-ufacturing labor productivity). Rodrik (2013) also shows that the countriesthat have experienced deteriorating aggregate performance (despite achiev-ing productivity gains in the manufacturing industries) are the ones thathave failed to reallocate their labor force towards their highest productivesectors. Consequently, Rodrik argues that the source of poor performancein some countries (both developed and developing) is not so much a func-tion of economy-wide misgovernance or endogenous technological change,but of specific circumstances that influence the speed of structural realloca-tion from low productivity to high productivity activities. As France andthe U.S. may differ according to these specific circumstances, Rodrik’s argu-ment may explain why the aggregate productivity gap between France andthe U.S. is still large despite close performance within each single manufac-turing industry.
8 Conclusion
In this paper, we applied the Hsieh and Klenow (2009) methodology onFrench microdata on manufacturing firms to quantify the potential extentof intra-industry misallocation in France versus the U.S. In contrast to whathas been found for developing countries, such as China, India and certaincountries in Latin America, we do not find any sizeable ”efficiency gap” be-tween France and the U.S. in the manufacturing industries. Specifically, theestimated absolute TFP gains for France due to misallocation are approxi-mately 30 percent, which is very close to the figure found for the U.S. andmuch lower than the corresponding figures found for developing countries(which usually range between 50 and 100 percent).
Our results may indicate that the HK methodology can detect large ef-ficiency gaps between developing and developed countries, but it does notdo a good job discriminating across developed countries. Alternatively, ourresults may indicate that allocative efficiency in manufacturing industriesis indeed close in France and the U.S. This latter interpretation challengesestablished beliefs that Continental European economies have higher inputand output distortions than does the U.S. economy. Nonetheless, our re-sults echo some supportive evidence in the recent literature on internationalproductivity gaps and misallocation.
We see three main avenues for further research. First, it may be worth-while to extend the HK comparison to non-manufacturing industries whenlooking at efficiency gaps across developed countries. The working assump-tion would be that market distortions have a stronger impact in terms ofmisallocation within service industries than within manufacturing indus-tries. This could be due either to the fact that the most binding constraints
22
on TFP reallocation gains are specific product market regulations (PMR) innon-manufacturing French industries24 or to the fact that service industriesrespond differently to labor and capital markets distortions.
Second, it may be worthwhile to extend the comparison to other devel-oped countries. Japan would be an interesting case study. Nishimura et al.(2005) show how misallocation lowered aggregate TFP in Japanese manu-facturing industries during the recession of the 1990s. The current researchBellone et al. (2013) shows that TFP gaps between France and Japan arestill large in some manufacturing industries. Thus, despite the general trendof productivity convergence documented by Rodrik, intra-industry misallo-cation could still explains part of the productivity gaps in manufacturingindustries across specific economies. Extending misallocation comparisonsacross countries of similar income levels could also help reveal the deter-minants of economic inefficiency. For instance, Ziebarth (2013) shows thatthe level of productivity dispersion in China and India documented by HK(2009) is actually very similar to the level of productivity in 19th centuryAmerica. For this author, Ziebarth’s result suggests that the institutionalbasis of misallocation may go beyond the distortionary policies typically em-phasized in the literature, as those policies did not exist in the U.S. duringthe 19th century.
Finally, it may be worthwhile to investigate the interplay between intra-industry and inter-industry misallocation in aggregate TFP gaps acrosscountries. In the HK model, market distortions impact TFP only throughintra-industry misallocation because of the simplifying assumption createdby a Cobb-Douglas aggregator in the homogenous final goods industry. Aug-menting the HK framework to allow for both intra -and inter-industry mis-allocation could bring new insights in to the role of market distortions andpolicy regulations in shaping international productivity gaps.
References
Aghion, P., Fally, T. and Scarpetta, S. (2007), ‘Credit constraints as a bar-rier to the entry and post entry growth of firms: Theory and evidence’,Economic Policy 52(4), 731 – 779.
Arnold, J. M., Nicoletti, G. and Scarpetta, S. (2011), ‘Does anti-competitiveregulation matter for productivity? evidence from european firms’, IZADP n. 5511.
Bartelsman, E., Haltiwanger, J. and Scarpetta, S. (2013), ‘Cross-country
24Conway and Nicoletti (2006)and Wolfl et al. (2009) estimate-comparable PMR indi-cators across OECD countries find that PMR indexes are, on average, two times higherin French non-manufacturing sectors than they are in American ones
23
differences in productivity: The role of allocation and selection’, AmericanEconomic Review 103(1), 305–34.
Bellone, F., kozo Kiyota, Matsuura, T., Musso, P. and Nesta, L. (2013),International productivity gaps and the export status of firms: Evidencefrom france and japan, Discussion papers 13011, Research Institute ofEconomy, Trade and Industry (RIETI).
Bellone, F., Musso, P., Nesta, L. and Quere, M. (2008), ‘Market Selectionalong the Firm Life Cycle’, Industrial and Corporate Change 17(4), 753–777.
Camacho, A. and Conover, E. (2010), ‘Misallocation and productivity incolombia’s manufacturing industries.’, IDB Working Paper Series.
Casacuberta, C. and Gandelman, N. (2012), ‘Protection, openness, and fac-tor adjustment: Evidence from the manufacturing sector in uruguay’,Economic Development and Cultural Change 60(3), 597 – 629.
Conway, P. and Nicoletti, G. (2006), ‘Product market regulation in non-manufacturing sectors of oecd countries: Measurement and highlights’,OECD Economics Department Working Paper No 530, OECD, Paris.
Crafts, N. (2006), ‘Regulation and productivity performance’, Oxford Reviewof Economic Policy 22(2), 186–202.
Foster, L., Haltiwanger, J. C. and Krizan, C. (2001), ‘Aggregate productivitygrowth: Lessons from microeconomic evidence’, In New Developments inProductivity Analysis, Chicago: University of Chicago Press.
Hsieh, C.-T. and Klenow, P. J. (2009), ‘Misallocation and manufacturingtfp in china and india.’, Quarterly Journal of Economics 124(4), 1403 –1448.
Hsieh, C.-T. and Klenow, P. J. (2013), ‘Misallocation and manufacturingtfp in china and india: Correction appendix’, Stanford University. Un-published.
Inklaar, R. and Timmer, M. P. (2008), ‘Ggdc productivity level database:International comparisons of output, inputs and productivity at the in-dustry level’, Groningen Growth and Development Centre Research Mem-orandum GD-104, Groningen: University of Groningen.
Machicado, C. G. and Birbuet, J. C. (2012), ‘Misallocation and manufac-turing tfp in bolivia during the market liberalization period’, The B.E.Journal of Macroeconomics 12(1), 1–45.
Neumeyer, P. A. and Sandleris, G. (2010), Understanding productivity dur-ing the argentine crisis, Technical report.
24
Nishimura, K., Nakajima, T. and Kiyota, K. (2005), ‘Does natural selectionmechanism still work in severe recession: Estimation of the japanese econ-omy during the 1990s?’, Journal of Economic Behavior and Organization58(1), 53–78.
Olley, G. S. and Pakes, A. (1996), ‘The dynamics of productivity inthe telecommunications equipment industry’, Econometrica 64(6), 1263–1297.
O’Mahony, M. and Timmer, M. P. (2009), ‘Output, input and productivitymeasures at the industry level: the eu klems database’, Economic Journal119(538), 374–403.
Restuccia, D. and Rogerson, R. (2013), ‘Misallocation and productivity’,Review of Economic Dynamics 16(1), 1–10.
Rodrik, D. (2013), ‘Unconditional convergence in manufacturing’, TheQuarterly Journal of Economics 128(1), 165–204.
Van Ark, B., O’Mahony, M. and Timmer, M. P. (2008), ‘The productivitygap between europe and the united states: Trends and causes’, Journalof Economic Perspectives 22(1), 25 – 44.
Wolfl, A., Wanner, I., Kozluk, T. and Nicoletti, G. (2009), ‘Ten years ofproduct market reform in oecd countries insights from a revised pmrindicator’, OECD Economics Department Working Paper No 695, OECD,Paris.
Ziebarth, N. (2013), ‘Are china and india backwards? evidence from the19th century u.s. census of manufactures’, Review of Economic Dynamics16(1), 86–99.
25
DOCUMENTS DE TRAVAIL GREDEG PARUS EN 2013GREDEG Working Papers Released in 2013
2013-01 Raphaël Chiappini Persistence vs. Mobility in Industrial and Technological Specialisations: Evidence from 11 Euro Area Countries2013-02 Kevin D. Hoover Was Harrod Right?2013-03 Kevin D. Hoover Man and Machine in Macroeconomics2013-04 Isabelle Corbett-Etchevers & Aura Parmentier-Cajaiba Toying with Regulation: ‘Strategizing Tools’ as Organizational Bricolage2013-05 Aura Parmentier-Cajaiba Research Diary Mapping: Enhancing Reflectivity in Process Research2013-06 Richard Arena Sraffa’s and Wittgenstein’s Crossed Influences: Forms of Life and Snapshots 2013-07 Christophe Charlier & Sarah Guillou Distortion Effects of Export Quota Policy: An Analysis of the China - Raw Materials Dispute2013-08 Cristiano Antonelli & Alessandra Colombelli Knowledge Cumulability and Complementarity in the Knowledge Generation Function2013-09 Marco Grazzi, Nadia Jacoby & Tania Treibich Dynamics of Investment and Firm Performance: Comparative Evidence from Manufacturing Industries2013-10 Anna Calamia, Laurent Deville & Fabrice Riva Liquidity in European Equity ETFs: What Really Matters?2013-11 Lauren Larrouy Bacharach’s ‘Variable Frame Theory’: A Legacy from Schelling’s Issue in the Refinement Program?2013-12 Amel Attour Adoption et modèles de diffusion régionale de l’innovation dans les gouvernements locaux: le cas du développement de l’e-Gouvernement en Lorraine2013-13 Anaïs Carlin, Sébastien Verel & Philippe Collard Modeling Luxury Consumption: An Inter-Income Classes Study of Demand Dynamics and Social Behaviors2013-14 Marie-José Avenier & Catherine Thomas Designing a Qualitative Research Project Consistent with its Explicit or Implicit Epistemological Framework2013-15 Amel Attour & Maëlle Della Peruta Le rôle des connaissances architecturales dans l’élaboration de la plateforme technologique d’un écosystème en émergence: le cas des plateformes NFC2013-16 Evelyne Rouby & Catherine Thomas Organizational Attention Elasticity: An Exploratory Case of Cement Production2013-17 Małgorzata Ogonowska & Dominique Torre Residents’ Influence on the Adoption of Environmental Norms in Tourism

2013-18 Isabelle Salle & Pascal Seppecher Social Learning about Consumption2013-19 Eve Saint-Germes & Sabrina Loufrani-Fedida L’instrumentation de la GTEC au service de l’articulation entre compétences individuelles et employabilité : le cas de la plateforme eDRH062013-20 Francesco Quatraro & Marco Vivarelli Entry and Post-Entry Dynamics in Developing Countries2013-21 Dorian Jullien, Judith Favereau & Cléo Chassonnery-Zaïgouche Rationality and Efficiency: From Experimentation in (recent) Applied Microeconomics to Conceptual Issues2013-22 Nabila Arfaoui, Eric Brouillat & Maïder Saint-Jean Policy Design, Eco-innovation and Industrial Dynamics in an Agent-Based Model: An Illustration with the REACH Regulation2013-23 Marc Deschamps Pourquoi des politiques de concurrence ?2013-24 Raphaël Chiappini Do Overseas Investments Create or Replace Trade? New insights from a Macro-Sectoral Study on Japan 2013-25 Jordan Melmiès Industrial Seigniorage, the Other Face of Competition2013-26 Frédéric Marty As-Efficient Competitor Test in Exclusionary Prices Strategies: Does Post-Danmark Really Pave the Way towards a More Economic Approach?2013-27 Alfredo Medio Simple and Complex Dynamics: A Hidden Parameter2013-28 Giorgia Barboni & Tania Treibich First Time Lucky? An Experiment on Single versus Multiple Bank Lending Relationships2013-29 Michele Bernini, Sarah Guillou & Flora Bellone Firms’ Leverage and Export Quality: Evidence from France2013-30 Michele Bernini & Tania Treibich Killing a Second Bird with One Stone? Promoting Firm Growth and Export through Tax Policy2013-31 Marc Deschamps L’articulation économie, droit et politique dans la pensée ordolibérale2013-32 Sophie Pommet The Impact of Venture Capital Investment Duration on the Survival of French IPOs2013-33 Sandye Gloria-Palermo In Search of the Right Tool: From Formalism to Constructivist Modelling2013-34 Benjamin Montmartin & Nadine Massard Is Financial Support for Private R&D Always Justified? A Discussion Based on the Literature on Growth2013-35 Olivier Bruno & Alexandra Girod Procyclicality and Bank Portfolio Risk Level under a Constant Leverage Ratio2013-36 Mario Amendola, Jean-Luc Gaffard & Fabrizio Patriarca Inequality, Debt and Taxation: The Perverse Relation between the Productive and the Non- Productive Assets of the Economy2013-37 Jean-Luc Gaffard La macroéconomie à l’épreuve des faits2013-38 Flora Bellone & Jérémy Mallen-Pisano Is Misallocation Higher in France than in the United States?