is the truth visible? study along the l scale - … · the open psychology journal, 2011, 4, 73-87...
TRANSCRIPT

The Open Psychology Journal, 2011, 4, 73-87 73
1874-3501/11 2011 Bentham Open
Open Access
Is the Truth Visible? Study Along the L Scale
Dvora G. Eitan§,*
Department of Criminology, Bar-Ilan University, Ramat-Gan, Israel
Abstract: This study addresses the problem of "faking bad" (malingering) of abnormal types (non paranoid schizophrenia,
paranoid schizophrenia, and psychopathy) when answering the EPQ-R-S personality questionnaire and clinical scales.
We tested 180 students under two conditions: “fake bad” and “sincerity”. We demonstrated that although answers to
EPQ-R-S may be deliberately and specifically modified, this will be identified in the questionnaire’s scales scoring
profile and the reaction times. When “faking”, P scores were elevated and the results of the other dimensions were also
"negatively" irregular. However their L scores were very low. This low L score should be interpreted as a warning sign of
an attempt to present oneself in a negative light.
Keywords: Personality questionnaires, Faking bad, Malingering, Eysenck Personality Questionnaire, L scale.
1. INTRODUCTION
The “faking bad” is known in the literature as the phenomenon of malingering. Its definition, according to the Diagnostic & Statistical Manual Disorders [1] is producing a lie or an exaggeration of the physical or psychological symptoms in order to obtain various external gains (e.g., avoiding military service, avoid having to work, obtaining monetary compensation, avoiding criminal conviction, consuming drugs, etc.).
The classical research of Rosenhan [2] exemplifies the difficulty in identifying the phenomenon of malingering. One of the attempts to solve the problem is the development of lie scales for measuring the bias of the results. O'Donovan [3] followed the history of these scales, which started in the early 1920s. But for practical purposes, the first beneficial scales were built by Hartshorne and May [4]. Lie scales of this type were used in order to correct other scales for individual biases [5]. The pioneers in this type of use were the authors of the MMPI [6].
In an attempt to solve the problem, Eysenck and Eysenck [7] for the first time added the L scale (L - Lie scale) in the advanced version that they developed for the questionnaire, in the EPI version. In the guide to the EPQ questionnaire [7] they maintained that it was proved that the scale functioned as an index: for dissimilarity - a tendency toward “faking good”, which stands out in favorable conditions (e.g., when filling it in at a job interview), and for several stable personality factors, which can point to some social naïvety. In a later publication, Eysenck and Eysenck [5] suggested that the L scale includes something that depends on the stable personality structure.
*Address correspondence to this author at the Department of Criminology,
Bar-Ilan University, Ramat-Gan, Israel; Tel/Fax: 011-972-3-6960456;
E-mail: [email protected] §This paper is based on research work carried out in the Department
of Criminology of Bar-Ilan University as part of the author’s Ph.D.
dissertation.
Eysenck and Eysenck [5] explained that it is not possible to base interpretation by leaning upon the results of a single scale and that the clear differences obtained among different groups of clinics and normals are not due to single scales, but to a combination of scales, especially the combination of P and L. Thus, frequently, especially psychotics have psychoticism (P) scores that are just negligibly higher than the normal or neurotic groups, but they generally have also very high L scores. In their opinion, the combination of high L and elevated, but not especially high, P is the one that characterizes psychotics (mainly schizophrenics), while inmates, like psychopaths, tend to score higher on P, but low on L. Anyway, in the opinion of Eysenck and Eysenck high L scores always have to function as a warning signal, so it is imperative not to dismiss them.
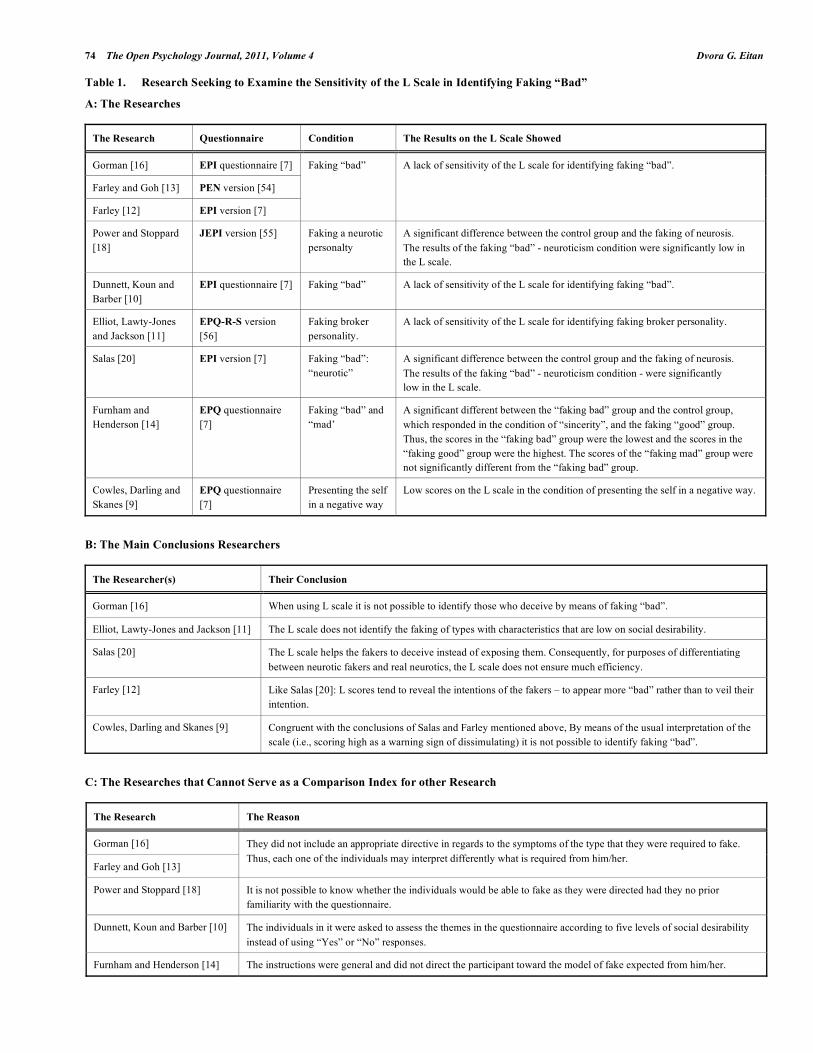
As it appears in Table 1, research seeking to examine the sensitivity of the L scale in identifying faking started already with the early versions of the personality questionnaire of Eysenck [8-20].
The issue of motivation for lying and its influence upon the results troubled other researchers. It appears that the correlation between the scores on the L scale and other scales may provide an insight on the extent to which a group of respondents faked “good” [21].
Michaelis and Eysenck [22] showed that when the conditions provide a high level of motivation for dissimulating, a relatively high negative correlation is obtained between N and L. In parallel to identifying the motivation in the condition “faking good”, the motivation in the condition “faking bad” was examined, but the latter has not yet been addressed in the literature to the same extent. Among the researches that were carried out on this issue were found significant effects on the L scale and the indices (N) neuroticism and (P) psychoticism [23].
Salas [20] showed that under the influence of faking “bad” for neurotic significantly high N scores are obtained, in contrast to significantly low L scores. But Farley [12] was unable to replicate the findings of Salas in regards to the
74 The Open Psychology Journal, 2011, Volume 4 Dvora G. Eitan
Table 1. Research Seeking to Examine the Sensitivity of the L Scale in Identifying Faking “Bad”
A: The Researches
The Research Questionnaire Condition The Results on the L Scale Showed
Gorman [16] EPI questionnaire [7]
Farley and Goh [13] PEN version [54]
Farley [12] EPI version [7]
Faking “bad”
A lack of sensitivity of the L scale for identifying faking “bad”.
Power and Stoppard
[18]
JEPI version [55] Faking a neurotic
personalty
A significant difference between the control group and the faking of neurosis.
The results of the faking “bad” - neuroticism condition were significantly low in
the L scale.
Dunnett, Koun and
Barber [10]
EPI questionnaire [7] Faking “bad” A lack of sensitivity of the L scale for identifying faking “bad”.
Elliot, Lawty-Jones
and Jackson [11]
EPQ-R-S version
[56]
Faking broker
personality.
A lack of sensitivity of the L scale for identifying faking broker personality.
Salas [20] EPI version [7] Faking “bad”:
“neurotic”
A significant difference between the control group and the faking of neurosis.
The results of the faking “bad” - neuroticism condition - were significantly
low in the L scale.
Furnham and
Henderson [14]
EPQ questionnaire
[7]
Faking “bad” and
“mad’
A significant different between the “faking bad” group and the control group,
which responded in the condition of “sincerity”, and the faking “good” group.
Thus, the scores in the “faking bad” group were the lowest and the scores in the
“faking good” group were the highest. The scores of the “faking mad” group were
not significantly different from the “faking bad” group.
Cowles, Darling and
Skanes [9]
EPQ questionnaire
[7]
Presenting the self
in a negative way
Low scores on the L scale in the condition of presenting the self in a negative way.
B: The Main Conclusions Researchers
The Researcher(s) Their Conclusion
Gorman [16] When using L scale it is not possible to identify those who deceive by means of faking “bad”.
Elliot, Lawty-Jones and Jackson [11] The L scale does not identify the faking of types with characteristics that are low on social desirability.
Salas [20] The L scale helps the fakers to deceive instead of exposing them. Consequently, for purposes of differentiating
between neurotic fakers and real neurotics, the L scale does not ensure much efficiency.
Farley [12] Like Salas [20]: L scores tend to reveal the intentions of the fakers – to appear more “bad” rather than to veil their
intention.
Cowles, Darling and Skanes [9] Congruent with the conclusions of Salas and Farley mentioned above, By means of the usual interpretation of the
scale (i.e., scoring high as a warning sign of dissimulating) it is not possible to identify faking “bad”.
C: The Researches that Cannot Serve as a Comparison Index for other Research
The Research The Reason
Gorman [16]
Farley and Goh [13]
They did not include an appropriate directive in regards to the symptoms of the type that they were required to fake.
Thus, each one of the individuals may interpret differently what is required from him/her.
Power and Stoppard [18] It is not possible to know whether the individuals would be able to fake as they were directed had they no prior
familiarity with the questionnaire.
Dunnett, Koun and Barber [10] The individuals in it were asked to assess the themes in the questionnaire according to five levels of social desirability
instead of using “Yes” or “No” responses.
Furnham and Henderson [14] The instructions were general and did not direct the participant toward the model of fake expected from him/her.
Is the Truth Visible? The Open Psychology Journal, 2011, Volume 4 75
L scale. Like Salas, also Farley and Goh [13] showed significant negative relationships between the N and the L dimensions. Furnham and Henderson [14] reported significant negative correlations between N and L in the group faking “bad”, as well as between P and L in the group faking “mad”. The work of Cowles, Darling and Skanes [9] showed that in the condition faking “bad” the L scores go down; however, P and N go up. This inverse tendency between the P scores and the L scores in the group faking “bad” can be explained by the statements of Haapasalo [24]. According to him, those with a high P score tend to score low on L since they do not care about reporting undesirable behavior.
Another way in which it is possible to examine the phenomena of malingering and faking is by means of a meticulous analysis of the response times to the items in the questionnaire [25] (see also [26-32]).
The purpose of the present research is to tackle the problem of clinical malingering (faking “bad”) that occurs in quotidian reality. Using a method that provides the individuals with information about symptoms that are characteristic of the specific personality disturbances that they are required to fake (i.e. [33-34]), which is repeated in many researches that examine the efficacy of various clinical questionnaires in diagnosing faking. This is an issue that has never been examined by means of Eysenck personality questionnaire version EPQ-R-S to this extent and with such research paradigm. Likewise this topic has been seriously underestimated also in researches concerning the rest of the versions of the Eysenck questionnaire. Therefore, in the present work this questionnaire is examined by means of briefing toward becoming a malingerer (faking “bad”) for abnormal types who score high in the P dimension (psychopath, paranoid or non-paranoid schizophrenic). For a detailing of the manipulation see the chapter “Method”. Eysenck [35] sees in the qualities that make up the P dimension general factors that examine potential (or a level of risk) to be stricken by psychosis in a wide range of degrees.
The research shows that in the personality questionnaire of Eysenck the gender plays a role in the scores of those tested in the L scale and in the P dimension. It was found that, relative to the women, men score higher in P [5, 36-40] and lower in L [5, 36-40]. However, there also exist researches that did not report about gender differences in L and in P among “psychotics” [41] and in L and its components A and B among “normals” [41].
In addition, it was found that women are perceived as more reliable than are men [42]. In light of all this, the present research was built according to a balanced distribution of the gender.
Accordingly, we examined whether:
1 Under the condition of malingering (faking “bad”) we will obtain L scores (which refer to the social desirability) that are lower relative to the scores in the condition of responding sincerely.
2 The malingering condition influenced the level of the scores of the P, N and E dimensions.
3 The response times (to the EPQ-R-S questionnaire) in the condition of malingering (faking “bad”) will be longer than the response times in the condition of responding sincerely since additional time is required in order to adapt the answer to the desired model.
2. MATERIALS AND METHODOLOGY
2.1. The Participants
One hundred and eighty individuals having completed 12 years of study took part in the research. Most of them (n = 119) were students who participated in the research in the framework of their obligations as freshmen for the Bachelor’s degree in Criminology. The rest (n = 61) were mostly students or former students of Social Sciences. Half of the participants were males and half were females within the ages of 18 and 30 (the mean age being M = 23.05 years, SD = 1.99). They were sorted according to a balanced order into three equal research groups in the following manner: The group that malingered as psychopaths, the group that malingered as paranoid schizophrenics and the group that malingered as non paranoid schizophrenics (for a detailing of the research procedure see Table 2).
2.2. The Questionnaires
1 The Eysenck Personality Questionnaire - Revised - Short (ERQ-R-S) - [43] in the Hebrew version. The questionnaire contains four dimensions: E, N, P and L, which are measured by means of 48 questions to which the respondent answers with “Yes”/”No”. Psychometric data appear in Glicksohn and Abulafia [37]. In this research the questionnaire was administered by means of a computer (using the Superlab software) and its items were presented randomly to the respondent (see: The Procedure).
2 Questionnaire on personal data.
3 Clinical scales: STQ questionnaire - Psychotic traits questionnaire [44] - in the Hebrew version (which relies mostly on an existing translation of STQ, [45]); MMPI-2
- Pa scale of the Minnesota Multiphasic Personality Inventory [46] in the Hebrew version [47] and Primary and Secondary Psychopathy Scale [48] in the version that was translated into Hebrew according to the conventional rules [49]. The results of these scales are not discuss in this paper and will be discussed in another paper.
2.3. Materials
Cassettes for listening. Three cassettes were prepared in order to manipulate the malingering as suffering from Psychopathic Personality Disorder and from the psychotic mental disorders Paranoid Schizophrenia and Non Paranoid Schizophrenia. The three cassettes (a separate cassette for each personality disorder or mental disorder) contained short segments for describing and illustrating each one of the personality defects that the individuals were asked to fake (according to [1, 50,51]). For purposes of the manipulation, the participants of the research groups were asked to “get into the shoes” of a type with the given personality defect, whose characteristics were read out for them in the cassettes.
76 The Open Psychology Journal, 2011, Volume 4 Dvora G. Eitan
In order to manipulate sincerity, an additional cassette was prepared which presents the subject of faking in personality questionnaires. This was done while emphasizing the ways in which it is possible to identify faking, so as to avoid to the maximum extent possible the interfering influences of the type malingering or desirability. The contents of the cassettes were also printed and given to the individuals so they could read them while listening to the cassettes.
2.4. Procedure
The individuals were invited to participate (themselves or to suggest a friend who would participate instead of them) in an experiment on eligibility for receiving supplementary income from the State in exchange for signing up to take part in a one-hour experiment, which they need in the framework of the academic requirements from the freshmen students in the Department of Criminology at Bar Ilan University. The experiment was conducted individually in the laboratory, in front of the computer screen. When the students came to the laboratory, they were classified into a determined research group according to a planned balanced design which was determined beforehand and filled in a questionnaire about personal details. The experiment included two stages. Half of the individuals in each of the research groups went through Stage A first and, after an intermission of approximately ten minutes, they started carrying out Stage B. The rest of the individuals went through the same stages but in the inverse order. Below there is a detailing of each one of the stages (the individuals are referred to as males due to practical purposes of convenience only).
2.4.1. Stage A
The researcher chose the appropriate cassette for each one of the individuals according to the planned design. When each individual of the research group came to the laboratory, he was told by the researcher that he would have to fake a determined personality deficiency, antisocial personality or paranoid/non paranoid schizophrenic, according to the research group to which he belonged, in order to claim eligibility to receive supplemental income from the State. Then, he would listen to a cassette that presented an antisocial or paranoid schizophrenic or non paranoid schizophrenic, according to the deficiency that he was
requested to fake. The cassette also was accompanied by a written text. For this the researcher provided to each participant preliminary instructions which were formulated thusly: “Please, carefully listen to the cassette that narrates the text that you were given, so you can fake either a psychopath or a paranoid/non paranoid schizophrenic [one of the three deficiencies that would be assigned to them] in your responses to the questionnaire that will be given to you immediately afterwards.” Also, the researcher added: “Pay attention, your success in the experiment is your ability to malinger, that is, to fake in your responses to the questions that you will be asked later on and to present yourself as a psychopath or as a paranoid/non paranoid schizophrenic [one of the three deficiencies that would be assigned to them]”. Then, after having listened to the cassette, the individuals were instructed by the researcher to fake the personality deficiency that was presented to them in the cassette, in the following manner: “Please respond to the questions as if you were a psychopath/paranoid schizophrenic/non paranoid schizophrenic [one of the three deficiencies that would be assigned to them].”
Next, in order to confirm the manipulation, the
individuals filled in, according to a balanced order, the following questionnaires: STQ, Pa scale of the MMPI-2 and
Primary and Secondary Psychopathy Scale. Immediately
afterwards, all of the participants responded to the EPQ-R-S questionnaire that was administered to them, item by item,
randomly, by means of a computer. This part of the experiment
was controlled by the Superlab software program, which recorded the response of each one of the respondents
(“Yes”/”No”) and the response time to each item.
2.4.2. Stage B
The researcher handed to the individual a text on the subject of faking and instructed him thusly: “Please carefully listen to the cassette which narrates the text that was given to you, so that you understand the importance of your being sincere in your responses to the questions that will be asked to you later on.” After having listened to the cassette, the respondents were instructed by the researcher thusly: “Please respond to the questions with absolute sincerity.” Next, in order to confirm the manipulation toward sincerity and to measure the true personality data of each respondent, the
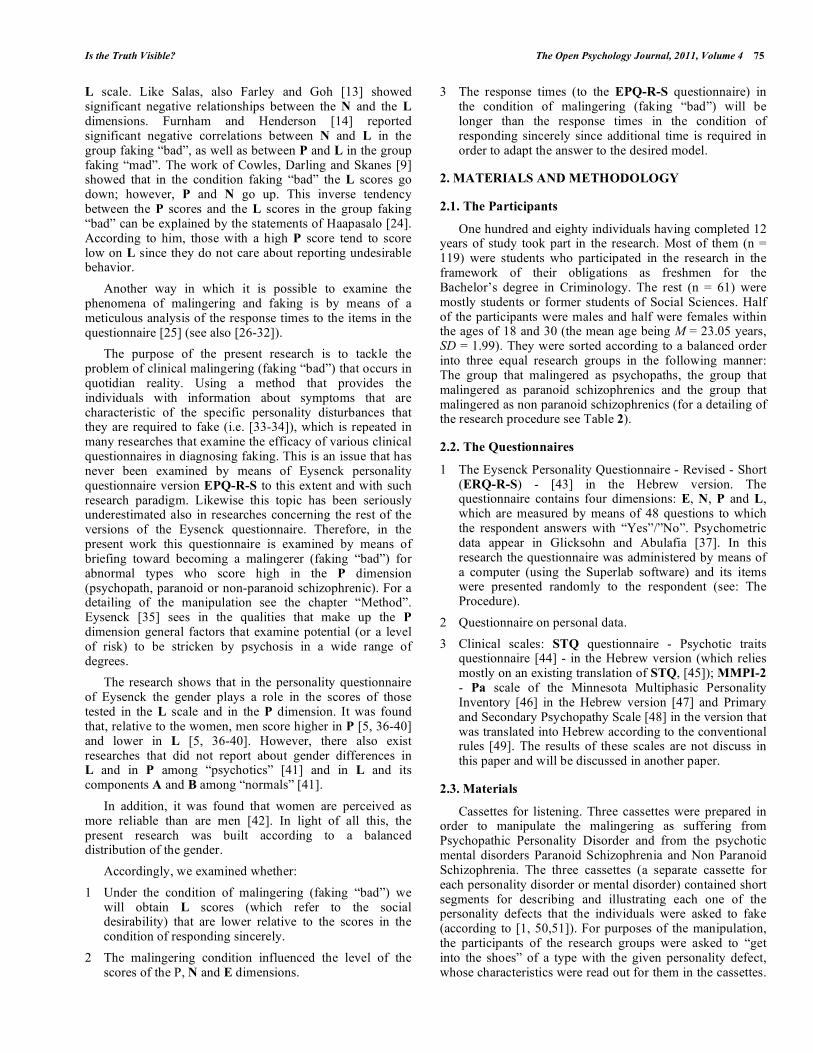
Table 2. The Research Procedure*
Malingering as:
Psychopaths Paranoid Schizophrenics Non Paranoid Schizophrenics
No. and gender Order of the manipulation No. and
gender
Order of the manipulation No. and
gender
Order of the manipulation
Stage A Stage B Stage A Stage B Stage A Stage B
15 males Stage B Stage A
15 males Stage B Stage A
15 males Stage B Stage A
Stage B Stage A Stage B Stage A Stage B Stage A So
rtin
g o
f th
e
pa
rtic
ipa
nts
15 females Stage A Stage B
15 females Stage A Stage B
15 females Stage A Stage B
Total 60 participants 60 participants 60 participants
* Note: Stage A – To fake “bad”; Stage B – To answer sincerely.

Is the Truth Visible? The Open Psychology Journal, 2011, Volume 4 77
respondents filled in, in a balanced order, those same questionnaires that were filled in in Stage A: STQ, Pa scale of the MMPI-2 and Primary and Secondary Psychopathy Scale. Immediately afterwards, all of the respondents filled in the EPQ-R-S questionnaire that was administered to them, item, by item, randomly, by means of a computer. Similarly to Stage A, this part of the experiment was controlled by the Superlab software program, which recorded the response of each one of the respondents (“Yes”/”No”) and the response time to each item.
3. RESULTS
3.1. Analysis of the Responses to the Eysenck
Questionnaire According to the Research Hypotheses
3.1.1. Factor Analysis
The primary analysis is devoted to the factorial structure
of the computerized EPQ-R-S questionnaire, which served as the main research tool for collecting the data. This examination becomes necessary in light of the worry lest the transferring of the questionnaire from its original (printed)
version to the computerized version affect its validity, namely, that the questionnaire in its new medium will measure something different from what the printed version measured [52].
Separate factor analyses were carried out for each of the
research conditions (“faking bad” and “sincerity”) – each of which represented a mini research in itself. The factor analysis of the data that were collected in the “sincerity” condition was carried out in order to examine the validity of
the computerized version. The factor analysis of the data that were obtained in the “faking bad” condition was meant to examine the influence of the manipulation. At the beginning of every analysis two examinations were carried out. The
first one, the “Plot Screen” test for ascertaining the existence of four central factors and, the second, the correlations matrix test between the factors that were obtained, according to which the appropriate statistical solution for the analysis
was determined. Thus, for the “sincerity” condition a solution of the orthogonal type was suggested (which, in a comparison also was found to be very similar to a solution of the non orthogonal type) and for the “faking bad” condition a
solution of the non orthogonal type was presented. The examination of the errors of the items for each one of the factors was carried out according to the criteria level of .4 at least.
In the factor analysis of the data that were collected in the
“sincerity” condition four main factors were identified, which together explain 33.4% of the variance. The factors that were obtained are as follows: the first factor (which explains 14.7% of the variance) was identified as an N
factor. The second factor (8.7% of the variance) was identified as an E factor. The third factor (5.3% of the variance) was identified as an L factor. The fourth factor (4.7% of the variance) was identified as a P factor. The
loadings for the L and P factors were obtained in the opposite direction. Indeed, a number of items – 19, 33 and 18 – were loaded upon their dimensions (E, L and P, respectively), but with a loading lower than .4. Also, a
number of items – 2, 26, 28 (which belong to the P
dimension), 45 and 47 (which belong to the L dimension) – which were loaded lower than .4 on all of the dimensions. The factor upon which they were loaded at the highest level (N) was not compatible with the scale to which they
theoretically belong. But, as a rule, these findings indicate that the computerized version preserved the validity of the original version of the questionnaire.
In the findings of the factor analysis that was carried out on the data that were obtained in the “faking bad” condition four main factors were identified, which together explain 42.3% of the variance. The factors that were obtained are: the first factor (20.3% of the variance) was identified as an N factor. The second factor (11.6% of the variance) was identified as an E factor. The third factor (6.1% of the variance) was identified as an L factor. The fourth factor (4.3% of the variance) was identified as a P factor. The loadings for the L and the P factors were obtained in the opposite direction. Indeed, a number of items, 31 and 42, were loaded upon their dimensions (E and P, respectively), but in a loading lower than .4. Also, a number of items – 2, 6 and 10 (which belong to the P dimension) and 21, 34 and 46 (which belong to the N dimension) – which were loaded lower than .4 on all of the dimensions. The factor upon which they were loaded at the highest level (N) was not compatible with the scale to which they theoretically belong (carriers 2 and 6 were loaded upon N, item 10 was loaded upon L and items 21, 34 and 46 were loaded upon the P dimension). But, these findings indicate that also in the “faking bad” condition, as a rule, the computerized version of the questionnaire preserves the validity of the original version of the questionnaire. (It is reasonable to assume that the minute incompatibilities between the two versions stem from the effect of the manipulation upon the responses of the individuals).
The values of the scales in the “sincerity” condition show the following distributions
1: P has a positive asymmetric
distribution, E has a negative asymmetric distribution, N has a positive asymmetric distribution and for L a symmetric distribution was obtained. Compared with them, the values of the scales in the “faking bad” condition, save the distribution of the L scale, show mirror-image distributions: P has a negative asymmetric distribution, E has a positive asymmetric distribution, N has a negative asymmetric distribution and L has a positive asymmetric distribution. The picture of the distributions that were obtained in the “faking bad” condition exemplifies the influence of the attempt at faking on the part of the individuals upon the results (the distributions of all the scales in the two experi- mental conditions are shown in the chart in Appendix G).
3.1.2. Preliminary analyses
3.1.2.1. Examination of the Order in which the Experiment was Carried Out
In order to neutralize the influence of the order in which
the experiment was carried out (“faking bad” – “sincerity” or
1 The values of the P, E and L scales in the “sincerity” condition show characteristic
distributions according to the findings of the research by Glicksohn and Abulafia 37. Glicksohn J, Abulafia J. Embedding sensation seeking within the big three. Pers
Individ Dif 1998; 25: 1085-99.

78 The Open Psychology Journal, 2011, Volume 4 Dvora G. Eitan
“sincerity” – “faking bad”) the experiment was carried out in
a balanced manner in which half of the individuals were
requested in the first stage to fake and in the second stage to present themselves in a sincere manner and half of them vice
versa (see the chapter on the Method in the section
Procedure). But, “the order in which the experiment was carried out” may bear an influence as an interfering factor in
general when carrying out this type of experiments, which
examine the effect of the condition “faking” as compared with the within-individuals condition “sincerity” in the
EPQ-R-S. In order to research the issue, a preliminary
analysis was carried out which examined the influence of “the order in which the experiment was carried out” and the
“type of faking” (“faking non-paranoid schizophrenia”,
“faking paranoid schizophrenia”, “faking psychopathy”) upon the scores of the difference (= scores in the stage of
“sincerity” - scores in the stage of “faking”) of each one of
the scales of the EPQ-R-S (P, E, N and L). According to Table 3, no significant effect was found for “the order in
which the experiment was carried out”. Also, according to
Table 4, no interaction was found between “the order in which the experiment was carried out” and “type of faking”.
In light of all this, in the continuation of the analysis the
researcher did not address the order in which the experiment was carried out and the groups that were asked to fake the
same type of defect were unified.
Table 3. Examination of the Order in which the Experiment
was Carried Out
F(1,174) MSE
L 1.09 11.74 ns
P .0016 - 8.73 ns
E 3.02 14.59 ns
N 2.5 14.23 ns
Table 4. Examination of the Interaction between “the Order
in which the Experiment was Carried Out” and
“Type of Faking”
F(1,174) MSE
L .63 11.74 ns
P .27 8.73 ns
E .67 14.59 ns
N .52 14.23 ns
3.1.2.2. Examination of Gender Differences
In order to neutralize the influence of gender differences a balanced array of individuals was sampled, in which half of the participants were males and half of them were females, which were sorted in a balanced manner into three research groups (see the chapter on the Method in the section
of Participants). Anyway, we examined the influence of gender upon the results of the central questionnaire in the research, the EPQ-R-S, in each one of the research conditions separately and upon the capacity to “fake” of the participants.
For purposes of examining the influence of gender upon
the results in the conditions “sincerity” and “faking”
separately, for each one of them an analysis of variance was carried out made up of a set of six different unidirectional
analyses, which examine the influence of the factor gender
upon the dependent variable – one of the scores of the four scales of the questionnaire (P, E, N and L) in the “sincerity”
and the “faking” conditions, respectively. According to
Table 5, in the “sincerity” condition, except for the N dimension, in all of the scales no main effect was found for
gender. The main effect obtained for the N dimension is
presented in Fig. (1). According to Table 6, in the “faking” condition, no main effect was obtained for gender.
Table 5. Gender Differences in the “Sincerity” Condition
F(1,178) MSE p <
L 2.38 1168.94 ns
L: A 7.00 411.80 .01
L: B .00 346.54 ns
P .02 421.61 ns
E 2.55 1214.55 ns
N 5.74 1758.28 .05
Fig. (1). The influence of the gender upon the scores of the N
dimension in the “sincerity” condition.
The results of examining the influence of gender upon the scores of
the N dimension in the “sincerity” condition. A significant main
effect was obtained for the research gender (p> .05).
In order to investigate the gender differences in the capacity to “fake”, four bidirectional analyses of variance with one within-individuals factor – research condition (“sincerity”,

Is the Truth Visible? The Open Psychology Journal, 2011, Volume 4 79
“faking”) – were carried out and with an additional between-individuals factor –gender (female, male) –, whereas the dependent variable is each one of the scores in the four scales of the questionnaire (P, E, N and L). According to Table 7, for all of the scales no significant effect was found for gender. According to Table 8, for the P, E and N scales no interaction was found between gender and research condition either. Only in the L scale was found an interaction between gender and research group (F(1,178) = 4.48, MSE = 6.29, p> .05) as shown in Table 8 and in Fig. (2).
Table 6. Gender Differences in the “Faking” Condition
F(1,178) MSE p <
L 1.93 1132.678 ns
L: A 1.76 324.44 ns
L: B 1.57 333.92 ns
P .15 1281.89 ns
E .00 2404.01 ns
N .02 1596.86 ns
Table 7. Gender Differences in the Capacity to “Fake”
F(1,178) MSE p <
L .02 6.42 ns
P .19 4.21 ns
E .91 10.66 ns
N 3.52 8.87 ns
Table 8. Examination of the Interaction between Gender and
Research Condition
F(1,178) MSE p <
L 4.48 6.29 .05
P .06 5.36 ns
E .81 9.67 ns
N 2.56 9.98 ns
So, in general, the gender had no influence as main effect in itself upon the results of the “faking”. Also, except for the L scale, no influence upon the results was found for the capacity “to fake” – namely, the combined influence of the gender together with the determined research condition (“faking” - “sincerity”). Therefore, since the sample also was balanced from the point of view of the gender, there is no reference to gender in the rest of the analysis.
Fig. (2). The influence of the gender and the research condition
upon the scores in L scale.
Interaction was found in the L scale between gender and research
condition: “faking” condition (of a non paranoid schizophrenic, a
paranoid schizophrenic and a psychopath) and “sincerity” (p> .05)
(but no significant effect was found for gender).
3.1.3. The General Model for the Analysis of the Main
Hypotheses
In order to examine the Main Hypotheses of the research (examining the capacity of the individuals to fake in the questionnaires that were filled in)
2 a bidirectional analysis of
variance was carried out with one within-individuals factor, research condition (“faking”, “sincerity”), and with an additional between-individuals factor, research group (“faking non-paranoid schizophrenia”, “faking paranoid schizophrenia” and “faking psychopathy”), namely, the factor that represents the type of faking. The dependent variables are the L scale (in order to examine hypothesis No. 1), the scores on the P dimension (in order to examine hypothesis No. 2) and the rest of the scales in the Eysenck questionnaire (in order to examine hypothesis No. 2). Also, in order to investigate the influence of the research condition and the group upon the differences between the three research groups in each one of the aforementioned variables a series of two planned comparisons was carried out for each one of them: One, between the groups of faking schizophrenia (faking non-paranoid schizophrenia versus faking paranoid schizophrenia) and, the other, between the groups of faking schizophrenia and the group of faking psychopathy.
3.1.4. The Sensitivity of the L Scale to Faking
According to Fig. (3), it appears that the means of the L dimension in the “faking” condition of non-paranoid schizophrenic, paranoid schizophrenic and “faking” a
2 Examination of the “sincerity” condition In order to ascertain that there are no differences between the three research groups in
the “sincerity” condition and that all of the differences are only the result of the manipulation of the “faking” condition or the interaction between the two, a
unidirectional analysis was carried out, which examined the influence of the “type of
faking” (“faking non-paranoid schizophrenia”, “faking paranoid schizophrenia” and “faking psychopathy”) upon the data that were collected in the “sincerity” condition in
each one of the 4 dependent dimensions that participated in the research: L, P, E and N. As expected, no significant effect was found for the “type of faking” in the results of
the “sincerity” condition in all of the 4scales (L: F(2,177) = .07, MSE = 6.69, ns; P: F(2,177) = 1.72, MSE = 2.34, ns; E: F(2,177) = 1.17, MSE = 6.87, ns; N: F(2,177) =
1.04, MSE = 10.14, ns).

80 The Open Psychology Journal, 2011, Volume 4 Dvora G. Eitan
psychopath are lower than the means of the scores in the L dimension in the “sincerity” condition. Indeed, according to Table 9, a significant effect was obtained for the research condition and for the research group, as well as an interaction among them as shown also in Fig. (3). Form all this it is possible to sum up (for the examination of hypothesis No. 1) that the scores of the L scale are lower in the “faking” stage than they are in the “sincerity” stage.
Table 9. Examination of the Sensitivity of the L Scale to
Faking
F(1,177) MSE p <
Research condition 117.18 5.85 .0001
Research group 7.89 6.13 .01
The interaction among them 9.56 5.85 .01
According to Table 10, comparisons between groups were carried out in order to examine the interaction. From the results of the first comparison emerges that between the groups that faked schizophrenia no significant difference was found. From the second comparison resulted that the individuals of the group that faked psychopathy obtained in the “faking” condition low L scores with a significant difference relative to the scores of the groups that faked schizophrenia. Thus, it appears from the figure that in the “faking” condition the Standard Error in the group that faked psychopathy is small relative to the other groups. It is possible that in this group the desired way of faking the items of the L dimension is more clearly perceived.
3.1.5. The Capacity to Fake of the P Dimension
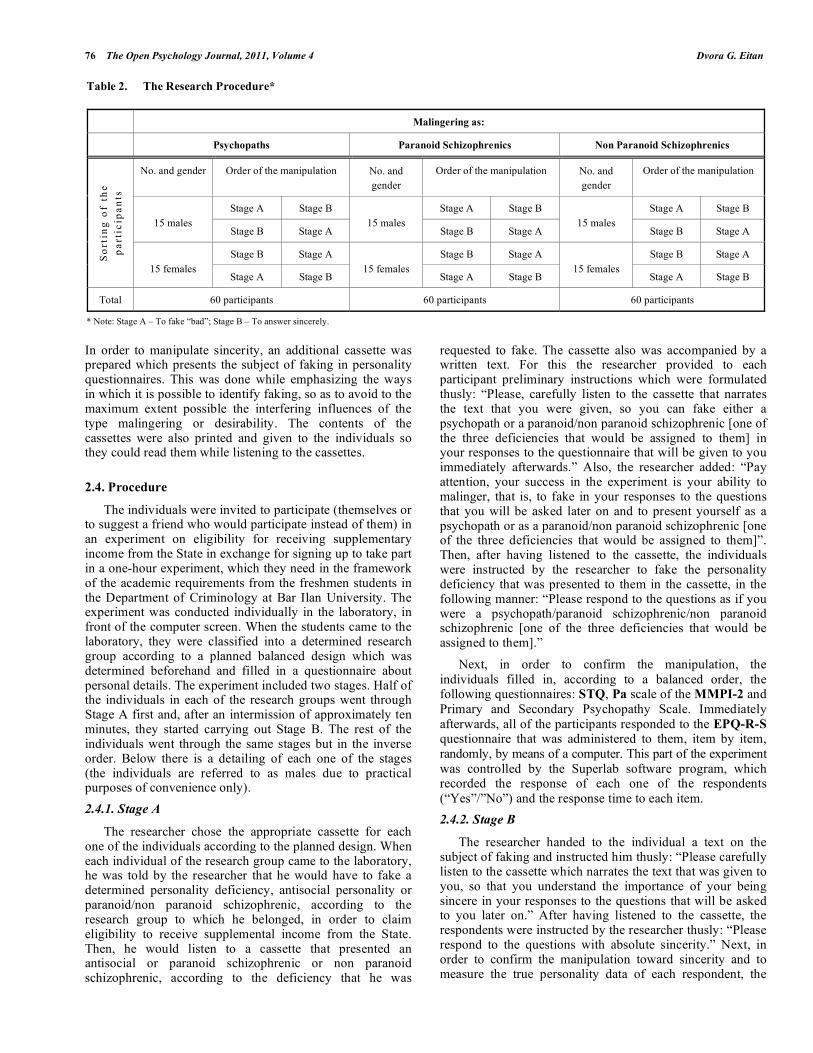
According to Fig. (4), it is possible to see that the mean of the P scores in the condition of “faking” of a non
paranoid schizophrenic, a paranoid schizophrenic and a psychopath is higher than the mean of the scores in the “sincerity” condition. Indeed, according to Table 11, a significant effect was obtained for the research condition for the research group and that there is an interaction between them as shown in Fig. (4). From all this emerges that, according to the expectation, the P scores in the “faking” condition are significantly higher than the P scores in the “sincerity” condition in each one of the research groups (hypothesis No. 2).
Table 10. Examination of the Comparison between the Groups
of Faking for the L Scale
F(1,177) MSE p <
The groups of faking schizophrenia .23 5.849 ns
The groups that faked schizophrenia
and the group that faked psychopathy
18.88 5.85 .0001
According to Table 12, comparisons between groups
were carried out in order to examine the interaction. In the first comparison, between the two groups of faking
schizophrenia, no significant difference was found. The
second comparison, between the groups that faked schizophrenia and the group that faked psychopathy, turned
out to be significant. This means that the individuals in the
group that faked psychopathy obtained in the “faking” condition a significantly higher mean P score relative to the
mean P score of the groups that faked schizophrenia.
3.1.6. The Sensitivity of the Rest of the Scales to Faking
In order to supplement the results of the personality profile obtained under the influence of the manipulation, the rest of the dimensions that appear in the Eysenck
Fig. (3). The influence of the interaction between the research condition and the research group upon the L scores.
The means of the L dimension in the “faking” condition of non-paranoid schizophrenic, paranoid schizophrenic and “faking” a psychopath
are lower than the means of the scores in the L dimension for the “sincerity” condition. A significant effect was obtained for the research condition (p> .0001) and for the research group (p> .01), as well as an interaction among them (p> .01).
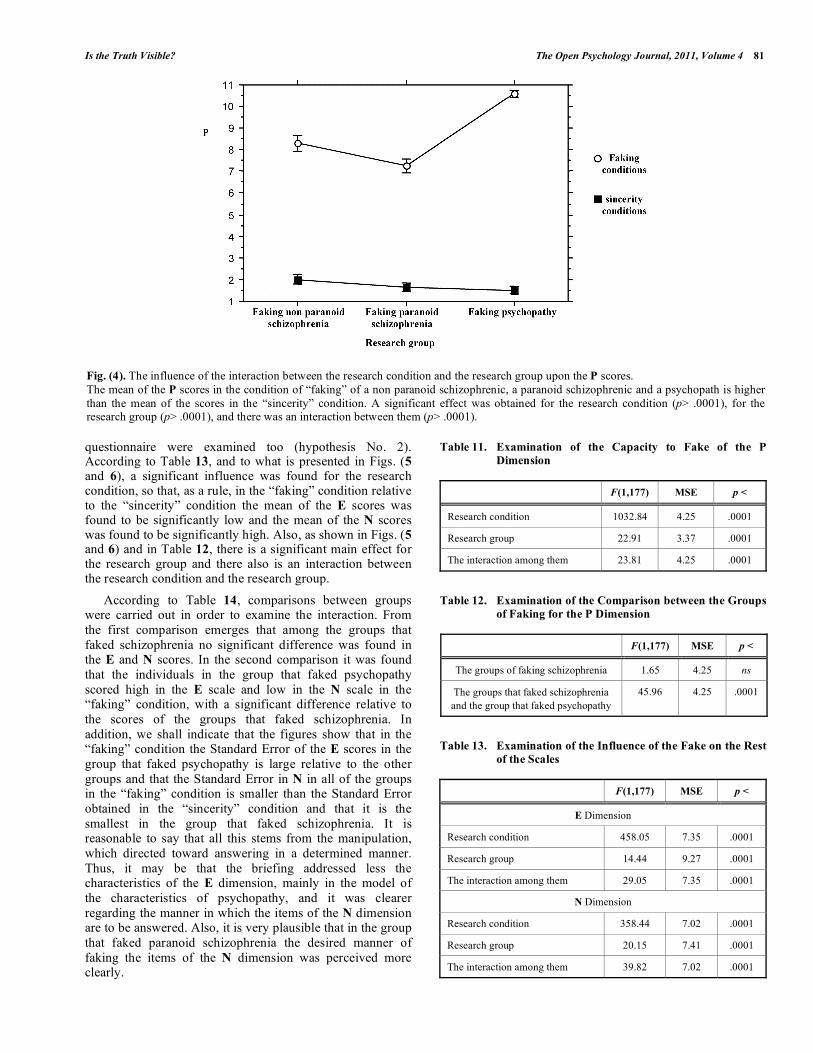
Is the Truth Visible? The Open Psychology Journal, 2011, Volume 4 81
questionnaire were examined too (hypothesis No. 2). According to Table 13, and to what is presented in Figs. (5 and 6), a significant influence was found for the research condition, so that, as a rule, in the “faking” condition relative to the “sincerity” condition the mean of the E scores was found to be significantly low and the mean of the N scores was found to be significantly high. Also, as shown in Figs. (5 and 6) and in Table 12, there is a significant main effect for the research group and there also is an interaction between the research condition and the research group.
According to Table 14, comparisons between groups were carried out in order to examine the interaction. From
the first comparison emerges that among the groups that
faked schizophrenia no significant difference was found in the E and N scores. In the second comparison it was found
that the individuals in the group that faked psychopathy
scored high in the E scale and low in the N scale in the “faking” condition, with a significant difference relative to
the scores of the groups that faked schizophrenia. In
addition, we shall indicate that the figures show that in the “faking” condition the Standard Error of the E scores in the
group that faked psychopathy is large relative to the other
groups and that the Standard Error in N in all of the groups in the “faking” condition is smaller than the Standard Error
obtained in the “sincerity” condition and that it is the
smallest in the group that faked schizophrenia. It is reasonable to say that all this stems from the manipulation,
which directed toward answering in a determined manner.
Thus, it may be that the briefing addressed less the characteristics of the E dimension, mainly in the model of
the characteristics of psychopathy, and it was clearer
regarding the manner in which the items of the N dimension are to be answered. Also, it is very plausible that in the group
that faked paranoid schizophrenia the desired manner of
faking the items of the N dimension was perceived more clearly.
Table 11. Examination of the Capacity to Fake of the P
Dimension
F(1,177) MSE p <
Research condition 1032.84 4.25 .0001
Research group 22.91 3.37 .0001
The interaction among them 23.81 4.25 .0001
Table 12. Examination of the Comparison between the Groups
of Faking for the P Dimension
F(1,177) MSE p <
The groups of faking schizophrenia 1.65 4.25 ns
The groups that faked schizophrenia
and the group that faked psychopathy
45.96 4.25 .0001
Table 13. Examination of the Influence of the Fake on the Rest
of the Scales
F(1,177) MSE p <
E Dimension
Research condition 458.05 7.35 .0001
Research group 14.44 9.27 .0001
The interaction among them 29.05 7.35 .0001
N Dimension
Research condition 358.44 7.02 .0001
Research group 20.15 7.41 .0001
The interaction among them 39.82 7.02 .0001
Fig. (4). The influence of the interaction between the research condition and the research group upon the P scores.
The mean of the P scores in the condition of “faking” of a non paranoid schizophrenic, a paranoid schizophrenic and a psychopath is higher
than the mean of the scores in the “sincerity” condition. A significant effect was obtained for the research condition (p> .0001), for the research group (p> .0001), and there was an interaction between them (p> .0001).

82 The Open Psychology Journal, 2011, Volume 4 Dvora G. Eitan
3.1.7. Results of the Response Times
Firstly, it must be explained that all of the results that are presented regarding the influence of the research condition upon the response times (examination of hypothesis No. 3) refer to the response times after calculating their logarithmic transformation. This is so in order to normalize the distribution of the values of the response times. Thus, the general response time for the questionnaire was calculated in each one of the research conditions (“faking” and “sincerity”) separately and according to the following stages:
1 Calculation of the response times for each one of the four scales according to the sum of the response times of the items that make up each one of the four scales: L, P, E and N.
2 Calculation of the logarithmic transformation of the sum of the response times for the four scales according to the following formula: log10 (L+P+E+N).
From Fig. (7) emerges that the response time to the Eysenck questionnaire in the “faking” condition is longer than the response time to the Eysenck questionnaire in the “sincerity” condition; indeed, in a one-directional analysis of
Fig. (5). The influence of the interaction between the research condition and the research group upon E scores.
Under the influence of the manipulation, a significant influence was found for the research condition. The mean of the E scores was found to
be significantly lower in the “faking” condition relative to the “sincerity” condition (p> .0001). There was also a significant main effect for
the research group (p> .0001) and an interaction between the research condition and the research group (p> .0001).
Fig. (6). The influence of the interaction between the research condition and the research group upon N scores.
Under the influence of the manipulation, a significant influence was found for the research condition. The mean of the N scores was found to
be significantly higher in the “faking” condition relative to the “sincerity” condition (p> .0001). There was also a significant main effect for the research group (p> .0001) and an interaction between the research condition and the research group (p> .0001).

Is the Truth Visible? The Open Psychology Journal, 2011, Volume 4 83
variance that examined the influence of the research condition upon the response time to the questionnaire a significant effect was obtained for the research condition
(F(1,179) = 6.76, MSE = .01, p < .05). In the framework of an extended examination, an analysis of this type was carried out for the response time to each one of the scales. A significant effect was obtained for the research condition in the response time to the P scale (F(1,179) = 24.32, MSE =, .01, p < .0001), as shown in Fig. (8). Also, a significant effect was obtained for the research condition in the response time to the N scale (F(1,179) = 3.94, MSE = .01, p < .05) as shown in Fig. (9). In contrast to this, no significant effects were found for the research condition in the response times to the other scales (L: F(1,179) = .14, MSE = .01, ns; E: F(1,179) = .58, MSE = .01, ns). In sum, the faking of non-paranoid and paranoid schizophrenia or that of psychopathy slowed down the response time of the individuals to the themes of the “pathological” scales only.
3.2. Identifying the Motivation for Faking in the Eysenck
Questionnaire
In order to examine the motivation of the individuals to fake, we proceeded to examine the matrix of the correlations
Table 14. Examination of the Comparison between the Groups
of Faking for the Rest of the Scales
F(1,177) MSE p <
E Dimension
The groups of faking schizophrenia 2.40 7.35 ns
The groups that faked schizophrenia
and the group that faked psychopathy
55.71 7.35 .0001
N Dimension
The groups of faking schizophrenia .9 7.02 ns
The groups that faked schizophrenia
and the group that faked psychopathy
78.74 7.02 .0001
Fig. (7). The influence of the research condition upon the duration of the response time to the Eysenck questionnaire.
The response time to the Eysenck questionnaire in the “faking” condition was longer than the response time to the Eysenck questionnaire in
the “sincerity” condition (p < .05).
Fig. (8). The influence of the research condition upon the duration of the response time to P.
A significant effect was obtained for the research condition in the response time to the P scale (p < .0001).

84 The Open Psychology Journal, 2011, Volume 4 Dvora G. Eitan
among the scores of the four scales, L, P, N and E, in the two research conditions for each one of the research groups separately. The results appear in Table 15.
As emerges from Table 15: A-C, in the “faking” condition, in all of the groups a negative correlation was obtained between E and N. According to Table 15: A-B, it
appears that in the groups that faked schizophrenia a significant negative correlation is obtained between N and L. From Table 15A emerges that in the group that faked non paranoid schizophrenia a significant negative correlation is obtained between L and P. According to Table 15B it appears that in the group that faked paranoid schizophrenia a
Fig. (9). The influence of the research condition upon the duration of the response time to N.
A significant effect was obtained for the research condition in the response time to the N scale (p < .05).
Table 15. The Matrix of the Correlations between the L, P, N and E Scales
N E P L
A.
-.29* .02 -.49*** L
-.09 -.18 -.01 P
-.27* .11 .17 E
-.37* .09 -.45** N
B.
-.29* .29* -.24 L
-.22 -.08 -.20 P
-.46** .12 .16 E
-.46** .07 -.24 N
C.
-.14 .16 -.21 L
.47*** -.34** -.01 P
-.36** -.05 -.16 E
-.17 .01 -.36** N
p < .0001***, p < .01**, p < .05* Above the oblique line: The “faking” condition; Below the oblique line: The “sincerity” condition. A: The group faking non paranoid schizophrenia. B: The group faking paranoid schizophrenia. C: The group faking psychopathy.

Is the Truth Visible? The Open Psychology Journal, 2011, Volume 4 85
significant positive correlation is obtained between L and E. From Table 15C it appears that in the group that faked psychopathy a significant negative correlation is obtained between P and E, as well as a significant positive correlation between P and N. As compared with this, as shown in Tables 15: A and B, in the “sincerity” condition in the groups that faked non paranoid schizophrenia and psychopathy negative correlations are obtained between the L scores and the N scores, and, as shown in Tables 15: A-B, in the groups that faked schizophrenia negative correlations are obtained between the E scores and the N scores. To sum up, in the “faking” condition, as opposed to the “sincerity” condition, more correlations are obtained.
4. DISCUSSION
The whole of the findings clearly shows that it is possible to intentionally and specifically bias responses to the EPQ-
R-S personality questionnaire of Eysenck - malingering an abnormal personality type (faking “bad”) - and that it is possible to identify this in the profile of the scores of the scales of the questionnaire and in the duration of the response time. The interesting finding is the tracks of the faking in the lie scale L, which is meant to diagnose this bias [5, 7], since the scores of the individuals in L were found to be unusually low and also were not characteristic of the realistic L scores of the “faked” types [7, 53], and by this they revealed the “plot” of the faking. Accordingly, this scale was found to be an index capable of pointing out the interest of the person engaging in biasing. This means that the interpretation of the L scale in the framework of faking “bad” has to be different from the one that was suggested by Eysenck and Eysenck [5, 7] in regards to faking “good”. That is, while they suggested that high L scores may indicate an attempt to fake “good”, very low scores, when their results are weighted in light of the rest scores of the Eysenckian dimensions, will indicate an attempt to fake “bad”, not a sincere reaction. Then, in light of the conclusions of the present research the Eysenckian model of personality becomes clear under the condition of malingering and, thereby, an addition to the Eysenckian theory regarding the functioning and the interpretation of the L scale is created.
To sum up the research, the main theoretical conclusions that emerge from the research are the following:
1 The L scale and the three dimensions, P, E and N, that are measured in the personality questionnaire of Eysenck, version EPQ-R-S (in computerized pattern), are sensitive to any faking “bad” a paranoid or non paranoid schizophrenic and a psychopath, which lead to significantly different results in the “sincerity” condition. Thus, under it, P and N were found to be significantly high, and E and L were found to be significantly low.
2 The L scale and the other dimensions are sensitive to the “type of faking”. That is, these scales are capable to differentiate between malingering as a schizophrenic and malingering as a psychopath, but are not sensitive to the difference between malingering as a non paranoid schizophrenic and malingering as a paranoid schizophrenic. Thus, in the attempt to malinger as a psychopath, as compared with an attempt to malinger as
a schizophrenic, P and E were found to be significantly higher; compared with them L and N were found to be significantly lower. Accordingly, it seems that the findings of all of the four scales together are important in identifying the malingering as a schizophrenic and as a psychopath, as well as for the ability to discriminate between the two of them.
3 Obtaining an unusual profile of scores in the three Eysenckian dimensions has to be considered in light of the findings in the L scale, which is capable of revealing the faking “bad”, which is manifested in it in the form of significantly low scores in the “sincerity” condition, which also are uncharacteristic of the “true” scores of the “faked” types [7, 53].
4 The response time in the “faking” condition of schizophrenia and psychopathy to the items in the “pathological” dimensions in the Eysenck questionnaire – P and N – are longer than in the “sincerity” condition.
5 In the “faking” condition many more correlations are obtained than in the “sincerity” condition. Thus, it turns out that a multiplicity of correlations may point to an intentional attempt to bias the results (namely, a motivation to dissimilate). Therefore, it is not possible to ignore them.
Together with the results of the research, we can observe a number of topics that ought to be addressed in continuation
researches. The first one is the individual differences in the
talent for acting, which are likely to be an intervening variable in any research on “faking”. The second one is the
relationship between the capacity to fake and the time to
adapt to the scheme that the subject is requested to adopt in order to fake; that is, whether adopting a scheme gradually
and not immediately may increase the capacity to fake of the
individuals. But, the gradual manipulation of a scheme may entail the interventional addition of other variables in the
period in between the stages of the research outside of the
laboratory. But in fact, it may be argued that the individuals, when coming to the laboratory, already possess various
levels of knowledge that may influence the manipulation.
Therefore, the third topic to be investigated and the most problematic is examining the faking on the basis of various
levels of knowledge about the faked “type”. This matter is
difficult to investigate, especially in the case of the faking of an abnormal personality type. This is so because there is a
great fear that the individuals will not give sincere
information regarding their familiarity with those who have such personality type. Also, it is difficult to appraise such
knowledge at all.
As a whole, the results of this research have a practical
aspect that is important to any situation in which the
personality is examined, whether it is for employment purposes or enlisting persons for obligatory service on the
part of the State or for judicial and similar purposes. In each
one of these cases it is possible to require filling in a personality questionnaire only or as an addition to other
questionnaires, whereas the profile of the scores obtained in
all of its scales can identify the respondent who malingers as an antisocial or a schizophrenic.

86 The Open Psychology Journal, 2011, Volume 4 Dvora G. Eitan
ABBREVIATIONS
STB = Borderline personality disorder
DSM-IV = Diagnostic and Statistical Manual Disorders
E = Extraversion
EPI = Eysenck Personality Inventory
EPP = Eysenck Personality Profiler
ERQ-R-S = Eysenck Personality Questionnaire - Revised - Short
JEPI = Junior Eysenck Personality Inventory
L = Lie scale
MPI = Maudsley Personality Inventory
MMPI-2 = Minnesota Multiphasic Personality Inventory
N = Neuroticism
P = Psychoticism
PEN = Psychoticism Extraversion Neuroticism
STA = Schizotypal personality disorder
CONFLICT OF INTEREST
The author has no financial interests to disclose
ACKNOWLEDGEMENTS
This work is based on my Ph.D. dissertation. I would like to thank Prof. Joseph Glicksohn (Department of Criminology, Bar-Ilan University) for his mentorship.
REFERENCES
[1] American Psychiatric Association. Diagnostic and statistical
manual of mental disorders - DSM-IV (4th ed.). Washington: American Psychiatric Publishing, Inc 1994
[2] Rosenhan D. On being sane in insane places. Science 1973; 179: 250-8.
[3] O’Donovan D. An historical review of the lie scale: with particular reference to the maudsley personality inventory. Papers Psychol
1969; 3: 13-9. [4] Hartshorne H, May MA. Studies in deceit. New York: Macmillan
1928. [5] Eysenck HJ, Eysenck SBG. Psychoticism as a dimension of
personality. London: Hodder and Stoughton 1976. [6] Dahlstrom WG, Welsh GS. An MMPI handbook: a guide to use in
clinical practice and research. Minneapolis: University of Minnesota Press 1960.
[7] Eysenck HJ, Eysenck SBG. Manual of the eysenck personality questionnaire. London: Hodder and Stoughton 1975.
[8] Braun J, Gomez B. Effect of faking instructions on the eysenck personality inventory. Psychol Rep 1966; 19: 388-90.
[9] Cowles M, Darling M, Skanes A. Some characteristics of the simulated self. Pers Individ Dif 1992; 13: 501-10.
[10] Dunnett S, Koun S, Barber PJ. Social desirability in the eysenck personality inventory. Br J Psychol 1981; 72: 19-26.
[11] Elliot S, Lawty-Jones M, Jackson C. Effect of dissimulation on self-report and objective measures of personality. Pers Individ Dif
1996; 21: 335-43. [12] Farley FH. Generality of faking effects in dimensional
measurement of personality. Aust J Psychol 1970; 22: 265-8. [13] Farley FH, Goh DS. PENmanship: Faking the P-E-N. Br J Soc Clin
Psychol 1976; 15: 139-48. [14] Furnham A, Henderson M. The good the bad and the mad: Response
bais in self-report measures. Pers Individ Dif 1982; 3: 311-20. [15] Gomez BJ, Braun JR. Effects of “salesman candidate” sets on
eysenck personality inventory. Psychol Rep 1967; 20: 192.
[16] Gorman BS. Social desirability factors and the eysenck personality
inventory. J Phycol 1968; 69: 75-83. [17] Power RP. Simulation of stable and neurotic personality by
subjects warned of the presence of lie scales in inventories. Br J Psychol 1968; 59: 105-9.
[18] Power RP, Stoppard JM. Simulation of stable neurotic personalities on J. E. P. I. by secondary school boys. Irish J Psychol 1973; 2:
9-17. [19] Velicer WF, J. WB. Effects of sophistication and faking sets on the
eysenck personality inventory. Psychol Rep 1975; 37 71-3. [20] Salas R. Fakeability of responses on the eysenck personality
inventory. Aust J Psychol 1968; 20: 55-7. [21] Jackson CJ, Francis LJ. Interpreting the correlation between
neuroticism and lie scale scores. Pers Individ Dif 1999; 26: 59-63. [22] Michaelis W, Eysenck HJ. The determination of personality
inventory factor patterns and intercorrelations by changes in real-life motivation. J Genet Psychol 1971; 118: 223-34.
[23] Furnham A. Response bias, social desirability and dissimulation. Pers Individ Dif 1986; 7: 385-400.
[24] Haapasalo J. The eysenck personality questionnaire and zuckerman`s sensation seeking scale (Form V) in Finland: age
differences. Pers Individ Dif 1990; 11: 503-8. [25] Holden RR, Hibbs N. Incremental validity of response latencies of
detecting fakers on personality test. J Res Pers 1995; 29: 362-72. [26] Holden RR, Fekken GC, Cotton DHG. Assessing psychopathology
using structured test-item response latencies. Psychol Assess 1991; 3: 111-8.
[27] Fekken GC, Holden RR. Response latency evidence for viewing personality traits as schema indicators. J Res Pers 1992; 26:
103-20. [28] Fekken GC, Holden RR. The construct validity of differential
response latencies in structured personality tests. Can J Behav Sci 1994; 26: 104-20.
[29] Holden RR, Fekken GC. Can personality test item response latencies have construct validity? issues of reliability and
convergent and discriminant validity. Pers Individ Dif 1993; 15: 243-8.
[30] Popham SM, Holden RR. Assessing MMPI constructs through the measurement of response latencies. J Pers Assess 1990; 54: 469-78.
[31] Simola SK, Holden RR. Equivalence of computerized and standard administration of the piers-harris children`s self-concept scale. J
Pers Assess 1992; 58: 287-94. [32] Holden RR, Kroner DG, Fekken GC, et al. A model of personality
test item response dissimulation. J Pers Soc Psychol 1992; 63: 272-9.
[33] Beaber RJ, Marston A, Michelli I, et al. A brief test for measuring malingering in schizophrenic individuals. Am J Psychiatry 1985;
142: 1478-81. [34] Netter BEC, Viglione DJ. An empirical study of malingering
schizophrenia on the Rorschach. J Pers Assess 1994; 62: 45-57. [35] Eysenck HJ. Genius. London: Cambridge University Press 1995.
[36] Eysenck SBG, Yanai O. A cross-cultural study of personality: Israel and England. Psychol Rep 1985; 57: 111-6.
[37] Glicksohn J, Abulafia J. Embedding sensation seeking within the big three. Pers Individ Dif 1998; 25: 1085-99.
[38] Kirkcaldy BD. Personality profiles at various level of athletic participation. Pers Individ Dif 1982; 3: 321-6.
[39] Loo R. A psychometric investigation of the eysenck personality questionnaire. J Pers Assess 1979; 43: 54-8.
[40] Martin T, Kirkcaldy B. Gender differences on the EPQ-R and attitudes to work. Pers Individ Dif 1998; 24: 1-5.
[41] McPherson FM, Presly AS, Armstrong J, et al. ‘Psichoticism’ and psychotic illness. Br J Psychiatry 1974; 125: 152-60.
[42] Gilboa T. Are actors bending the judging of lie examiners more then persons that are not actors? M.A. thesis, Dept. of Criminology,
Bar-Ilan Univ 2002. [43] Eysenck SBG, Eysenck HJ, Barrett P. A revised version of the
psychoticism scale. Pers Individ Dif 1985; 6: 21-9. [44] Claridge GS, Broks P. Schizotypy and hemisphere function I,
Theoretical considerations and the measurement of schizotypy. Pers Individ Dif 1984; 5: 633-48.
[45] Montag I, Levin J. Personality correlates of schizotypy factors. Pers Individ Dif 1992; 13: 545-8.
[46] Butcher JN, Dahlstrom WG, Graham JR, et al. MMPI-2: Minnesota Multiphasic Personality Inventory – 2, Manual for

Is the Truth Visible? The Open Psychology Journal, 2011, Volume 4 87
administration and scoring. Minneapolis, MN: University of
Minnesota Press 1989. [47] Almagor M, Bodsko D, Montag Y, et al. MMPI-2. Haifa: Haifa
university 1991. [48] Levenson MR, Kiehl KA, Fitzpatrick CM. Assessing psychopathic
attributes in noninstitutionalized population. J Pers Soc Psychol 1995; 68: 151-8.
[49] Sivan-Ben Yoseph E. Psychotherapy, depression and motivation for caring prisoners. M.A.thesis, Dept. of Criminology, Bar-Ilan
Univ 2002. [50] Carson R, Butcher G, Minka S. Psychopathology and the modern
life (10 ed., the up-to-date edition for 1998). Rmat-Aviv, Tel-Aviv: The Open University 2001.
[51] Elitzur A, Tiano S, Monitz C, et al. Chosen chapters in psychiatry. Menif C, Ed. Tel-Aviv: Papyrus Press of Tel Aviv University 1995.
[52] King WC, Miles EW. A quasi-experimental assessment of the
effect of computerizing noncognitive paper-and-pencil measure- ments: A test of measurement equivalence. J Appl Psychol 1995;
80: 643-51. [53] Hinton J. A psychophysiological study of paranoid hostility and
defensiveness in maximum security hospital patients. Br J Psychol 1977; 68: 371-5.
[54] Eysenck SBG, Eysenck HJ. The questionnaire measurement of psychoticism. Psychol Med 1972; 2: 50-5.
[55] Eysenck SBG. Manual of the junior eysenck personality inventory. London: University of London Press 1965.
[56] Eysenck HJ, Eysenck S. Manual of the eysenck personality scales (adults). London: Hodder and Stoughton 1991.
Received: July 23, 2011 Revised: July 26, 2011 Accepted: July 26, 2011
© Dvora G. Eitan; Licensee Bentham Open.
This is an open access article licensed under the terms of the Creative Commons Attribution Non-Commercial License (http://creativecommons.org/licenses/by-nc/3.0/) which permits unrestricted, non-commercial use, distribution and reproduction in any medium, provided the
work is properly cited.