is voice a marker for autism spectrum disorder? a systematic review
TRANSCRIPT

1
TITLE: “Is voice a marker for autism spectrum disorder? A systematic review
and meta-analysis.”
Riccardo Fusaroli1, Anna Lambrechts2, Dan Bang1,3,4, Dermot M Bowler2, Sebastian
B Gaigg2
1. The Interacting Minds Centre, Aarhus University, Jens Christian Skous Vej 4,
Building 1483, 8000 Aarhus, DK
2. Autism Research Group, City University London, Northampton Square, London
EC1V 0HB
3. Wellcome Trust Centre for Neuroimaging, Institute of Neurology, University
College London, 12 Queen Square, London WC1N 3BG, UK
4. Calleva Research Centre for Evolution and Human Sciences, Magdalen College,
University of Oxford, Oxford OX1 4AU, United Kingdom
RUNNING TITLE: Vocal Production in ASD
Number of text pages: 28
Number of tables: 5
Number of figures: 6
Number of Supplementary Materials: 1
Corresponding author: Riccardo Fusaroli, e-mail: [email protected], tel: +45
28890881, address: Jens Christian Skous vej 2, 8000 Aarhus Denmark
Grant sponsor: Interacting Minds Center; Grant ID: Clinical Voices.
The authors declare that no conflict of interest exists.
peer-reviewed) is the author/funder. All rights reserved. No reuse allowed without permission. The copyright holder for this preprint (which was not. http://dx.doi.org/10.1101/046565doi: bioRxiv preprint first posted online Apr. 3, 2016;

2
Lay Abstract: Individuals with Autism Spectrum Disorder (ASD) are reported to
speak in distinctive ways. Distinctive vocal production should be better understood as
it can affect social interactions and social development and could represent a non-
invasive marker for ASD. We systematically review the existing scientific literature
reporting quantitative acoustic analysis of vocal production in ASD and identify
repeated and consistent findings of higher pitch mean and variability but not of other
differences in acoustic features. We also identify a recent approach relying on
multiple aspects of vocal production and machine learning algorithms to
automatically identify ASD from voice only. This latter approach is very promising,
but requires more systematic replication and comparison across languages and
contexts. We outline three recommendations to further develop the field: open data,
open methods, and theory-driven research.
peer-reviewed) is the author/funder. All rights reserved. No reuse allowed without permission. The copyright holder for this preprint (which was not. http://dx.doi.org/10.1101/046565doi: bioRxiv preprint first posted online Apr. 3, 2016;

3
Scientific Abstract Individuals with Autism Spectrum Disorder (ASD) tend to show
distinctive, atypical acoustic patterns of speech. These behaviours affect social
interactions and social development and could represent a non-invasive marker for
ASD. We systematically reviewed the literature quantifying acoustic patterns in ASD.
Search terms were: (prosody OR intonation OR inflection OR intensity OR pitch OR
fundamental frequency OR speech rate OR voice quality OR acoustic) AND (autis*
OR Asperger). Results were filtered to include only: empirical studies quantifying
acoustic features of vocal production in ASD, with a sample size > 2, and the
inclusion of a neurotypical comparison group and/or correlations between acoustic
measures and severity of clinical features. We identified 34 articles, including 30
univariate studies and 15 multivariate machine-learning studies. We performed meta-
analyses of the univariate studies, identifying significant differences in mean pitch
and pitch range between individuals with ASD and comparison participants (Cohen’s
d of 0.4-0.5 and discriminatory accuracy of about 61-64%). The multivariate studies
reported higher accuracies than the univariate studies (63-96%). However, the
methods used and the acoustic features investigated were too diverse for performing
meta-analysis. We conclude that multivariate studies of acoustic patterns are a
promising but yet unsystematic avenue for establishing ASD markers. We outline
three recommendations for future studies: open data, open methods, and theory-driven
research.
Key Words: Voice, Speech, Acoustic properties, Machine Learning, Biomarker
1. Introduction
peer-reviewed) is the author/funder. All rights reserved. No reuse allowed without permission. The copyright holder for this preprint (which was not. http://dx.doi.org/10.1101/046565doi: bioRxiv preprint first posted online Apr. 3, 2016;

4
From its earliest characterizations, ASD has been associated with peculiar tones of
voice and disturbances of prosody (Asperger, 1944; Goldfarb, Braunstein, & Lorge,
1956; Kanner, 1943; Pronovost, Wakstein, & Wakstein, 1966; Simmons & Baltaxe,
1975). Although 70-80% of individuals with ASD develop functional spoken
language, at least half of the ASD population displays early atypical acoustic patterns
(Paul et al., 2005a; Rogers et al., 2006; Shriberg et al., 2001), which persist while
other aspects of language improve (Baltaxe & Simmons, 1985; Depape, Chen, Hall,
& Trainor, 2012). These atypical acoustic patterns have been qualitatively described
as flat, monotonous, variable, sing-songy, pedantic, robot- or machine-like, hollow,
stilted or exaggerated and inappropriate (Amorosa, 1992; Baltaxe, 1981; Depape, et
al., 2012; Järvinen-Pasley, Peppé, King-Smith, & Heaton, 2008; Lord, Rutter, & Le
Couteur, 1994). Such distinctive vocal characteristics are one of the earliest-appearing
markers of a possible ASD diagnosis (Oller et al., 2010; Paul, Fuerst, Ramsay,
Chawarska, & Klin, 2011; Warlaumont, Richards, Gilkerson, & Oller, 2014).
An understanding of vocal production in ASD is important because acoustic
abnormalities may play a role in the social-communicative impairments associated
with the disorder (Depape, et al., 2012; Klopfenstein, 2009). For example, individuals
with ASD have difficulties with the communication of affect (Travis & Sigman,
1998) – which relies on the production of prosodic cues – leading to negative social
judgments on the part of others (Fay & Schuler, 1980; Paul et al., 2005b; Shriberg, et
al., 2001; Van Bourgondien & Woods, 1992) and in turn social withdrawal and social
anxiety (Alden & Taylor, 2004). Such disruption of communication and interaction
may have long-term effects, compromising the development of social-communicative
abilities (Warlaumont, et al., 2014).
peer-reviewed) is the author/funder. All rights reserved. No reuse allowed without permission. The copyright holder for this preprint (which was not. http://dx.doi.org/10.1101/046565doi: bioRxiv preprint first posted online Apr. 3, 2016;

5
Atypical prosody is already considered a marker for ASD in gold-standard
diagnostic assessments such as the Autism Diagnostic Observation Schedule (Lord, et
al., 1994), and recent evidence indicates that speech in ASD may be characterized by
relatively unique acoustic features that can be quantified objectively (Bone et al.,
2013; Fusaroli, Lambrechts, Yarrow, Maras, & Gaigg, 2015; Oller, et al., 2010).
Prosody production has also been argued to be a “bellwether” behavior that can serve
as a marker of the specific cognitive and social functioning profile of an individual
(Bone et al., 2014; Diehl, Berkovits, & Harrison, 2010; Paul, et al., 2005a). Such
diagnostic profiling is especially needed now that the diagnosis of ASD (since the
publication of the DSM-5) pools together previously distinct disorders (e.g., Asperger
syndrome and childhood disintegrative disorder).
Studies of prosody in ASD can be grouped according to four key aspects of
speech production: pitch, volume, duration and voice quality (Cummins et al., 2015;
Titze, 1994). The speech of individuals with ASD has been described as monotone, as
having inappropriate pitch and pitch variation (Baltaxe, 1984; Fay & Schuler, 1980;
Goldfarb, Goldfarb, Braunstein, & Scholl, 1972; Paccia & Curcio, 1982; Pronovost,
et al., 1966) and as being too loud or too quiet, sometimes inappropriately shifting
between the two (Goldfarb, et al., 1972; Pronovost, et al., 1966; Shriberg, Paul, Black,
& van Santen, 2011; Shriberg, et al., 2001). Further, individuals with ASD have been
reported to speak too quickly or too slowly (Baltaxe, 1981; Goldfarb, et al., 1972;
Simmons & Baltaxe, 1975) and many descriptions of their speech have highlighted a
distinctive voice quality characterized as “hoarse”, “harsh” and “hyper-nasal”
(Baltaxe, 1981; Pronovost, et al., 1966), with a higher recurrence of squeals, growls,
and yells (Sheinkopf, Mundy, Oller, & Steffens, 2000).
peer-reviewed) is the author/funder. All rights reserved. No reuse allowed without permission. The copyright holder for this preprint (which was not. http://dx.doi.org/10.1101/046565doi: bioRxiv preprint first posted online Apr. 3, 2016;

6
The research evidence is diverse, in terms of both methods and interpretations.
An early review of 16 qualitative studies of speech in ASD found it difficult to draw
any firm conclusions (McCann & Peppé, 2003). Shortcomings of the reviewed studies
were: (1) small sample size; (2) underspecified criteria for the (qualitative)
descriptions of speech production; (3) lack of quantitative measures of speech
production; (4) use of heterogeneous and non-standardized tasks; and (5) little theory-
driven research. Since that review, the literature on prosody in ASD has grown
substantially, particularly with respect to the use of signal-processing techniques that
overcome some of the limitations involved in qualitative studies (Banse & Scherer,
1996; Grossman, Bemis, Skwerer, & Tager-Flusberg, 2010). The purpose of the
present paper is to provide a systematic and critical review of recent research on the
acoustic quantitative characteristics of speech production in ASD. This focus ensures
minimal overlap with the literature reviewed by McCann & Peppé (2003) and is
motivated by the more general question of whether automated speech-processing
procedures can be used in the diagnosis of ASD.
We identified two different groups of studies: univariate studies and
multivariate machine-learning studies. Univariate studies seek to identify differences
between ASD and comparison groups by investigating one acoustic feature at a time.
In contrast, multivariate machine-learning studies use multiple features (multivariate)
to build statistical models that can classify previously unheard voice samples into
ASD and comparison groups (machine-learning).
A particular focus of this review will be whether acoustic characteristics of
speech production can be used as markers of ASD, that is, as a directly measurable
index derived from sensitive and reliable quantitative procedures that is associated
with the condition and/or its clinical features (e.g. Ruggeri et al, 2014). Since ASD
peer-reviewed) is the author/funder. All rights reserved. No reuse allowed without permission. The copyright holder for this preprint (which was not. http://dx.doi.org/10.1101/046565doi: bioRxiv preprint first posted online Apr. 3, 2016;

7
involves a high degree of heterogeneity of clinical features and their severity, it is
crucial to assess how widely acoustic markers can apply to a wide range of
individuals with ASD, and whether the markers reflect severity and progression of
clinical features over time (e.g. in the context of intervention programs or aging). It
should also be emphasized that, in light of the heterogeneity of individuals with ASD
and the need for a reliable marker of ASD, the review will not speculate on the
significance of the findings of isolated studies. Instead, the focus will be on finding
patterns across studies, which are more likely to generalize to new samples (Yarkoni
& Westfall, 2016).
The review will be structured as follows. Section 2 will define the search and
selection criteria for the literature review. Sections 3 and 4 will present the results of
the review. Section 3 focuses on univariate studies and, where more than five studies
focused on the same feature, provides meta-analyses of the effect sizes. Section 4
focuses on multivariate studies and in particular the attempt to use machine-learning
techniques to develop acoustic markers of ASD. We end by critically assessing the
findings and advancing recommendations for future research.
2. Methods: The criteria for the literature search
A literature search was conducted using Google Scholar, PubMed and Web of
Science on April 15 2015, updated on March 4 2016 and then again on June 21 2016.
The search terms used were (prosody OR intonation OR inflection OR intensity OR
pitch OR fundamental frequency OR speech rate OR voice quality OR acoustic) AND
(autis* OR Asperger). Additional search for unpublished studies was performed
through additional web searches (on Google and Bing), and by directly contacting
authors of the published studies and interested participants of the IMFAR 2014, 2015
peer-reviewed) is the author/funder. All rights reserved. No reuse allowed without permission. The copyright holder for this preprint (which was not. http://dx.doi.org/10.1101/046565doi: bioRxiv preprint first posted online Apr. 3, 2016;

8
and 2016 conferences. Furthermore it should be noted that Google Scholar covers
most (if not all) dissertation repositories. The papers thus found were searched for
additional references and the resulting set was screened by two of the authors (RF and
AL) according to the following criteria: empirical study, quantification of acoustic
features in the vocal production of participants with ASD, sample including at least
two individuals with ASD, inclusion of a typically developing comparison group
(TD) or an assessment of variation in acoustic features in relation to severity of
clinical features. Non-TD comparison groups (e.g. with language impairment, or
ADHD) were not included as not enough studies were present to assess patterns
beyond the single study.
For all resulting papers we report sample sizes for ASD and TD groups,
matching criteria, age, verbal and non-verbal level of function, speech production
task, results and estimates of the acoustic measures (mean and standard deviation) if
available, in dedicated tables (see Tables 1 to 5). To facilitate comparison between
studies, the vocal production tasks were grouped into three categories. The first
category, constrained production, includes tasks such as reading aloud and repeating
linguistic stimuli. In this category, the focus is on the form of speech production,
more than on its contents (e.g. the actual words and meaning expressed). The second
category, spontaneous production, includes tasks such as free description of pictures
and videos or telling stories. This category of tasks involves a more specific focus on
the contents of speech production. The third category, social interaction, includes
spontaneous and semi-structured conversations such as ADOS interviews. This
category adds a stronger emphasis on social factors and interpersonal dynamics.
We extracted statistical estimates (mean and standard deviation for the ASD
and TD groups) of the features when available and contacted the corresponding
peer-reviewed) is the author/funder. All rights reserved. No reuse allowed without permission. The copyright holder for this preprint (which was not. http://dx.doi.org/10.1101/046565doi: bioRxiv preprint first posted online Apr. 3, 2016;

9
authors of the articles that did not provide these statistics1. When this process yielded
statistical estimates of one feature from at least five independent studies, we ran a
meta-analysis to estimate an overall effect size – that is, a weighted standardized
mean difference (Cohen’s d) between the ASD and the TD groups for univariate
studies and sensitivity/specificity of classification for the multivariate machine-
learning studies. We note that only the univariate studies provided enough data to
perform meta-analyses.
Meta-analyses were performed following well-established procedures detailed
in (Doebler & Holling, 2015; Field & Gillett, 2010; Quintana, 2015; Viechtbauer,
2010). We first calculated the size (Cohen’s d), statistical significance (p-value) and
overall variance (or τ2) of effects observed across studies. We then assessed whether
the overall variance could be explained by within-study variance (e.g., due to
measurement noise or heterogeneity in the ASD samples included in the studies)
using Cochran’s Q (Cochran, 1954) and I2 statistics (Higgins, Thompson, Deeks, &
Altman, 2003). Third, we assessed whether systematic factors – speech production
task (constrained production, spontaneous production, social interaction) and
language employed in the task (e.g. American English, or Japanese) – could further
explain the overall variance. Age would be a third crucial factor to add to the analysis.
However, the studies analyzed spanned wide age ranges, which did not allow making
any clear division in age groups (such as childhood, adolescence and adulthood).
Finally, we investigated the effect of influential studies (single studies strongly
driving the overall results) and publication bias (tendency to write up and publish
only significant findings, ignoring null findings and making the literature
1 Additional data were provided by the authors of (Bonneh, Levanon, Dean-Pardo, Lossos, & Adini, 2011; Grossman, et al., 2010), whom we gratefully acknowledge. As this data is fully reported in the publicly accessible dataset, we will not further distinguish it from the data reported in the articles reviewed.
peer-reviewed) is the author/funder. All rights reserved. No reuse allowed without permission. The copyright holder for this preprint (which was not. http://dx.doi.org/10.1101/046565doi: bioRxiv preprint first posted online Apr. 3, 2016;
10
unrepresentative of the actual population studied) on the robustness of our analysis.
This was estimated using rank correlation tests assessing whether lower sample sizes
(and relatedly higher standard error) were related to bigger effect sizes. A significant
rank correlation indicates a likely publication bias and inflated effect sizes due to
small samples. All analyses were performed using the metafor v.1.9.8 and mada
v.0.5.7 packages in R 3.3. All data and R-code employed are available at
https://github.com/fusaroli/AcousticPatternsInASD and on FigShare with the doi:
https://dx.doi.org/10.6084/m9.figshare.3457751.v2 (Fusaroli, 2016).
3. Results
3.1. Literature search results
The initial literature screening yielded 108 papers discussing prosody and voice in
ASD. The second stricter screening yielded 34 papers, with each paper sometimes
reporting more than one study. In total, our primary literature included 30 univariate
studies and 15 multivariate machine-learning studies. The remaining 74 papers
(qualitative studies, theory or reviews) were used as background literature only and
cited when relevant.
3.2. Differences in acoustic patterns between ASD and comparison populations
(univariate studies)
3.2.1. Pitch
Pitch reflects the frequency of vibrations of the vocal cords during vocal production.
During vocal production, individuals often modulate their pitch to convey pragmatic
peer-reviewed) is the author/funder. All rights reserved. No reuse allowed without permission. The copyright holder for this preprint (which was not. http://dx.doi.org/10.1101/046565doi: bioRxiv preprint first posted online Apr. 3, 2016;

11
or contextual meaning: for example, marking an utterance as having an imperative,
declarative or ironic intent, or even to express emotions (Banse & Scherer, 1996;
Bryant, 2010; Fusaroli & Tylén, 2016; Michael et al., 2015; Mushin, Stirling,
Fletcher, & Wales, 2003).
Our literature screening yielded 24 studies employing acoustic measures of
pitch (see Tables 1-2). Five summary statistics were used: mean, standard deviation
(SD), range (defined between highest and lowest pitch), mean absolute deviation from
the median (a measure of variability especially robust to outliers) and coefficient of
variation (standard deviation divided by mean). Some researchers also quantified the
temporal trajectory or profile of pitch, estimating the slope (ascending, descending or
flat) of pitch over time (Bone, et al., 2014; Green & Tobin, 2009). We report the latter
measures when the signal-processing is automated and does not rely on manual
coding.
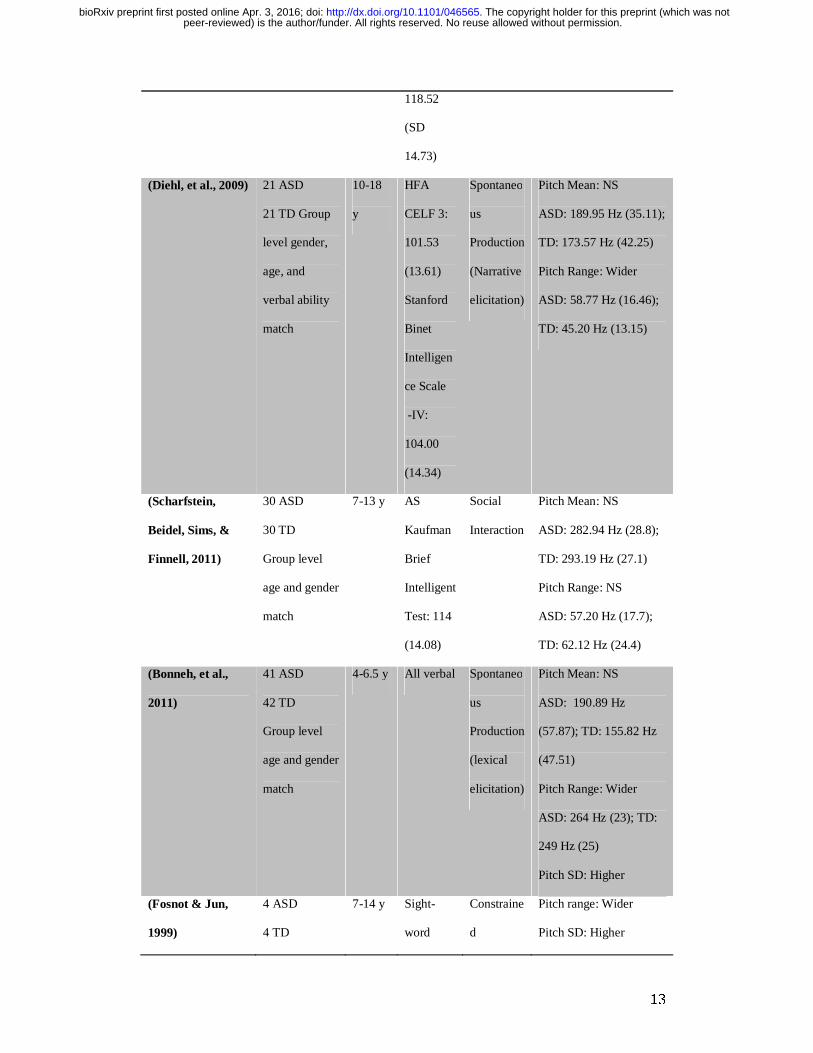
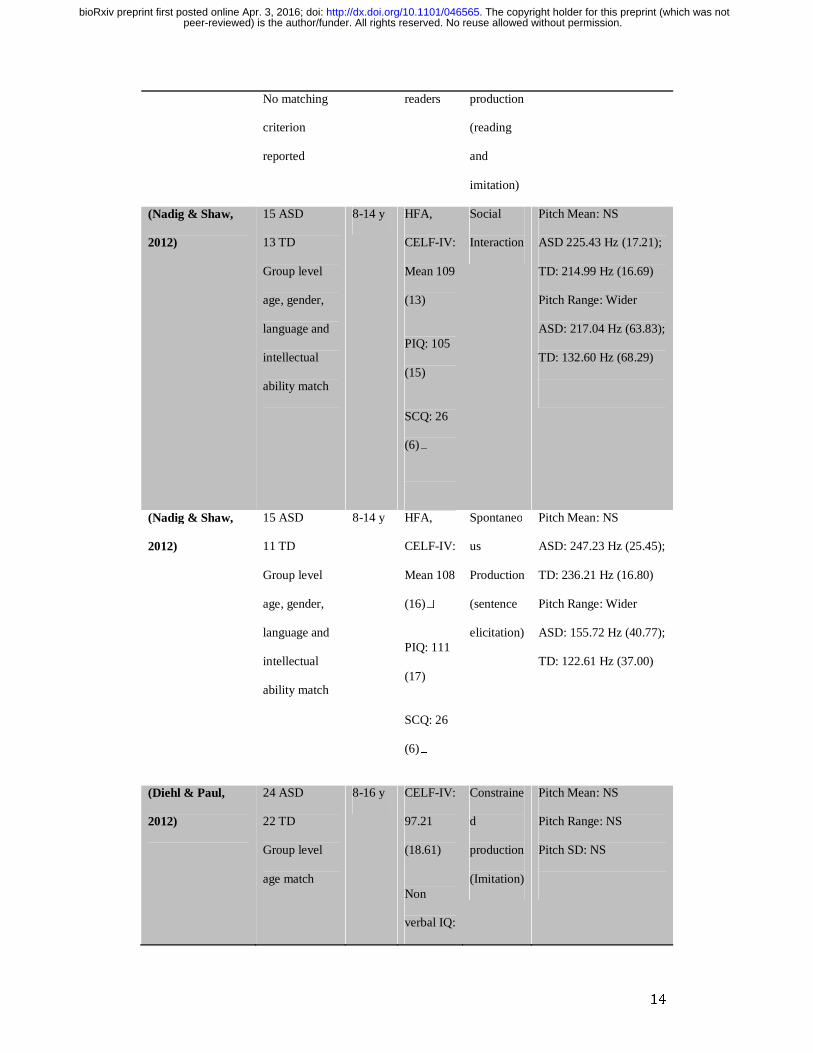
Table 1 – Summary statistics of the pitch properties of ASD and TD groups in each
study. When present, or provided by the authors, mean and standard deviation (in
parenthesis) of the summary statistics are reported. NS: Non-significant difference
between groups.
Authors Sample Size
and matching
criteria
Age Level of
function
of the
Task Findings
peer-reviewed) is the author/funder. All rights reserved. No reuse allowed without permission. The copyright holder for this preprint (which was not. http://dx.doi.org/10.1101/046565doi: bioRxiv preprint first posted online Apr. 3, 2016;

12
ASD
group2
(Brisson, Martel,
Serres, Sirois, &
Adrien, 2014)
13 ASD
13 TD
Group-level
age match
0-6 m Not
Available
Social
Interaction
Pitch mean: NS
ASD: 393.61 Hz
(107.19); TD: 357.64 Hz
(37.17)
(Sharda et al.,
2010)
15 ASD
10 TD
Group-level
age match
4-10 y Minimum
vocabular
y of 20
words by
age 4
Social
Interaction
Pitch Mean: Higher
ASD: 355.8 Hz (61.7);
TD: 275.4Hz (22.5)
Pitch Range: Wider
ASD: 550.6 Hz (84.9);
TD: 464.7 Hz (41.2)
(Filipe, Frota,
Castro, & Vicente,
2014)
12 ASD
17 TD
Group level
age and non-
verbal
intellectual
level match
4-6 y Range of
Raven:
17-29:
Spontaneo
us
Production
(lexical
elicitation)
Pitch mean: Higher
ASD: 264.72 Hz (23.19);
TD: 242.74 Hz (28.59)
Pitch range: Wider
ASD: 142. 3 Hz (47.4);
TD: 97.5 Hz (36.38)
(Diehl, Watson,
Bennetto,
McDonough, &
Gunlogson, 2009)
17 ASD
17 TD Group
level gender,
age, IQ and
verbal ability
match
6-14 y
HFA
PPVT-III:
Mean
115.3 (SD
12.52)
Wechsler
IQ: Mean
Spontaneo
us
Production
(narrative
elicitation)
Pitch Mean: NS
ASD: 212.25 Hz (36.48);
TD: 207.84 Hz (34.93)
Pitch Range: Wider
ASD: 49.57 Hz (9.81);
TD: 41.69 Hz (12.49)
2 HFA indicates High Functioning Individuals with ASD, AS Asperger’s Syndrome, PDD-NOS pervasive developmental disorder not otherwise specified. Raven indicates Raven’s Coloured Progressive Matrices. PPVT; Clinical Evaluation of Language Fundamentals
peer-reviewed) is the author/funder. All rights reserved. No reuse allowed without permission. The copyright holder for this preprint (which was not. http://dx.doi.org/10.1101/046565doi: bioRxiv preprint first posted online Apr. 3, 2016;
13
118.52
(SD
14.73)
(Diehl, et al., 2009) 21 ASD
21 TD Group
level gender,
age, and
verbal ability
match
10-18
y
HFA
CELF 3:
101.53
(13.61)
Stanford
Binet
Intelligen
ce Scale
-IV:
104.00
(14.34)
Spontaneo
us
Production
(Narrative
elicitation)
Pitch Mean: NS
ASD: 189.95 Hz (35.11);
TD: 173.57 Hz (42.25)
Pitch Range: Wider
ASD: 58.77 Hz (16.46);
TD: 45.20 Hz (13.15)
(Scharfstein,
Beidel, Sims, &
Finnell, 2011)
30 ASD
30 TD
Group level
age and gender
match
7-13 y AS
Kaufman
Brief
Intelligent
Test: 114
(14.08)
Social
Interaction
Pitch Mean: NS
ASD: 282.94 Hz (28.8);
TD: 293.19 Hz (27.1)
Pitch Range: NS
ASD: 57.20 Hz (17.7);
TD: 62.12 Hz (24.4)
(Bonneh, et al.,
2011)
41 ASD
42 TD
Group level
age and gender
match
4-6.5 y All verbal Spontaneo
us
Production
(lexical
elicitation)
Pitch Mean: NS
ASD: 190.89 Hz
(57.87); TD: 155.82 Hz
(47.51)
Pitch Range: Wider
ASD: 264 Hz (23); TD:
249 Hz (25)
Pitch SD: Higher
(Fosnot & Jun,
1999)
4 ASD
4 TD
7-14 y Sight-
word
Constraine
d
Pitch range: Wider
Pitch SD: Higher
peer-reviewed) is the author/funder. All rights reserved. No reuse allowed without permission. The copyright holder for this preprint (which was not. http://dx.doi.org/10.1101/046565doi: bioRxiv preprint first posted online Apr. 3, 2016;
14
No matching
criterion
reported
readers production
(reading
and
imitation)
(Nadig & Shaw,
2012)
15 ASD
13 TD
Group level
age, gender,
language and
intellectual
ability match
8-14 y HFA,
CELF-IV:
Mean 109
(13)
PIQ: 105
(15)
SCQ: 26
(6)�
Social
Interaction
Pitch Mean: NS
ASD 225.43 Hz (17.21);
TD: 214.99 Hz (16.69)
Pitch Range: Wider
ASD: 217.04 Hz (63.83);
TD: 132.60 Hz (68.29)
(Nadig & Shaw,
2012)
15 ASD
11 TD
Group level
age, gender,
language and
intellectual
ability match
8-14 y HFA,
CELF-IV:
Mean 108
(16)�
PIQ: 111
(17)
SCQ: 26
(6)�
Spontaneo
us
Production
(sentence
elicitation)
Pitch Mean: NS
ASD: 247.23 Hz (25.45);
TD: 236.21 Hz (16.80)
Pitch Range: Wider
ASD: 155.72 Hz (40.77);
TD: 122.61 Hz (37.00)
(Diehl & Paul,
2012)
24 ASD
22 TD
Group level
age match
8-16 y CELF-IV:
97.21
(18.61)
Non
verbal IQ:
Constraine
d
production
(Imitation)
Pitch Mean: NS
Pitch Range: NS
Pitch SD: NS
peer-reviewed) is the author/funder. All rights reserved. No reuse allowed without permission. The copyright holder for this preprint (which was not. http://dx.doi.org/10.1101/046565doi: bioRxiv preprint first posted online Apr. 3, 2016;

15
103.61
(17.14)
(Diehl & Paul,
2013)
24 ASD
22 TD
Group level
age match
8-16 y CELF-IV:
97.21
(18.61)
Non
verbal IQ:
103.61
(17.14)
Spontaneo
us
Production
(sentence
elicitation)
Pitch Mean: NS
Pitch Range: Wider
Pitch SD: Higher
(Grossman, et al.,
2010)
11 ASD
9 TD
Group level
age, verbal
and
intellectual
ability match
7-17 y HFA,
Total IQ:
106.7
(10.6)
PPVT-R:
107
(15.4)
Spontaneo
us
Production
(lexical
elicitation)
Pitch Mean: NS
ASD: 190.89 Hz (57.87);
TD: 155.82 Hz (47.51)
Pitch Range: NS
ASD: 170 Hz (86.64);
TD: 108.64 Hz (53.94)
(Hubbard &
Trauner, 2007)
18 ASD
10 TD
No matching
criterion
reported
6-21 y No
characteri
zation
Constraine
d
production
(Imitation)
Pitch range: NS
(Nakai,
Takashima,
Takiguchi, &
Takada, 2014)
6 ASD
16 TD
Group level
age match
4-6 y 69.8 ±
16.9
Spontaneo
us
Production
(lexical
elicitation)
Pitch Range NS
ASD: 183.21 Hz (33.90);
TD: 198.18 Hz (36.23)
Pitch SD NS
ASD: 45.14 Hz (12.20);
TD: 48.19 Hz (13.25)
Pitch CV: Higher
ASD: 0.15 Hz (0.03);
peer-reviewed) is the author/funder. All rights reserved. No reuse allowed without permission. The copyright holder for this preprint (which was not. http://dx.doi.org/10.1101/046565doi: bioRxiv preprint first posted online Apr. 3, 2016;

16
TD: 0.15 Hz (0.02)
(Nakai, et al.,
2014)
20 ASD
21 TD
Group level
age match
6-10 y IQ: 67.7 ±
17.6
Spontaneo
us
Production
(lexical
elicitation)
Pitch Range NS
ASD: 202.13 Hz (34.27);
TD: 224.39 Hz (48.13)
Pitch SD NS
ASD: 50.26 Hz (12.32);
TD: 61.73 Hz (17.09)
Pitch CV: Higher
ASD: 0.15 Hz (0.02);
TD: 0.21 Hz (0.06)
(Green & Tobin,
2009)
10 ASD 10
TD
Group level
age academic
and language
ability match
9-13 y HFA,
within the
norm for
verbal IQ
Spontaneo
us
production
&
Constraine
d
production
Pitch Range: NS
ASD: 10.7–37.6
semitones; TD: 30.4–
32.4 semitones
(Depape, et al.,
2012)
12 ASD
6 TD
Group level
age match
17-34y 6 HFA, 6
Medium
Functioni
ng
Autism
(MFA)
PPVT:
HFA:
105.3
(5.3)
MFA:
89.2 (7.8)
Social
Interaction
Pitch Mean: NS
Pitch Range:
Wider for High
Functioning Autism,
Narrower for Medium
Functioning Autism
(Kaland, 20 ASD 20 18-51 HFA. 7 Spontaneo Pitch Range: Lower
peer-reviewed) is the author/funder. All rights reserved. No reuse allowed without permission. The copyright holder for this preprint (which was not. http://dx.doi.org/10.1101/046565doi: bioRxiv preprint first posted online Apr. 3, 2016;

17
Krahmer, &
Swerts, 2012)
TD
No match
y with AS,
13 with
PDD-
NOS
us
Production
(sentence
elicitation)
(Chan & To, 2016) 19 ASD
19 TD
Group level
age, gender
and education
match
18-34y HFA Spontaneo
us
Production
(narrative
elicitation)
Pitch Mean: NS
ASD: 137.67 Hz (18.69);
TD: 123.24 Hz (15.19)
Pitch SD: NS
ASD: 27.35 Hz (7.86);
TD: 22.16 Hz (4.69)
(Parish-Morris et
al, 2016)
65 ASD, 17
TD
Group level
age match
10y HFA
IQ:
105.31
(14.88)
Social
Interaction
(ADOS
interview)
Pitch Mean Absolute
Deviation (MAD): Wider
ASD: median: 1.99 Hz,
IQR: 0.95 Hz; TD:
median: 1.47 Hz, IQR:
0.26 Hz
(Quigley, et al
2016)
10 ASD, 9
TD. Group
level age
match
12m NA Social
interaction
Pitch mean: NS
ASD: 374.15 Hz (44.61);
TD: 377.08 Hz (44.13)
Pitch range: NS
ASD: 586.07 Hz (59.83);
TD: 562.39 Hz (69.01)
(Quigley, et al
2016)
10 ASD, 9
TD. Group
level age
match
18m NA Social
interaction
Pitch mean: NS
ASD: 382.26Hz (38.05);
TD: 362.96 Hz (27.55)
Pitch range: NS
ASD: 554.06 Hz (55.9);
TD: 539.81 Hz (152.12)
peer-reviewed) is the author/funder. All rights reserved. No reuse allowed without permission. The copyright holder for this preprint (which was not. http://dx.doi.org/10.1101/046565doi: bioRxiv preprint first posted online Apr. 3, 2016;

Pitch mean was investigated in 16 studies (255 participants with ASD and 239
comparison participants). Only two of these studies reported a significant group
difference with higher pitch mean in the ASD groups (Filipe, et al., 2014; Sharda, et
al., 2010). The remaining 14 studies report null findings. The meta-analysis included
11 studies for a total of 219 participants with ASD and 211 comparison participants
(see Figure 1). The overall estimated difference (Cohen’s d) in mean pitch between
the ASD and TD groups was 0.41 (95% CIs: 0.15 0.68, p=0.003) with an overall
variance (τ2) of 0.1 (95% CIs: 0 0.48). Much of the variance (I2: 44.11%, 95% CIs: 0
79.53) could not be reduced to random sample variability between studies (Q-stats =
21.35, p = 0.046). However, neither task (estimate: 0.09, 95% CIs -0.46 0.63, p=0.76)
nor language (estimate: 0.05, 95% CIs -0.04 0.13, p=0.26) could significantly explain
it.
Figure 1 – Forest plot of effect sizes (Cohen’s d) in pitch mean between the ASD and
comparison populations. The x-axis reports the effect size (positive values indicate
higher mean pitch in ASD, while negative lower) and the y-axis the studies for which
statistical estimates of pitch mean were provided. The dotted vertical line indicates
the null hypothesis (no difference between the populations).
peer-reviewed) is the author/funder. All rights reserved. No reuse allowed without permission. The copyright holder for this preprint (which was not. http://dx.doi.org/10.1101/046565doi: bioRxiv preprint first posted online Apr. 3, 2016;

One study (Sharda, et al., 2010) with a large effect size and large standard
error significantly drives the overall effect (see the lowest right point in Figure 2).
Removing this study yielded a smaller but still significant overall effect size (0.33,
95% CIs 0.09 0.56, p=0.006). The data did not reveal any likely publication bias
(Kendall's τ = 0.36, p = 0.1; Figure 2).
Figure 2 – Funnel plot of publication bias for studies investigating pitch mean.
The x-axis reports the effect size (Cohen’s d) of the difference in pitch mean between
ASD and comparison populations: positive values indicate higher mean pitch in ASD,
while negative lower. The y-axis reports the standard error in each study. The white
triangle represents an estimation of the real effect size distribution. The publication
bias can be observed in the studies being organized on a diagonal line: higher
standard error corresponding to bigger effect size.
Pitch variability indicates the magnitude of changes in pitch across the
linguistic unit analysed (be it a phoneme, a word or a longer utterance). Pitch
variability was investigated in 22 studies involving 398 participants with ASD and
peer-reviewed) is the author/funder. All rights reserved. No reuse allowed without permission. The copyright holder for this preprint (which was not. http://dx.doi.org/10.1101/046565doi: bioRxiv preprint first posted online Apr. 3, 2016;

337 comparison participants. 12 studies reported significant results, 11 indicating
wider, one narrower and 10 no significant differences in pitch variability.3 As all
studies but two used pitch range, rarely adding measures of standard deviation and
coefficient of variation, we based the meta-analysis on pitch range, introducing other
measures only when range was not available.
The meta-analysis involved 17 studies, 320 participants with ASD and 275
comparison participants (see Figure 3). The overall estimated difference (Cohen’s d)
in pitch variability between the ASD and the comparison groups was 0.5 (95% CIs:
0.24 0.77, p=0.0002) with an overall variance (τ2) of 0.18 (95% CIs: 0.04 0.61). Much
of the variance (I2: 60.18%, 95% CIs: 26.83 83.38) could not be reduced to random
sample variability between studies (Q-stats = 39.94, p = 0.0008). However, neither
task (estimate: 0.2, 95% CIs -0.15 0.55, p=0.27) nor language (estimate: -0.03, 95%
CIs -0.12 0.05, p=0.42) could significantly explain the variance.
3 It should be noted that a few studies attempted to separate different groups within the autism
spectrum. One study did not find any significant difference between Asperger Syndrome (AS), high-functioning and pervasive developmental disorder not otherwise specified (PDD-NOS) (Paul, Bianchi, Augustyn, Klin, & Volkmar, 2008). However, another found that individuals with AS produced larger pitch ranges than speakers with PDD-NOS (Kaland, et al., 2012), a pattern repeated when comparing high- with lower-functioning people with autism (Depape, et al., 2012).
peer-reviewed) is the author/funder. All rights reserved. No reuse allowed without permission. The copyright holder for this preprint (which was not. http://dx.doi.org/10.1101/046565doi: bioRxiv preprint first posted online Apr. 3, 2016;

Figure 3 – Forest plot of effect sizes (Cohen’s d) in pitch range between the ASD and
comparison populations. The x-axis reports the effect size (positive values indicate
higher pitch variability in ASD, while negative lower) and the y-axis the studies for
which statistical estimates of pitch mean were provided. The dotted vertical line
indicates the null hypothesis (no difference between the populations).
There were no obvious outliers, nor any obvious publication bias (Kendall's τ
= 0.06, p = 0.78; Figure 4). Indeed, of the 4 studies where statistical estimates were
not available, 2 reported null findings and 2 included cases in which participants with
ASD presented a wider pitch range, slightly reinforcing the hypothesis of a positive
effect size.
Figure 4 – Funnel plot of publication bias for studies investigating pitch range. The x-
axis reports the effect size (Cohen’s d) of the difference in pitch mean between ASD
and comparison populations: positive values indicate higher pitch variability in ASD,
while negative lower. The y-axis reports the standard error in each study. The white
triangle represents an estimation of the real effect size distribution.
peer-reviewed) is the author/funder. All rights reserved. No reuse allowed without permission. The copyright holder for this preprint (which was not. http://dx.doi.org/10.1101/046565doi: bioRxiv preprint first posted online Apr. 3, 2016;

22
Pitch and severity of clinical features were investigated in 5 studies (Table 2),
which sought to relate quantitative measures of pitch measures to severity of clinical
features as measured by the Autism Diagnostic Observation Schedule (ADOS, Lord,
2008) and the Autism Screening Questionnaire (ASQ, Dairoku, Senju, Hayashi, Tojo,
& Ichikawa, 2004). Total ADOS scores were negatively related to the temporal
trajectory of pitch. In particular, the steeper the slope of pitch change at the end of
participants’ speech turns, the lower the ADOS score (Bone, et al., 2014). However,
null findings were reported in relation to pitch mean and range (Nadig & Shaw,
2012), and other temporal properties of pitch (Bone, et al., 2014). The communication
sub-scale of the ADOS was found to correlate with pitch standard deviation in
adolescents but not in children during narrative productions (Diehl, et al., 2009).
Finally, pitch coefficient of variation was found to correlate negatively with ASQ
Social Reciprocal Interaction, but not with total ASQ, Repetitive Behavior and
Communication in children (Nakai, et al., 2014). As the direction of relation between
pitch variability and clinical features seems to vary by study and no replication of any
result is available, the current evidence is deemed inconclusive.
Table 2 – Relations between acoustic measures and severity of clinical
features
Authors Sample Size and
matching
criteria
Age IQ and level
of function of
the ASD
group
Clinical
Features
Findings
(Diehl, et
al., 2009)
21ASD
21 TD
10-18y HFA
PPVT-III:
ADOS
Communication
Pitch SD: Positive
correlation
peer-reviewed) is the author/funder. All rights reserved. No reuse allowed without permission. The copyright holder for this preprint (which was not. http://dx.doi.org/10.1101/046565doi: bioRxiv preprint first posted online Apr. 3, 2016;

23
Group level
gender, age, IQ
and verbal ability
match
Mean 115.3
(SD 12.52)
Wechsler IQ:
Mean 118.52
(SD 14.73)
r = 0.43, p < 0.05
(Diehl, et
al., 2009)
17 ASD
17 TD
Group level
gender, age, IQ
and verbal ability
match
6-14y HFA
Clinical
Evaluation of
Language
Fundamentals.
3: 101.53
(13.61)
ADOS
Communication
Pitch SD: NS
r = 0.06, p = 0.83
(Nadig &
Shaw,
2012)
15 ASD
13 TD
Group level age,
gender, language
and intellectual
ability match
8-14y HFA, CELF-IV: Mean 109 (13)
PIQ: 105 (15)
SCQ: 26 (6)�
ADOS total Pitch Range: NS
r = -0.40, p = 0.14
(Nakai, et
al., 2014)
26 ASD
37 TD
Group level age
match
4-10y 69.8 ± 16.9
IQ: 67.7 ± 17.6
ASQ total
ASQ Social
Reciprocal
Interaction
ASQ Repetitive
Behavior
ASQ
Communication
Pitch CV (words):
NS
r=0.12, p>0.05
Pitch CV (words):
Negative
correlation
r=-0.62, p<0.05
Pitch CV (words):
NS
r=0.28, p>0.05
Pitch CV (words):
NS
peer-reviewed) is the author/funder. All rights reserved. No reuse allowed without permission. The copyright holder for this preprint (which was not. http://dx.doi.org/10.1101/046565doi: bioRxiv preprint first posted online Apr. 3, 2016;

24
r=0.29, p>0.05
(Bone, et
al., 2014)
24 ASD
No TD group
5-14y Fluent verbal
ability
ADOS total Median pitch
slope: Negative
r = –0.68, p
<0.001
Curvature Pitch
Median: Negative
r= -0.53, p<0.05
While anecdotal and qualitative reports clearly indicate a difference in the use
of pitch in ASD, the acoustic evidence is more uncertain, with little replication, and a
high number of non-significant or contradictory findings. Even taking at face value
the two meta-analytic effect sizes, it should be noted that an estimated difference of
Cohen’s d 0.4 to 0.5 is a small difference. Indeed, if we were to use these statistical
estimates to guess whether any given voice belongs to a participant with ASD or to a
comparison one, we would only be right about 61-64% of the time, an insufficient
level of accuracy to justify its use as a potential marker (Ellis, 2010).
3.2 Intensity
Intensity or loudness is a measure of the energy carried by a sound wave and is
important for making speech intelligible and for expressing emotions. 8 studies have
investigated intensity through quantitative measures (Table 3).
Table 3 – Studies involving acoustic measures of intensity in ASD
peer-reviewed) is the author/funder. All rights reserved. No reuse allowed without permission. The copyright holder for this preprint (which was not. http://dx.doi.org/10.1101/046565doi: bioRxiv preprint first posted online Apr. 3, 2016;

25
Authors Sample Size Age IQ and level of
function of the
ASD group
Task Findings
(Scharfstein, et al.,
2011)
30 AS,
30 TD
Group level
age and gender
match
7-13
y
Asperger’s
Disorder (AD)
Kaufman Brief
Intelligent Test:
114 (SD=14.08)
Social
Intera
ction
Intensity Mean:
Lower
ASD: 47.41 db (3.8);
TD: 59.03 db (5.9)
Intensity SD: Lower
ASD: 2.97 db (1.9);
TD: 5.15 db (2.0)
(Filipe, et al., 2014) 12 ASD
17 TD
Group level
age and non-
verbal
intellectual
level match
4-6 y Range of
Raven’s
Coloured
Progressive
Matrices:: 17-
29:
Spont
aneou
s
produ
ction
(lexic
al
elicita
tion)
Intensity Mean: NS
ASD: 75 db (2.88);
TD: 72.82 db (4.33)
(Grossman, et al.,
2010)
11 ASD
9 TD
Group level
age, verbal and
intellectual
ability match
7-17
y
HFA, Total IQ:
106.7 (10.6)
PPVT-R: 107
(15.4)
Spont
aneou
s
produ
ction
(lexic
al
elicita
tion)
Intensity Mean: NS
ASD: 68.78 db (4.5);
TD: 69.27 db (3.52)
Intensity Range: NS
ASD: 27.22 db (4.2),
TD: 23.82 db (4.39)
(Diehl & Paul, 2012) 24 ASD
22 TD
8-16
y
CELF-IV: 97.21 (18.61)
Const
rained
Intensity Mean: NS
peer-reviewed) is the author/funder. All rights reserved. No reuse allowed without permission. The copyright holder for this preprint (which was not. http://dx.doi.org/10.1101/046565doi: bioRxiv preprint first posted online Apr. 3, 2016;

26
Group level
age match
Non verbal IQ:
103.61 (17.14)
produ
ction
(Imita
tion)
(Diehl & Paul, 2013) 24 ASD
22 TD
Group level
age match
8-16
y
CELF-IV: 97.21 (18.61)
Non verbal IQ:
103.61 (17.14)
Spont
aneou
s
produ
ction
(sente
nce
elicita
tion)
Intensity Mean: NS
(Hubbard &
Trauner, 2007)
18 ASD
10 TD
No matching
criterion
reported
6-21
y
No
characterization
Const
rained
produ
ction
(imita
tion)
Intensity Mean: NS
(Quigley, et al 2016) 10 ASD, 9 TD.
Group level
age match
12m NA Social
intera
ction
Intensity mean: NS
ASD: 68.79 dB
(2.5); TD: 67.53 dB
(4.79)
(Quigley, et al 2016) 10 ASD, 9 TD.
Group level
age match
18m NA Social
intera
ction
Intensity mean: NS
ASD: 69.8 dB
(2.81); TD: 66.14 dB
(2.76)
peer-reviewed) is the author/funder. All rights reserved. No reuse allowed without permission. The copyright holder for this preprint (which was not. http://dx.doi.org/10.1101/046565doi: bioRxiv preprint first posted online Apr. 3, 2016;

27
Intensity Mean was available for 8 studies (105 ASD and 97 comparison
participants), one with significantly lower intensity for ASD and the others with null
findings (Filipe, et al., 2014; Grossman, et al., 2010; Scharfstein, et al., 2011).
Intensity variability was available for 2 studies involving 41 ASD and 39
comparison participants. One study reported lower variability, and the other null
findings.
Finally, one study attempted to relate intensity measures and severity of
clinical features (ADOS total score): No significant correlation was found for ADOS
and the temporal profiles of intensity, such as slope and curvature (Bone, et al., 2014).
In summary, there is not enough acoustic evidence to support the impression
of atypical voice intensity in ASD. It should be noted that acoustic measures of
intensity are highly dependent on the relative positions of microphone and speakers,
as well as to changes in angle and distance through the vocal production and therefore
highly prone to external artifacts. Intensity measures should therefore be assessed
with caution.
3.3. Duration, speech rate and pauses
Duration is measured as length in seconds, and has been applied to full utterances,
lexical items (words) and syllables (often distinguishing between stressed and
unstressed syllables). A related duration measure, speech rate, is measured as
estimated syllables per second, number of pauses, length of pauses and voiced
duration. 19 studies employed acoustic descriptors of duration, pauses and speech rate
(see Table 4).
peer-reviewed) is the author/funder. All rights reserved. No reuse allowed without permission. The copyright holder for this preprint (which was not. http://dx.doi.org/10.1101/046565doi: bioRxiv preprint first posted online Apr. 3, 2016;

28
Table 4 – Studies involving quantitative acoustic measures of duration in ASD
Authors Sample Size
and matching
criteria
Age IQ and level
of function
in the ASD
group
Task Findings
(Brisson, et
al., 2014)
13 ASD
13 TD
Group-level age
match
0-6 m No
characterizati
on
Social
Interaction
Vocalization
duration: NS
ASD: 651 ms (185);
TD: 652 ms (262)
(Oller, et al.,
2010)
77 ASD
106 TD
Group-level
gender, mother
education and
developmental
age
16-48
m
No
characterizati
on
Social
Interaction
Vocalization
duration: shorter
(Nadig &
Shaw, 2012)
15 ASD
13 TD
Group level age,
gender, language
and intellectual
ability match
8-14 y HFA, CELF-IV: Mean 109 (13)
PIQ: 105 (15)
SCQ: 26 (6)�
Social
Interaction
Speech rate: NS
ASD: 172 syll/m
(53.2); TD: 148
syll/m (43.57)
(Nadig &
Shaw, 2012)
15 ASD
11 TD
Group level age,
gender, language
and intellectual
ability match
8-14 y HFA, CELF-IV: Mean 108 (16)�
PIQ: 111 (17)
SCQ: 26
(6)�
Spontaneous
Production
(sentence
elicitation)
Speech rate: NS
ASD: 206.97 syll/m
(39.34); TD: 204.19
syll/m (56.87).
(Diehl & 24 ASD 8-16 CELF-IV: 97.21
Constrained Utterance Duration:
peer-reviewed) is the author/funder. All rights reserved. No reuse allowed without permission. The copyright holder for this preprint (which was not. http://dx.doi.org/10.1101/046565doi: bioRxiv preprint first posted online Apr. 3, 2016;

29
Paul, 2012) 22 TD
Group level age
match
years (18.61)
Non verbal
IQ: 103.61
(17.14)
Production
(Imitation)
Lexical Imitation:
Longer
Prosodic Imitation:
NS
(Diehl &
Paul, 2013)
24 ASD
22 TD
Group level age
match
8-16
years
CELF-IV: 97.21 (18.61)
Non verbal
IQ: 103.61
(17.14)
Spontaneous
Production
(sentence
elicitation)
Utterance duration:
Longer
(Depape, et
al., 2012)
12 ASD
6 TD
Group level age
match
17-34
y
6 HFA, 6 Medium Functioning Autism (MFA)
PPVT: HFA: 105.3 (5.3)
MFA: 89.2 (7.8)
Social
Interaction
Utterance duration:
NS
(Bonneh, et
al., 2011)
41 ASD
42 TD
Group level age
and gender
match
4-6 y All verbal Spontaneous
production
(lexical
elicitation)
Utterance duration:
longer
ASD: 70 s; TD 66 s
Word Duration:
longer
ASD: 0.74 s; TD:
0.62 s
Speech Rate: slower
ASD: 27.9 wpm;
TD: 31.7 wpm
(Filipe, et al.,
2014)
12 ASD
17 TD
Group level age
and non-verbal
intellectual level
4-6 y Range of
Raven’s
Coloured
Progressive
Matrices::
Spontaneous
production
(lexical
elicitation)
Utterance duration:
longer
ASD: 1.08 (0.15);
TD: 0.89 (0.5)
peer-reviewed) is the author/funder. All rights reserved. No reuse allowed without permission. The copyright holder for this preprint (which was not. http://dx.doi.org/10.1101/046565doi: bioRxiv preprint first posted online Apr. 3, 2016;

30
match 17-29:
(Fosnot &
Jun, 1999)
4 ASD
4 TD
No matching
criterion reported
7-14 y Sight-word
readers
Constrained
production
(reading and
imitation)
Utterance duration:
longer
(Grossman,
et al., 2010)
16 ASD
15 TD
Group level age,
verbal and
intellectual
ability match
7-17 y HFA, Total
IQ: 106.7
(10.6)
PPVT-R: 107
(15.4)
Spontaneous
production
(lexical
elicitation)
Syllable Duration:
longer
First syllable stress:
ASD 0.82 (0.15),
TD: 0.68 (0.19)
Last syllable stress:
ASD 0.98 (0.19),
TD: 0.83 (0.21)
Speech rate: NS
ASD: 5.31 (1.31);
TD: 5.44 (1.54)
(Paul, et al.,
2008)
46 ASD,
20 TD
Group level age
and gender
match
7-28 y 9 ASD, 15
AS, 5 PDD-
NOS
verbal IQ
>70
Constrained
production
(imitation)
(stressed) syllable
duration: shorter
ASD: 321 (45) ms;
TD: 346 (44)
(unstressed) syllable
duration: NS
ASD: 196 (35) ms;
TD: 186 (23)
(Hubbard &
Trauner,
2007)
18 ASD
10 TD
No matching
criterion reported
6-21 y Constrained
production
(Imitation)
Utterance Duration:
NS
(Thurber &
Tager-
10 ASD
10 TD
7-15 y PPVT: 58.3
(18.5)
Spontaneous
production
Grammatical
pauses: NS
peer-reviewed) is the author/funder. All rights reserved. No reuse allowed without permission. The copyright holder for this preprint (which was not. http://dx.doi.org/10.1101/046565doi: bioRxiv preprint first posted online Apr. 3, 2016;

31
Flusberg,
1993)
Group-level
verbal ability
match
(narrative
production)
ASD: 13.1 (7.4);
TD: 9.1 (3.7)
Agrammatical
pauses: Fewer
ASD: 2.7 (2); TD:
4.3 (2.2)
(Feldstein,
Konstantare
as, Oxman,
& Webster,
1982)
12 ASD,
24 TD
No match
14-20
y
Articulate
and
high.function
ing
Social
Interaction
Pauses: Longer
Stronger effect
when speaking with
unfamiliar
interlocutor
Vocalization
duration: NS
(Morett,
O’Hearn,
Luna, &
Ghuman,
2015)
18 ASD,
21 TD
Group level age,
gender and
verbal ability
match
10-20y IQ: 104.83 (14.33)
Spontaneous
production
(narrative
production)
Utterance duration:
NS
ASD: 17.52 s
(9.22); TD: 26.92
(13.33)
Pause Number:
Higher
ASD: 2.81 s (1.86);
TD: 1.11 (1.18)
(Parish-
Morris et al,
2016)
65 ASD, 17 TD
Group level age
match
10y HFA
IQ: 105.31 (14.88)
Social
Interaction
(ADOS
interview)
Word duration:
Shorter
ASD: 0.402 s
(0.002); TD: 0.376 s
(0.004)
(Quigley et
al, 2016)
10 ASD, 9 TD
Group level age
match
12m NA Social
interaction
Utterance duration:
NS
ASD: 46.11 s
peer-reviewed) is the author/funder. All rights reserved. No reuse allowed without permission. The copyright holder for this preprint (which was not. http://dx.doi.org/10.1101/046565doi: bioRxiv preprint first posted online Apr. 3, 2016;

32
(33.36); TD: 32.76 s
(17.99)
(Quigley et
al, 2016)
10 ASD, 9 TD
Group level age
match
18m NA Social
interaction
Utterance duration:
NS
ASD: 34.7 s
(18.86); TD: 20.67 s
(12.15)
Out of 15 studies involving duration measures 7 reported longer duration, 6
reported no differences between groups and 1 shorter duration in ASD. Out of 4
studies investigating speech rate, 3 reported null findings and 1 found slower speech
rate in ASD. Out of 2 studies focusing on syllable duration, one reports longer
duration for stressed syllables in ASD, whereas the other reports shorter duration for
stressed syllables and no differences for unstressed syllables. Out of 3 studies
measuring speech pauses, 1 finds longer pauses, 1 no difference in grammatically
motivated pauses, but fewer pragmatically motivated ones and the third a higher
number of pauses. Two studies investigated the relation between speech rate and
severity of clinical features in terms of ADOS total scores), but found no significant
correlations (Bone, et al., 2014; Nadig & Shaw, 2012). In sum, not enough statistical
estimates were reported to allow for meta-analyses and the findings do not seem
conclusive.
3.4. Voice Quality
peer-reviewed) is the author/funder. All rights reserved. No reuse allowed without permission. The copyright holder for this preprint (which was not. http://dx.doi.org/10.1101/046565doi: bioRxiv preprint first posted online Apr. 3, 2016;

33
Voice quality covers a large variety of features, which do not overlap between
studies. Hoarseness, breathiness and creaky voice are often attributed to imperfect
control of the vocal fold vibrations that produce speech and have been quantified as
irregularities in pitch (jitter) and intensity (shimmer), or as low harmonic to noise
ratio (relation between periodic and aperiodic sound waves) (Tsanas, Little,
McSharry, & Ramig, 2011). More generic definitions of dysphonia, or voice
perturbation, rely on cepstral analyses, which involve a further frequency
decomposition of the pitch signal, that is, the frequency of changes in frequency
(Maryn, Roy, De Bodt, Van Cauwenberge, & Corthals, 2009). Analyses of voice
quality are particularly challenging and difficult to compare across studies because of
a lack of established standards: they rely on the choice of several parameters, and the
results change greatly if applied to prolonged phonations (held vowels), or continuous
speech (Laver, Hiller, & Beck, 1992; Orlikoff & Kahane, 1991).
So far only one published study has investigated acoustic measures of voice
quality in ASD: children with ASD were shown to have more jitter and jitter
variability, as well as less harmonic to noise ratio, and no differences in shimmer or
cepstral peak prominence (Bone, et al., 2014). However, a series of unpublished
conference papers point to breathiness (Boucher, Andrianopoulos, & Velleman, 2010;
Wallace et al., 2008), tremors (Wallace, et al., 2008), and task- and vowel-dependent
low jitter and low shimmer (Boucher, Andrianopoulos, Velleman, & Pecora, 2009).
One study investigated the relation between ADOS total scores and voice
quality, highlighting positive correlations with jitter and harmonics to noise ratio
variability, and negative ones with levels of Harmonic to Noise Ratio (Bone, et al.,
2014). Notice that since the only published study mentioned here is already fully
peer-reviewed) is the author/funder. All rights reserved. No reuse allowed without permission. The copyright holder for this preprint (which was not. http://dx.doi.org/10.1101/046565doi: bioRxiv preprint first posted online Apr. 3, 2016;

34
reported in previous tables, we have not produced a dedicated table for studies on
voice quality.
In summary, while a distinctive voice quality has been reported in ASD since
the very early days of the diagnosis, quantitative evidence is extremely sparse. While
potentially promising, the existing studies use non-overlapping measures, making it
difficult to assess the generality of the patterns observed.
4. Results: From Acoustic Patterns to Diagnosis (multivariate machine
learning studies)
The previous section reviewed studies identifying differences in acoustic
patterns produced by ASD and comparison samples, one feature at a time. In this
section we review a second set of 15 studies (see Table 5), which present an
alternative approach: multivariate machine-learning (Bishop, 2006; Hastie,
Tibshirani, & Friedman, 2009). Briefly, multivariate machine learning differs from
traditional univariate approaches in three respects. First, the research question is
reversed. Univariate approaches ask whether there is a statistically significant
difference between two distinct populations (independent variable) with respect to
some measure (dependent variable). Machine learning approaches seek to determine
whether the data contains enough information to accurately separate the two
populations. Second, a multivariate approach enters multiple data features
simultaneously into the analysis, including a wider variety of features than normally
treated in their simple univariate form (such as more detailed spectral and cepstral
features, see par. 3.4). Third, the goal is not to identify the statistical model that best
separates the populations from which the data has been obtained, but to identify the
peer-reviewed) is the author/funder. All rights reserved. No reuse allowed without permission. The copyright holder for this preprint (which was not. http://dx.doi.org/10.1101/046565doi: bioRxiv preprint first posted online Apr. 3, 2016;

35
model that best generalizes to new data (e.g., generalize from a training to a test set of
data, see Yarkoni & Westfall, 2016).
Multivariate machine learning studies typically involve processes of 1) feature
extraction, 2) feature selection and 3) classification (e.g., presence of diagnosis) or
score prediction (e.g., severity of clinical features), the latter two often undergoing a
process of 4) validation.
The first process involves extraction of acoustic features from vocal
recordings. Most studies use summary statistics discussed in the earlier section (mean
and standard deviation of acoustic features), but they often include additional
measures, such as non-linear descriptive statistics. Traditional summary statistics
cannot adequately capture the non-stationary nature of the speech signal; for example,
the mean and the standard deviation of pitch often change over a speech event (Jiang,
Zhang, & McGilligan, 2006). In contrast, time-aware measures – such as slope
analysis, recurrence quantification analysis, Teager-Kaiser energy operator and fractal
analyses - quantify the degree to which acoustic patterns change or are repeated in
time (cf. Table 5. For detailed and technical descriptions of these methods, cf. Bone,
et al., 2014; Kiss, van Santen, Prud'hommeaux, & Black, 2012; Marwan, Carmen
Romano, Thiel, & Kurths, 2007; Riley, Bonnette, Kuznetsov, Wallot, & Gao, 2012;
Tsanas, et al., 2011; Weed & Fusaroli, submitted). Finally, most studies expand the
range of measures, by further quantifying formants, spectral and cepstral properties of
the speech signal (cf. Table 5, for a more detailed treatment of these measures cf. the
referred papers and Eadie & Doyle, 2005). Feature extraction is a largely automated
process, but it often relies on basic manual pre-processing of the data: evaluation of
background noise, isolation of the utterances, sometimes time-coding of the single
words (e.g. Nakai et al 2014). However, it is still unclear how much hand-coding is
peer-reviewed) is the author/funder. All rights reserved. No reuse allowed without permission. The copyright holder for this preprint (which was not. http://dx.doi.org/10.1101/046565doi: bioRxiv preprint first posted online Apr. 3, 2016;

36
theoretically necessary and promising automated techniques are being developed to
replace it (e.g. Miro et al 2012; Xanguera et al. 2014).
As the first process very often generates a large number of acoustic features,
the second process deals with identifying amongst them a minimal set of maximally
informative features. A popular rule of thumb suggests that the feature selection
process should select a number of features inferior to a tenth of the number of
independent data points in the dataset, but different algorithms can deal with different
ratios of features to data points. The third process involves the use of the selected
features to construct a statistical model maximally distinguishing the target groups of
interest (for detailed introductions to these topics, cf. Bishop, 2006; Hastie, et al.,
2009) or most accurately predicting a score (e.g. severity of a given clinical feature).
Since the goal of machine learning procedures is not simply to explain the
current data but to create models that generalize to new data, feature selection and
classification are often validated (or cross-validated, (for details, cf. Rodriguez, Perez,
& Lozano, 2010), for details). Validation involves the division of the dataset into
training and test sets. The statistical models are fit to the training set and their
explanatory power assessed on the test set.
The characteristics and findings of the multi-variate machine-learning studies
are reported in Table 5. For a more detailed overview of how the different studies
reviewed implement feature selection, classification and validation, see
Supplementary Material S1.
Table 5 – Reconstructing Diagnosis from Voice Patterns. An overview
Authors Sample Size
and matching
Age IQ and
level of
Features Feature Selection (FS),
Validation (V),
peer-reviewed) is the author/funder. All rights reserved. No reuse allowed without permission. The copyright holder for this preprint (which was not. http://dx.doi.org/10.1101/046565doi: bioRxiv preprint first posted online Apr. 3, 2016;

37
criteria function
of the
ASD
group
Classifier (C) & Performance4
(Santos
et al.,
2013)
Social
Interactio
n
23 ASD
20 TD
Group level age
match
18 m No
character
ization
Mean, SD and range of: pitch;
first four formant frequencies
and bandwidths; harmonic
spectra locations and
magnitudes and the
differences between spectral
harmonic magnitudes and
spectrum magnitude at the
formant frequencies;
subharmonic-to-harmonic
ratio (SHR); intensity; cepstral
peak prominence (CPP);
harmonic-to-noise ratio
(HNR); jitter and shimmer;
voiced ratio.
FS: None
V: 10-fold cross-validation on
classifier
C: probabilistic NN.
Accuracy: 83%-97%
C: SVM.
Accuracy: 79%-63%
(Oller, et
al., 2010)
Social
Interactio
n
77 ASD
106 TD
(46 SLI)
Group level
gender, mother
education and
16-
48 m
No
character
ization
Voicing events, canonical
syllables, spectral entropy;
spectral tilt, pitch control;
wide formant bandwidth;
duration
FS: None
V: Leave-one-out cross-validation
C: linear DA.
Accuracy: 86%
4 NN: neural networks; SVM: support vector machines; k-NN: nearest neighbors; DA: discriminant analysis. Accuracy indicates the percentage of correctly identified data points in the testing set. Specificity indicates the ability to correctly identify controls as controls, Sensitivity or recall indicates the ability to correctly identify targets as targets. Precision indicates the probability that a positive diagnosis does indeed entail the presence of a disorder. For regressions, performance is measured in terms of variance explained, R2, which in turn tends to be penalized according to the number of features included, Adjusted R2 (Hastie, et al., 2009) .
peer-reviewed) is the author/funder. All rights reserved. No reuse allowed without permission. The copyright holder for this preprint (which was not. http://dx.doi.org/10.1101/046565doi: bioRxiv preprint first posted online Apr. 3, 2016;

38
developmental
age match
(Bonneh,
et al.,
2011)
Spontane
ous
productio
n
41 ASD
42 TD
Group level age
and gender
match
4-
6.5 y
All
verbal
Pitch range and variability FS: None (2 features only)
V: None
C: linear DA
Accuracy: 86%
Sensitivity: 80%
Specificity: 90%
(Kiss, et
al., 2012)
Social
Interactio
n
14 ASD
25 ASD (+SLI)
28 TD
(24 SLI)
Group level
age, verbal and
non verbal IQ
4-9
y
No
character
ization
Pitch mean, median, standard
deviation, median absolute
deviation, mean absolute
deviation, interquartile range
(IQR), skewness and kurtosis
FS: None
V: Leave-one-out cross-validation
C: Naive Bayes.
Accuracy: 74%
Precision: 57%
Sensitivity: 86%
(Kakihar
a,
Takiguc
hi, Ariki,
Nakai, &
Takada,
2015)
Spontane
ous
productio
n
30 ASD
54 TD
Group level age
match
4-9
y
No
character
ization
Pitch and first derivative of
pitch percentiles, mean,
standard deviation, kurtosis,
skewness, maximum,
minimum, and range
FS: None
V: 10-fold cross-validation
C: SVM.
Accuracy: 74.9% (against a
baseline accuracy of 73.2%)
(Asgari,
Bayesteh
tashk, &
12 ASD
64 TD
13 SLI
9-18
y
No
character
ization
Pitch, shimmer, jitter, HNR;
energy, cepstral and spectral
features
FS: None
V: Test/Train
C: SVM
peer-reviewed) is the author/funder. All rights reserved. No reuse allowed without permission. The copyright holder for this preprint (which was not. http://dx.doi.org/10.1101/046565doi: bioRxiv preprint first posted online Apr. 3, 2016;

39
Shafran,
2013)
Constrain
ed
productio
n
10 PDD-NOS
Group level age
match
Sensitivity: 93.80%
(Bone, et
al., 2013)
Constrain
ed
productio
n
12 ASD
64 TD
13 SLI
10 PDD-NOS
Group level age
match
9-
18y
No
character
ization
Mel cepstral coefficients;
pitch, intensity, duration;
pronunciation quality; total
signal; energy, mean and
relative energy changes over
multiple time scales and
frequency bands, and the
frequencies with the majority
of energy content
FS: stepwise forward
V: Test/Train
C: a combination of linear SVMs,
deep neural networks, and k-NN
Sensitivity: 60.2%
(Fusaroli
, Bang,
& Weed,
2013)
Spontane
ous
productio
n
10 ASD
13 TD
Group level age
and gender
match
20-
40y
HFA Parametric (mean, sd) and
dynamic (recurrence
measures) measures of pitch,
and duration.
FS: ElasticNet
V: 5-fold cross-validation
C: DA
Accuracy: 86% Sensitivity: 88.4%
Specificity: 85.4%
C: linear regression predicts
Autism Spectrum Quotient: Adj R2
0.8, p=0.006.
(Fusaroli
,
Grossma
n,
Cantio,
Bilenber
78 ASD (52
US; 26 DK)
68 TD (34 US;
34 DK)
Group level age
and verbal and
8-
16y
HFA
VIQ
DK:
103.14
(17.05)
USA:
Parametric (mean, sd) and
dynamic (recurrence
measures, teager-keisar energy
operator) measures of pitch,
intensity, duration and voice
quality.
FS: ElasticNet
V: 5-fold cross-validation
C: DA
Accuracy: 71.65 % (American
English data, US); 82.01 %
(Danish data, DK); 71.9%
peer-reviewed) is the author/funder. All rights reserved. No reuse allowed without permission. The copyright holder for this preprint (which was not. http://dx.doi.org/10.1101/046565doi: bioRxiv preprint first posted online Apr. 3, 2016;

40
g, &
Weed,
2015)
Spontane
ous
productio
n
non-verbal IQ
match
105.86.
(18.59)
PIQ:
DK:
106.75
(14.15)
USA:
106.88
(15.68)
(combined)
Sensitivity: 59.32% (US); 84.80%
(DK); 63.22% (combined)
Specificity: 84.42% (US); 81.39%
(DK); 80.01% (combined)
C: linear regression:
ADOS RSI: Adj R2 0.28 (US); NS
(DK); 0.13 (combined)
ADOS SB: Adj R2 0.46 (US); 0.32
(combined)
(Fusaroli
,
Lambrec
hts, et
al., 2015)
Spontane
ous
productio
n
17 ASD
17 TD
Group level age
and verbal and
non-verbal IQ
match
25-
62y
HFA
VIQ: 110
(11)
PIQ: 107
(14)
Parametric (mean, sd) and
dynamic (recurrence
measures, Teager-Keisar
Energy Operator) measures of
pitch, intensity, duration and
voice quality.
FS: ElasticNet
V: 5-fold cross-validation
C: DA
Accuracy: 81.09%
Sensitivity: 84.83%
Specificity: 82.20%
C: linear regression:
ADOS total: Adj R2: 0.54
ADOS RSI: Adj R2 0.52
(Bone, et
al., 2014)
Social
Interactio
n
24 ASD
No TD group
5-
14y
Fluent
verbal
ability
Non parametric descriptive
statistics (IQR and median) of:
curvature, slope and center of
pitch and intensity over time;
Boundary and non boundary
changes of speech rate of time.
Voice Quality: Jitter,
Shimmer, CPP, HNR median
and IQR
FS: Stepwise forward
V: None
C: Spearman rank order regression
with ADOS total
r: 0.64
(Marchi 8 ASD 5- No Energy, spectral, cepstral FS: None
peer-reviewed) is the author/funder. All rights reserved. No reuse allowed without permission. The copyright holder for this preprint (which was not. http://dx.doi.org/10.1101/046565doi: bioRxiv preprint first posted online Apr. 3, 2016;

41
et al.,
2015)
Spontane
ous
Productio
n
9 TD
Group level age
match
11y character
ization
(MFCC) and voicing related
low-level descriptors (LLD) as
well as logarithmic harmonic-
to-noise ratio (HNR), spectral
harmonicity, and
psychoacoustic spectral
sharpness
V: Leave-One-Out cross-validation
C: SVM
Sensitivity 78.3%
(Marchi,
et al.,
2015)
Spontane
ous
Productio
n
9 ASD
11 TD
No match
5-
11y
No
character
ization
Energy, spectral, cepstral
(MFCC) and voicing related
low-level descriptors (LLD) as
well as logarithmic harmonic-
to-noise ratio (HNR), spectral
harmonicity, and
psychoacoustic spectral
sharpness
FS: None
V: Leave-One-Out cross-validation
C: SVM
Sensitivity 86.4%
(Marchi,
et al.,
2015)
Spontane
ous
Productio
n
7 ASD
11 TD
Group level age
match
5-
10y
No
character
ization
Energy, spectral, cepstral
(MFCC) and voicing related
low-level descriptors (LLD) as
well as logarithmic harmonic-
to-noise ratio (HNR), spectral
harmonicity, and
psychoacoustic spectral
sharpness
FS: None
V: Leave-One-Out cross-validation
C: SVM
Sensitivity 82.7%
While simple measures of pitch were the most commonly employed, no single
feature was used in all, or even in the majority of the studies. Analogously no single
feature selection, classification algorithm or validation process was employed in a
majority of studies. In terms of results, all but one multivariate machine-learning
peer-reviewed) is the author/funder. All rights reserved. No reuse allowed without permission. The copyright holder for this preprint (which was not. http://dx.doi.org/10.1101/046565doi: bioRxiv preprint first posted online Apr. 3, 2016;
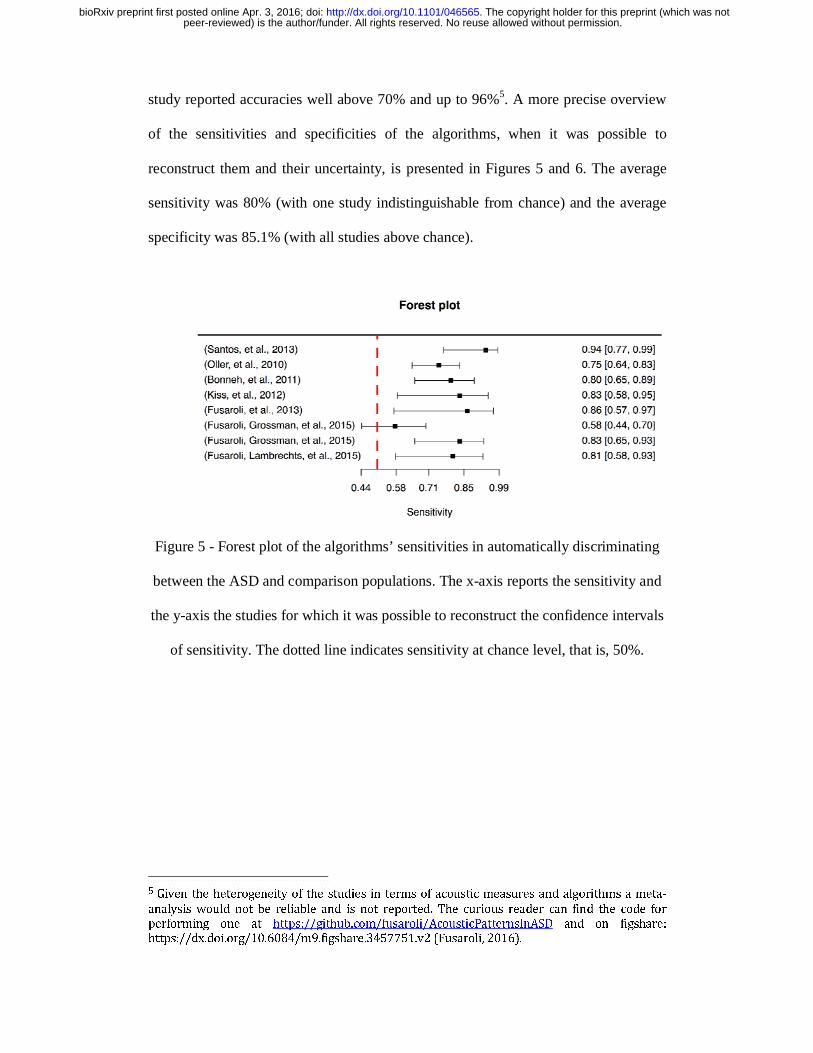
study reported accuracies well above 70% and up to 96%5. A more precise overview
of the sensitivities and specificities of the algorithms, when it was possible to
reconstruct them and their uncertainty, is presented in Figures 5 and 6. The average
sensitivity was 80% (with one study indistinguishable from chance) and the average
specificity was 85.1% (with all studies above chance).
Figure 5 - Forest plot of the algorithms’ sensitivities in automatically discriminating
between the ASD and comparison populations. The x-axis reports the sensitivity and
the y-axis the studies for which it was possible to reconstruct the confidence intervals
of sensitivity. The dotted line indicates sensitivity at chance level, that is, 50%.
5 Given the heterogeneity of the studies in terms of acoustic measures and algorithms a meta-
analysis would not be reliable and is not reported. The curious reader can find the code for performing one at https://github.com/fusaroli/AcousticPatternsInASD and on figshare: https://dx.doi.org/10.6084/m9.figshare.3457751.v2 (Fusaroli, 2016).
peer-reviewed) is the author/funder. All rights reserved. No reuse allowed without permission. The copyright holder for this preprint (which was not. http://dx.doi.org/10.1101/046565doi: bioRxiv preprint first posted online Apr. 3, 2016;

Figure 6 - Forest plot of the algorithms’ specificities in automatically discriminating
between the ASD and comparison populations. The x-axis reports the specificity and
the y-axis the studies for which the relevant statistics were available. The dotted line
indicates specificity at chance level, that is, 50%.
Besides the classification of voice into ASD and comparison groups, 4 studies
demonstrate the possibility of predicting severity of clinical features (ADOS total
scores, ADOS Stereotyped Behavior and ADOS Reciprocal Social Interaction) from
acoustic measures, in particular pitch, shimmer and jitter (Bone, et al., 2014; Fusaroli,
et al., 2013; Fusaroli, Grossman, et al., 2015; Fusaroli, Lambrechts, et al., 2015).
However, differences in terms of methods and measures make comparison between
studies difficult.
6. Discussion
6.1 Overview
Clinical practitioners have long attributed distinctive voice and prosodic patterns to
individuals with ASD (Asperger, 1944; Kanner, 1943). We set out to systematically
review the evidence for such patterns and their potential as a marker of ASD. We
peer-reviewed) is the author/funder. All rights reserved. No reuse allowed without permission. The copyright holder for this preprint (which was not. http://dx.doi.org/10.1101/046565doi: bioRxiv preprint first posted online Apr. 3, 2016;

44
identified 34 articles involving 30 univariate and 15 multivariate machine-learning
studies. Sample sizes were limited, with a mean of 21.14 (SD: 16.36) and a median of
17 (IQR: 10.5) ASD participants across the univariate studies and a mean of 24.1
(SD: 18.24) and a median of 17 (IQR: 15.5) across the multivariate ones.
The univariate studies reported as many null results as significant differences
between ASD and comparison groups. Meta-analyses identified reliable, but small
effects for pitch mean and range, corresponding to a discriminative accuracy of
approximately 61-64%. The multivariate machine-learning studies, by contrast,
painted a more promising picture and largely outperformed the univariate ones, with
accuracy ranging from 70% to 96% for separating individuals with ASD from
comparison participants. The multivariate attempts at predicting severity of clinical
features do not systematically outperform the univariate studies (univariate R2
between 0.18 and 0.46; multivariate Adjusted R2 between 0.13 and 0.8). Whilst the
multivariate findings are stronger and involve more robust statistical procedures (such
as validation procedures), there has been no general attempt to replicate findings
across multiple studies using similar methods. Because of the complexity and
heterogeneity of feature extraction, selection and of the statistical models involved in
the multivariate studies, it is not possible to assess which (if any) of the acoustic
features are most informative for diagnosis and clinical features across studies.
6.2. Obstacles in identifying an acoustic marker for ASD
We raised the possibility that acoustic features of vocal production could be
used as a marker of ASD. We defined a marker of ASD as a directly measurable
index that is derived from sensitive and reliable quantitative procedures and is
peer-reviewed) is the author/funder. All rights reserved. No reuse allowed without permission. The copyright holder for this preprint (which was not. http://dx.doi.org/10.1101/046565doi: bioRxiv preprint first posted online Apr. 3, 2016;

45
associated with the disorder and/or its clinical features. We identified as additional
challenges the need to assess the heterogeneity of individuals with ASD (e.g. in
severity of clinical features) and the progression of clinical features over time (e.g. in
presence of intervention program or aging).
We could not identify any single feature that could yet serve the role of a
marker. While many aspects of vocal production in ASD have long been described as
different, there have been few consistent findings among studies, except for pitch
mean and range. The multivariate machine-learning approach to vocal production in
ASD seems promising, albeit yet unsystematic; it can capture the complex and often
non-linear nature of the acoustic patterns that may give rise to the clinical impression
of atypical voice and prosody in ASD. Indeed, such impressions are often based on
multiple types of information (Forbes-Riley & Litman, 2004; Liscombe, Venditti, &
Hirschberg, 2003).
Many advances have thus been made since McCann & Peppe’s (2003) review:
a larger number of acoustic features have been quantitatively defined and more
complex statistical techniques have been developed. However, the search for a vocal
marker of ASD has still to overcome four obstacles: small sample sizes; few
replications of effects across studies; too heterogeneous methods for the extraction of
acoustic features and their analysis; and limited theoretical background for the
research. First, people with ASD present diverse clinical features with different levels
of severity. Five of the reviewed studies sought to investigate the relation between
severity of clinical features and acoustic patterns. However, because the sample size
of each study was too low (median of participants with ASD < 30), it is difficult – if
not impossible – to control for the large natural heterogeneity among individuals in
terms of clinical features and their severity. Second, most of the studies reviewed
peer-reviewed) is the author/funder. All rights reserved. No reuse allowed without permission. The copyright holder for this preprint (which was not. http://dx.doi.org/10.1101/046565doi: bioRxiv preprint first posted online Apr. 3, 2016;

46
focused on different acoustic features, which entails that effects rarely are replicated
and that it is difficult to perform reliable meta-analyses of effect sizes. Third, the
reviewed studies differed considerably with respect to methods and statistical
analysis. For example, we identified three types of speech-production task
(constrained production, spontaneous production and social interaction), each of
which is likely to involve distinct social and cognitive demands and therefore
different vocal production patterns, but more fine-grained typologies could be used.
This would also enable the assessment of whether acoustic markers of ASD could
represent biomarkers, that is, be directly related to underlying biological processes as
those involved in respiration and fine-motor control of the vocal folds. Further,
different studies not only use different acoustic features but also use different methods
for feature extraction – if described at all – making comparisons between studies
difficult 6 . This lack of clarity is especially problematic for machine-learning
techniques7.
A final issue to be mentioned is the relation between acoustic markers, clinical
assessment and diagnosis (or clinical features). Would acoustic markers of ASD
contribute new information to the clinical assessment? Technically, the machine
learning procedures analyzed rely on existing clinical assessment to learn the relation
between acoustic features and ASD. In other words, they cannot get better than the
clinical assessment they are trained on. Nevertheless, there are several advantages in
employing acoustic markers of ASD and its clinical features. First, the identification
of acoustic markers would represent a fast, cheap, non-invasive procedure, which
6 For instance, the parameters to define the accepted ceiling of the fundamental frequency might vary from 400 Hz to 700 Hz. Higher ceilings have been shown to better capture acoustic differences features in ASD (Kiss, et al., 2012), however the definition of the ceiling employed is very rarely reported. 7 It has been shown, for example, that recording participants with ASD and comparison participants at different locations (which was unreported) induced artificially high discrimination accuracy due to the properties of each location’s background noise (Bone, et al., 2013).
peer-reviewed) is the author/funder. All rights reserved. No reuse allowed without permission. The copyright holder for this preprint (which was not. http://dx.doi.org/10.1101/046565doi: bioRxiv preprint first posted online Apr. 3, 2016;

47
could speed up the diagnostic process. Second, the procedure could support the
diagnostic process in objective ways, increasing the reliability of the clinical features
assessment especially for less experienced practitioners. Third, acoustic markers of
ASD and clinical features could point to mechanisms underlying the disorder and its
various impairments allowing for a simultaneous assessment of several clinical
features and their progression over time. Whether these potentialities can be lived out
is still an empirical question, which requires more collaborative and open research
processes.
6.3. Towards a more collaborative and open research process
The combination of promising results and a lack of a systematic approach is
far from rare in the study of acoustic patterns in neuropsychiatric conditions (Cohen,
Mitchell, & Elvevåg, 2014; Cummins, et al., 2015; Weed & Fusaroli, submitted). We
need to develop a systematic approach to vocal production in ASD, accounting for the
heterogeneity of the disorder, the individual differences of the participants and their
progression through aging and intervention, for it to be of clinical relevance. To
achieve this goal we advocate more open and cumulative research practices. We
therefore outline three recommendations for future research: open data, open
methods, and theory-driven research.
Open Data. Many of the reviewed studies did not report the necessary
information for performing meta-analysis. For example, we could not account for the
role of age in the patterns observed, as we could not access participant-level data
matching acoustic and demographic measures. The field as a whole would benefit
from sharing datasets, which would allow for across-study comparisons and for larger
scale analyses. While voice recordings are often sensitive data in clinical population,
peer-reviewed) is the author/funder. All rights reserved. No reuse allowed without permission. The copyright holder for this preprint (which was not. http://dx.doi.org/10.1101/046565doi: bioRxiv preprint first posted online Apr. 3, 2016;

48
and therefore not easily shareable, the extracted acoustic measures do not always
share this restriction. In line with this recommendation, the data used here are
available at https://github.com/fusaroli/AcousticPatternsInASD.
Open Methods. The quantitative assessment of acoustic measures presents the
researcher with several important choices: for example, how should the audio signal
be recorded and preprocessed, which parameters should be used to extract the
different acoustic features, and whether the extracted data is transformed (e.g.
applying a logarithmic transform to fundamental frequency). Recording devices and
setup might have a strong impact on the quality of the recording and affect the
possibility of extracting source and energy-based measures such as intensity and
voice quality (see Orlikoff and Kahane, 1991 and Degottex et al 2014). It is therefore
a good practice to ensure that: i) The same device is used for the full data collection
and the technical specifics of the device should be reported. ii) The device maintains a
constant distance from the speaker’s mouth. Recordings from table-top omni-
directional microphones are susceptible to multiple artifacts due to different posture,
movements and agitation in the participants with ASD affecting the mean level of
sound pressure and its variability. Even when those suggestions cannot be followed
(e.g. when an existing clinical corpus is used for the analysis), reporting the recording
device and procedure ensures the possibility to choose and assess only appropriate
acoustic features, e.g. excluding intensity and voice quality in presence of sub-optimal
recordings.
Pre-processing and feature extraction have even more degrees of freedom and
detailed reports of the choices are necessary. Otherwise replication and cross-talk
between research groups are impossible. Ideally, the full data-processing pipeline
should be automated and the script used to do so should be published as
peer-reviewed) is the author/funder. All rights reserved. No reuse allowed without permission. The copyright holder for this preprint (which was not. http://dx.doi.org/10.1101/046565doi: bioRxiv preprint first posted online Apr. 3, 2016;

49
supplementary material (or on public code repositories such as GitHub). The literature
on vocal production in Parkinson’s and affective disorders might serve as an example
for researchers investigating vocal production in ASD (Degottex, Kane, Drugman,
Raitio, & Scherer, 2014; Tsanas, et al., 2011). In line with this recommendation, the R
code employed in this paper is available at
https://github.com/fusaroli/AcousticPatternsInASD, and can be easily improved
and/or used to update the meta-analysis as new studies are published.
Theory-driven research. A common feature of the studies reviewed is the lack
of theoretical background. For example, limited attention is paid to clinical features
and their severity and the choice of the speech-production task and acoustic measures
used is often under-motivated. On the contrary, by putting hypothesized mechanisms
to the test, more theory-driven research on vocal production in ASD would improve
our understanding of the disorder itself. For examples, recent models of impaired
perceptual and motor anticipation in ASD (Palmer, Paton, Kirkovski, Enticott, &
Hohwy, 2015; Van de Cruys et al., 2014) would predict the presence of
overcorrection in vocal production in ASD (e.g. bursts of jitter and shimmer). Further,
models of social impairment in ASD could be tested by analyzing the acoustic
dynamics involved in conversations, such as reciprocal prosodic adaptation and
compensation (Dale, Fusaroli, Duran, & Richardson, 2013; Fusaroli, Raczaszek-
Leonardi, & Tylén, 2014; Fusaroli & Tylén, 2012; Hopkins, Yuill, & Keller, 2015;
Lambrechts, Yarrow, Maras, & Gaigg, 2014; Pickering & Garrod, 2004; Slocombe et
al., 2013).
In general, different speech-production tasks involve different social and
cognitive demands and such differences might account for much of the unexplained
variance between the reviewed studies. We therefore recommend data collection
peer-reviewed) is the author/funder. All rights reserved. No reuse allowed without permission. The copyright holder for this preprint (which was not. http://dx.doi.org/10.1101/046565doi: bioRxiv preprint first posted online Apr. 3, 2016;

50
using several motivated speech-production tasks, especially combining existing
clinical and ecological speech recordings with tasks chosen based on hypothesized
mechanisms underlying clinical features. On one hand, structured tasks might allow
the researcher to control for confounds and test for the role of specific experimental
factors. Further, several standardized tests – including ADOS interviews – involve
vocal production and their systematic collection and use could enable the construction
of large datasets comparable across labs and languages. On the other hand, structured
tasks might not offer representative samples of vocal productions in ASD, as
individuals with ASD differ in terms of what they can do if tested and what they
actually do in their everyday life (Fine, Bartolucci, Ginsberg, & Szatmari, 1991; Klin,
Jones, Schultz, & Volkmar, 2003). Recent technological developments enable
unobtrusive longitudinal recordings, opening up for the study of prosody and other
social behaviors during everyday life (Vosoughi, Goodwin, Washabaugh, & Roy,
2012; Warlaumont, et al., 2014). This might in turn help us better understand the
everyday dynamics of social impairment in ASD.
7. Conclusion
We have systematically reviewed the literature on distinctive acoustic patterns
in ASD. We did not find conclusive evidence for a single acoustic marker for ASD
and predictor for severity of clinical features. Multivariate machine-learning research
provides promising results, but more systematic cross-study validations are required.
To advance the study of vocal production in ASD, we outlined three
recommendations: more open, more cumulative and more theory-driven research.
peer-reviewed) is the author/funder. All rights reserved. No reuse allowed without permission. The copyright holder for this preprint (which was not. http://dx.doi.org/10.1101/046565doi: bioRxiv preprint first posted online Apr. 3, 2016;

51
Acknowledgements This work was supported by the Seed Funding Program
of The Interacting Minds Center, grant “Clinical Voices” (RF) and the Calleva
Research Centre for Evolution and Human Sciences (DB).
8. References
Alden, L. E., & Taylor, C. T. (2004). Interpersonal processes in social phobia.
Clinical Psychology Review, 24(7), 857-882.
Amorosa, H. (1992). 10. Disorders of vocal signaling in children. Nonverbal vocal
communication: Comparative and developmental approaches, 192.
Asgari, M., Bayestehtashk, A., & Shafran, I. (2013). Robust and accurate features for
detecting and diagnosing autism spectrum disorders. Paper presented at the
INTERSPEECH.
Asperger, H. (1944). Die „Autistischen Psychopathen” im Kindesalter. European
Archives of Psychiatry and Clinical Neuroscience, 117(1), 76-136.
Baltaxe, C. (1981). Acoustic characteristics of prosody in autism. In P. Mittler (Ed.),
Frontier of knowledge in mental retardation. Baltimore, MD: University Park Press.
Baltaxe, C. (1984). Use of contrastive stress in normal, aphasic, and autistic children.
Journal of Speech, Language, and Hearing Research, 27(1), 97-105.
Baltaxe, C., & Simmons, J. (1985). Prosodic development in normal and autistic
children Communication problems in autism: Springer.
Banse, R., & Scherer, K. R. (1996). Acoustic profiles in vocal emotion expression.
Journal of Personality and Social Psychology, 70, 614-636.
Bishop, C. M. (2006). Pattern recognition and machine learning: springer.
Bone, D., Chaspari, T., Audhkhasi, K., Gibson, J., Tsiartas, A., Van Segbroeck, M., . .
. Narayanan, S. (2013). Classifying language-related developmental disorders from
peer-reviewed) is the author/funder. All rights reserved. No reuse allowed without permission. The copyright holder for this preprint (which was not. http://dx.doi.org/10.1101/046565doi: bioRxiv preprint first posted online Apr. 3, 2016;

52
speech cues: the promise and the potential confounds. Paper presented at the
INTERSPEECH.
Bone, D., Lee, C.-C., Black, M. P., Williams, M. E., Lee, S., Levitt, P., & Narayanan,
S. (2014). The psychologist as an interlocutor in autism spectrum disorder
assessment: Insights from a study of spontaneous prosody. Journal of Speech,
Language, and Hearing Research, 57(4), 1162-1177.
Bonneh, Y. S., Levanon, Y., Dean-Pardo, O., Lossos, L., & Adini, Y. (2011).
Abnormal speech spectrum and increased pitch variability in young autistic children.
Frontiers in human neuroscience, 4, 237.
Boucher, M. J., Andrianopoulos, M. V., & Velleman, S. L. (2010). Prosodic features
in the spontaneous speech of children with Autism Spectrum Disorders. Paper
presented at the International Child Phonology Conference, Memphis, TN: The
University of Memphis. .
Boucher, M. J., Andrianopoulos, M. V., Velleman, S. L., & Pecora, L. (2009). Voice
characteristics of autism. Paper presented at the Annual Convention of the American
Speech-Language-Hearing Association, New Orleans, LA.
Brisson, J., Martel, K., Serres, J., Sirois, S., & Adrien, J. L. (2014). Acoustic analysis
of oral productions of infants later diagnosed with autism and their mother. Infant
mental health journal, 35(3), 285-295.
Bryant, G. A. (2010). Prosodic contrasts in ironic speech. Discourse Processes, 47,
545-566.
Chan, K. K., & To, C. K. (2016). Do Individuals with High-Functioning Autism Who
Speak a Tone Language Show Intonation Deficits? Journal of Autism and
Developmental Disorders, 1-9.
peer-reviewed) is the author/funder. All rights reserved. No reuse allowed without permission. The copyright holder for this preprint (which was not. http://dx.doi.org/10.1101/046565doi: bioRxiv preprint first posted online Apr. 3, 2016;
53
Cochran, W. G. (1954). The combination of estimates from different experiments.
Biometrics, 10(1), 101-129.
Cohen, A. S., Mitchell, K. R., & Elvevåg, B. (2014). What do we really know about
blunted vocal affect and alogia? A meta-analysis of objective assessments.
Schizophrenia research, 159(2), 533-538.
Cummins, N., Scherer, S., Krajewski, J., Schnieder, S., Epps, J., & Quatieri, T. F.
(2015). A review of depression and suicide risk assessment using speech analysis.
Speech Communication, 71, 10-49.
Dairoku, H., Senju, A., Hayashi, E., Tojo, Y., & Ichikawa, H. (2004). Development of
Japanese version of autism screening questionnaire. Kokuritsu Tokushu Kyoiku
Kenkyusho Ippan Kenkyu Houkokusho, 7, 19-34.
Dale, R., Fusaroli, R., Duran, N., & Richardson, D. C. (2013). The self-organization
of human interaction. Psychology of Learning and Motivation, 59, 43-95.
Degottex, G., Kane, J., Drugman, T., Raitio, T., & Scherer, S. (2014). COVAREP - A
collaborative voice analysis repository for speech technologies. Paper presented at the
IEEE International Conference on Acoustics, Speech and Signal Processing
(ICASSP), Florence, Italy.
Depape, A. M., Chen, A., Hall, G. B., & Trainor, L. J. (2012). Use of prosody and
information structure in high functioning adults with autism in relation to language
ability. Frontiers in psychology, 3, 72.
Diehl, J. J., Berkovits, L., & Harrison, A. (2010). Is prosody a diagnostic and
cognitive bellwether of autism spectrum disorders. Speech disorders: Causes,
treatments, and social effects, 159-176.
peer-reviewed) is the author/funder. All rights reserved. No reuse allowed without permission. The copyright holder for this preprint (which was not. http://dx.doi.org/10.1101/046565doi: bioRxiv preprint first posted online Apr. 3, 2016;
54
Diehl, J. J., & Paul, R. (2012). Acoustic differences in the imitation of prosodic
patterns in children with autism spectrum disorders. Research on Autism Spectrum
Disorder, 6(1), 123–134.
Diehl, J. J., & Paul, R. (2013). Acoustic and perceptual measurements of prosody
production on the profiling elements of prosodic systems in children by children with
autism spectrum disorders. Applied Psycholinguistics, 34(01), 135-161.
Diehl, J. J., Watson, D. G., Bennetto, L., McDonough, J., & Gunlogson, C. (2009).
An acoustic analysis of prosody in high-functioning autism. Applied
Psycholinguistics, 30, 385–404.
Doebler, P., & Holling, H. (2015). Meta-Analysis of Diagnostic Accuracy with mada.
2015. R package version 0.5.7.
Eadie, T. L., & Doyle, P. C. (2005). Classification of dysphonic voice: acoustic and
auditory-perceptual measures. Journal of Voice, 19(1), 1-14.
Ellis, P. D. (2010). The essential guide to effect sizes: Statistical power, meta-
analysis, and the interpretation of research results: Cambridge University Press.
Fay, W. H., & Schuler, A. L. (1980). Emerging language in autistic children: Hodder
Arnold.
Feldstein, S., Konstantareas, M., Oxman, J., & Webster, C. D. (1982). The
chronography of interactions with autistic speakers: An initial report. Journal of
Communication Disorders, 15(6), 451-460.
Field, A. P., & Gillett, R. (2010). How to do a meta‐analysis. British Journal of
Mathematical and Statistical Psychology, 63(3), 665-694.
Filipe, M. G., Frota, S., Castro, S. L., & Vicente, S. G. (2014). Atypical Prosody in
Asperger Syndrome: Perceptual and Acoustic Measurements. Journal of Autism and
Developmental Disorders, 44, 1972–1981.
peer-reviewed) is the author/funder. All rights reserved. No reuse allowed without permission. The copyright holder for this preprint (which was not. http://dx.doi.org/10.1101/046565doi: bioRxiv preprint first posted online Apr. 3, 2016;

55
Fine, J., Bartolucci, G., Ginsberg, G., & Szatmari, P. (1991). The use of intonation to
communicate in pervasive developmental disorders. Journal of Child Psychology and
Psychiatry, 32(5), 771-782.
Forbes-Riley, K., & Litman, D. J. (2004). Predicting Emotion in Spoken Dialogue
from Multiple Knowledge Sources. Paper presented at the HLT-NAACL.
Fosnot, S. M., & Jun, S. (1999). Prosodic characteristics in children with stuttering or
autism during reading and imitation. Paper presented at the Proceedings of the 14th
international congress of phonetic sciences.
Fusaroli, Riccardo (2016): Is voice a marker of ASD? Dataset and analysis script.
figshare.
Fusaroli, R., Bang, D., & Weed, E. (2013). Non-Linear Analyses of Speech and
Prosody in Asperger's Syndrome. Paper presented at the IMFAR 2013, San Sebastian.
Fusaroli, R., Grossman, R. B., Cantio, C., Bilenberg, N., & Weed, E. (2015). The
temporal structure of the autistic voice: a cross-linguistic examination. . Paper
presented at the IMFAR 2015, Salt Lake City, United States.
Fusaroli, R., Lambrechts, A., Yarrow, K., Maras, K., & Gaigg, S. (2015). Voice
patterns in adult English speakers with Autism Spectrum Disorder. Paper presented at
the IMFAR 2015, Salt Lake City, United States.
Fusaroli, R., Lambrechts, A., Yarrow, K., Maras, K., & Gaigg, S. (2016).
Conversational voice patterns in adult English speakers with ASD. Paper presented at
the IMFAR 2016, Baltimore, United States.
Fusaroli, R., Raczaszek-Leonardi, J., & Tylén, K. (2014). Dialog as interpersonal
synergy. New Ideas in Psychology, 32, 147-157.
Fusaroli, R., & Tylén, K. (2012). Carving Language for Social Coordination: a
dynamic approach Interaction Studies, 13, 103-123.
peer-reviewed) is the author/funder. All rights reserved. No reuse allowed without permission. The copyright holder for this preprint (which was not. http://dx.doi.org/10.1101/046565doi: bioRxiv preprint first posted online Apr. 3, 2016;

56
Fusaroli, R., & Tylén, K. (2016). Investigating conversational dynamics: Interactive
alignment, Interpersonal synergy, and collective task performance. Cognitive Science,
40(1), 145-171.
Goldfarb, W., Braunstein, P., & Lorge, I. (1956). Childhood schizophrenia:
Symposium, 1955: 5. A study of speech patterns in a group of schizophrenic children.
American Journal of Orthopsychiatry, 26(3), 544.
Goldfarb, W., Goldfarb, N., Braunstein, P., & Scholl, H. (1972). Speech and language
faults of schizophrenic children. Journal of autism and childhood schizophrenia, 2(3),
219-233.
Green, H., & Tobin, Y. (2009). Prosodic analysis is difficult… but worth it: A study
in high functioning autism. International Journal of Speech-Language Pathology,
11(4), 308-315.
Grossman, R. B., Bemis, R. H., Skwerer, D. P., & Tager-Flusberg, H. (2010). Lexical
and affective prosody in children with high-functioning autism. Journal of Speech,
Language, and Hearing Research, 53(3), 778-793.
Hastie, T., Tibshirani, R., & Friedman, J. H. (2009). The elements of statistical
learning: Data mining, inference, and prediction. New York: Springer.
Higgins, J. P., Thompson, S. G., Deeks, J. J., & Altman, D. G. (2003). Measuring
inconsistency in meta-analyses. BMJ: British Medical Journal, 327(7414), 557.
Hopkins, Z., Yuill, N., & Keller, B. (2015). Children with autism align syntax in
natural conversation. Applied Psycholinguistics, 1-24.
Hubbard, K., & Trauner, D. A. (2007). Intonation and emotion in autistic spectrum
disorders. Journal of psycholinguistic research, 36(2), 159-173.
peer-reviewed) is the author/funder. All rights reserved. No reuse allowed without permission. The copyright holder for this preprint (which was not. http://dx.doi.org/10.1101/046565doi: bioRxiv preprint first posted online Apr. 3, 2016;

57
Järvinen-Pasley, A., Peppé, S., King-Smith, G., & Heaton, P. (2008). The relationship
between form and function level receptive prosodic abilities in autism. Journal of
Autism and Developmental Disorders, 38(7), 1328-1340.
Jiang, J. J., Zhang, Y., & McGilligan, C. (2006). Chaos in voice, from modeling to
measurement. J Voice, 20(1), 2-17.
Kakihara, Y., Takiguchi, T., Ariki, Y., Nakai, Y., & Takada, S. (2015). Investigation
of Classification Using Pitch Features for Children with Autism Spectrum Disorders
and Typically Developing Children. American Journal of Signal Processing, 5(1), 1-5.
Kaland, C., Krahmer, E., & Swerts, M. (2012). Contrastive intonation in autism: The
effect of speaker-and listener-perspective. Paper presented at the INTERSPEECH.
Kanner, L. (1943). Autistic disturbances of affective contact: publisher not identified.
Kiss, G., van Santen, J. P., Prud'hommeaux, E. T., & Black, L. M. (2012).
Quantitative Analysis of Pitch in Speech of Children with Neurodevelopmental
Disorders. Paper presented at the INTERSPEECH.
Klin, A., Jones, W., Schultz, R., & Volkmar, F. (2003). The enactive mind, or from
actions to cognition: lessons from autism. Philosophical Transactions of the Royal
Society B: Biological Sciences, 358(1430), 345-360.
Klopfenstein, M. (2009). Interaction between prosody and intelligibility. International
Journal of Speech-Language Pathology, 11(4), 326-331.
Lambrechts, A., Yarrow, K., Maras, K., & Gaigg, S. (2014). Impact of the temporal
dynamics of speech and gesture on communication in Autism Spectrum Disorder.
Procedia-Social and Behavioral Sciences, 126, 214-215.
Laver, J., Hiller, S., & Beck, J. M. (1992). Acoustic waveform perturbations and
voice disorders. Journal of Voice, 6(2), 115-126.
peer-reviewed) is the author/funder. All rights reserved. No reuse allowed without permission. The copyright holder for this preprint (which was not. http://dx.doi.org/10.1101/046565doi: bioRxiv preprint first posted online Apr. 3, 2016;

58
Liscombe, J., Venditti, J., & Hirschberg, J. B. (2003). Classifying subject ratings of
emotional speech using acoustic features.
Lord, C. (2008). ADOS: Autism Diagnostic Observation Schedule: Western
Psychological Services.
Lord, C., Rutter, M., & Le Couteur, A. (1994). Autism Diagnostic Interview-Revised:
a revised version of a diagnostic interview for caregivers of individuals with possible
pervasive developmental disorders. Journal of autism and developmental disorders,
24(5), 659-685.
Marchi, E., Schuller, B., Baron-Cohen, S., Golan, O., Bölte, S., Arora, P., & Häb-
Umbach, R. (2015). Typicality and Emotion in the Voice of Children with Autism
Spectrum Condition: Evidence Across Three Languages. Paper presented at the
Sixteenth Annual Conference of the International Speech Communication
Association.
Marwan, N., Carmen Romano, M., Thiel, M., & Kurths, J. (2007). Recurrence plots
for the analysis of complex systems. Physics Reports, 438, 237-329.
Maryn, Y., Roy, N., De Bodt, M., Van Cauwenberge, P., & Corthals, P. (2009).
Acoustic measurement of overall voice quality: A meta-analysis. The Journal of the
Acoustical Society of America, 126(5), 2619-2634.
McCann, J., & Peppé, S. (2003). Prosody in autism spectrum disorders: a critical
review. International Journal of Language & Communication Disorders, 38(4), 325-
350.
Michael, J., Bogart, K., Tylén, K., Krueger, J., Bech, M., Rosendahl Østergaard, J., &
Fusaroli, R. (2015). Compensatory Strategies Enhance Rapport in Interactions
Involving People with Möbius Syndrome. Frontiers in Neurology.
peer-reviewed) is the author/funder. All rights reserved. No reuse allowed without permission. The copyright holder for this preprint (which was not. http://dx.doi.org/10.1101/046565doi: bioRxiv preprint first posted online Apr. 3, 2016;

59
Miro, X. A., Bozonnet, S., Evans, N., Fredouille, C., Friedland, G., & Vinyals, O.
(2012). Speaker diarization: A review of recent research. Audio, Speech, and
Language Processing, IEEE Transactions on, 20(2), 356-370.
Morett, L. M., O’Hearn, K., Luna, B., & Ghuman, A. S. (2015). Altered Gesture and
Speech Production in ASD Detract from In-Person Communicative Quality. Journal
of autism and developmental disorders, 1-15.
Mushin, I., Stirling, L., Fletcher, J., & Wales, R. (2003). Discourse structure,
grounding, and prosody in task-oriented dialogue. Discourse Processes, 35, 1-31.
Nadig, A., & Shaw, H. (2012). Acoustic and perceptual measurement of expressive
prosody in high-functioning autism: increased pitch range and what it means to
listeners. J Autism Dev Disord, 42(4), 499-511.
Nakai, Y., Takashima, R., Takiguchi, T., & Takada, S. (2014). Speech intonation in
children with autism spectrum disorder. Brain and Development, 36(6), 516-522.
Oller, D. K., Niyogi, P., Gray, S., Richards, J. A., Gilkerson, J., Xu, D., . . . Warren,
S. F. (2010). Automated vocal analysis of naturalistic recordings from children with
autism, language delay, and typical development. Proc Natl Acad Sci U S A, 107(30),
13354-13359.
Orlikoff, R. F., & Kahane, J. C. (1991). Influence of mean sound pressure level on
jitter and shimmer measures. Journal of voice, 5(2), 113-119.
Paccia, J. M., & Curcio, F. (1982). Language processing and forms of immediate
echolalia in autistic children. Journal of Speech, Language, and Hearing Research,
25(1), 42-47.
Palmer, C. J., Paton, B., Kirkovski, M., Enticott, P. G., & Hohwy, J. (2015). Context
sensitivity in action decreases along the autism spectrum: a predictive processing
peer-reviewed) is the author/funder. All rights reserved. No reuse allowed without permission. The copyright holder for this preprint (which was not. http://dx.doi.org/10.1101/046565doi: bioRxiv preprint first posted online Apr. 3, 2016;

60
perspective. Proceedings of the Royal Society of London B: Biological Sciences,
282(1802), 20141557.
Parish-Morris, J., Liberman, M., Ryant, N., Cieri, C., Bateman, L., Ferguson, E., &
Schultz, R. T. (2016) Exploring Autism Spectrum Disorders Using HLT, in
Proceedings of 2016 Conference of the North American Chapter of the Association
for Computational Linguistics – Human Language Technologies.
Paul, R., Bianchi, N., Augustyn, A., Klin, A., & Volkmar, F. R. (2008). Production of
syllable stress in speakers with autism spectrum disorders. Research in Autism
Spectrum Disorders, 2(1), 110-124.
Paul, R., Fuerst, Y., Ramsay, G., Chawarska, K., & Klin, A. (2011). Out of the
mouths of babes: Vocal production in infant siblings of children with ASD. Journal of
Child Psychology and Psychiatry, 52(5), 588-598.
Paul, R., Shriberg, L. D., McSweeny, J., Cicchetti, D., Klin, A., & Volkmar, F.
(2005a). Brief report: Relations between prosodic performance and communication
and socialization ratings in high functioning speakers with autism spectrum disorders.
Journal of Autism and Developmental Disorders, 35(6), 861-869.
Paul, R., Shriberg, L. D., McSweeny, J., Cicchetti, D., Klin, A., & Volkmar, F. R.
(2005b). Relations between prosodic performance and communication and
socialization ratings in high functioning speakers with autism spectrum disorders.
Journal of Autism and Developmental Disorders, 35, 861–869.
Pickering, M. J., & Garrod, S. (2004). Toward a mechanistic psychology of dialogue.
Behavioral and Brain Sciences, 27, 169-190.
Pronovost, W., Wakstein, M. P., & Wakstein, D. J. (1966). A longitudinal study of
the speech behavior and language comprehension of fourteen children diagnosed
atypical or autistic. Exceptional children, 33, 19–26.
peer-reviewed) is the author/funder. All rights reserved. No reuse allowed without permission. The copyright holder for this preprint (which was not. http://dx.doi.org/10.1101/046565doi: bioRxiv preprint first posted online Apr. 3, 2016;

61
Quigley, J., McNally, S., & Lawson, S. (2016) Prosodic Patterns in Interaction of
Low-Risk and at-Risk-of-Autism Spectrum Disorders Infants and Their Mothers at 12
and 18 Months, Language Learning and Development, 12:3, 295-310.
Quintana, D. S. (2015). From pre-registration to publication: a non-technical primer
for conducting a meta-analysis to synthesize correlational data. Frontiers in
Psychology, 6.
Riley, M. A., Bonnette, S., Kuznetsov, N., Wallot, S., & Gao, J. (2012). A tutorial
introduction to adaptive fractal analysis. Frontiers in physiology, 3.
Rodriguez, J. D., Perez, A., & Lozano, J. A. (2010). Sensitivity analysis of k-fold
cross validation in prediction error estimation. Pattern Analysis and Machine
Intelligence, IEEE Transactions on, 32(3), 569-575.
Rogers, S. J., Hayden, D., Hepburn, S., Charlifue-Smith, R., Hall, T., & Hayes, A.
(2006). Teaching young nonverbal children with autism useful speech: A pilot study
of the Denver model and PROMPT interventions. Journal of Autism and
Developmental Disorders, 36(8), 1007-1024.
Ruggeri, B., Sarkans, U., Schumann, G., & Persico, A. M. (2014). Biomarkers in
autism spectrum disorder: the old and the new. Psychopharmacology, 231(6), 1201-
1216.
Santos, J. F., Brosh, N., Falk, T. H., Zwaigenbaum, L., Bryson, S. E., Roberts, G., . . .
Brian, J. (2013). Very early detection of Autism Spectrum Disorders based on
acoustic analysis of pre-verbal vocalizations of 18-month old toddlers. Paper
presented at the Acoustics, Speech and Signal Processing (ICASSP), 2013 IEEE
International Conference on.
peer-reviewed) is the author/funder. All rights reserved. No reuse allowed without permission. The copyright holder for this preprint (which was not. http://dx.doi.org/10.1101/046565doi: bioRxiv preprint first posted online Apr. 3, 2016;

62
Scharfstein, L. A., Beidel, D. C., Sims, V. K., & Finnell, L. R. (2011). Social skills
deficits and vocal characteristics of children with social phobia or Asperger’s
disorder: a comparative study. Journal of abnormal child psychology, 39(6), 865-875.
Sharda, M., Subhadra, T. P., Sahay, S., Nagaraja, C., Singh, L., Mishra, R., . . . Singh,
N. C. (2010). Sounds of melody--pitch patterns of speech in autism. Neuroscience
letters, 478(1), 42-45.
Sheinkopf, S. J., Mundy, P., Oller, D. K., & Steffens, M. (2000). Vocal atypicalities
of preverbal autistic children. Journal of autism and developmental disorders, 30(4),
345-354.
Shriberg, L. D., Paul, R., Black, L. M., & van Santen, J. P. (2011). The hypothesis of
apraxia of speech in children with autism spectrum disorder. Journal of autism and
developmental disorders, 41(4), 405-426.
Shriberg, L. D., Paul, R., McSweeny, J. L., Klin, A., Cohen, D. J., & Volkmar, F. R.
(2001). Speech and prosody characteristics of adolescents and adults with high-
functioning autism and Asperger syndrome. Journal of Speech, Language, and
Hearing Research, 44(5), 1097-1115.
Simmons, J. Q., & Baltaxe, C. (1975). Language patterns of adolescent autistics.
Journal of autism and childhood schizophrenia, 5(4), 333-351.
Slocombe, K. E., Alvarez, I., Branigan, H. P., Jellema, T., Burnett, H. G., Fischer, A.,
. . . Levita, L. (2013). Linguistic alignment in adults with and without Asperger’s
syndrome. Journal of autism and developmental disorders, 43(6), 1423-1436.
Thurber, C., & Tager-Flusberg, H. (1993). Pauses in the narratives produced by
autistic, mentally retarded, and normal children as an index of cognitive demand.
Journal of Autism and Developmental disorders, 23(2), 309-322.
peer-reviewed) is the author/funder. All rights reserved. No reuse allowed without permission. The copyright holder for this preprint (which was not. http://dx.doi.org/10.1101/046565doi: bioRxiv preprint first posted online Apr. 3, 2016;
63
Titze, I. R. (1994). Principles of voice production. Englewood Cliffs, N.J.: Prentice
Hall.
Travis, L. L., & Sigman, M. (1998). Social deficits and interpersonal relationships in
autism. Mental Retardation and Developmental Disabilities Research Reviews, 4(2),
65-72.
Tsanas, A., Little, M. A., McSharry, P. E., & Ramig, L. O. (2011). Nonlinear speech
analysis algorithms mapped to a standard metric achieve clinically useful
quantification of average Parkinson's disease symptom severity. J R Soc Interface,
8(59), 842-855.
Van Bourgondien, M. E., & Woods, A. V. (1992). Vocational possibilities for high-
functioning adults with autism High-functioning individuals with autism: Springer.
Van de Cruys, S., Evers, K., Van der Hallen, R., Van Eylen, L., Boets, B., de-Wit, L.,
& Wagemans, J. (2014). Precise minds in uncertain worlds: Predictive coding in
autism. Psychological review, 121(4), 649.
Viechtbauer, W. (2010). Conducting meta-analyses in R with the metafor package.
Journal of Statistical Software, 36(3), 1-48.
Vosoughi, S., Goodwin, M. S., Washabaugh, B., & Roy, D. (2012). A portable
audio/video recorder for longitudinal study of child development. Paper presented at
the Proceedings of the 14th ACM international conference on Multimodal interaction.
Anguera, X., Luque, J., & Gracia, C. (2014). Audio-to-text alignment for speech
recognition with very limited resources. In INTERSPEECH (pp. 1405-1409).
Wallace, M., Cleary, J., Buder, E., Oller, D., Sheinkopf, S., Mundy, P., & al., e.
(2008). An acoustic inspection of vocalizations in young children with ASD. Paper
presented at the International Meeting for Autism Research, London.
peer-reviewed) is the author/funder. All rights reserved. No reuse allowed without permission. The copyright holder for this preprint (which was not. http://dx.doi.org/10.1101/046565doi: bioRxiv preprint first posted online Apr. 3, 2016;

64
Warlaumont, A. S., Richards, J. A., Gilkerson, J., & Oller, D. K. (2014). A Social
Feedback Loop for Speech Development and Its Reduction in Autism. Psychological
science, 0956797614531023.
Weed, E., & Fusaroli, R. (submitted). Voice Patterns in Right Hemisphere Damage.
Yarkoni, T. & Westfall, J. (2016) Choosing prediction over explanation in
psychology: Lessons from machine learning. FigShare,
https://dx.doi.org/10.6084/m9.figshare.2441878.v1
peer-reviewed) is the author/funder. All rights reserved. No reuse allowed without permission. The copyright holder for this preprint (which was not. http://dx.doi.org/10.1101/046565doi: bioRxiv preprint first posted online Apr. 3, 2016;