is water shedding next? james blignaut and jan van heerden department of economics, university of...
TRANSCRIPT

IS WATER SHEDDING NEXT?
James Blignaut and Jan van Heerden
Department of Economics, University of Pretoria

STRUCTURE
1 Pictorial introduction
2 The SA water context
3 ASGISA and water
4 Conclusion

1 PICTORIAL INTRODUCTION

Photos: Prof RJ v Aarde
WATER –
• Increasingly the limiting factor to development;
• Increasingly the factor of divide;
• Manage water and you will manage the economy, failing that implies
failing the economy

2 THE SA WATER CONTEXT
The challenge
The availability of water of acceptable quality is
predicted to be the single greatest and most urgent
development constraint facing South Africa. Virtually
all the surface waters are already committed for use,
and water is imported from neighbouring countries.
Groundwater resources are quite limited; maintaining
their quality and using them sustainably is a key issue.
(Scholes 2001)
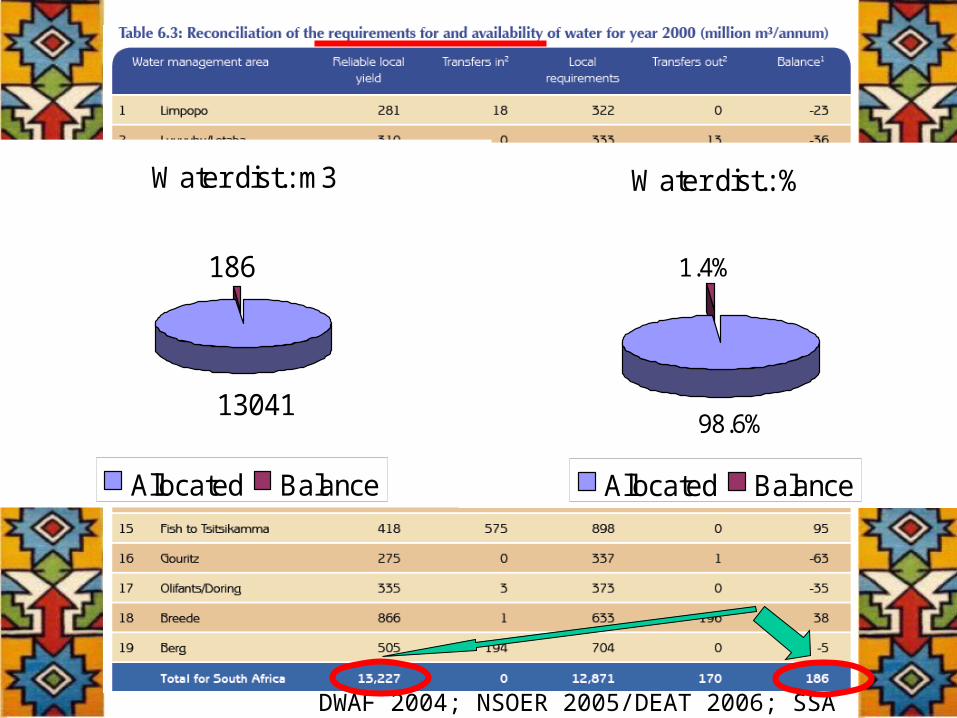
DWAF 2004; NSOER 2005/DEAT 2006; SSA 2006
Water dist.: m3
13041
186
Allocated Balance
Water dist.: %
98.6%
1.4%
Allocated Balance

Farley and Gaddis, in Aronson, Milton and Blignaut 2007
Interaction between the supply & demand for natural capital:
The value of the last remaining 1.4% of water is very high (both level and unitary change matter)
Critical natural capital Perfectly inelastic demand
Vulnerable natural capital Inelastic demand
Relatively abundant natural capital Elastic demand
Natural capital stock
Q 1 Q 2
Mar
gina
l exc
hang
e va
lue
Demand for Nat. Cap.

DWAF 2004; NSOER 2005/DEAT 2006; SSA 2006
-1.7%!
Water shedding??
3 ASGISA AND WATER

ASGISA’s perspective to SA’s economic development: Stimulate these 12 sectors:
1. A national biofuels initiative;2. The Makhathini Cassava & Sugar Project KZN;3. A national livestock project in NC and NW;4. Afforestation in EC;5. Mining expansion in Limpopo;6. A water reticulation project in Limpopo;7. The Square Kilometre Array in NC;8. The Cape Flats Infrastructure Project in the WC;9. A diamond & gemstone jewellery project in NC;10. A Moloto Corridor Rail Project, mostly in Mpmlga;11. Gauteng-Durban Corridor; and12. The Jo’burg Intern. Airport Logistics Hub and IDZ.

More and more, the complementary factor in short
supply (limiting factor) is remaining natural
capital, not manmade capital as it used to be. For
example, populations of fish, not fishing boats, limit
fish catch worldwide. Economic logic says to
invest in the limiting factor.
That logic has not changed, but the identity of the
limiting factor has.
(Herman Daly)
. . . another perspective . . .

Quantifying the impact of stimulating some water-intensive sectors
UP’s SAM-based integrated economy/ environment CGE model using GEMPACK
Papers based on this model published in:The Energy Journal
Ecological Economics
Water Resources Research
South African Journal of Economics
South African Journal of Economic and Management Sciences

Quantifying the impact of stimulating some water-intensive sectors
Measuring the impact on GDP, employment, water use and CO2
Scenarios:
• Hypothetical R1billion injection in 6 water-intensive sectors
•1c/m3 increase in water tariff
• Balance budget: 1c/m3 increase in water tariff, but revenue recycled to 6 water intensive sectors

Model results:
% change in
GDP
Unskilled Water use CO2-emssionslabour
Scenario 1: R1bn injection in - Dryfield agriculture 0.03 0.11 0.02 0.03- Irrigation horticulture 0.05 0.18 0.72 0.02- Livestock 0.09 0.22 0.10 0.07- Timber 0.08 0.25 0.67 0.04- Other mining 0.04 0.10 0.02 0.09- Water sector 0.07 0.16 0.64 0.10Total 0.36 1.02 2.17 0.35Scenario 2: Water tariff inc. 1c/m3 (no recycl.) -0.01 -0.03 -2.78 -0.01Scenario 3: Water tariff inc 1c/m3 & recycl.
- Dryfield agriculture 0.00 -0.01 -2.78 -0.01
- Irrigation horticulture 0.00 0.00 -2.65 -0.01
- Livestock 0.01 0.01 -2.77 0.00
- Timber 0.01 0.02 -2.68 0.00
- Other mining 0.00 -0.01 -2.77 0.01
- Water sector 0.00 0.00 -2.68 0.01
Total (Ave.)0.01 0.01 -2.74 0.00
Water use impact worsen in the wake of:
• presence and spread of invasive alien plant species, and
• global climate change
Unallocated water = 1.4% of supply
4 CONCLUSION

• SA needs economic development
• Increasingly, however, natural capital is the limiting factor to development
• Selection of non-water intensive projects key to development; OR get water from other sources
• Cannot ignore the limiting factor when considering macro-economic policies and development planning
• ASGISA could be utilised to act as catalyst for development when investing in integrated packages, otherwise water shedding might be next (and soon)
• Water shedding will behave different from load shedding with a delayed feedback loop, which could
lead to ill-founded complacency while action is needed